the dependence of precipitation types on surface elevation...
TRANSCRIPT

Journal of Hydrology 513 (2014) 154–163
Contents lists available at ScienceDirect
Journal of Hydrology
journal homepage: www.elsevier .com/locate / jhydrol
The dependence of precipitation types on surface elevation andmeteorological conditions and its parameterization
http://dx.doi.org/10.1016/j.jhydrol.2014.03.0380022-1694/� 2014 Elsevier B.V. All rights reserved.
⇑ Corresponding author at: Institute of Tibetan Plateau Research, ChineseAcademy of Sciences, Bldg. 3, Courtyard 16, Lincui Rd., Chaoyang District, Beijing100101, China. Tel.: +86 10 84097094; fax: +86 10 84097079.
E-mail address: [email protected] (B. Ding).
Baohong Ding a,b,⇑, Kun Yang a, Jun Qin a, Lei Wang a, Yingying Chen a, Xiaobo He c
a Key Laboratory of Tibetan Environment Changes and Land Surface Processes, Institute of Tibetan Plateau Research, Chinese Academy of Sciences, Beijing 100101, Chinab University of Chinese Academy of Sciences, Beijing 100049, Chinac State Key Laboratory of Cryospheric Sciences, Cold and Arid Regions Environmental and Engineering Research Institute, Chinese Academy of Sciences, Lanzhou 730000, China
a r t i c l e i n f o
Article history:Received 22 October 2013Received in revised form 12 March 2014Accepted 15 March 2014Available online 29 March 2014This manuscript was handled byKonstantine P. Georgakakos, Editor-in-Chief
Keywords:Precipitation typeWet-bulb temperatureElevationRelative humidityThreshold temperature
s u m m a r y
Precipitation types (rain, snow, and sleet) have great impacts on the surface runoff and energy balance.However, many weather stations only record precipitation amount without discriminating its type. Basedon CMA (China Meteorological Administration) station data over 30 years, this study investigates therelationship of precipitation types with surface elevation and meteorological variables. Major findingsare (1) wet-bulb temperature is a better indicator than air temperature for discriminating precipitationtypes; (2) precipitation types are highly dependent on surface elevation, and a higher threshold temper-ature is needed for differentiating snow and rain over a higher-elevation region; and (3) precipitationtypes are also dependent on relative humidity, and the probability of sleet event rises greatly with theincrease of relative humidity. Based on these findings, a new parameterization scheme is developed todetermine the precipitation type, with input of daily mean wet-bulb temperature, relative humidity,and surface elevation. Evaluations for China territory show that the new scheme gives better accuracythan 11 other schemes that are used in hydrological and land surface models.
� 2014 Elsevier B.V. All rights reserved.
1. Introduction
Precipitation is one of the most important components in waterand energy cycle, and the precipitation types (rain, snow, and sleet)have great impacts on the land surface mass and energy balance(Loth et al., 1993). Snowfall can accumulate at the land surfacewhile rainfall usually infiltrates into soils and converges into riversor groundwater (Clark et al., 2006). The surface albedo increasesgreatly when snowfall occurs, which can substantially alter thesurface energy budget, whereas the effect is opposite when rainfalloccurs (Box et al., 2012). Besides, precipitation type is needed forthe correction of precipitation gauge data, as the catch ratio ofprecipitation gauges depends on precipitation type (Yang et al.,1988, 1995; Rasmussen et al., 2012). Therefore, the differentiationof precipitation types is important for land hydrological processstudies (Anderson and Mackintosh, 2012).
However, precipitation types are often not observed or notaccessible. For example, the data of precipitation amount at morethan 700 CMA (China Meteorological Administration) weather
stations since 1950s can be obtained via the CMA National Meteo-rological Information Center (NMIC), but the data of precipitationtypes is not available for the years after 1979 (Han et al., 2010).So the discrimination of the precipitation types for the recent threedecades mainly relies on empirical or semi-empirical relationshipsderived from other observations. Generally, the discriminationschemes are categorized into two classes according to the usedvariables.
One class is based on the temperature profile and other atmo-spheric conditions (e.g. Bocchieri, 1980; Ryzhkov and Zrnic,1998; Rauber et al., 2001; Lundquist et al., 2008). Czys et al.(1996) presented a non-dimensional parameter (i.e. the ratio ofthe available time for melting to the required time for completemelting) to differentiate between freezing rain and ice pellets byusing air temperature profile. Bourgouin (2000) used the area be-tween the air temperature profile and the 0 �C isotherm on aero-logical diagrams to diagnose precipitation types. Schuur et al.(2012) employed the vertical profile of wet-bulb temperaturederived from the rapid update cycle model (Benjamin et al.,2000) and polarimetric radar retrievals to classify the precipitationtypes. A challenging issue that hinders the applications of theabove schemes is that air temperature profile is generally notavailable at weather stations.

B. Ding et al. / Journal of Hydrology 513 (2014) 154–163 155
The other class of empirical schemes mainly employs surface airconditions. Their inputs are accessible and thus they are widelyused for hydrological and land surface modeling. Among them, sur-face air temperature-based methods are most widely used for theidentification of precipitation types (e.g. Auer, 1974; Kang et al.,1999; Gustafsson et al., 2001), including single threshold methods(Yang et al., 1997; Clark et al., 2006) and dual-threshold methods(Kang, 1994; Wigmosta et al., 1994; Chen et al., 2008). A singlethreshold method differentiates rain and snow with only one crit-ical temperature. A dual-threshold method uses two critical tem-peratures to differentiate rain, snow, and sleet: rain occurs whenair temperature is higher than an upper critical temperature; snowoccurs when air temperature is lower than a lower critical temper-ature; sleet (as a mixture of rain and snow) occurs when air tem-perature is between the two critical temperatures. In addition,some schemes are developed to calculate the ratio of snow (or rain)amount to total precipitation amount (Zhang et al., 2013), insteadof determining the precipitation type. Yamazaki (2001) used ascheme with the wet-bulb temperature as an indicator to calculatethe ratio of snow amount to total precipitation amount for model-ing land surface processes in Eastern Siberia. Dai (2008) proposed amethod to calculate the frequencies of rain, sleet, and snow fromtheir relationships with both surface air temperature and pressureover land and ocean. Table 1 shows the critical temperatures ofnine schemes in the literature and the calculations of snow ratioof the above two schemes; clearly, the critical temperature valuesare not unique in different regions, and all these schemes need val-idations for different climate regimes. Particularly, we have littleknowledge on how elevations impact the precipitation types.
This study aims at developing a new scheme to discriminateprecipitation types, based on more than 400,000 samples of precip-itation types collected from different climate regimes and eleva-tions in China. The remaining parts of this paper are organized asfollows. Section 2 introduces the dataset and the data quality con-trol procedures. Section 3 presents the dependence of precipitationtypes on surface wet-bulb temperature, relative humidity, and ele-vation. Based on their relationships, a new parameterizationscheme is developed in Section 4 and its evaluation is presented
Table 1Nine schemes of discriminating precipitation-type and two schemes of calculating snow r
Scheme Thresholds of Ta orsnow ratio
Model
Y97 (Yang et al., 1997) 2.2 �C BATS model
L93 (Loth et al., 1993) �1 �C, 4 �C Snow cover model
W94 (Wigmosta et al., 1994) �1.1 �C, 3.3 �C DHSVM model
K94 (Kang, 1994) 2.8 �C, 5.5 �C Energy, water, mass bahydrological discharge
L97 (Lindström et al., 1997) �1 �C, 1 �C HBV modelC04 (Collins et al., 2004) �5 �C, 0 �C NCAR CAM3.0HH05 (Hock and Holmgren, 2005) 0.5 �C, 2.5 �C Mass balance model
G10 (Gao et al., 2010) �0.5 �C, 2 �C Degree-day mass balan
W11 (Wang et al., 2011) 0 �C, 2 �C Degree-day mass balan
Y01 (Yamazaki, 2001) Snow ratiodependent on Tw
One dimensional landmodel
D08 (Dai, 2008) Snow ratiodependent on Ta
and ps
in Section 5 by comparisons with 11 schemes in the literature.The results are summarized in Section 6.
2. Data
The dataset used in this study is the Version 3.0 of ‘‘Daily Sur-face Climate Variables of China’’, which is provided by CMA NMIC.This dataset covers the period from 1951 to 1979, with precipita-tion type information available at daily scale. Therefore, dailyweather data are used in this study, including daily mean air tem-perature (Ta), daily mean relative humidity (RH), daily mean sur-face pressure (ps), daily total precipitation (Pr), and precipitationtype of 824 stations. Elevation (Z) is also used so as to understandits role in the formation of precipitation.
Generally, the precipitation type is recorded as one of threetypes (rain, sleet, and snow). Although the data quality has beenpreliminary controlled by the data provider, some stations re-corded all precipitation events as rain throughout all years or someyears, without discriminating precipitation types. In addition, erro-neous or suspected classifications occur occasionally, since the pre-cipitation type is based on manual judgment and recording.Therefore, the following data quality control procedures areadopted to remove erroneous and suspicious data.
(1) Select qualified data according to the original quality controlflag in the dataset. Herein, data are selected if the qualitycontrol flags of Ta, RH, ps, and Pr are simultaneously markedas correct.
(2) Search for erroneous and suspicious data records. A datarecord is regarded as abnormal if rain occurs when Ta < 0 �C,snow occurs when Ta > 8 �C, or sleet occurs when Ta < �1.6 �Cor Ta > 9.6 �C, according to statistical results of the precipita-tion types; otherwise, the data record is regarded as a normalone. Then, we counted for each year of each station (i) thenumbers of all samples of rain, snow, and sleet, recorded asNrain, Nsnow, and Nsleet, respectively; and (ii) the numbers ofall abnormal samples of rain, snow, and sleet, recorded asNrain,wrong, Nsnow,wrong, and Nsleet,wrong, respectively.
atio to total precipitation in the literature.
Region and period being applied
Yershov, Uralsk, Ogurtsovo, Kostroma, Khabarovsk and Tulun(48�N–57�N, 41�E–135�E), 1978–1983German meteorological station Potsdam (52�230 , 13�040), 1975–1980Middle Fork Flathead River basin in northwestern Montana(114�000W, 48�290N, 900 m–3000 m), Oct 1988–Oct 1991
lance andmodel
Tianshan Mountain, China (43�060N, 86�500E, 3539 m–4010 m),1986–1990Ten basins in Sweden, 1969–1989
Storglaciären, Sweden (67�550N, 18�350E, 1120 m–1730 m), 1993–1994
ce model Tarim River Basin, China (35�N–43�N, 73�E–93�E, 2780 m–4800 m), 1961–2006
ce model Qiyi Glacier in Qilian Mountains, China (39.5�N, 97.5�E, 4304 m–5158.8 m), Jun 30–Sep 5, 2010
surface Lena River basin in Eastern Siberia, 1986–1994
15,000 land stations global and many ships, 1977–2007
156 B. Ding et al. / Journal of Hydrology 513 (2014) 154–163
(3) Search for abnormal years of each station. For each station, ayear is regarded as abnormal if any of the following three
conditions happens: (i) Nrain;wrong
NrainP 10%, (ii) Nsnow;wrong
NsnowP 30%,
or (iii) Nsleet;wrong
NsleetP 30%. Then, we counted for each station (i)
the number of years in which at least one precipitation typeoccurs, recorded as Yrain, Ysnow, and Ysleet, respectively; and(ii) the number of abnormal years for each type, recordedas Yrain,wrong, Ysnow,wrong, and Ysleet,wrong.
(4) Search for abnormal stations. A station is regarded as abnor-mal if any of the following four conditions happens: (i)Yrain;wrong
YrainP 50%, (ii) Ysnow;wrong
YsnowP 50%, (iii) Ysleet;wrong
YsleetP 50%, or
(iv) Ysnow + Ysleet = 0.(5) Remove abnormal data found in Step (2–4). Firstly, remove all
data from abnormal stations. Secondly, remove all data fromabnormal years for each station. Thirdly, remove all abnormaldata records that still remain after the preceding steps.
After all the above quality control steps, the data records with�10 �C < Ta < 10 �C are selected, because this temperature rangeis concerned in terms of precipitation type discrimination.
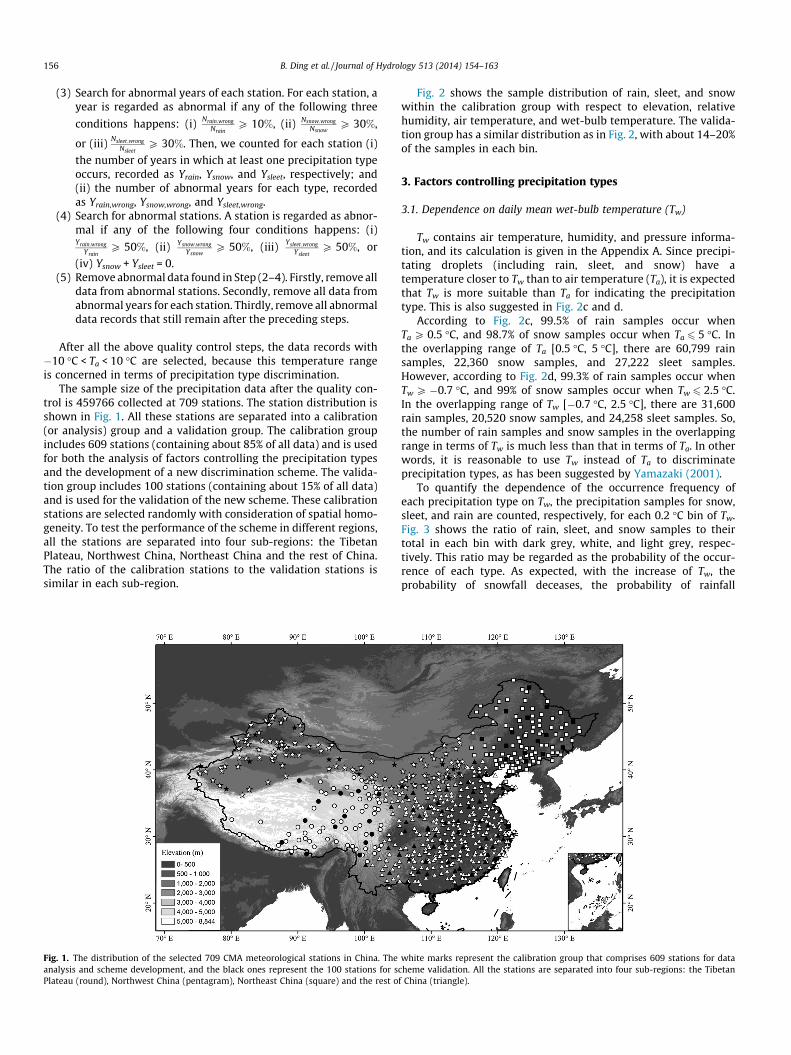
The sample size of the precipitation data after the quality con-trol is 459766 collected at 709 stations. The station distribution isshown in Fig. 1. All these stations are separated into a calibration(or analysis) group and a validation group. The calibration groupincludes 609 stations (containing about 85% of all data) and is usedfor both the analysis of factors controlling the precipitation typesand the development of a new discrimination scheme. The valida-tion group includes 100 stations (containing about 15% of all data)and is used for the validation of the new scheme. These calibrationstations are selected randomly with consideration of spatial homo-geneity. To test the performance of the scheme in different regions,all the stations are separated into four sub-regions: the TibetanPlateau, Northwest China, Northeast China and the rest of China.The ratio of the calibration stations to the validation stations issimilar in each sub-region.
Fig. 1. The distribution of the selected 709 CMA meteorological stations in China. Theanalysis and scheme development, and the black ones represent the 100 stations for sPlateau (round), Northwest China (pentagram), Northeast China (square) and the rest o
Fig. 2 shows the sample distribution of rain, sleet, and snowwithin the calibration group with respect to elevation, relativehumidity, air temperature, and wet-bulb temperature. The valida-tion group has a similar distribution as in Fig. 2, with about 14–20%of the samples in each bin.
3. Factors controlling precipitation types
3.1. Dependence on daily mean wet-bulb temperature (Tw)
Tw contains air temperature, humidity, and pressure informa-tion, and its calculation is given in the Appendix A. Since precipi-tating droplets (including rain, sleet, and snow) have atemperature closer to Tw than to air temperature (Ta), it is expectedthat Tw is more suitable than Ta for indicating the precipitationtype. This is also suggested in Fig. 2c and d.
According to Fig. 2c, 99.5% of rain samples occur whenTa P 0.5 �C, and 98.7% of snow samples occur when Ta 6 5 �C. Inthe overlapping range of Ta [0.5 �C, 5 �C], there are 60,799 rainsamples, 22,360 snow samples, and 27,222 sleet samples.However, according to Fig. 2d, 99.3% of rain samples occur whenTw P �0.7 �C, and 99% of snow samples occur when Tw 6 2.5 �C.In the overlapping range of Tw [�0.7 �C, 2.5 �C], there are 31,600rain samples, 20,520 snow samples, and 24,258 sleet samples. So,the number of rain samples and snow samples in the overlappingrange in terms of Tw is much less than that in terms of Ta. In otherwords, it is reasonable to use Tw instead of Ta to discriminateprecipitation types, as has been suggested by Yamazaki (2001).
To quantify the dependence of the occurrence frequency ofeach precipitation type on Tw, the precipitation samples for snow,sleet, and rain are counted, respectively, for each 0.2 �C bin of Tw.Fig. 3 shows the ratio of rain, sleet, and snow samples to theirtotal in each bin with dark grey, white, and light grey, respec-tively. This ratio may be regarded as the probability of the occur-rence of each type. As expected, with the increase of Tw, theprobability of snowfall deceases, the probability of rainfall
white marks represent the calibration group that comprises 609 stations for datacheme validation. All the stations are separated into four sub-regions: the Tibetanf China (triangle).

Fig. 2. Sample size distribution of rain, sleet, and snow with respect to (a) elevation, (b) daily mean relative humidity, (c) daily mean air temperature, and (d) daily mean wet-bulb temperature according to the calibration data.
Fig. 3. The individual ratios of rain, sleet, and snow samples to their total withrespect to daily mean wet-bulb temperature (Tw) according to the calibration data.The dark grey, white, and light grey represent rain, sleet, and snow, respectively.
B. Ding et al. / Journal of Hydrology 513 (2014) 154–163 157
increases, and the probability of sleet occurrence first increasesand then decreases.
3.2. Dependence on elevation and relative humidity (RH)
To explore the impact of other parameters on precipitationtypes, the ANN (Artificial Neural Network) is used to analyze thedependence of the precipitation types on several meteorologicaland geographic parameters (wind speed, specific humidity, RH,air pressure, station elevation, and latitude), and it is found that
elevation and RH play much more important roles in determiningthe precipitation types.
To investigate the relationship between elevation and precipita-tion types, the total elevation range is divided into 6 sub-ranges(0–500, 500–1000, 1000–2000, 2000–3000, 3000–4000, and4000–5000 m). The sample size of each type (rain, sleet, and snow)in each sub-range is shown in Fig. 2a, and the ratio of each type tothe total (within each 0.5 �C bin of Tw) in each elevation sub-rangeis shown in Fig. 4a–f. It is clearly seen that, along with the increaseof elevation, both the bound between snow ratio and sleet ratioand the bound between sleet ratio and rain ratio move towardhigher temperature. As a result, a higher temperature thresholdis needed for discriminating snow and rain over a higher elevation.
Similarly, the total RH range is divided into 5 sub-ranges(0–60%, 60–70%, 70–80%, 80–90%, and 90–100%), and Fig. 4g–kshows the ratio of each precipitation type to total (within each0.5 �C bin of Tw) in each RH sub-range. A striking result is thatthe probability of sleet occurrence significantly increases withthe increase of RH.
The dependence of precipitation types on elevation and RH canbe explained through the energy exchange between precipitationdroplets and the ambient air during the falling process. Precipita-tion droplets generally fall down in a near-surface heating environ-ment, so the precipitation type relies on how many snow dropletscan melt away before landing.
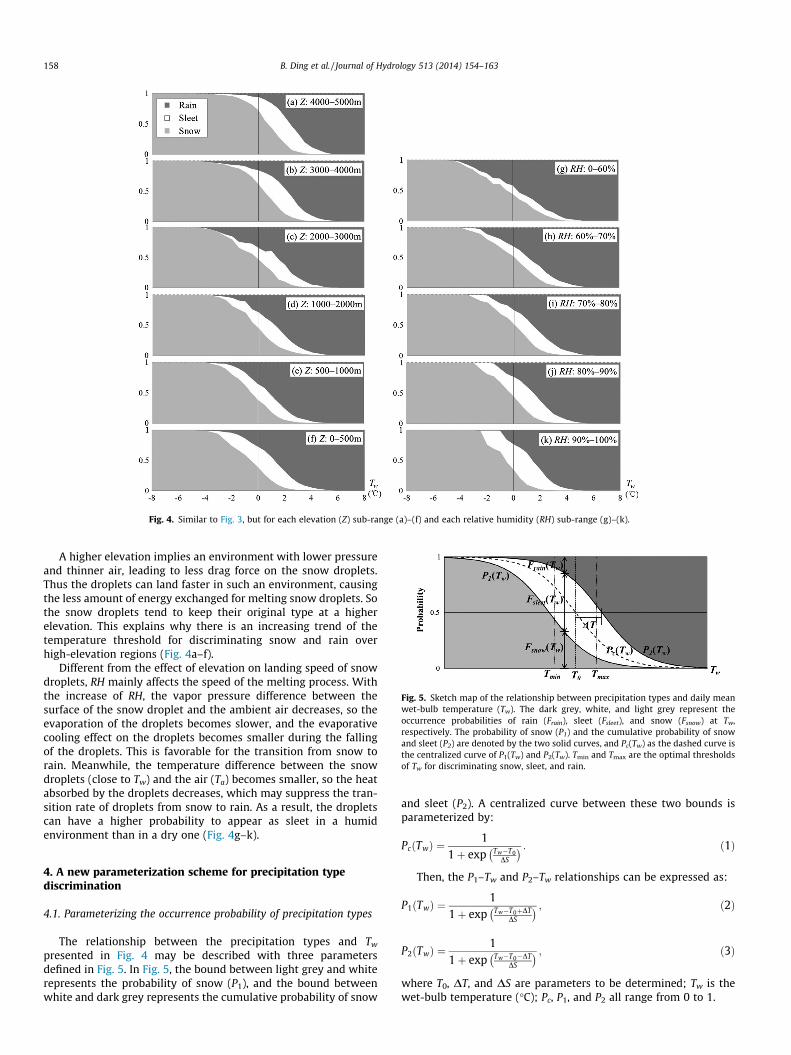
Fig. 4. Similar to Fig. 3, but for each elevation (Z) sub-range (a)–(f) and each relative humidity (RH) sub-range (g)–(k).
Fig. 5. Sketch map of the relationship between precipitation types and daily meanwet-bulb temperature (Tw). The dark grey, white, and light grey represent theoccurrence probabilities of rain (Frain), sleet (Fsleet), and snow (Fsnow) at Tw,respectively. The probability of snow (P1) and the cumulative probability of snowand sleet (P2) are denoted by the two solid curves, and Pc(Tw) as the dashed curve isthe centralized curve of P1(Tw) and P2(Tw). Tmin and Tmax are the optimal thresholdsof Tw for discriminating snow, sleet, and rain.
158 B. Ding et al. / Journal of Hydrology 513 (2014) 154–163
A higher elevation implies an environment with lower pressureand thinner air, leading to less drag force on the snow droplets.Thus the droplets can land faster in such an environment, causingthe less amount of energy exchanged for melting snow droplets. Sothe snow droplets tend to keep their original type at a higherelevation. This explains why there is an increasing trend of thetemperature threshold for discriminating snow and rain overhigh-elevation regions (Fig. 4a–f).
Different from the effect of elevation on landing speed of snowdroplets, RH mainly affects the speed of the melting process. Withthe increase of RH, the vapor pressure difference between thesurface of the snow droplet and the ambient air decreases, so theevaporation of the droplets becomes slower, and the evaporativecooling effect on the droplets becomes smaller during the fallingof the droplets. This is favorable for the transition from snow torain. Meanwhile, the temperature difference between the snowdroplets (close to Tw) and the air (Ta) becomes smaller, so the heatabsorbed by the droplets decreases, which may suppress the tran-sition rate of droplets from snow to rain. As a result, the dropletscan have a higher probability to appear as sleet in a humidenvironment than in a dry one (Fig. 4g–k).
4. A new parameterization scheme for precipitation typediscrimination
4.1. Parameterizing the occurrence probability of precipitation types
The relationship between the precipitation types and Tw
presented in Fig. 4 may be described with three parametersdefined in Fig. 5. In Fig. 5, the bound between light grey and whiterepresents the probability of snow (P1), and the bound betweenwhite and dark grey represents the cumulative probability of snow
and sleet (P2). A centralized curve between these two bounds isparameterized by:
PcðTwÞ ¼1
1þ exp Tw�T0DS
� � : ð1Þ
Then, the P1–Tw and P2–Tw relationships can be expressed as:
P1ðTwÞ ¼1
1þ exp Tw�T0þDTDS
� � ; ð2Þ
P2ðTwÞ ¼1
1þ exp Tw�T0�DTDS
� � ; ð3Þ
where T0, DT, and DS are parameters to be determined; Tw is thewet-bulb temperature (�C); Pc, P1, and P2 all range from 0 to 1.
B. Ding et al. / Journal of Hydrology 513 (2014) 154–163 159
Once P1(Tw) and P2(Tw) are determined, the occurrence proba-bilities of snow (Fsnow), sleet (Fsleet), and rain (Frain) at Tw can be cal-culated as:
FsnowðTwÞ ¼ P1ðTwÞ; ð4Þ
FsleetðTwÞ ¼ P2ðTwÞ � P1ðTwÞ; ð5Þ
FrainðTwÞ ¼ 1� P2ðTwÞ: ð6Þ
In Eqs. (1)–(3), T0 is the temperature at which Pc(Tw) is equal to0.5; it approximately represents the center of Tw range in whichsnow/rain transition happens. DT is the temperature difference be-tween Pc and P1 (or P2 and Pc) that gives Pc = P1 = P2 = 0.5, and 2DTshows the temperature range in which sleet mainly occurs. DS rep-resents a temperature scale. With the increase of DS, the tempera-ture range for snow/rain transition widens. The parameterizationsof T0, DT, and DS are estimated from the relationship of precipitationtypes with elevation and RH based on the analysis in Section 3.2.
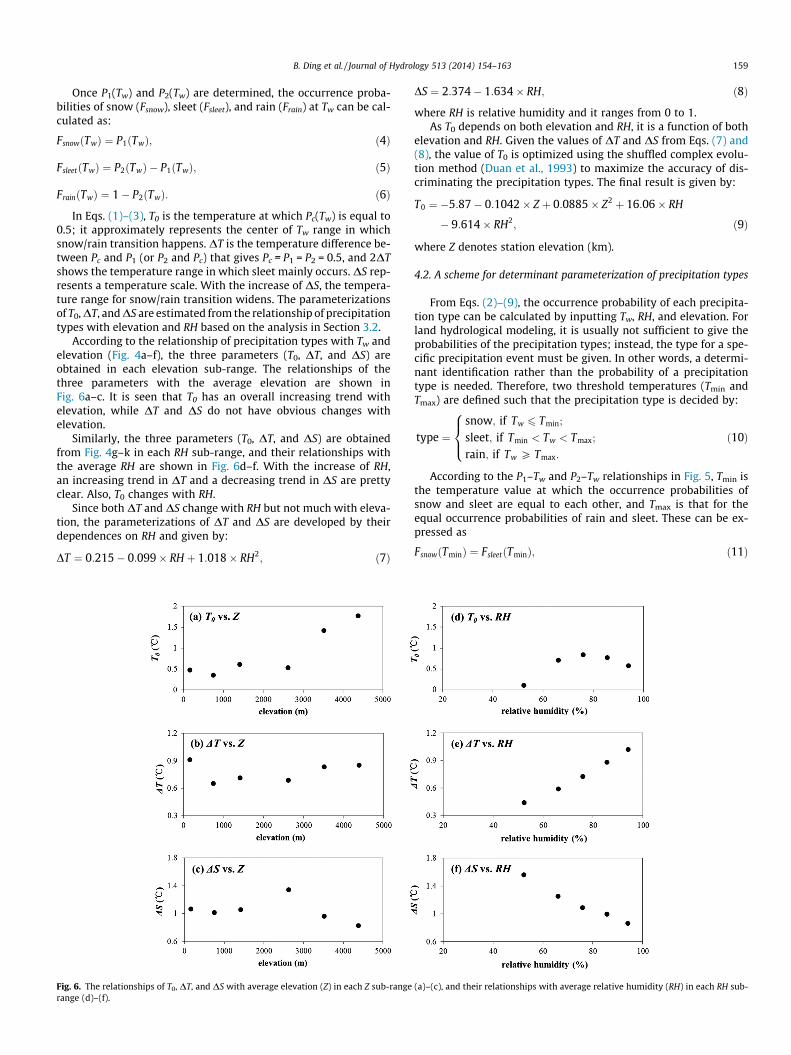
According to the relationship of precipitation types with Tw andelevation (Fig. 4a–f), the three parameters (T0, DT, and DS) areobtained in each elevation sub-range. The relationships of thethree parameters with the average elevation are shown inFig. 6a–c. It is seen that T0 has an overall increasing trend withelevation, while DT and DS do not have obvious changes withelevation.
Similarly, the three parameters (T0, DT, and DS) are obtainedfrom Fig. 4g–k in each RH sub-range, and their relationships withthe average RH are shown in Fig. 6d–f. With the increase of RH,an increasing trend in DT and a decreasing trend in DS are prettyclear. Also, T0 changes with RH.
Since both DT and DS change with RH but not much with eleva-tion, the parameterizations of DT and DS are developed by theirdependences on RH and given by:
DT ¼ 0:215� 0:099� RH þ 1:018� RH2; ð7Þ
Fig. 6. The relationships of T0, DT, and DS with average elevation (Z) in each Z sub-rangerange (d)–(f).
DS ¼ 2:374� 1:634� RH; ð8Þ
where RH is relative humidity and it ranges from 0 to 1.As T0 depends on both elevation and RH, it is a function of both
elevation and RH. Given the values of DT and DS from Eqs. (7) and(8), the value of T0 is optimized using the shuffled complex evolu-tion method (Duan et al., 1993) to maximize the accuracy of dis-criminating the precipitation types. The final result is given by:
T0 ¼ �5:87� 0:1042� Z þ 0:0885� Z2 þ 16:06� RH
� 9:614� RH2; ð9Þ
where Z denotes station elevation (km).
4.2. A scheme for determinant parameterization of precipitation types
From Eqs. (2)–(9), the occurrence probability of each precipita-tion type can be calculated by inputting Tw, RH, and elevation. Forland hydrological modeling, it is usually not sufficient to give theprobabilities of the precipitation types; instead, the type for a spe-cific precipitation event must be given. In other words, a determi-nant identification rather than the probability of a precipitationtype is needed. Therefore, two threshold temperatures (Tmin andTmax) are defined such that the precipitation type is decided by:
type ¼snow; if Tw 6 Tmin;
sleet; if Tmin < Tw < Tmax;
rain; if Tw P Tmax:
8><>: ð10Þ
According to the P1–Tw and P2–Tw relationships in Fig. 5, Tmin isthe temperature value at which the occurrence probabilities ofsnow and sleet are equal to each other, and Tmax is that for theequal occurrence probabilities of rain and sleet. These can be ex-pressed as
FsnowðTminÞ ¼ FsleetðTminÞ; ð11Þ
(a)–(c), and their relationships with average relative humidity (RH) in each RH sub-
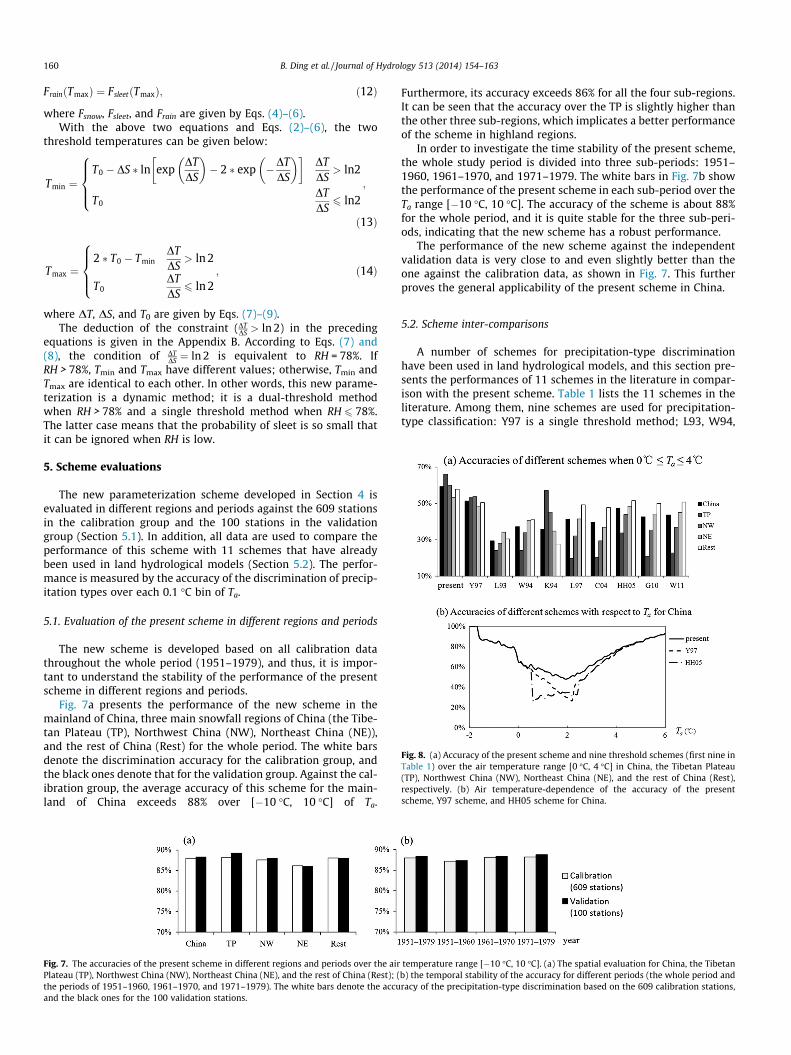
Fig. 8. (a) Accuracy of the present scheme and nine threshold schemes (first nine inTable 1) over the air temperature range [0 �C, 4 �C] in China, the Tibetan Plateau(TP), Northwest China (NW), Northeast China (NE), and the rest of China (Rest),respectively. (b) Air temperature-dependence of the accuracy of the presentscheme, Y97 scheme, and HH05 scheme for China.
160 B. Ding et al. / Journal of Hydrology 513 (2014) 154–163
FrainðTmaxÞ ¼ FsleetðTmaxÞ; ð12Þ
where Fsnow, Fsleet, and Frain are given by Eqs. (4)–(6).With the above two equations and Eqs. (2)–(6), the two
threshold temperatures can be given below:
Tmin ¼T0 � DS � ln exp
DTDS
� �� 2 � exp �DT
DS
� �� �DTDS
> ln2
T0DTDS6 ln2
8>><>>:
;
ð13Þ
Tmax ¼2 � T0 � Tmin
DTDS
> ln 2
T0DTDS6 ln 2
8>><>>:
; ð14Þ
where DT, DS, and T0 are given by Eqs. (7)–(9).The deduction of the constraint (DT
DS > ln 2) in the precedingequations is given in the Appendix B. According to Eqs. (7) and(8), the condition of DT
DS ¼ ln 2 is equivalent to RH = 78%. IfRH > 78%, Tmin and Tmax have different values; otherwise, Tmin andTmax are identical to each other. In other words, this new parame-terization is a dynamic method; it is a dual-threshold methodwhen RH > 78% and a single threshold method when RH 6 78%.The latter case means that the probability of sleet is so small thatit can be ignored when RH is low.
5. Scheme evaluations
The new parameterization scheme developed in Section 4 isevaluated in different regions and periods against the 609 stationsin the calibration group and the 100 stations in the validationgroup (Section 5.1). In addition, all data are used to compare theperformance of this scheme with 11 schemes that have alreadybeen used in land hydrological models (Section 5.2). The perfor-mance is measured by the accuracy of the discrimination of precip-itation types over each 0.1 �C bin of Ta.
5.1. Evaluation of the present scheme in different regions and periods
The new scheme is developed based on all calibration datathroughout the whole period (1951–1979), and thus, it is impor-tant to understand the stability of the performance of the presentscheme in different regions and periods.
Fig. 7a presents the performance of the new scheme in themainland of China, three main snowfall regions of China (the Tibe-tan Plateau (TP), Northwest China (NW), Northeast China (NE)),and the rest of China (Rest) for the whole period. The white barsdenote the discrimination accuracy for the calibration group, andthe black ones denote that for the validation group. Against the cal-ibration group, the average accuracy of this scheme for the main-land of China exceeds 88% over [�10 �C, 10 �C] of Ta.
Fig. 7. The accuracies of the present scheme in different regions and periods over the airPlateau (TP), Northwest China (NW), Northeast China (NE), and the rest of China (Rest); (the periods of 1951–1960, 1961–1970, and 1971–1979). The white bars denote the accuand the black ones for the 100 validation stations.
Furthermore, its accuracy exceeds 86% for all the four sub-regions.It can be seen that the accuracy over the TP is slightly higher thanthe other three sub-regions, which implicates a better performanceof the scheme in highland regions.
In order to investigate the time stability of the present scheme,the whole study period is divided into three sub-periods: 1951–1960, 1961–1970, and 1971–1979. The white bars in Fig. 7b showthe performance of the present scheme in each sub-period over theTa range [�10 �C, 10 �C]. The accuracy of the scheme is about 88%for the whole period, and it is quite stable for the three sub-peri-ods, indicating that the new scheme has a robust performance.
The performance of the new scheme against the independentvalidation data is very close to and even slightly better than theone against the calibration data, as shown in Fig. 7. This furtherproves the general applicability of the present scheme in China.
5.2. Scheme inter-comparisons
A number of schemes for precipitation-type discriminationhave been used in land hydrological models, and this section pre-sents the performances of 11 schemes in the literature in compar-ison with the present scheme. Table 1 lists the 11 schemes in theliterature. Among them, nine schemes are used for precipitation-type classification: Y97 is a single threshold method; L93, W94,
temperature range [�10 �C, 10 �C]. (a) The spatial evaluation for China, the Tibetanb) the temporal stability of the accuracy for different periods (the whole period andracy of the precipitation-type discrimination based on the 609 calibration stations,

Table 2Accuracies of the precipitation-type discrimination of the present scheme and nine schemes in the literature over the air temperature range [0 �C, 4 �C].
Present (%) Y97 (%) L93 (%) W94 (%) K94 (%) L97 (%) C04 (%) HH05 (%) G10 (%) W11 (%)
China 59.3 51.4 29.4 37.2 35.7 41.3 39.6 47.4 42.6 43.7TP 66.1 53.2 24.1 24.1 57.2 19.7 20.3 33.8 20.9 22.8NW 60.1 53.8 28.1 34.0 45.3 32.2 29.4 43.9 35.5 37.0NE 53.1 48.3 34.3 40.6 34.8 41.5 36.9 48.4 44.1 45.1Rest 57.8 50.5 30.4 40.9 27.5 49.3 47.8 51.6 50.0 50.7
Fig. 9. (a) The P1–Tw and P2–Tw relationships from observed data (obs), their fitted curves (fit) according to Eqs. (2) and (3), and the P–Tw relationship (P is the ratio of snowamount to total precipitation amount) given by Y01 scheme; (b) the P1–Ta and P2–Ta relationships between the observed and D08 scheme.
B. Ding et al. / Journal of Hydrology 513 (2014) 154–163 161
K94, L97, C04, HH05, G10, and W11 are dual-threshold methods.Other two schemes (Y01 and D08) are used to calculate the ratioof snow (or rain) amount to total precipitation amount with inputof Tw or Ta. The specific temperature thresholds to discriminateprecipitation types or the variable used to estimate the snow ratiofor these schemes are summarized in Table 1.
Fig. 8a compares the accuracy between the present scheme andthe nine threshold schemes (the first nine schemes in Table 1) overthe Ta range [0 �C, 4 �C] in China and the four sub-regions of China(TP, NW, NE, and Rest). It is seen that the accuracy of all schemesfor the [0 �C, 4 �C] range is worse than that for the [�10 �C,10 �C] range (Fig. 7), indicating that the discrimination of precipi-tation types for the [0 �C, 4 �C] range is more difficult. Perhaps, pre-cipitation types over this temperature range are more sensitive toambient air conditions. Nevertheless, the accuracy of the presentscheme is clearly better than that of the nine schemes for thewhole region and each of the four sub-regions, as also indicatedin Table 2. Among the nine schemes, Y97 scheme shows better per-formance in the four sub-regions; K94 scheme also has good per-formance for TP and NW but not so for NE and Rest, perhapsbecause K94 scheme is obtained from high-elevation observations;other seven schemes generally perform better for the low-eleva-tion regions than the high-elevation regions, perhaps because theyfocus more on low-elevation regions or estimate the thresholdtemperatures by experiences. In turn, this demonstrates thedependence of precipitation types on elevation. The difference inthe accuracy between the present scheme and Y97 scheme isnearly 7.9% for China (59.3% and 51.4% for the two schemes,respectively), 12.9% for TP (66.1% and 53.2%, respectively), 6.3%for NW (60.1% and 53.8%, respectively), 4.8% for NE (53.1% and48.3%, respectively), and 7.3% for Rest (57.8% and 50.5%, respec-tively), as shown in Fig. 8a. The accuracy difference between thepresent scheme (66.1%) and K94 scheme (57.2%) for TP is nearly8.9%, and that between the present scheme (57.8%) and HH05scheme (51.6%, the best one among the nine schemes) for Rest isabout 6.2%. To show the performance of the present scheme moreclearly, Fig. 8b compares the accuracy distribution of this schemewith Y97 scheme and HH05 scheme (the best two schemes among
the nine) with respect to Ta for China. Again, it can be seen that thepresent scheme performs better at any specific Ta value.
Fig. 9a shows the comparison of P1–Tw and P2–Tw relationshipsfrom the observed data, the fitted curves (i.e. Eqs. (2) and (3)), andY01 scheme. It is noticed that Y01 scheme only gives the estimatesof snow (Fsnow) and rain ratio (Frain), while the observed data andthe fitted curves give snow (Fsnow), sleet (Fsleet), and rain ratio (Frain).Although they cannot be compared directly by values, it can beseen that Y01 scheme underestimates the rain ratio when Tw is be-low 1 �C and overestimates the rain ratio when Tw is above 2 �C.Fig. 9b compares the P1–Ta and P2–Ta relationships between ob-served data and D08 scheme. It seems that D08 scheme underesti-mates the sleet ratio.
In summary, the present scheme is based on a long-term data-set with different climate regimes and elevation regions, and itgenerally performs better than other schemes in the literature.
6. Conclusion and remarks
Precipitation type is an important input for the study of landhydrological processes, and usually determined by static tempera-ture thresholds in most current hydrological models. To betterdiscriminate rain, sleet, and snow, this study presented the rela-tionships of precipitation types with elevation and meteorologicalvariables based on CMA station data during 1951–1979, and then anew parameterization scheme was developed.
It is found that wet-bulb temperature is a better indicator ofprecipitation types than air temperature although the latter ismore widely used in discriminating precipitation types. Precipita-tion types are also highly dependent on elevation and humidity.Over higher-elevation regions, snow droplets can land faster andthus absorb less heat from the ambient air. So the droplets tendto stay as snow at high elevations and a higher threshold temper-ature is needed for discriminating snow and rain. In a humidenvironment, small humidity difference between droplets andambient air leads to small evaporative cooling and thus is favorablefor the phase transition from snow to rain, but the intensity of the

162 B. Ding et al. / Journal of Hydrology 513 (2014) 154–163
transition is suppressed by the small heat transfer from the air tothe snow droplets, resulting in more sleet.
Based on these findings, a new parameterization scheme wasdeveloped to discriminate rain, sleet, and snow. In this scheme,the threshold temperatures dynamically change with humidityand elevation. The dynamic threshold method tends to be a dual-threshold method in a humid environment and a single thresholdmethod in a dry environment. Several evaluations show consistentgood performance of the new scheme in different regions and peri-ods, and also indicate that the new scheme performs better thanother schemes in the literature.
Finally, it is worthy to note that the scheme was only evaluatedfor China territory, and further evaluations for other regions areneeded. Furthermore, the new scheme was developed based ondaily meteorological data, and thus it may be different fromschemes developed based on hourly data. As the temperature dur-ing precipitation hours is usually lower than the daily mean tem-perature, the threshold temperature needed for identifyinghourly precipitation types is expected to be lower than the valuesgiven by the present scheme.
Acknowledgments
This research was financially supported by the Strategic PriorityResearch Program (B) of the Chinese Academy of Sciences (GrantNo. XDB03030300) and the National Natural Science Foundationof China (Grant Nos. 41190083 and 41325019). The meteorologicaldata used in this study were provided by CMA National Meteoro-logical Information Center. The authors thank the anonymousreviewers for their valuable comments.
Appendix A. Wet-bulb temperature (Tw)
Tw is the temperature of a parcel of saturated air if the satura-tion is due to evaporation into it, with the latent heat suppliedby the parcel itself. This process can be expressed as:
cpðTa � TwÞ þeLv
psðea � ew;satÞ ¼ 0; ðA:1Þ
where cp = 1004 J K�1 kg�1, e = 0.622, Lv = 2.5104 � 106 J kg�1, ps isair pressure [h Pa], Ta is air temperature [�C], Tw is wet-bulb temper-ature [�C], ea is vapor pressure [h Pa], and ew,sat is the saturated va-por pressure [h Pa] at Tw.
From the above equation, Tw can be deduced as:
Tw ¼ Ta �esatðTaÞð1� RHÞ
0:000643ps þ @esat@Ta
; ðA:2Þ
where RH is relative humidity and it ranges from 0 to 1; esat(Ta) isthe saturated vapor pressure [h Pa] at Ta and is given by Tetens’sempirical formula (Murray, 1967) as:
esatðTaÞ ¼ 6:1078 exp17:27Ta
Ta þ 237:3
� �: ðA:3Þ
Appendix B. Deduction of the constraint for the optimalthreshold temperatures
There are two constraints for Eqs. (13) and (14), as given below:
expDTDS
� �� 2 � exp �DT
DS
� �> 0; ðB:1Þ
and
Tmin < Tmax; ðB:2Þ
in which, Eq. (B.1) is a constraint required by the logarithmic termin Eq. (13), and Eq. (B.2) is a physical constraint.
Putting Eqs. (13) and (14) into Eq. (B.2), we have
DS � ln expDTDS
� �� 2 � exp �DT
DS
� �� �> 0; ðB:3Þ
where DS is a function of RH (Eq. (8)) and gives a value consistentlylarger than 0 over the RH range [0, 1]. So Eq. (B.3) is equivalent to
expDTDS
� �� 2 � exp �DT
DS
� �> 1; ðB:4Þ
which also satisfies Eq. (B.1).Eq. (B.4) can eventually be simplified as:
DTDS
> ln 2; ðB:5Þ
which is the constraint for Eqs. (13) and (14).
References
Anderson, B., Mackintosh, A., 2012. Controls on mass balance sensitivity ofmaritime glaciers in the Southern Alps, New Zealand: the role of debris cover.J. Geophys. Res. Earth Surf. 117, F01003, <http://dx.doi.org/10.1029/2011JF002064>.
Auer Jr., A.H., 1974. The rain versus snow threshold temperatures. Weatherwise 27,67, <http://dx.doi.org/10.1080/00431672.1974.9931684>.
Benjamin, S.G., Grell, G.A., Brown, J.M., Brundage, K.J., Devenyi, D., Kim, D., Schwartz,B., Smirnova, T.G., Smith, T.L., Weygandt, S.S., 2000. The 20-km version of theRapid Update Cycle. In: 9th Conf. on Aviation, Range, and AerospaceMeteorology, pp. 421–423.
Bocchieri, J.R., 1980. The objective use of upper air soundings to specifyprecipitation type. Mon. Weather Rev. 108, 596–603.
Bourgouin, P., 2000. A method to determine precipitation types. WeatherForecasting 15, 583–592.
Box, J., Fettweis, X., Stroeve, J., Tedesco, M., Hall, D., Steffen, K., 2012. Greenland icesheet albedo feedback: thermodynamics and atmospheric drivers. Cryosphere6, 821–839, <http://dx.doi.org/10.5194/tc-6-821-2012>.
Chen, R.S., Lu, S.H., Kang, E.S., Ji, X.B., Zhang, Z., Yang, Y., Qing, W., 2008. Adistributed water-heat coupled model for mountainous watershed of an inlandriver basin of Northwest China (I) model structure and equations. Environ. Geol.53, 1299–1309, <http://dx.doi.org/10.1007/s00254-007-0738-2>.
Clark, M.P., Slater, A.G., Barrett, A.P., Hay, L.E., McCabe, G.J., Rajagopalan, B.,Leavesley, G.H., 2006. Assimilation of snow covered area information intohydrologic and land-surface models. Adv. Water Resour. 29, 1209–1221,<http://dx.doi.org/10.1016/j.advwatres.2005.10.001>.
Collins, W.D., Rasch, P.J., Boville, B.A., Hack, J.J., McCaa, J.R., Williamson, D.L., Kiehl,J.T., Briegleb, B., Bitz, C., Lin, S.J., Zhang, M.H., Dai, Y.J., 2004. Description of theNCAR community atmosphere model (CAM 3.0). NCAR Tech. Note NCAR/TN-464+ STR.
Czys, R.R., Scott, R.W., Tang, K.C., Przybylinski, R.W., Sabones, M.E., 1996. Aphysically based, nondimensional parameter for discriminating betweenlocations of freezing rain and ice pellets. Weather Forecasting 11, 591–598.
Dai, A.G., 2008. Temperature and pressure dependence of the rain-snow phasetransition over land and ocean. Geophys. Res. Lett. 35, L12802, <http://dx.doi.org/10.1029/2008GL033295>.
Duan, Q.Y., Gupta, V.K., Sorooshian, S., 1993. Shuffled complex evolution approach foreffective and efficient global minimization. J. Optim. Theory Appl. 76, 501–521.
Gao, X., Ye, B.S., Zhang, S.Q., Qiao, C.J., Zhang, X.W., 2010. Glacier runoff variationand its influence on river runoff during 1961–2006 in the Tarim River Basin,China. Sci. China Earth Sci. 53, 880–891, <http://dx.doi.org/10.1007/s11430-010-0073-4>.
Gustafsson, D., Stähli, M., Jansson, P.E., 2001. The surface energy balance of a snowcover: comparing measurements to two different simulation models. Theor.Appl. Climatol. 70, 81–96.
Han, C.T., Chen, R.S., Liu, J.F., Yang, Y., Qing, W.W., 2010. A discuss of the separatingsolid and liquid precipitations. J. Glaciol. Geocryol. 32, 249–256 (in Chinese).
Hock, R., Holmgren, B., 2005. A distributed surface energy-balance model forcomplex topography and its application to Storglaciaren, Sweden. J. Glaciol. 51,25–36.
Kang, E.S., 1994. Energy, water and mass balance, and discharge modeling in theTianshan glaciated basin. Sci. China. Ser. B 24, 983–991 (in Chinese).
Kang, E.S., Cheng, G.D., Lan, Y.C., Jin, H.J., 1999. A model for simulating the responseof runoff from the mountainous watersheds of inland river basins in the arid areaof northwest China to climatic changes. Sci. China Ser. D: Earth Sci. 42, 52–63.
Lindström, G., Johansson, B., Persson, M., Gardelin, M., Bergström, S., 1997.Development and test of the distributed HBV-96 hydrological model. J.Hydrol. 201, 272–288.
Loth, B., Graf, H.F., Oberhuber, J.M., 1993. Snow cover model for global climatesimulations. J. Geophys. Res. Atmos. (1984–2012) 98, 10451–10464.

B. Ding et al. / Journal of Hydrology 513 (2014) 154–163 163
Lundquist, J.D., Neiman, P.J., Martner, B., White, A.B., Gottas, D.J., Ralph, F.M., 2008.Rain versus snow in the Sierra Nevada, California: comparing Doppler profilingradar and surface observations of melting level. J. Hydrometeorol. 9, 194–211,<http://dx.doi.org/10.1175/2007JHM853.1>.
Murray, F.W., 1967. On the computation of saturation vapor pressure. J. Appl.Meteorol. 6, 203–204.
Rasmussen, R., Baker, B., Kochendorfer, J., Meyers, T., Landolt, S., Fischer, A.P., Black,J., Thériault, J.M., Kucera, P., Gochis, D., Smith, C., Nitu, R., Hall, M., Ikeda, K.,Gutmann, E., 2012. How well are we measuring snow: the NOAA/FAA/NCARwinter precipitation test bed. Bull. Amer. Meteorol. Soc. 93, 811–829, <http://dx.doi.org/10.1175/BAMS-D-11-00052.1>.
Rauber, R.M., Olthoff, L.S., Ramamurthy, M.K., Kunkel, K.E., 2001. Furtherinvestigation of a physically based, nondimensional parameter fordiscriminating between locations of freezing rain and ice pellets. WeatherForecasting 16, 185–191.
Ryzhkov, A.V., Zrnic, D.S., 1998. Discrimination between rain and snow with apolarimetric radar. J. Appl. Meteorol. 37, 1228–1240.
Schuur, T.J., Park, H.S., Ryzhkov, A.V., Reeves, H.D., 2012. Classification ofprecipitation types during transitional winter weather using the RUC modeland polarimetric radar retrievals. J. Appl. Meteor. Climatol. 51, 763–779,<http://dx.doi.org/10.1175/JAMC-D-11-091.1>.
Wang, S., Pu, J.C., Wang, N.L., 2011. Study of mass balance and sensibility to climate changeof qiyi glacier in qilian mountains. J. Glaciol. Geocryol. 33, 1214–1221 (in Chinese).
Wigmosta, M.S., Vail, L.W., Lettenmaier, D.P., 1994. A distributed hydrology-vegetation model for complex terrain. Water Resour. Res. 30, 1665–1679.
Yamazaki, T., 2001. A one-dimensional land surface model adaptable to intenselycold regions and its applications in Eastern Siberia. J. Meteor. Soc. Japan 79,1107–1118.
Yang, D.Q., Jiang, T., Zhang, Y.S., Kang, E.S., 1988. Analysis and correction of errors inprecipitation measurement at the head of Urumqi River. Tianshan. J. Glaciol.Geocryol. 10, 384–399 (in Chinese).
Yang, D.Q., Goodison, B.E., Metcalfe, J.R., Golubev, V.S., Elomaa, E., Gunther, T., Bates,R., Pangburn, T., Hanson, C.L., Emerson, D., Copaciu, V., Milkovic, J., 1995.Accuracy of Tretyakov precipitation gauge: result of WMO intercomparison.Hydrol. Process. 9, 877–895.
Yang, Z.L., Dickinson, R.E., Robock, A., Vinnikov, K.Y., 1997. Validation of the snowsubmodel of the biosphere-atmosphere transfer scheme with Russian snowcover and meteorological observational data. J. Climate 10, 353–373.
Zhang, G.S., Kang, S.C., Fujita, K., Huintjes, E., Xu, J.Q., Yamazaki, T., Haginoya, S.,Yang, W., Scherer, D., Schneider, C., Yao, T.D., 2013. Energy and mass balance ofZhadang glacier surface, central Tibetan Plateau. J. Glaciol. 59, 137–148, <http://dx.doi.org/10.3189/2013JoG12J152>.