the density structure of the l1157 molecular outflow
TRANSCRIPT

MNRAS 446, 3346–3355 (2015) doi:10.1093/mnras/stu2311
The density structure of the L1157 molecular outflow�†
A. I. Gomez-Ruiz,1ঠC. Codella,1 B. Lefloch,2,3 M. Benedettini,4 G. Busquet,5,4
C. Ceccarelli,2,3 B. Nisini,6 L. Podio1 and S. Viti71INAF, Osservatorio Astrofisico di Arcetri, Largo E. Fermi 5, I-50125 Firenze, Italy2Univ. Grenoble Alpes, IPAG, F-38000 Grenoble, France3CNRS, IPAG, F-38000 Grenoble, France4INAF, Istituto di Astrofisica e Planetologia Spaziali, via Fosso del Cavaliere 100, I-00133 Roma, Italy5Instituto de Astrofısica de Andalucıa, CSIC, Glorieta de la Astronomıa s/n, E-18008 Granada, Spain6INAF, Osservatorio Astronomico di Roma, via di Frascati 33, I-00040 Monte Porzio Catone, Italy7Department of Physics and Astronomy, University College London, WC1E 6BT London, UK
Accepted 2014 October 30. Received 2014 October 28; in original form 2014 May 22
ABSTRACTWe present a multiline CS survey towards the brightest bow-shock B1 in the prototypicalchemically active protostellar outflow L1157. We made use of (sub-)mm data obtained inthe framework of the Chemical HErschel Surveys of Star forming regions and AstrochemicalSurveys at IRAM (ASAI) key science programs. We detected 12C32S, 12C34S, 13C32S, and12C33S emissions, for a total of 18 transitions, with Eu up to ∼180 K. The unprecedentedsensitivity of the survey allows us to carefully analyse the line profiles, revealing high-velocityemission, up to 20 km s−1 with respect to the systemic. The profiles can be well fitted by acombination of two exponential laws that are remarkably similar to what previously foundusing CO. These components have been related to the cavity walls produced by the ∼2000 yrB1 shock and the older (∼4000 yr) B2 shock, respectively. The combination of low- andhigh-excitation CS emission was used to properly sample the different physical componentsexpected in a shocked region. Our CS observations show that this molecule is highlighting thedense, nH2 = 1–5 × 105 cm−3, cavity walls produced by the episodic outflow in L1157. Inaddition, the highest excitation (Eu ≥ 130 K) CS lines provide us with the signature of denser(1–5 × 106 cm−3) gas, associated with a molecular reformation zone of a dissociative J-typeshock, which is expected to arise where the precessing jet impacting the molecular cavities.The CS fractional abundance increases up to ∼10−7 in all the kinematical components. Thisvalue is consistent with what previously found for prototypical protostars and it is in agreementwith the prediction of the abundances obtained via the chemical code Astrochem.
Key words: molecular data – stars: formation – ISM: molecules – radio lines: ISM –submillimetre: ISM.
1 IN T RO D U C T I O N
Bipolar fast jets driven by protostars are present during the earlieststages of low-mass star formation. The interaction of the jets with thehigh-density ambient medium creates shocks, which in turn trigger
�Based on observations carried out with Herschel. Herschel is an ESA spaceobservatory with science instruments provided by European-led PrincipalInvestigator consortia and with important participation from NASA.†Based on observations carried out with the IRAM 30m Telescope. IRAMis supported by INSU/CNRS (France), MPG (Germany) and IGN (Spain).‡E-mail: [email protected]¶Current address: Instituto Nacional de Astrofı,sica, Optica y Electronica(INAOE), Luis Enrique Erro No.1, C.P. 72840, Tonantzintla, Puebla,Mexico.
endothermic chemical reactions and ice grain mantle sublimationor sputtering. The chemical composition of the gas phase is conse-quently altered and enriched. One of the best studied protostellaroutflows with strong shocks and very active chemistry is the bipo-lar outflow driven by the low-mass Class 0 protostar L1157-mm,located at a distance of �250 pc (Looney, Tobin & Kwon 2007),and with a luminosity of Lbol ∼ 3 L� (Tobin et al. 2010). Severalblue- and red-shifted shocks have been revealed using CO (Guethet al. 1996, 1998) and H2 (Neufeld et al. 2009; Nisini et al. 2010).The interferometric CO maps made of this outflow showed thatthe spatial-kinematic structure of the blue lobe is reproduced by amodel of two limb-brightened cavities with slightly different axes(Gueth, Guilloteau & Bachiller 1996). In particular, the shocks thatproduced the two cavities in the blue lobe were labelled B2 andB1 (with kinematical ages of ∼4000 and 2000 yr, respectively), of
C© 2014 The AuthorsPublished by Oxford University Press on behalf of the Royal Astronomical Society
at AK
DE
NIZ
UN
IV on D
ecember 21, 2014
http://mnras.oxfordjournals.org/
Dow
nloaded from
The density structure of the L1157 outflow 3347
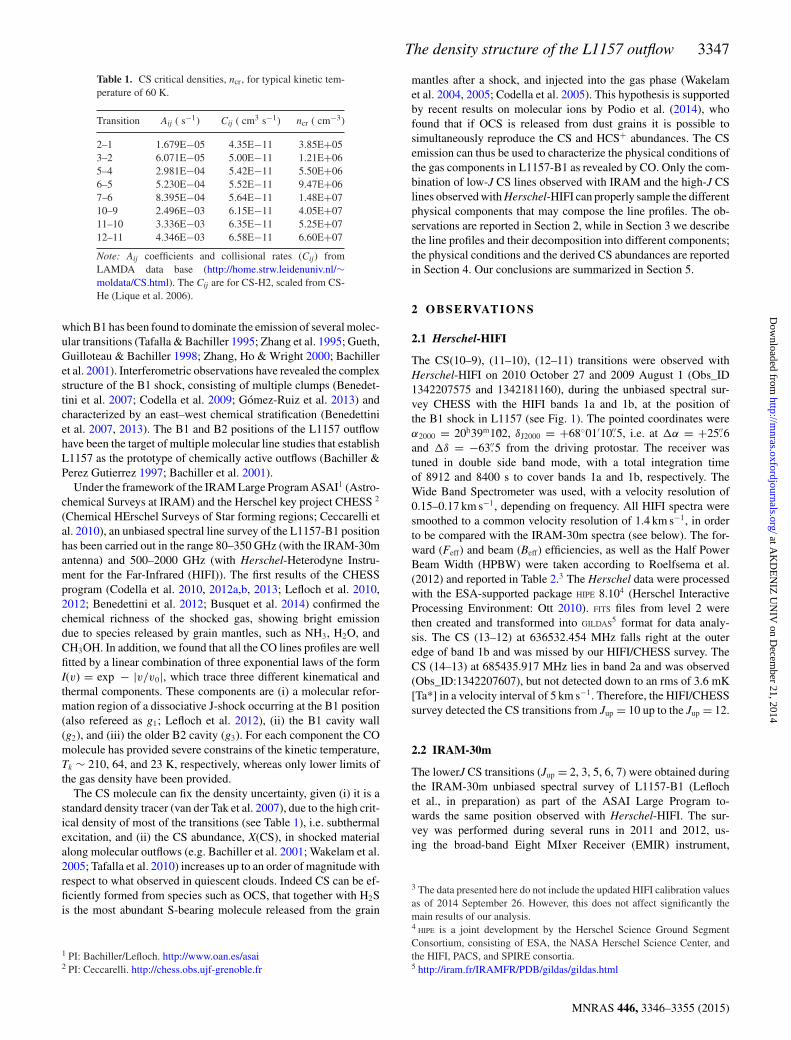
Table 1. CS critical densities, ncr, for typical kinetic tem-perature of 60 K.
Transition Aij ( s−1) Cij ( cm3 s−1) ncr ( cm−3)
2–1 1.679E−05 4.35E−11 3.85E+053–2 6.071E−05 5.00E−11 1.21E+065–4 2.981E−04 5.42E−11 5.50E+066–5 5.230E−04 5.52E−11 9.47E+067–6 8.395E−04 5.64E−11 1.48E+0710–9 2.496E−03 6.15E−11 4.05E+0711–10 3.336E−03 6.35E−11 5.25E+0712–11 4.346E−03 6.58E−11 6.60E+07
Note: Aij coefficients and collisional rates (Cij) fromLAMDA data base (http://home.strw.leidenuniv.nl/∼moldata/CS.html). The Cij are for CS-H2, scaled from CS-He (Lique et al. 2006).
which B1 has been found to dominate the emission of several molec-ular transitions (Tafalla & Bachiller 1995; Zhang et al. 1995; Gueth,Guilloteau & Bachiller 1998; Zhang, Ho & Wright 2000; Bachilleret al. 2001). Interferometric observations have revealed the complexstructure of the B1 shock, consisting of multiple clumps (Benedet-tini et al. 2007; Codella et al. 2009; Gomez-Ruiz et al. 2013) andcharacterized by an east–west chemical stratification (Benedettiniet al. 2007, 2013). The B1 and B2 positions of the L1157 outflowhave been the target of multiple molecular line studies that establishL1157 as the prototype of chemically active outflows (Bachiller &Perez Gutierrez 1997; Bachiller et al. 2001).
Under the framework of the IRAM Large Program ASAI1 (Astro-chemical Surveys at IRAM) and the Herschel key project CHESS 2
(Chemical HErschel Surveys of Star forming regions; Ceccarelli etal. 2010), an unbiased spectral line survey of the L1157-B1 positionhas been carried out in the range 80–350 GHz (with the IRAM-30mantenna) and 500–2000 GHz (with Herschel-Heterodyne Instru-ment for the Far-Infrared (HIFI)). The first results of the CHESSprogram (Codella et al. 2010, 2012a,b, 2013; Lefloch et al. 2010,2012; Benedettini et al. 2012; Busquet et al. 2014) confirmed thechemical richness of the shocked gas, showing bright emissiondue to species released by grain mantles, such as NH3, H2O, andCH3OH. In addition, we found that all the CO lines profiles are wellfitted by a linear combination of three exponential laws of the formI(v) = exp − |v/v0|, which trace three different kinematical andthermal components. These components are (i) a molecular refor-mation region of a dissociative J-shock occurring at the B1 position(also refereed as g1; Lefloch et al. 2012), (ii) the B1 cavity wall(g2), and (iii) the older B2 cavity (g3). For each component the COmolecule has provided severe constrains of the kinetic temperature,Tk ∼ 210, 64, and 23 K, respectively, whereas only lower limits ofthe gas density have been provided.
The CS molecule can fix the density uncertainty, given (i) it is astandard density tracer (van der Tak et al. 2007), due to the high crit-ical density of most of the transitions (see Table 1), i.e. subthermalexcitation, and (ii) the CS abundance, X(CS), in shocked materialalong molecular outflows (e.g. Bachiller et al. 2001; Wakelam et al.2005; Tafalla et al. 2010) increases up to an order of magnitude withrespect to what observed in quiescent clouds. Indeed CS can be ef-ficiently formed from species such as OCS, that together with H2Sis the most abundant S-bearing molecule released from the grain
1 PI: Bachiller/Lefloch. http://www.oan.es/asai2 PI: Ceccarelli. http://chess.obs.ujf-grenoble.fr
mantles after a shock, and injected into the gas phase (Wakelamet al. 2004, 2005; Codella et al. 2005). This hypothesis is supportedby recent results on molecular ions by Podio et al. (2014), whofound that if OCS is released from dust grains it is possible tosimultaneously reproduce the CS and HCS+ abundances. The CSemission can thus be used to characterize the physical conditions ofthe gas components in L1157-B1 as revealed by CO. Only the com-bination of low-J CS lines observed with IRAM and the high-J CSlines observed with Herschel-HIFI can properly sample the differentphysical components that may compose the line profiles. The ob-servations are reported in Section 2, while in Section 3 we describethe line profiles and their decomposition into different components;the physical conditions and the derived CS abundances are reportedin Section 4. Our conclusions are summarized in Section 5.
2 O BSERVATI ONS
2.1 Herschel-HIFI
The CS(10–9), (11–10), (12–11) transitions were observed withHerschel-HIFI on 2010 October 27 and 2009 August 1 (Obs_ID1342207575 and 1342181160), during the unbiased spectral sur-vey CHESS with the HIFI bands 1a and 1b, at the position ofthe B1 shock in L1157 (see Fig. 1). The pointed coordinates wereα2000 = 20h39m10s2, δJ2000 = +68◦01′10.′′5, i.e. at �α = +25.′′6and �δ = −63.′′5 from the driving protostar. The receiver wastuned in double side band mode, with a total integration timeof 8912 and 8400 s to cover bands 1a and 1b, respectively. TheWide Band Spectrometer was used, with a velocity resolution of0.15–0.17 km s−1, depending on frequency. All HIFI spectra weresmoothed to a common velocity resolution of 1.4 km s−1, in orderto be compared with the IRAM-30m spectra (see below). The for-ward (Feff) and beam (Beff) efficiencies, as well as the Half PowerBeam Width (HPBW) were taken according to Roelfsema et al.(2012) and reported in Table 2.3 The Herschel data were processedwith the ESA-supported package HIPE 8.104 (Herschel InteractiveProcessing Environment: Ott 2010). FITS files from level 2 werethen created and transformed into GILDAS5 format for data analy-sis. The CS (13–12) at 636532.454 MHz falls right at the outeredge of band 1b and was missed by our HIFI/CHESS survey. TheCS (14–13) at 685435.917 MHz lies in band 2a and was observed(Obs_ID:1342207607), but not detected down to an rms of 3.6 mK[Ta*] in a velocity interval of 5 km s−1. Therefore, the HIFI/CHESSsurvey detected the CS transitions from Jup = 10 up to the Jup = 12.
2.2 IRAM-30m
The lowerJ CS transitions (Jup = 2, 3, 5, 6, 7) were obtained duringthe IRAM-30m unbiased spectral survey of L1157-B1 (Leflochet al., in preparation) as part of the ASAI Large Program to-wards the same position observed with Herschel-HIFI. The sur-vey was performed during several runs in 2011 and 2012, us-ing the broad-band Eight MIxer Receiver (EMIR) instrument,
3 The data presented here do not include the updated HIFI calibration valuesas of 2014 September 26. However, this does not affect significantly themain results of our analysis.4 HIPE is a joint development by the Herschel Science Ground SegmentConsortium, consisting of ESA, the NASA Herschel Science Center, andthe HIFI, PACS, and SPIRE consortia.5 http://iram.fr/IRAMFR/PDB/gildas/gildas.html
MNRAS 446, 3346–3355 (2015)
at AK
DE
NIZ
UN
IV on D
ecember 21, 2014
http://mnras.oxfordjournals.org/
Dow
nloaded from

3348 A. I. Gomez-Ruiz et al.
Figure 1. The CS(3–2) emission integrated from ∼−21 to +5 km s−1 inthe blue lobe of the L1157 outflow. Upper panel: IRAM 30-m single-dishmap of the blue lobe (first contour and steps of 3 K km s−1, correspondingto ∼3σ ). The star points out the position of the driving protostar L1157-mm. The labels indicate the main blue-shifted knots B1 and B2. The ellipsein the bottom-right corner shows the HPBW. Lower panel: IRAM PdBICS(3–2) image (the synthesized beam is reported in the bottom-right cor-ner) of the B1 clump (Benedettini et al. 2013; first contour and steps of0.5 Jy beam−1 km s−1, corresponding to ∼3σ ). Circles are for the smallest(7 arcsec) and largest (44 arcsec) HPBW of the present data set.
the Fourier Transform Spectrometer (FTS; velocity resolution upto 1.4 km s−1) and the Wideband Line Multiple Autocorrelator(WILMA) spectrometer (only the 6–5 transitions; ∼2.1 km s−1).All the spectra taken with the FTS were smoothed to a com-mon velocity resolution of 1.4 km s−1. The forward and beamefficiencies, as well as the HPBW are reported in Table 2. Ascomplementary data, the CS(3–2) line emission was mapped atthe Nyquist spatial frequency (i.e. every 8 arcsec) in a regionof ∼200 arcsec × 400 arcsec, covering the entire blue lobe ofthe L1157 outflow in 2011 September with the IRAM-30m an-tenna (see Fig. 1, upper panel). The spectral resolution was0.4 km s−1. The average rms of the map was ∼0.1 K per velocityinterval.
The total frequency coverage of the survey allow us to observemost of the CS rotational transitions from J = 2–1 up to J = 12–11, as well as some isotopic species transitions (in particular low-Jtransitions). We did not observe the J = 1–0, 4–3, 8–7, and 9–8transitions. The spectra in this paper are reported in units of main-beam brightness temperature (TMB = T ∗
A× Feff/Beff), for which wehave used the Feff and Beff in Table 2. Nominal flux calibration
uncertainties of 10 and 20 per cent, for Herschel and IRAM-30m,respectively, are considered in the analysis.
3 R ESULTS
3.1 Detected transitions and line opacities
The observed transitions of CS and its isotopologues are listed inTable 2. In total 18 transitions from 12CS, 13CS, C33S, and C34Swere detected. In Table 2 are reported the peak intensities (T peak
MB ),the velocity limits of the detection (Vmin and Vmax, defined at a 3σ
detection limit), and the integrated emission within this limits (∫
TMBdv). Figs 2 and 3 show the spectra of the CS and its isotopo-logues transitions, respectively. The strongest lines are CS (2–1) and(3–2), with typical peak intensities between ∼2–3 K. The highest ve-locities detected in these transitions reach up to VLSR ∼ −20 km s−1
(cloud velocity is Vsys = +2.6 km s−1: e.g. Bachiller & Perez Gutier-rez 1997). On the other hand, the highest frequency lines observedwith HIFI have typical peak intensities of ∼30–60 mK, and theyspan a much narrow velocity range, with the highest velocity upto VLSR ∼ −5 km s−1. The isotopologues were detected up to theJ = 6–5 transition, with peak intensities in the 20–160 mK range.
Since only the 2–1 line of all the isotopologues was detected in awide range of velocities with a good signal-to-noise ratio (i.e. >4),we use it to determine the CS (2–1) line opacity as a function ofvelocity. For this aim, we assumed the following abundance ratios:12C/13C=75, 32S34S=22, 32S/33S=138 (Wilson & Rood 1994; Chinet al. 1996). Fig. 4 shows the opacity the CS (2–1) transition as afunction of velocity, obtained from the C32S/C34S and 12CS/13CSratios. We found τ ∼ 0.05 at VLSR of −7.5 km s−1 (the highestvelocity in which the line ratio is >2σ ), while τ ∼ 1 at the cloudvelocity. With these information, we conclude that the CS emissionis at most moderately optically thick (i.e. τ < 2), and at the outflowvelocities (VLSR < −6 km s−1) there is evidence for optically thinCS emission. Fig. 4 also shows the excitation temperature (Tex–Tbg), uncorrected for beam filling (ff), and as a function of velocity(discussed in Section 4).
The IRAM-30m CS (3–2) map integrated between VLSR of −21to +5 km s−1, shown in Fig. 1, traces the large-scale CS gas structureof B1 and B2, being consistent with previous results by Bachilleret al. (2001). As shown by Benedettini et al. (2013), the interfer-ometric data recovers most of the emission at the highest negativevelocities (100 per cent at VLSR < −6 km s−1), while it loses a con-siderable fraction of the emission (∼40 per cent) around the cloudvelocity (see Benedettini et al. 2013 for details). Thus, the total in-tegrated emission observed in the interferometric map shown in thelower panel of Fig. 1 is dominated by the high-velocity structures.As shown below, the information provided by this map will allowus to constrain the physical conditions obtained from our multilineCS analysis.
3.2 CS spectral line components
Thanks to the high signal-to-noise ratio of the ASAI data, we haveanalysed the profiles of the CS transitions from J = 2–1 up to J =7–6 following the approach of Lefloch et al. (2012). Fig. 5 shows theline profiles of the CS transitions J = 2–1 up to J = 7–6 on a linear-logarithmic scale. We identify two physical components, whoseintensity–velocity distributions can be fitted with an exponentiallaw I(v) ∝ exp( − |v/v0|) with the same slope at all J, but differingrelative intensities.
MNRAS 446, 3346–3355 (2015)
at AK
DE
NIZ
UN
IV on D
ecember 21, 2014
http://mnras.oxfordjournals.org/
Dow
nloaded from

The density structure of the L1157 outflow 3349
Table 2. Transitions, parameters, and integrated intensities of the CS and isotopologues lines observed.
Transition(a) ν0 Eu Telescope HPBW Beff Feff Tpeak
MB(b) Vmin, Vmax
∫TMBdv(d)
(GHz) (K) (arcsec) (K) (km s−1) (K km s−1)
12C32S
2–1 97.980 95 7 IRAM 26 0.80 0.95 2.45(0.002) −19, 6 17.283–2 146.969 03 14 IRAM 17 0.74 0.93 2.96(0.004) −19, 6 21.035–4 244.935 56 35 IRAM 10 0.56 0.94 2.34(0.004) −16, 6 17.626–5 293.91209 49 IRAM 9 0.45 0.88 1.61(0.006) −16, 6 12.677–6 342.882 85 65 IRAM 7 0.35 0.82 0.96(0.026) −16, 3 7.4010–9 489.751 04 129 HIFI 44 0.73 0.96 0.06(0.008) −4, 3 0.3811–10 538.689 00 155 HIFI 39 0.73 0.96 0.04(0.006) −5, 3 0.3412–11 587.616 49 183 HIFI 36 0.72 0.96 0.03(0.009) −3, 4 0.25
12C34S
2–1 96.412 95 7 IRAM 26 0.80 0.95 0.15(0.001) −14, 4 1.123–2 144.617 10 14 IRAM 17 0.74 0.93 0.16(0.002) −13, 4 1.165–4 241.016 08 35 IRAM 10 0.57 0.94 0.11(0.003) −10, 4 0.776–5 289.209 07 49 IRAM 9 0.46 0.88 0.05(0.007) −7, 3 0.397–6 337.396 45 50 IRAM 7 0.35 0.82 <0.08(c) – –10–9 481.915 86 96 HIFI 44 0.73 0.96 <0.05(c) – –11–10 530.071 22 115 HIFI 40 0.73 0.96 <0.05(c) – –12–11 578.216 05 135 HIFI 37 0.72 0.96 <0.05(c) – –
13C32S
2–1 92.494 30 7 IRAM 26 0.80 0.95 0.05(0.002) −15, 5 0.343–2 138.739 33 13 IRAM 17 0.74 0.93 0.06(0.003) −11, 4 0.435–4 231.220 99 33 IRAM 10 0.58 0.94 0.03(0.003) −10, 4 0.256–5 277.455 40 47 IRAM 9 0.46 0.88 <0.02(c) – –11–10 508.528 14 146 HIFI 42 0.73 0.96 <0.03(c) – –
12C33S
2–1 97.172 06 6 IRAM 26 0.80 0.95 0.02(0.002) −11, 4 0.153–2 145.155 53 12 IRAM 17 0.74 0.93 0.03(0.003) −7, 4 0.255–4 242.913 61 28 IRAM 10 0.56 0.94 0.02(0.004) −7, 3 0.126–5 291.485 93 39 IRAM 9 0.46 0.88 <0.02(c) – –
Notes: (a)Transition properties are taken from the Cologne Database for Molecular Spectroscopy: Muller et al. (2005). (b)Inparenthesis the rms (σ ) per channel width (�v) of 1.4 km s−1, except for the 6–5 lines with �v ∼ 2.1 km s−1. (c)3σ upperlimit. (d)The integrated area between Vmin, Vmax (see Section 3.1).
For J = 6–5 and J = 7–6, the intensity–velocity distribution inthe line profiles is well fitted by a single exponential law of theform I(v) ∝ exp ( − |v/v0|), with v0 = 4.4 km s−1 for velocities inthe range ≈−18–0 km s−1. This component dominates the emissionbetween −20 and −8 km s−1 in the other CS transitions. Its contri-bution to each transition can be obtained from a simple scaling tothe J = 7–6 line profiles. After removing the contribution of thiscomponent, an emission excess is observed in the J = 2–1, J = 3–2and J = 5–4 transitions, which is detected only at velocities between−8 km s−1 and +2 km s−1. As shown in Fig. 6, the emission excessis well fitted by a second exponential law I(v) ∝ exp ( − |v/2.5|),hence with an exponent different from that of the first CS compo-nent. This second component contributes to about half of the totalflux emitted in the J = 2–1 and J = 3–2 (see Section 4 and Table 3).The lower panels in Fig. 5 show the simultaneous two componentsfit to the line 2–1, 3–2, and 5–4 profiles. Important to note is thatthe crossing point between the two components shift back and forthfrom the 2–1 to the 5–4 transition. The latter can in part be dueto the higher uncertainties in the fitting of the emission excess, inwhich we usually have fewer channels than for the first component(see Fig. 6) to make the fit. The uncertainty of the fitted ordinateof this second component is up to ∼23 per cent and therefore closeto the intensity contrast between the 2–1 and 3–2 emission of this
component (3–2 is about 28 per cent stronger than 2–1). Alterna-tively, this behaviour can also be due to excitation, in this case withthe emission peak of the second component in the 3–2 transition.Finally, weak contamination from the reference position may un-derestimate the emission close to the ambient velocity, contributingto the apparent shift. Unfortunately, with the present data it is notpossible to disentangle between these possibilities. However, due toour method to obtain the fluxes of this second component (Section4), the above-mentioned uncertainty does not affect significantlythe analysis of its emission.
The high signal-to-noise ratio of the line profiles of the C34SJ = 2–1, J = 3–2, and J = 5–4 permits a similar analysis ofthe intensity–velocity distribution. Like for the high-J CS transi-tions, we find that the C34S (5–4) line profile is well fitted byone single exponential law I(v) ∝ exp ( − |v/4.4|). An emissionexcess is observed between −8 and +2 km s$−1$ in the lowerJ transitions, which is well fitted by the second exponential lawI(v) ∝ exp ( − |v/2.5|). Like for CS, the spectral slope of both com-ponents in C34S is independent of the transitions considered, whichimplies excitation conditions independent of the velocity. Therefore,the profile analysis of C34S yields results similar to CS.
Because of the lower signal-to-noise of the data, it was notpossible to analyse the intensity–velocity distribution of the CS
MNRAS 446, 3346–3355 (2015)
at AK
DE
NIZ
UN
IV on D
ecember 21, 2014
http://mnras.oxfordjournals.org/
Dow
nloaded from

3350 A. I. Gomez-Ruiz et al.
Figure 2. Spectra of the CS main isotope transitions detected by IRAM-30m and Herschel-HIFI at L1157-B1. Indicated by labels are the corre-sponding rotational transition, the upper level energy of the transition (Eu),and the instrument. The three lowest panels also show a zoom in of thewings. The dashed vertical line indicates the cloud Vsys of +2.6 km s−1
(Bachiller & Perez Gutierrez 1997).
transitions observed in the HIFI range. As discussed in Section 4,the emission of these transitions arises from a region of higher ex-citation than the I(v) ∝ exp ( − |v/4.4|) and I(v) ∝ exp ( − |v/2.5|)components observed with the IRAM 30-m telescope.
3.3 Origin of the emission
In Fig. 7, we compare the CS (3–2) profile obtained at the IRAM30-m telescope with that obtained at the PdBI (Benedettini et al.2013) when integrating the emission over the region covered by thesingle-dish main-beam. While the IRAM-30m profile is fitted, asdiscussed above, with a linear combination of the two exponentialcomponents, the spectrum derived from the interferometer is wellfitted by the first ∝ exp ( − |v/4.4|) component only (convolving thesame PdBI map to an even larger beam, Benedettini et al. 2013 alsofound the first component dominating the 3–2 spectrum). Since mostof the high-velocity emission is recovered by the interferometer
Figure 3. Spectra of the CS isotopologues transitions detected by IRAM-30m at L1157-B1 (in TMB scale). Each panel indicates the correspondingrotational transition. The vertical dashed line indicates the cloud velocity(Vsys = +2.6 km s−1).
Figure 4. The CS opacity as calculated from the C32S/C34S (2–1) and12CS/13CS (2–1) line ratios (black and red histograms, respectively). Bluetriangles show the excitation temperature calculated from opacity (not cor-rected for beam filling factor, i.e. (Tex–Tbg) × ff). The dashed line indicatesthe cloud velocity as in Fig. 2 (Vsys = +2.6 km s−1).
(see Section 3.1), we conclude that the latter map traces the wholeemission from the first CS component, and that this emission arisesfrom the walls of the B1 cavity. The size of the first CS component is� 18 arcsec, as derived from the PdBI image. We conclude that thelow-velocity emission, associated with the I(v) ∝ exp ( − |v/2.5|)component is filtered out by the interferometer, suggesting a largersize for this component.
Furthermore, the spectral signatures of the two CS componentsare found similar (i.e same slope) to those of the components g2 andg3 detected in CO by Lefloch et al. (2012), which these authors as-sociated with the B1 and B2 cavities, respectively. As a conclusion,
MNRAS 446, 3346–3355 (2015)
at AK
DE
NIZ
UN
IV on D
ecember 21, 2014
http://mnras.oxfordjournals.org/
Dow
nloaded from

The density structure of the L1157 outflow 3351
Figure 5. Exponential fits to the CS transitions. The componentsI(v) ∝ exp ( − |v/4.4|) and I(v) ∝ exp ( − |v/2.5|) are shown by the redand black lines, respectively; while their linear combination is indicated bythe dashed magenta line. These exponential components correspond to theg2 and g3 components, respectively, found by Lefloch et al. (2012) in theCO emission.
the emission of the dense gas, as traced by CS and its isotopomers,arise from the outflow cavities associated with B1 and B2. For thesake of consistency with our previous work, in what follows, wewill refer to the first and second CS component, respectively, as g2
and g3. Also, for consistency with the CO analysis, we will adopt atypical size of 25 arcsec for g3.
4 PH Y S I C A L C O N D I T I O N S O F TH E G A S
The fluxes used for this analysis are determined as follows.First, we use the g2-dominated CS (7–6) line profile to obtain the
g2 contribution to the low-J CS lines. To produce the g2 profiles,we scaled the CS (7–6) high-velocity intensity to the intensity ofthe high-velocity emission of the low-J CS transitions. This method
Figure 6. The emission excess, after removing the emission from the firstcomponent ( ∝ exp ( − |v/4.4|)). The black line shows the fit of a secondexponential component I(v) ∝ exp ( − |v/2.5|).
Table 3. CS velocity-integrated intensities of the components g1,g2, and g3, used in the LVG calculations.
Line HPBW∫
TMBdv (K km s−1)(a)
(arcsec) g(b)1 g
(b)2 g
(b)3 g
(c)1 g
(c)2 g
(c)3
12C32S
2–1 26 – 8.7 8.4 – 10.7 9.93–2 17 – 9.8 11.7 – 8.8 11.25–4 10 – 13.1 4.9 – 6.0 3.56–5 9 – 9.9 – – 4.3 –7–6 7 – 8.1 – – 3.1 –10–9 44 0.39 – – 0.64 – –11–10 39 0.33 – – 0.51 – –12–11 36 0.28 – – 0.43 – –
12C34S
2–1 26 – 0.37 0.74 – 0.46 0.873–2 17 – 0.54 0.61 – 0.49 0.585–4 10 – 0.77 – – 0.35 –6–5 9 – 0.39 – – 0.17 –
Notes: (a)Obtained from Gaussian fits (see Section 4). (b)At theoriginal HPBW. (c)Estimated in a 20 arcsec HPBW.
implicitly assumes optically thin emission (as indeed supported byour analysis in Section 3.1) and therefore that the line shape is thesame for all the transitions.
Secondly, the g3 spectra were subsequently produced by subtract-ing the g2 spectra from the original low-J CS profiles (i.e. the g3
component is the residual). The g2 and g3 contributions of the C34S
MNRAS 446, 3346–3355 (2015)
at AK
DE
NIZ
UN
IV on D
ecember 21, 2014
http://mnras.oxfordjournals.org/
Dow
nloaded from
3352 A. I. Gomez-Ruiz et al.
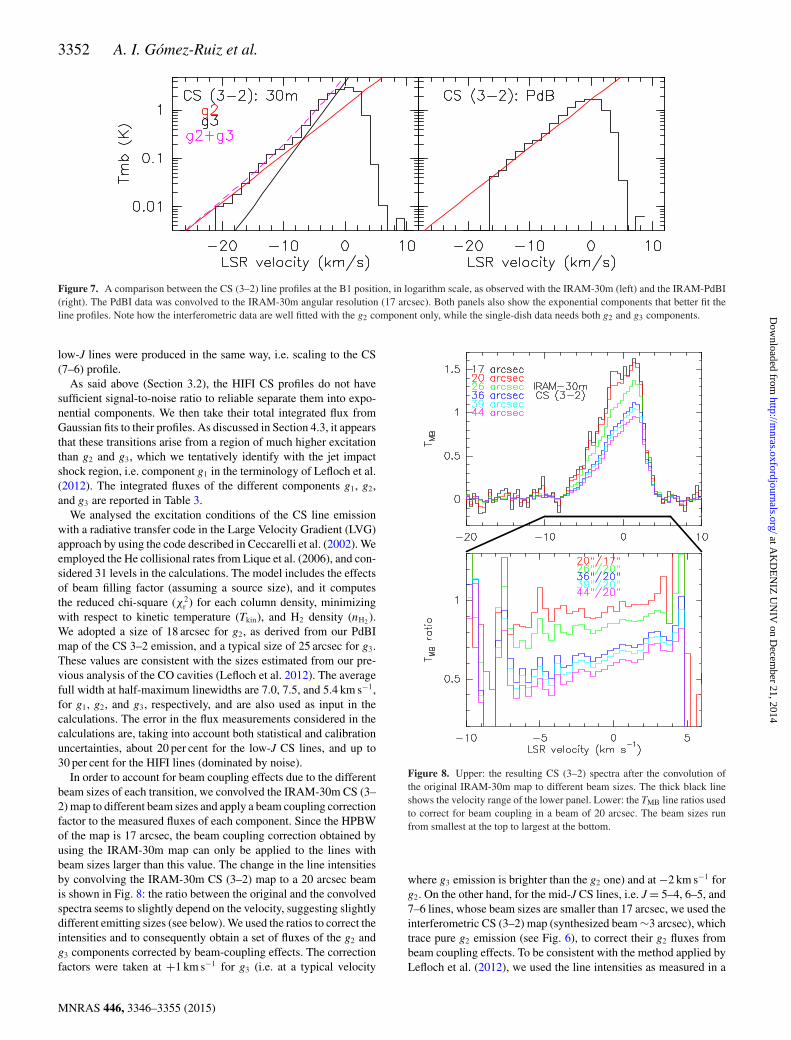
Figure 7. A comparison between the CS (3–2) line profiles at the B1 position, in logarithm scale, as observed with the IRAM-30m (left) and the IRAM-PdBI(right). The PdBI data was convolved to the IRAM-30m angular resolution (17 arcsec). Both panels also show the exponential components that better fit theline profiles. Note how the interferometric data are well fitted with the g2 component only, while the single-dish data needs both g2 and g3 components.
low-J lines were produced in the same way, i.e. scaling to the CS(7–6) profile.
As said above (Section 3.2), the HIFI CS profiles do not havesufficient signal-to-noise ratio to reliable separate them into expo-nential components. We then take their total integrated flux fromGaussian fits to their profiles. As discussed in Section 4.3, it appearsthat these transitions arise from a region of much higher excitationthan g2 and g3, which we tentatively identify with the jet impactshock region, i.e. component g1 in the terminology of Lefloch et al.(2012). The integrated fluxes of the different components g1, g2,and g3 are reported in Table 3.
We analysed the excitation conditions of the CS line emissionwith a radiative transfer code in the Large Velocity Gradient (LVG)approach by using the code described in Ceccarelli et al. (2002). Weemployed the He collisional rates from Lique et al. (2006), and con-sidered 31 levels in the calculations. The model includes the effectsof beam filling factor (assuming a source size), and it computesthe reduced chi-square (χ2
r ) for each column density, minimizingwith respect to kinetic temperature (Tkin), and H2 density (nH2 ).We adopted a size of 18 arcsec for g2, as derived from our PdBImap of the CS 3–2 emission, and a typical size of 25 arcsec for g3.These values are consistent with the sizes estimated from our pre-vious analysis of the CO cavities (Lefloch et al. 2012). The averagefull width at half-maximum linewidths are 7.0, 7.5, and 5.4 km s−1,for g1, g2, and g3, respectively, and are also used as input in thecalculations. The error in the flux measurements considered in thecalculations are, taking into account both statistical and calibrationuncertainties, about 20 per cent for the low-J CS lines, and up to30 per cent for the HIFI lines (dominated by noise).
In order to account for beam coupling effects due to the differentbeam sizes of each transition, we convolved the IRAM-30m CS (3–2) map to different beam sizes and apply a beam coupling correctionfactor to the measured fluxes of each component. Since the HPBWof the map is 17 arcsec, the beam coupling correction obtained byusing the IRAM-30m map can only be applied to the lines withbeam sizes larger than this value. The change in the line intensitiesby convolving the IRAM-30m CS (3–2) map to a 20 arcsec beamis shown in Fig. 8: the ratio between the original and the convolvedspectra seems to slightly depend on the velocity, suggesting slightlydifferent emitting sizes (see below). We used the ratios to correct theintensities and to consequently obtain a set of fluxes of the g2 andg3 components corrected by beam-coupling effects. The correctionfactors were taken at +1 km s−1 for g3 (i.e. at a typical velocity
Figure 8. Upper: the resulting CS (3–2) spectra after the convolution ofthe original IRAM-30m map to different beam sizes. The thick black lineshows the velocity range of the lower panel. Lower: the TMB line ratios usedto correct for beam coupling in a beam of 20 arcsec. The beam sizes runfrom smallest at the top to largest at the bottom.
where g3 emission is brighter than the g2 one) and at −2 km s−1 forg2. On the other hand, for the mid-J CS lines, i.e. J = 5–4, 6–5, and7–6 lines, whose beam sizes are smaller than 17 arcsec, we used theinterferometric CS (3–2) map (synthesized beam ∼3 arcsec), whichtrace pure g2 emission (see Fig. 6), to correct their g2 fluxes frombeam coupling effects. To be consistent with the method applied byLefloch et al. (2012), we used the line intensities as measured in a
MNRAS 446, 3346–3355 (2015)
at AK
DE
NIZ
UN
IV on D
ecember 21, 2014
http://mnras.oxfordjournals.org/
Dow
nloaded from

The density structure of the L1157 outflow 3353
Figure 9. The χ2r distribution for the g1, g2, and g3 components (dot–
dashed blue, dashed red, and black line, respectively). The valid solutionregion is delimited by the contour χ2
r = 1. For g1 and g2, χ2r contours are
1, 0.5, and 0.2; while for g3 are 1 and 0.83 (min χ2r ).
Table 4. Physical parameters constrained by the CSlines.
Component Size(a) N(CS) nH2
(arcsec) (cm−2) (cm−3)
g1 10 1 ×10¹³ > 106
g2 18 8 ×10¹³ 105–106
g3 25 8 ×10¹³ 0.5–2 × 10⁵
Note: (a)Based on the CS (3–2) interferometric mapand CO results (see Sections 3.3 and 4.3).
beam of 20 arcsec. The fluxes of each component with and withoutthe coupling factor corrections are shown in Table 3.
The solutions for the LVG analysis are presented in Fig. 9 as χ2
plots in the Tkin versus n plane. These solutions are discussed herefor each component, and the physical conditions constrained by theCS lines are summarized in Table 4.
4.1 The g3 (L1157-B2) cavity
The g3 component was analysed using the J = 2–1 and 3–2 tran-sitions of the CS and C34S isotopologues. We find valid solutions(i.e. χ2
r = 1) for source sizes larger than 20 arcsec. Adopting asource size of 25 arcsec (see Section 3.3), the total CS columndensity is then 8 × 1013 cm−2, and an H2 volume density in therange of 0.5 – 2 ×105 cm−3 (see Fig. 9). Taking into account thetemperature range constrained by CO, 20–30 K (best fit: 23 K;Lefloch et al. 2012), the H2 volume density of g3 can be furtherconstrained to ∼1 × 105 cm−3. Using the source-averaged col-umn density N(CO) = 1 × 1017 cm−2 (found for g3 by Leflochet al. 2012), and assuming [CO]/[H2] = 10−4, we can derive theCS abundance: X(CS) �8 × 10⁻⁸. This value (i) is in agree-ment with the abundance estimate by Bachiller (2001) and Tafallaet al. (2010), who derived ∼10−7, using the Local ThermodynamicEquilibrium (LTE) approximation, for the low-velocity regime(–3.5 ≤ V ≤ +0.5 km s−1) of the low-J CS emission towards L1157-B1, and (ii) is about one order of magnitude larger than what quoted
by Bachiller et al. (2001) towards the position of the driving pro-tostar L1157-mm (3 × 10⁻⁹), thus confirming that the X(CS) canincrease in the shocked material located along the cavities.
In addition, we can derive a rough measure of the excitationtemperatures from the (Tex–Tbg) × ff product derived from the 12CSand 13CS J = 2–1 spectra and plotted in Fig. 4. With the assumedsize of 25 arcsec, and consequently correcting the J = 2–1 emissionfor the filling factor ff, we have Tex � 7–8 K in the –2,0 km s−1
range; in other words we find a sub-thermal regime (Tkin ∼23 K),consistently with a J = 2–1 critical density �106 cm−3, which isslightly larger than what found in the LVG analysis (few 105 cm−3).
4.2 The g2 (L1157-B1) cavity
We have first attempted to model the emission of all the lines fromJ = 2 to 12, after subtracting the g3 contribution. We could notfind any set of physical conditions (i.e. no valid χ2) that accountssimultaneously for the low-J CS lines detected with IRAM andthose detected with Herschel (J = 10–9, 11–10, and 12–11). As weshow hereafter, we found however that the separate analysis of theIRAM and Herschel lines leads to solutions fully consistent withthe previous observations of the region.
We have then modelled the low- and mid-J lines detected atmillimetre and submillimetre wavelengths, adopting a typical sizeof 18 arcsec as derived from the interferometric map of the J = 3–2 emission. We find column densities of ∼8 × 1013 cm−2 andH2 volume densities in the range of 105–106 cm−3 (see Fig. 9).These results are fully consistent with the physical conditions ing2, as derived from CO (Lefloch et al. 2012). Fig. 10 reports thebest fit for the spectral line energy distribution for the C32S andC34S emission of g2 (red line). Taking into account the temperaturerange constrained by CO, 60–80 K (best fit: 63 K; Lefloch et al.2012), the density range from CS can be further constrained to∼1–5×105 cm−3. Using again the source-averaged CO column
Figure 10. The CS and C34S spectral line energy distribution (data pointswith error bars) and a three components model with the g1 (dot–dashed blueline), g2 (dashed red line), and g3 (black line) components. The sum of thecomponents is indicated by the thick magenta line. For g3, assuming a sizeof 25 arcsec (Lefloch et al. 2012), the best fit gives N(CS) = 8 × 1013 cm−2,nH2 = 2×105 cm−3, and Tkin = 30 K. For g2, assuming a size of 18 arcsec(see Fig. 1), the best fit gives N(CS) = 8 × 1013 cm−2, nH2 = 2×105 cm−3,and Tkin = 90 K. For g1, assuming a size of 10 arcsec (Lefloch et al.2012; Busquet et al. 2014), the best fit reports N(CS) = 1 × 1013 cm−2,nH2 = 2 × 107 cm−3, and Tkin = 90 K.
MNRAS 446, 3346–3355 (2015)
at AK
DE
NIZ
UN
IV on D
ecember 21, 2014
http://mnras.oxfordjournals.org/
Dow
nloaded from

3354 A. I. Gomez-Ruiz et al.
density (∼1017 cm−2), we find a X(CS) of 8 × 10⁻⁸ (i.e. similar tothat found towards g3).
We notice, in addition, that the CS column densities and H2
volume densities for this component is within the range of valuesreported, based on the analysis of the interferometric CS (2–1) and(3–2) maps, by Benedettini et al. (2013) for some of the high-velocity clumps. In particular, the high-velocity clumps B1a andB1b (both within our beam) are reported with N(CS)= 2–8 ×1013 cm−2 and nH2 = 0.2–5 × 105 cm−3 (table 3 in Benedettiniet al. 2013). The similar physical conditions and the fact that the in-terferometric data alone trace mostly the g2 component (see Fig. 7)suggest that at least the high-velocity part of the g2 emission isrelated with the B1a and B1b clumps.
4.3 The high-excitation CS emission
We analysed separately the flux of the transitions detected with HIFI.We have adopted a typical size of ∼10 arcsec for the emitting region,bearing in mind that the actual size does not influence the densityand temperature derived from the LVG modelling provided that thelines are optically thin. Our LVG calculations yield column densitiesof ∼1013 cm−2 and H2 volume densities nH2 > 1 × 106 cm−3 (seeFig. 9), and indicates that the three transitions are optically thin.
The analysis of the CO and H2O line emission in L1157-B1(Lefloch et al. 2012; Busquet et al. 2014) has shown evidencefor a region (with a typical size of ∼10 arcsec) of dense and hotgas (nH2 > 106 cm−3, < italic > Tk < /italic >� 250 K) associ-ated with the impact of the protostellar jet against the B1 cavity.Based on the similarity of the physical conditions, we propose thatthe high-J CS lines are tracing the jet shock impact region.
Taking into account the constrain on the g1 kinetic temperaturegiven by the CO and H2O observations (Lefloch et al. 2012; Bus-quet et al. 2014) of 200–300 K (best fit: 210 K), the volume densityof the g1 component can be further constrained to 1–5 × 106 cm−3.Fig. 10 reports the best fit for the spectral line energy distribution forthe g1 emission (blue line). According to this model, the integratedlow-J CS emission from g1 would be at least an order of magni-tude smaller than the error bars reported for the total CS emission,and two orders of magnitude weaker than the combined g2 andg3 contribution. The integrated low-J CS emission from g1 wouldthen be hidden by the stronger g2 and g3 contributions in our data.Also, using the predicted CS (2–1) integrated intensity of g1, ∼121mK (Fig. 10), and assuming the intensity–velocity relationship∝ exp(−|v/12.5|) found in CO for the g1 component (Lefloch et al.2012), we can predict the g1 intensity at the velocities where theg2 and g3 emission is not significant in the CS (2–1) spectrum, i.e.< italic > v < /italic >< −20 km s−1. With the relationship ob-tained, < italic > I(v) < /italic >= 0.012895 ∗ exp(−| < italic >
v < /italic > /12.5|), at < italic > v < /italic >= −20 km s−1
the expected intensity is ∼2.6 mK (hence <3σ detection limit;see Table 2), making the g1 component undetectable for < italic >
v < /italic >≤ −20 km s−1 even in the strongest low-J CS lines.Comparing with N(CO) = 1 × 1016 cm−2, we derive the CS abun-
dance in g1 X(CS) � 1 × 10⁻⁷, which is not very different fromthe values found for g2 and g3. The overall X(CS) measurementsare consistent with the values found by Tafalla et al. (2010), whoanalysed the molecular content of two prototypical jet-driven out-flows such as L1448 and IRAS 04166+2706, reporting a velocity-dependent CS abundance which increases at most one order ofmagnitude. In addition, we compared the inferred CS abundanceswith the prediction made by Podio et al. (2014) by computing the
chemical evolution of the gas (from steady-state abundances to en-hanced values produced by compression/heating of a shock wave) atthe density and temperature of the cavities in L1157-B1. To modelthe emission of several molecular ions, these authors assumed thatthe OCS is released from the dust icy mantles due to dust grainsputtering. Their observations are matched by a model in which atthe shock age ∼2000–4000 yr the X(OCS) is enhanced up to val-ues ≥ 2 × 10⁻⁶. For their best-fitting model (X(OCS) = 6 × 10⁻⁶),the abundance of CS is ∼10−7. This value is in good agreementwith the overall CS abundances inferred here.
5 SU M M A RY A N D C O N C L U S I O N S
In this paper, we have presented a CS multiline study based on dataobtained with Herschel-HIFI and IRAM-30m at L1157-B1, withinthe framework of the CHESS and ASAI surveys. The main resultsare summarized as follows.
(i) We have detected 12C32S, 12C34S, 13C32S, for a total of 18transitions, with Eu up to ∼180 K. The unprecedented sensitivity ofthe survey allows us to carefully analyse the line profiles, revealinghigh-velocity emission, up to 20 km s−1 with respect to the systemicvelocity. With the use of the isotopologues, we confirmed that theemission is optically thin at the outflow velocities (τ ∼ 0.05 at−7.5 km s−1, while τ ∼ 1 at the cloud velocity).
(ii) The profiles can be well fitted by a combination of two expo-nential laws that are remarkably similar to what previously foundusing CO. These components have been related to the cavity wallsproduced by the ∼2000 yr B1 shock (called g2) and the older(∼4000 yr) B2 shock (g3), respectively. Previous CO observationsallowed us to derive the kinetic temperatures, i.e. 23 K and 64 K forg3 and g2, respectively. Using the LVG approximation, we can nowput severe constrains on volume density: both the B1 and B2 largecavities are associated with nH2 � 1–5 × 105 cm−3. In addition, thehigh-excitation (Eu ≥ 130 K) CS lines provide us with the signa-ture of warm (∼200–300 K) and dense (nH2 = 1–5 × 106 cm−3)gas, associated with a molecular reformation zone of a dissociativeJ-type shock (previously detected using [OI], [FeII], CO and H2O)and expected to arise where the so far unrevealed precessing jetimpacts the molecular cavity.
(iii) Our analysis confirms that the CS abundance in shocks in-crease up to 0.8–1 × 10⁻⁷, i.e. more than one order of magnitudewith respect to what is found in the hosting cloud, in agreementwith the prediction of the model obtained via the chemical code As-trochem. Such enhancement is possibly due to the release of OCSfrom dust grain mantles, as suggested by Wakelam et al. (2004),Codella et al. (2005), and, more recently by Podio et al. (2014).
AC K N OW L E D G E M E N T S
We thank the anonymous referee for the detailed comments whichhelped to improve the clarity of this paper. We are grateful to S.Cabrit for useful discussion and suggestions. The Italian authorsgratefully acknowledge the support from the Italian Space Agency(ASI) through the contract I/005/011/0, which also provided thefellowships of A.I Gomez-Ruiz and G. Busquet. GB is supportedby the Spanish MICINN grant AYA2011-30228-C03-01 (co-fundedwith FEDER funds). HIFI has been designed and built by a con-sortium of institutes and university departments from across Eu-rope, Canada and the United States under the leadership of SRONNetherlands Institute for Space Research, Groningen, The Nether-lands and with major contributions from Germany, France and the
MNRAS 446, 3346–3355 (2015)
at AK
DE
NIZ
UN
IV on D
ecember 21, 2014
http://mnras.oxfordjournals.org/
Dow
nloaded from

The density structure of the L1157 outflow 3355
US. Consortium members are: Canada: CSA, U. Waterloo; France:CESR, LAB, LERMA, IRAM; Germany: KOSMA, MPIfR, MPS;Ireland: NUI Maynooth; Italy: ASI, IFSI-INAF, Osservatorio As-trofisico di Arcetri-INAF; The Netherlands: SRON, TUD; Poland:CAMK, CBK; Spain: Observatorio Astronomico Nacional (IGN),Centro de Astrobiologıa (CSIC-INTA). Sweden: Chalmers Uni-versity of Technology - MC2, RSS & GARD; Onsala Space Ob-servatory; Swedish National Space Board, Stockholm University -Stockholm Observatory; Switzerland: ETH Zurich, FHNW; USA:Caltech, JPL, NHSC.
R E F E R E N C E S
Bachiller R., Perez Gutierrez M., 1997, ApJ, 487, L93Bachiller R., Perez Gutierrez M., Kumar M. S. N., Tafalla M., 2001, A&A,
372, 899Benedettini M. et al., 2007, MNRAS, 381, 1127Benedettini M. et al., 2012, A&A, 539, L3Benedettini M. et al., 2013, MNRAS, 436, 179Busquet G. et al., 2014, A&A, 561, A120Ceccarelli et al., 2010, A&A, 521, L22Ceccarelli C. et al., 2002, A&A, 383, 603Chin Y.-N., Henkel C., Whiteoak J. B., Langer N., Churchwell E. B., 1996,
A&A, 305, 960Codella C., Bachiller R., Benedettini M., Caselli P., Viti S., Wakelam V.,
2005, MNRAS, 361, 244Codella C. et al., 2009, A&A, 507, L25Codella C. et al., 2010, A&A, 518, L112Codella C. et al., 2012a, ApJ, 744, 164Codella C. et al., 2012b, ApJ, 757, L9Codella A., Viti S., Ceccarelli C., Lefloch B., 2013, ApJ, 776, 52Gomez-Ruiz A., Hirano N., Leurini S., Liu S.-Y., 2013, A&A, 558, 96
Gueth F., Guilloteau S., Bachiller R., 1996, A&A, 307, 891Gueth F., Guilloteau S., Bachiller R., 1998, A&A, 333, 287Lefloch B. et al., 2010, A&A, 518, L113Lefloch B. et al., 2012, ApJ, 757, L25Looney L. W., Tobin J. J., Kwon W., 2007, ApJ, 670, L131Muller H. S. P., Schloder F., Stutzki J., Winnewisser G., 2005, J. Mol. Struct.,
742, 215Neufeld D. A. et al., 2009, ApJ, 706, 170Nisini B., Giannini T., Neufeld D. A., Yuan Y., Antoniucci S., Bergin E. A.,
Melnick G. J., 2010, ApJ, 724, 69Ott S., 2010, in Mizumoto Y., Morita K.-I., Ohishi M., eds, ASP Conf.
Ser. Vol. 434, Astronomical Data Analysis Software and Systems XIX.Astron. Soc. Pac., San Francisco, p. 139
Podio L., Lefloch B., Ceccarelli C., Codella C., Bachiller C., 2014, A&A,565, 64
Tafalla M., Bachiller R., 1995, ApJ, 443, L37Tafalla M., Santiago-Garcıa J., Hacar A., Bachiller R., 2010, A&A, 522,
A91Tobin J. J., Hartmann L., Looney L. W., Chiang H.-F., 2010, ApJ, 712, 1010van der Tak F. F. S., Black J. H., Schoier F. L., Jansen D. J., van Dishoeck
E. F., 2007, A&A, 468, 627Wakelam V., Caselli P., Ceccarelli C., Herbst E., Castets A., 2004, A&A,
422, 159Wakelam V., Ceccarelli C., Castets A., Lefloch B., Loinard L., Faure A.,
Schneider N., Benayoun J.-J., 2005, A&A, 437, 149Wilson T. L., Rood R., 1994, ARA&A, 32, 191Zhang Q., Ho P. T. P., Wright M. C. H., Wilner D. J., 1995, ApJ, 451, L71Zhang Q., Ho P. T. P., Wright M. C. H., 2000, AJ, 119, 1345
This paper has been typeset from a TEX/LATEX file prepared by the author.
MNRAS 446, 3346–3355 (2015)
at AK
DE
NIZ
UN
IV on D
ecember 21, 2014
http://mnras.oxfordjournals.org/
Dow
nloaded from