the decline of regular order in appropriations: does …nmccarty/appropriations.pdf · the decline...
TRANSCRIPT
The Decline of Regular Order in
Appropriations: Does It Matter?∗
Nolan McCarty†
December 12, 2014
Abstract
Key Words: appropriations process
∗I thank Jeff Jenkins, Eric Patashnik, and the participants from the conference on Congress and PolicyMaking in the 21st Century.†Susan Dod Brown Professor of Politics and Public Affairs, Woodrow Wilson School, Princeton Uni-
versity, Princeton, NJ 08544 Email: [email protected]
1 Introduction
Political scientists often teach a very idealized version of the congressional budget and
appropriation process known as the “Regular Order.” As codified in the Congressional
Budget and Impoundment Control Act of 1974, the process should unfold in a very precise
way. The president initiates the process by presenting a budget request for the following
fiscal year on or before the first Monday in February. The action then moves to Congress
where the House and Senate pass budget resolutions that contain spending allocations,
known as 302(a), for each appropriation jurisdiction. According to the textbook, the House
and Senate then will use a conference committee to iron out any cross-chamber differences.
Following the passage of the budget resolution, appropriation committees formulate 302(b)
suballocations for each subcommittee that then produces its own appropriation bill. These
proposals come to floor as individual bills that contain only appropriations. Any House-
Senate differences in their respective appropriation bills are ironed out in conference. After
conference reports are passed, the president signs them into law well before the beginning
of the fiscal year on October 1.1
But over the past several years, the process is best described as the “Regular Disorder.”
The president often misses the early February target for his budget request. With increas-
ing frequency, the House and Senate fail to pass a budget resolution. Even when both
chambers pass budget resolutions, conference committees are rarely convened so that the
differences between the two resolutions are never reconciled. Over the past decade, very
few appropriations bills have passed before the beginning of the fiscal year. More com-
monly, governmental activities are funded for many months through continuing resolutions
(CRs). Occasionally, all federal spending for an entire year is provided under CRs. When
appropriation bills do pass, they are often packaged together as omnibus bills that are nego-
1The fiscal year began on July 1 until 1977. See Tollestrup (2013) for a thorough discussion of theseprocedures.
1
tiated by party leaders and the president, thus circumventing the role of the appropriation
committees. These omnibus bills have increasingly become vehicles for non-appropriation
legislative initiatives.
In this chapter, I examine trends in what I will call the procedural fiscal performance
of Congress and the president. In doing so, I evaluate several hypotheses about why the
regular order in Congressional budgeting and appropriations has fallen into disuse. While
the question has many angles and dimensions, I consider three aspects. First, I consider
changes in the use of presidential budgets and congressional budget resolutions. When do
presidents make their proposals? Do the House and Senate pass and reconcile resolutions?
Then I consider the timing of the passage of appropriations bills and the use of continuing
resolutions. Why is Congress more frequently tardy in passing appropriations and to what
extent have continuing resolutions and omnibus bills become a substitute for the traditional
12 or 13 stand-alone appropriations.
Finally, I take up the question of the extent to which the decline of regular order
has affected fiscal outcomes. Has the more irregular process undermined the ability of
Congress and the President to manage the government’s finances? Has it created more
policy uncertainty that detracts from government performance and spooks private economic
actors?
2 Some Hypotheses
There has been very little systematic work exploring why adherence to the regular order
in fiscal policy making has declined so markedly. Many scholars, however, have noted
substantial changes in a wide array of congressional practices that can be attributed to
heightened levels of partisanship and ideological conflict in Congress.2 But most of this
2Mann and Ornstein (2006), McCarty, Poole and Rosenthal (2006), McCarty (2007), Smith (2010), andSinclair (2006).
2
work has focused on general legislative procedures and has not focused specifically on
budget and appropriations processes.
In fact, there has been relatively little recent work on Congressional budget and ap-
propriation politics. An important exception is Woon and Anderson (2012) who study the
determinants of the timing of the passage of appropriation bills. Their focus, however,
is using appropriation delay to test the implications of several policy bargaining models
whereas mine is on how congressional performance has changed over time. Nevertheless,
their study is extremely useful in addressing the declining adherence to the regular order.
Several of Woon and Anderson’s hypotheses suggest plausible mechanisms for the increased
propensity of Congress to miss budgetary and appropriation deadlines.3
Their basic framework is a bargaining model with incomplete information. Such models
predict that bargaining between pivotal actors may fail to produce a timely agreement if
the preferences of those political actors diverge significantly.4 Such a prediction suggests a
connection between appropriation delay and rising levels of political polarization. Rising
polarization leads to greater divergence between the President and Congress during divided
government and greater divergence across chambers and appropriation committees when
there is split party control of Congress. Moreover, due to the cloture rule in the Senate,
appropriation gridlock may be larger as a result of polarization even during unified party
government.5
Woon and Anderson also argue that budget enforcement rules such as those contained in
the Balanced Budget and Emergency Deficit Control Act of 1985 (aka the Gramm-Rudman-
Hollings bill) and the Budget Enforcement Act of 1990 help facilitate timely completion of
3In a recent paper, (Hanson 2013) argues that the Senate leaders of weak majority parties will departfrom the regular order by combing several appropriation bills into an omnibus package. Such a maneuverhelps insulate the package from minority party amendments. He does not, however, connect his theory tothe central concern of this paper - delayed passage of appropriation bills.
4See (Cameron 2000) and (Cameron and McCarty 2004) for a discussion and other applications of policybargaining with incomplete information.
5See Krehbiel (1998) and McCarty (2007).
3
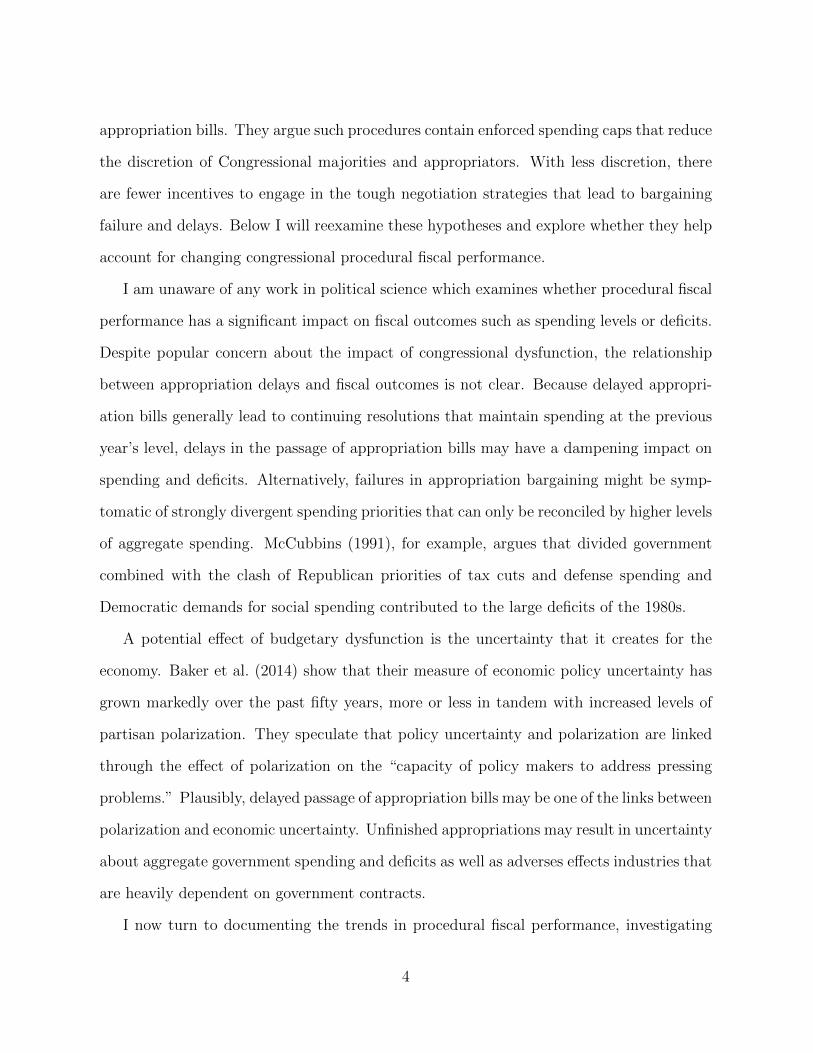
appropriation bills. They argue such procedures contain enforced spending caps that reduce
the discretion of Congressional majorities and appropriators. With less discretion, there
are fewer incentives to engage in the tough negotiation strategies that lead to bargaining
failure and delays. Below I will reexamine these hypotheses and explore whether they help
account for changing congressional procedural fiscal performance.
I am unaware of any work in political science which examines whether procedural fiscal
performance has a significant impact on fiscal outcomes such as spending levels or deficits.
Despite popular concern about the impact of congressional dysfunction, the relationship
between appropriation delays and fiscal outcomes is not clear. Because delayed appropri-
ation bills generally lead to continuing resolutions that maintain spending at the previous
year’s level, delays in the passage of appropriation bills may have a dampening impact on
spending and deficits. Alternatively, failures in appropriation bargaining might be symp-
tomatic of strongly divergent spending priorities that can only be reconciled by higher levels
of aggregate spending. McCubbins (1991), for example, argues that divided government
combined with the clash of Republican priorities of tax cuts and defense spending and
Democratic demands for social spending contributed to the large deficits of the 1980s.
A potential effect of budgetary dysfunction is the uncertainty that it creates for the
economy. Baker et al. (2014) show that their measure of economic policy uncertainty has
grown markedly over the past fifty years, more or less in tandem with increased levels of
partisan polarization. They speculate that policy uncertainty and polarization are linked
through the effect of polarization on the “capacity of policy makers to address pressing
problems.” Plausibly, delayed passage of appropriation bills may be one of the links between
polarization and economic uncertainty. Unfinished appropriations may result in uncertainty
about aggregate government spending and deficits as well as adverses effects industries that
are heavily dependent on government contracts.
I now turn to documenting the trends in procedural fiscal performance, investigating
4
the hypotheses behind its deterioration, and evaluating its consequences.
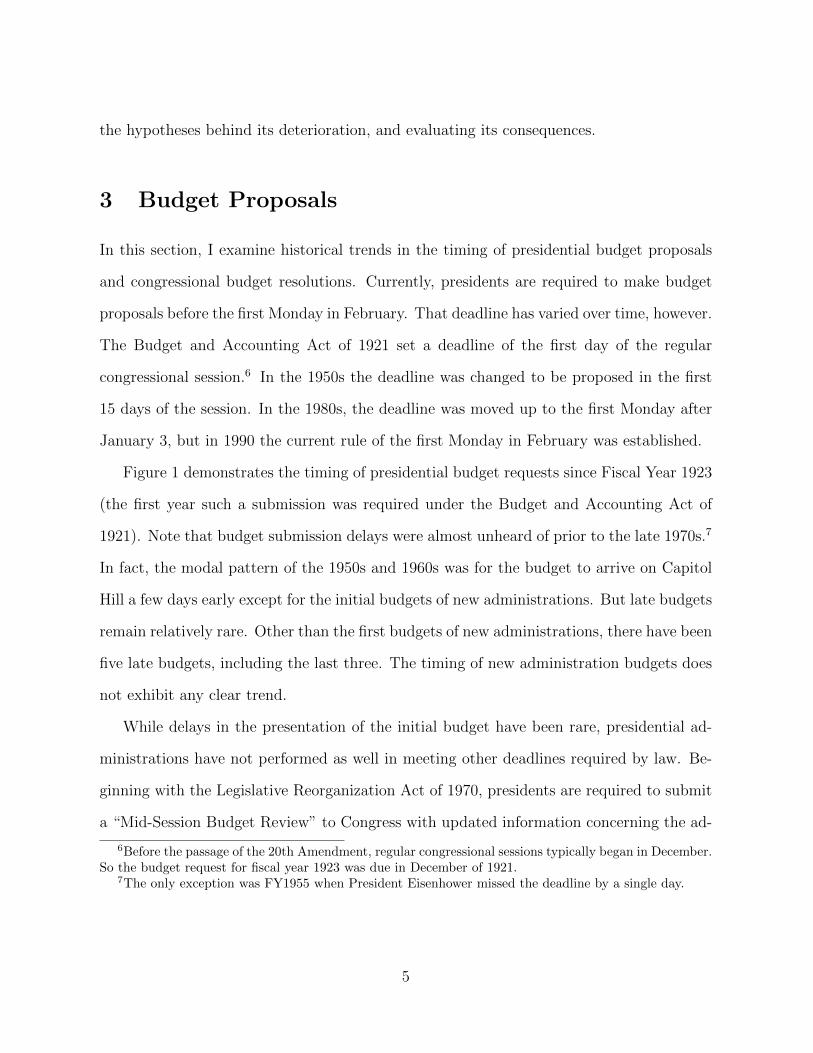
3 Budget Proposals
In this section, I examine historical trends in the timing of presidential budget proposals
and congressional budget resolutions. Currently, presidents are required to make budget
proposals before the first Monday in February. That deadline has varied over time, however.
The Budget and Accounting Act of 1921 set a deadline of the first day of the regular
congressional session.6 In the 1950s the deadline was changed to be proposed in the first
15 days of the session. In the 1980s, the deadline was moved up to the first Monday after
January 3, but in 1990 the current rule of the first Monday in February was established.
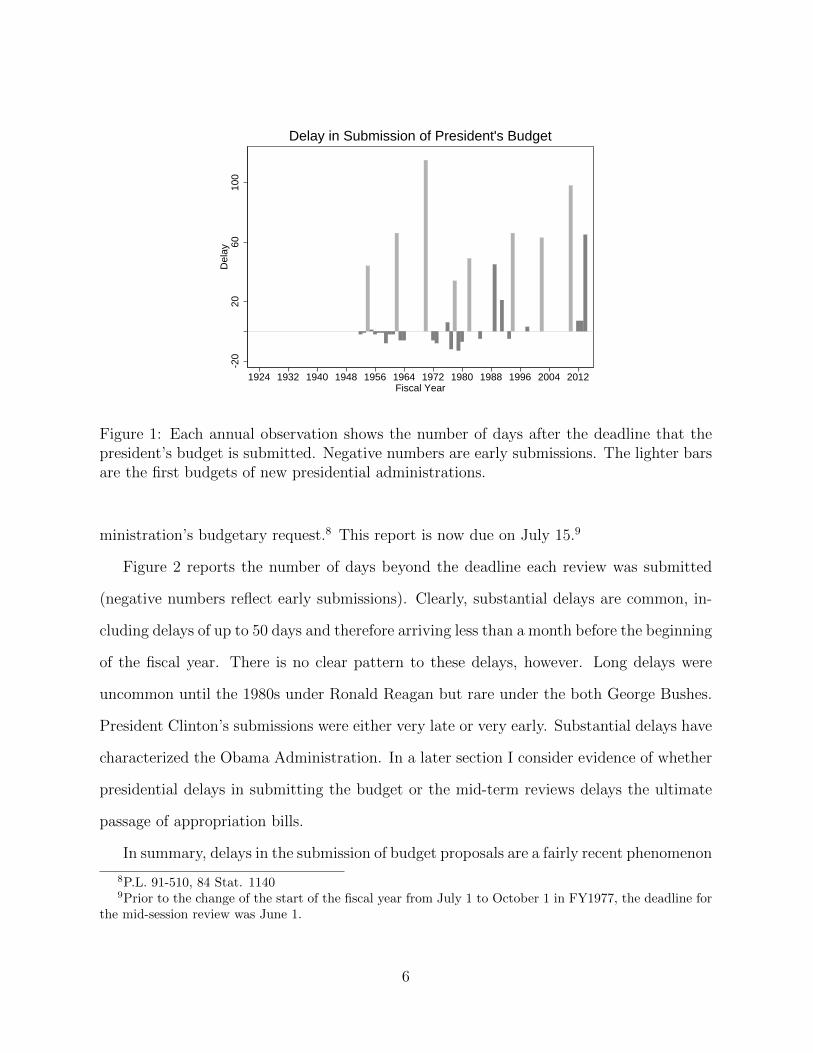
Figure 1 demonstrates the timing of presidential budget requests since Fiscal Year 1923
(the first year such a submission was required under the Budget and Accounting Act of
1921). Note that budget submission delays were almost unheard of prior to the late 1970s.7
In fact, the modal pattern of the 1950s and 1960s was for the budget to arrive on Capitol
Hill a few days early except for the initial budgets of new administrations. But late budgets
remain relatively rare. Other than the first budgets of new administrations, there have been
five late budgets, including the last three. The timing of new administration budgets does
not exhibit any clear trend.
While delays in the presentation of the initial budget have been rare, presidential ad-
ministrations have not performed as well in meeting other deadlines required by law. Be-
ginning with the Legislative Reorganization Act of 1970, presidents are required to submit
a “Mid-Session Budget Review” to Congress with updated information concerning the ad-
6Before the passage of the 20th Amendment, regular congressional sessions typically began in December.So the budget request for fiscal year 1923 was due in December of 1921.
7The only exception was FY1955 when President Eisenhower missed the deadline by a single day.
5
-20
2060
100
Del
ay
1924 1932 1940 1948 1956 1964 1972 1980 1988 1996 2004 2012Fiscal Year
Delay in Submission of President's Budget
Figure 1: Each annual observation shows the number of days after the deadline that thepresident’s budget is submitted. Negative numbers are early submissions. The lighter barsare the first budgets of new presidential administrations.
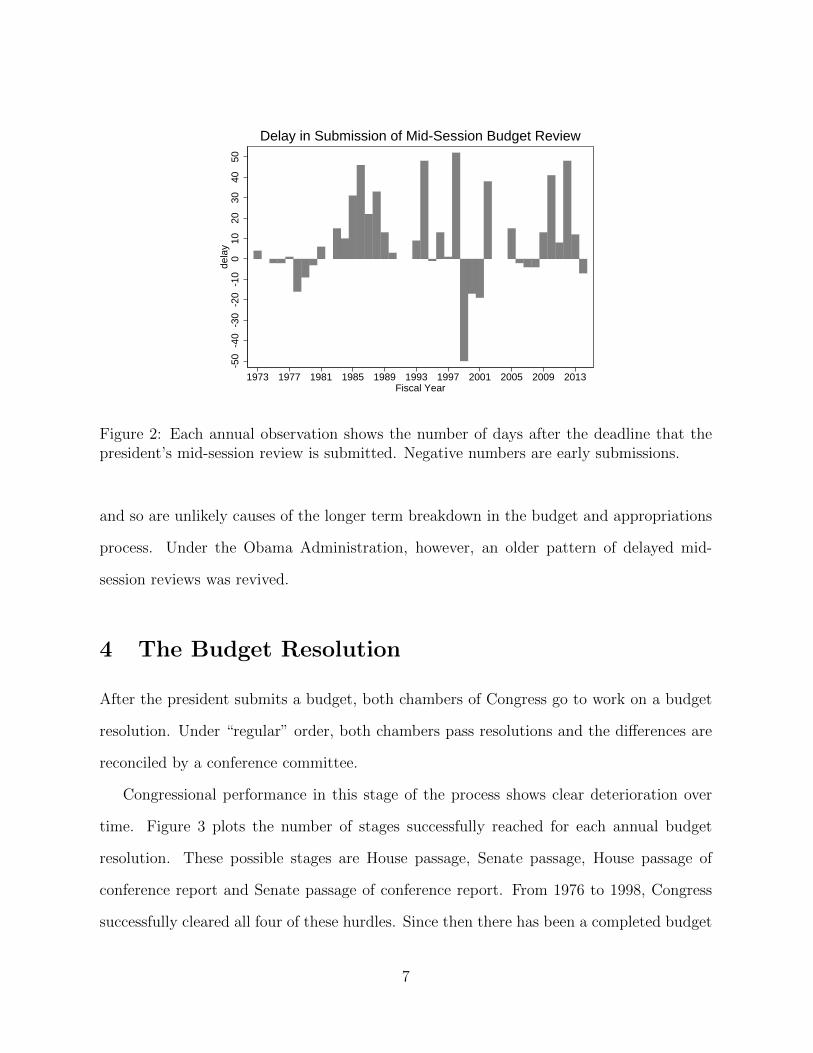
ministration’s budgetary request.8 This report is now due on July 15.9
Figure 2 reports the number of days beyond the deadline each review was submitted
(negative numbers reflect early submissions). Clearly, substantial delays are common, in-
cluding delays of up to 50 days and therefore arriving less than a month before the beginning
of the fiscal year. There is no clear pattern to these delays, however. Long delays were
uncommon until the 1980s under Ronald Reagan but rare under the both George Bushes.
President Clinton’s submissions were either very late or very early. Substantial delays have
characterized the Obama Administration. In a later section I consider evidence of whether
presidential delays in submitting the budget or the mid-term reviews delays the ultimate
passage of appropriation bills.
In summary, delays in the submission of budget proposals are a fairly recent phenomenon
8P.L. 91-510, 84 Stat. 11409Prior to the change of the start of the fiscal year from July 1 to October 1 in FY1977, the deadline for
the mid-session review was June 1.
6
-50
-40
-30
-20
-10
010
2030
4050
dela
y
1973 1977 1981 1985 1989 1993 1997 2001 2005 2009 2013Fiscal Year
Delay in Submission of Mid-Session Budget Review
Figure 2: Each annual observation shows the number of days after the deadline that thepresident’s mid-session review is submitted. Negative numbers are early submissions.
and so are unlikely causes of the longer term breakdown in the budget and appropriations
process. Under the Obama Administration, however, an older pattern of delayed mid-
session reviews was revived.
4 The Budget Resolution
After the president submits a budget, both chambers of Congress go to work on a budget
resolution. Under “regular” order, both chambers pass resolutions and the differences are
reconciled by a conference committee.
Congressional performance in this stage of the process shows clear deterioration over
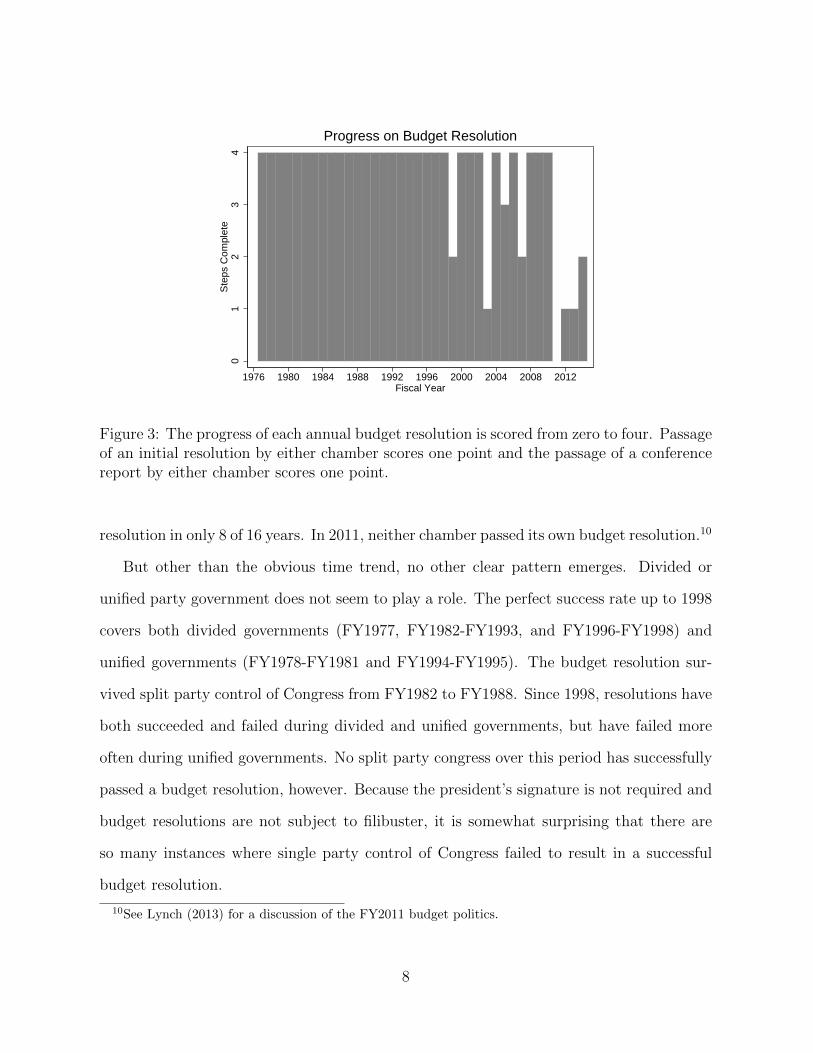
time. Figure 3 plots the number of stages successfully reached for each annual budget
resolution. These possible stages are House passage, Senate passage, House passage of
conference report and Senate passage of conference report. From 1976 to 1998, Congress
successfully cleared all four of these hurdles. Since then there has been a completed budget
7
01
23
4S
teps
Com
plet
e
1976 1980 1984 1988 1992 1996 2000 2004 2008 2012Fiscal Year
Progress on Budget Resolution
Figure 3: The progress of each annual budget resolution is scored from zero to four. Passageof an initial resolution by either chamber scores one point and the passage of a conferencereport by either chamber scores one point.
resolution in only 8 of 16 years. In 2011, neither chamber passed its own budget resolution.10
But other than the obvious time trend, no other clear pattern emerges. Divided or
unified party government does not seem to play a role. The perfect success rate up to 1998
covers both divided governments (FY1977, FY1982-FY1993, and FY1996-FY1998) and
unified governments (FY1978-FY1981 and FY1994-FY1995). The budget resolution sur-
vived split party control of Congress from FY1982 to FY1988. Since 1998, resolutions have
both succeeded and failed during divided and unified governments, but have failed more
often during unified governments. No split party congress over this period has successfully
passed a budget resolution, however. Because the president’s signature is not required and
budget resolutions are not subject to filibuster, it is somewhat surprising that there are
so many instances where single party control of Congress failed to result in a successful
budget resolution.
10See Lynch (2013) for a discussion of the FY2011 budget politics.
8
5 Appropriation Bills
Under the “regular order,” appropriators go to work to allocate funds according to the
budget resolution.11
If appropriation bills are not passed by the beginning of the fiscal year, Congress and the
president must agree to a continuing resolution (CR) or face a government shutdown such
as the ones that occurred in 1995-1996 and 2013. Generally, CRs continue the funding
levels of the previous fiscal year, but many also include some modifications of spending
levels. CRs often contain changes to the authorizing statutes, and because they are often
“must” pass legislation, unrelated legislation is often attached.12
Consequently, delays in the passage of appropriation bills and the resulting “governing
by CR” has drawn wide concern. Late appropriation bills are said to create budgetary
uncertainty for government agencies and private actors, reduce the ability to adjust to
new spending priorities, undermine the role of committee expertise, and weaken fiscal
governance.13
In this section, I consider the factors that lead to delayed passage of appropriation
bills. Woon and Anderson (2012) conduct a very similar analysis, but the analyses differ
in substantial ways reflecting different research concerns. Woon and Anderson (2012) use
delay in appropriations to test a general theory of policy bargaining, whereas I am primarily
concerned with explaining longer term changes in congressional behavior. Nevertheless, I
draw heavily on their insights.
11If a chamber has not passed its budget resolution, it may pass a “deeming resolution” which containstemporary 302(a) allocations. See Lynch (2013). In 2011, the Senate passed neither a budget nor a deemingresolution.
12See Tollestrup (2013) p. 21 and White (1988).13See White (1988), Devins (1988) and Hanson (2013).
9
5.1 Appropriation Delays
To measure the trends in the propensity to begin a fiscal year without completed appropri-
ation bills, I compiled data on each regular appropriation bill for FY1974 to FY2013 from
http://thomas/loc.gov and http://www.gpo.gov. To measure delay, I simply compare
the date of final passage with the start date of the fiscal year. I consider an appropria-
tion bill to have passed if it is signed by the president as a stand-alone appropriation bill
or as a separate title of an omnibus appropriation bill. Thus, I do not count continuing
resolutions that set fund levels for the remainder of the fiscal year. This is a departure
from Woon and Anderson (2012). Because they are interested in measuring the duration
of bargaining, they sensibly count year-long CRs as the culmination of the negotiations for
the fiscal year. I, on the other hand, am interested in compliance with the regular order.
So it is important to draw a distinction between passing appropriation bills and finishing
the fiscal year under a CR. There are, however, some difficult coding decisions. In FY1987
and FY1988, omnibus appropriation bills were passed in the form of a CR so that changes
to authorizing legislation to be included. I continue to count these as CRs rather than
successful appropriation bills since the procedures deviated from the regular order.
My data is based on 512 possible appropriation bills from FY1974 to FY2013.14 Of
these, 408 were passed as stand-alone or omnibus appropriation bills. That leaves 104
“failures” – appropriation jurisdictions that were funded by CRs for the entire fiscal year.
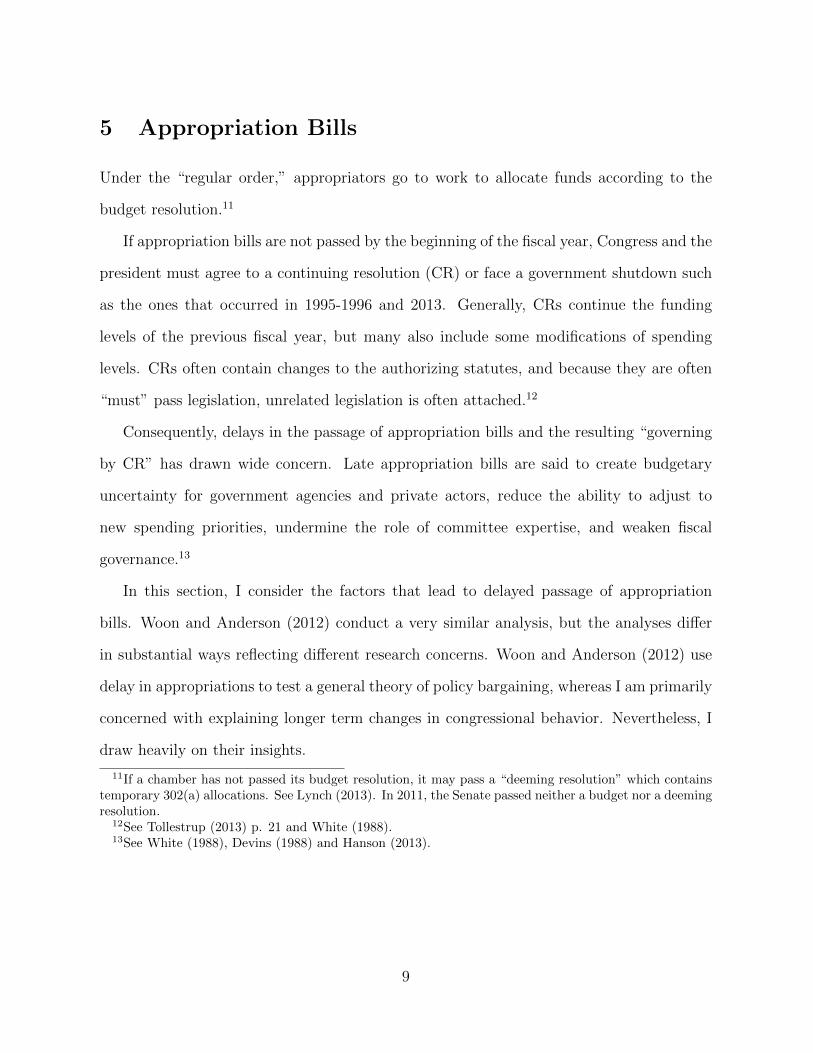
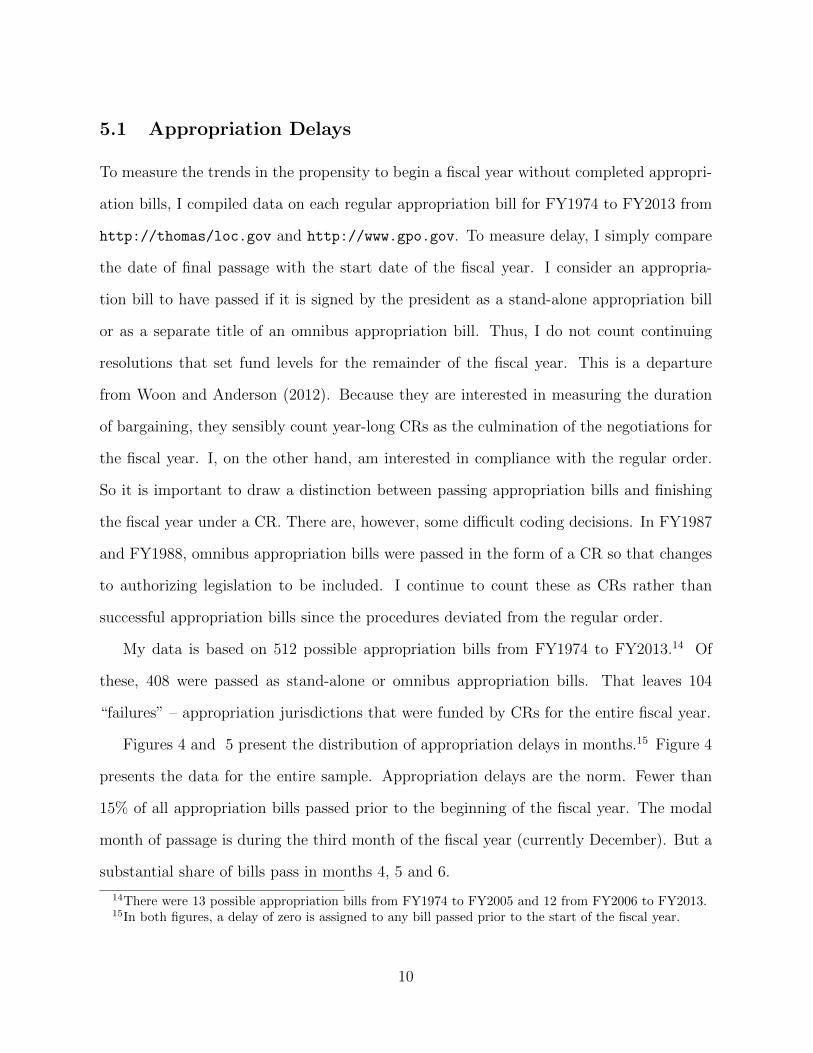
Figures 4 and 5 present the distribution of appropriation delays in months.15 Figure 4
presents the data for the entire sample. Appropriation delays are the norm. Fewer than
15% of all appropriation bills passed prior to the beginning of the fiscal year. The modal
month of passage is during the third month of the fiscal year (currently December). But a
substantial share of bills pass in months 4, 5 and 6.
14There were 13 possible appropriation bills from FY1974 to FY2005 and 12 from FY2006 to FY2013.15In both figures, a delay of zero is assigned to any bill passed prior to the start of the fiscal year.
10
0.1
.2.3
.4D
ensi
ty
0 2 4 6 8 10Months
Distribution of Delays in Successful Appropriation Bills
Figure 4: Distribution of Delays in Suc-cessful Appropriation Bills: 1974 -2013
0.1
.2.3
.4D
ensi
ty
0 2 4 6 8 10Months
Post 2002Distribution of Delays in Successful Appropriation Bills
Figure 5: Distribution of Delays in Suc-cessful Appropriation Bills: 2002 -2013
Figure 5 shows the distribution of delays since 2002. Clearly, delays have become much
more common. Very few appropriation bills have been completed on time since 2002 and
the frequency of delays exceeding two months has gone up dramatically.
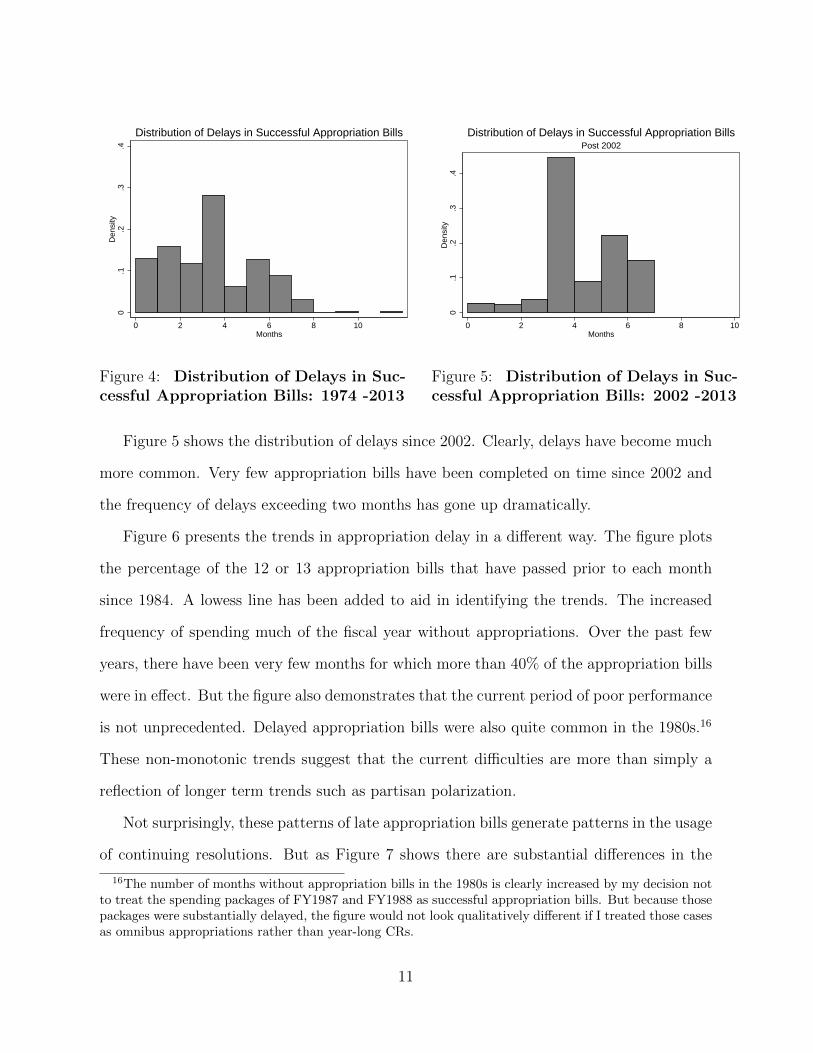
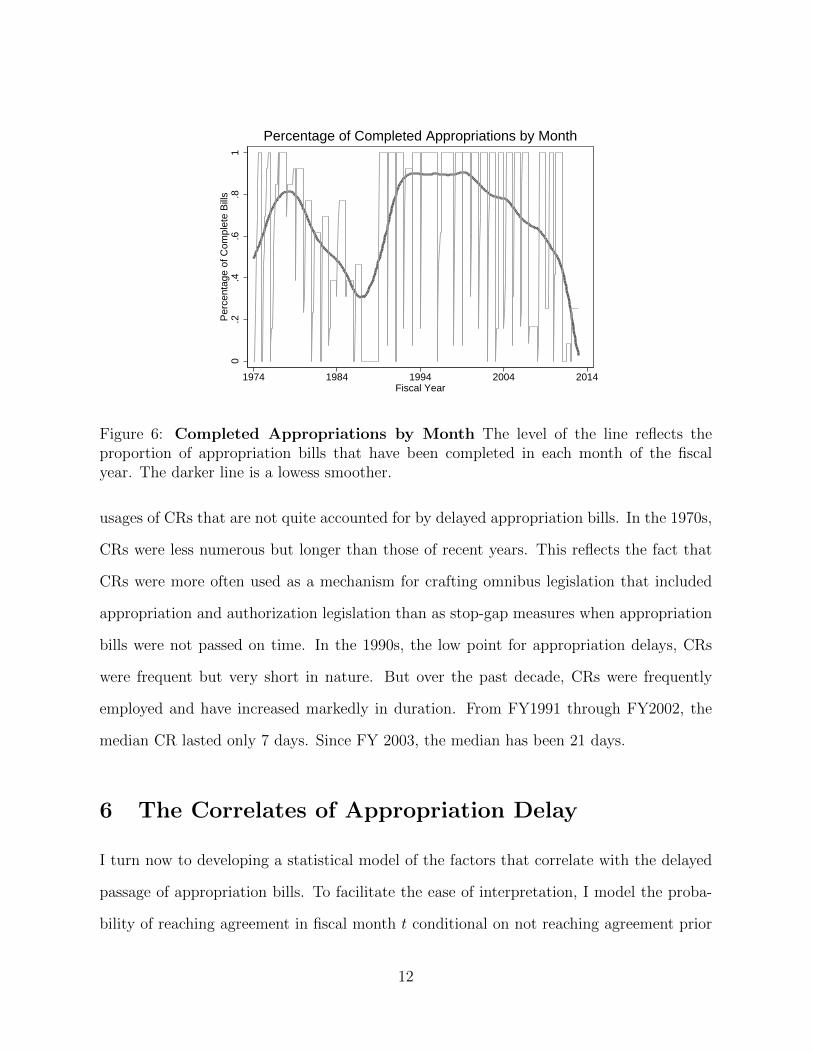
Figure 6 presents the trends in appropriation delay in a different way. The figure plots
the percentage of the 12 or 13 appropriation bills that have passed prior to each month
since 1984. A lowess line has been added to aid in identifying the trends. The increased
frequency of spending much of the fiscal year without appropriations. Over the past few
years, there have been very few months for which more than 40% of the appropriation bills
were in effect. But the figure also demonstrates that the current period of poor performance
is not unprecedented. Delayed appropriation bills were also quite common in the 1980s.16
These non-monotonic trends suggest that the current difficulties are more than simply a
reflection of longer term trends such as partisan polarization.
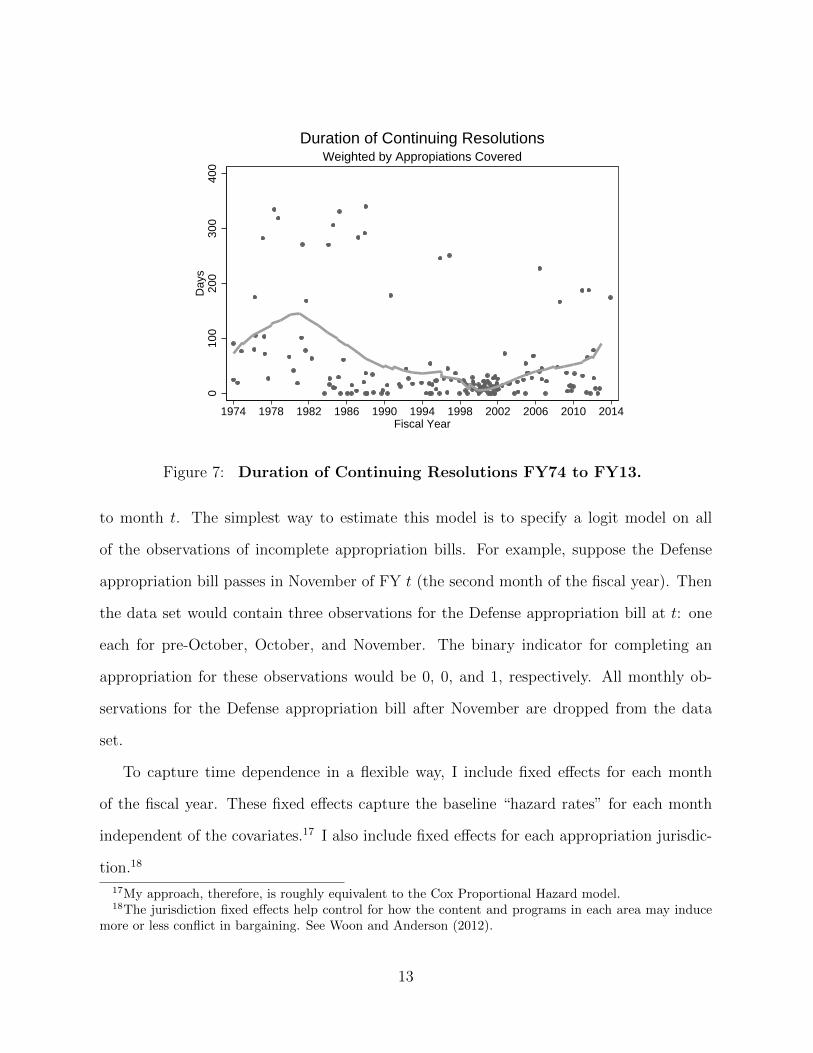
Not surprisingly, these patterns of late appropriation bills generate patterns in the usage
of continuing resolutions. But as Figure 7 shows there are substantial differences in the
16The number of months without appropriation bills in the 1980s is clearly increased by my decision notto treat the spending packages of FY1987 and FY1988 as successful appropriation bills. But because thosepackages were substantially delayed, the figure would not look qualitatively different if I treated those casesas omnibus appropriations rather than year-long CRs.
11
0.2
.4.6
.81
Per
cent
age
of C
ompl
ete
Bill
s
1974 1984 1994 2004 2014Fiscal Year
Percentage of Completed Appropriations by Month
Figure 6: Completed Appropriations by Month The level of the line reflects theproportion of appropriation bills that have been completed in each month of the fiscalyear. The darker line is a lowess smoother.
usages of CRs that are not quite accounted for by delayed appropriation bills. In the 1970s,
CRs were less numerous but longer than those of recent years. This reflects the fact that
CRs were more often used as a mechanism for crafting omnibus legislation that included
appropriation and authorization legislation than as stop-gap measures when appropriation
bills were not passed on time. In the 1990s, the low point for appropriation delays, CRs
were frequent but very short in nature. But over the past decade, CRs were frequently
employed and have increased markedly in duration. From FY1991 through FY2002, the
median CR lasted only 7 days. Since FY 2003, the median has been 21 days.
6 The Correlates of Appropriation Delay
I turn now to developing a statistical model of the factors that correlate with the delayed
passage of appropriation bills. To facilitate the ease of interpretation, I model the proba-
bility of reaching agreement in fiscal month t conditional on not reaching agreement prior
12
010
020
030
040
0D
ays
1974 1978 1982 1986 1990 1994 1998 2002 2006 2010 2014Fiscal Year
Weighted by Appropiations CoveredDuration of Continuing Resolutions
Figure 7: Duration of Continuing Resolutions FY74 to FY13.
to month t. The simplest way to estimate this model is to specify a logit model on all
of the observations of incomplete appropriation bills. For example, suppose the Defense
appropriation bill passes in November of FY t (the second month of the fiscal year). Then
the data set would contain three observations for the Defense appropriation bill at t: one
each for pre-October, October, and November. The binary indicator for completing an
appropriation for these observations would be 0, 0, and 1, respectively. All monthly ob-
servations for the Defense appropriation bill after November are dropped from the data
set.
To capture time dependence in a flexible way, I include fixed effects for each month
of the fiscal year. These fixed effects capture the baseline “hazard rates” for each month
independent of the covariates.17 I also include fixed effects for each appropriation jurisdic-
tion.18
17My approach, therefore, is roughly equivalent to the Cox Proportional Hazard model.18The jurisdiction fixed effects help control for how the content and programs in each area may induce
more or less conflict in bargaining. See Woon and Anderson (2012).
13
6.1 Preference Divergence
Woon and Anderson (2012) present a formal model and evidence that demonstrates that
appropriation bills are more likely to be delayed as a result of divergent preferences across
those who are negotiating. I will measure preference divergence in two ways. First, I use
“common space” DW-NOMINATE to compute measures of the preference differences across
chambers and branches.19 I use four separate measures: the average distance between the
House and Senate, the average distance between the House and President, the average
distance between the Senate and President, and the maximum of these distances. As a ro-
bustness check, I also use partisan indicators for preference divergence using measures such
as divided government and split party control of Congress. To capture the possibility that
the partisan indicators might represent greater divergence in recent years due to partisan
polarization, I interact them with polarization measured as the average distance between
the two parties in the House on the common space DW-NOMINATE scores.
6.2 Budgetary Enforcement Rules
Budget enforcement rules may also play a role in congressional performance on appropria-
tions. Rules may support prompt action on appropriations in a variety of ways. Rules that
reduce the discretion of appropriators may serve to minimize the probability of bargaining
failure by reducing the scope of conflict. Internal procedures may also provide incentives
for appropriation committees to be first- or last-movers depending on enforcement rules.
I test for the effects of two different budget enforcement regimes. The first is the Bal-
anced Budget and Emergency Deficit Control Act of 1985, better known by the names of
its Senate co-sponsors Gramm-Rudman-Hollings (GRH). The key mechanism underlying
GRH was specified deficit targets enforced by cross-the-board sequester. As a deficit cut-
19Poole (2000).
14
ting tool, GRH has generally been deemed a failure, but it did set a precedent for reducing
the discretion of appropriators.20. GRH may also have perversely enhanced the incen-
tives to delay reporting appropriation bills out of subcommittee. Former appropriations
subcommittee chair, David Obey warned
so long as Gramm-Rudman is on the books there is an incentive for every
committee around here not to bring their bill out to floor, because even if they
cut their own bill and meet the spending limitations required under a budget
resolution, that does not guarantee that every other committee will perform,
and so they can wind up having their bill cut twice.21
Therefore, any effect of GRH in reducing the scope of legislative conflict may have been
offset by this last-mover advantage. I include an indicator for fiscal years 1985 to 1990 to
capture the net effects of GRH.
Following the failure of the GRH mechanisms, Congress passed the Budget Enforcement
Act of 1990 (BEA 90 ). The BEA 90 had three important features: adjustable deficit
targets, annual limits on discretionary spending, and statutory ‘pay-as-you go’ (PAYGO)
rules that require offsetting tax increases or spending cuts for measures that increase the
deficit.22 The discretionary spending caps were renewed in 1993 and 1997. PAYGO was
extended in 1997, but ended in 2002. Therefore, I include an indicator for the fiscal years
1991 to 2002 to capture the effects of the BEA 90.
20Schick (2008)21134 CONG. REC. H68-69 (daily ed. Feb. 2, 1988) from Devins (1988).22Unlike legislative rules-based PAYGO which are enforced by points of order, statutory PAYGO mea-
sures are enforced by the Office of Management and Budget which is empowered to employ sequesters tooffset violations.
15
6.3 Fiscal and Economic Conditions
The timing of appropriation bills may also be influenced by current fiscal and economic
conditions. Large deficits may increase the salience of conflicts over spending priorities
and contribute to delayed passage. Conversely, periods of economic growth produce more
resources for the government and may lessen conflict over spending. To capture these
effects, I include two variables: the federal budget deficit from the previous year and the
GDP growth rate from the previous quarter. My expectation is that deficits reduce the
likelihood of passage in a given month while GDP growth increases it.
6.4 The President
I also include a number of controls to capture the presidential impact on the process. As
discussed above, presidents may be responsible for poor procedural performance by delaying
budgetary submissions and reports. So I include two variables measuring the number
of days the administration misses the deadline for the initial budget proposal and the
deadline for the mid-session review.23 Clearly, however, one must be careful in interpreting
the correlations between these variables and delayed appropriations as causal. Presidents
may delay proposals and reports based on expectations of conflict or there may be omitted
variables correlated with both delayed presidential action and delayed congressional action.
Presidential transitions may also affect the procedural fiscal performance. Such transi-
tions may be times of greater than normal policy change which may generate more conflict
and complexity in fiscal policy making. But transitions may also correspond to presiden-
tial “honeymoons” where deference to presidential priorities might facilitate quicker action
on appropriations. While I lack a clear prediction about the direction of the correlation,
I include an indicator for the first fiscal year of a new presidential administration. For
23Because these variables are highly skewed, I set all 0 and all negative values to 1 and take the naturallogs of number of days.
16
similar considerations, I also include an indicator for the six months prior to a presidential
election.
6.5 Results
Tables 1 and 2 report the estimates from the preference- and party-based models, respec-
tively. I begin with the preference model. In model 1, separate coefficients are estimated for
the distances between the House and Senate medians, the President and the House median,
and the distance between the President and the House median. When all three of these
distance measures are included, none are statistically significant. But because all of these
distance measures are highly correlated, multicollinearity is clearly an issue. Therefore,
models 2-4 include a single preference measure. In each model, the preference measure has
a statistically significant negative coefficient. To gauge the substantive magnitudes of these
effects, consider a appropriation bill that would have a monthly conditional probability of
passage of .5 at the minimum of the distance measure. Model 2 suggests that moving to
the maximum value of the House-Senate difference would reduce the monthly probability
of passage of that benchmark bill to .11. The respective values for the maximum values of
the President-House and President- Senate distances are .11 and .22. In model 5, I replace
the individual measures with the maximum of the three distances. The estimate of the
maximal difference has an effect almost equivalent to that of the President-House distance.
Table 2 presents results from the party model which are quite complementary. In model
6, the presence of a split party Congress or divided government reduces the likelihood of
successful passage. If an appropriation bill has a monthly probability of passage of .5 under
a single party congress (unified government), it has only a .28 (.33) probability under split
party control (divided government). Party polarization is also associated with a reduction in
the likelihood of passage. An appropriation bill that passed with .5 at the minimum level of
polarization is predicted to pass with probability of .30 at the maximum value. In model 7, I
17
add an interaction between divided government and polarization. This coefficient suggests
that polarization has enhanced the negative effect of divided government on procedural
performance.24 At the lowest level of polarization, the coefficient on divided government is
a negligible -.144 (a .03 effect at a baseline of probability of .5). But at the maximum value
of polarization, divided government leads to a .18 passage probability in situations where
unified government would have produced a .5 monthly passage probability. Unlike the
results using ideological distances, the estimated effects of party control and polarization
are not very robust to inclusion of the measures for presidential budget delays (models 8 and
9). This suggests that at least part of the impact of divided government and polarization
is produced by the president’s behavior on the mid-session review.
I turn now to the findings on budget enforcement rules. Like Woon and Anderson
(2012), I find that the Gramm-Rudman-Hollings procedures had no effect on procedural
performance. But I find a large and robust impact of the 1990 Budget Enforcement Act.
Based on these estimates, the effects of the BEA are large enough to raise the monthly
passage probability from .5 to more than .8. But we must be concerned about the possibility
that the BEA indicator is simply proxying for other unmeasured features of the 1990s.
To test this possibility, I consider a number of placebo dates by shifting the twelve year
window forward and backward from the actual dates of FY1991 to FY2002. Based on the
estimated log-likelihood and the magnitude of the placebo BEA coefficient, the best fitting
twelve year window is FY1989 to FY2000. That the improved performance came before
the BEA, suggests that factors other than the BEA may also have played a role in the
procedural performance of the 1990s.25
The estimated effects of fiscal and economic conditions are also quite consistent across
24Due to the multicollinearity generated by the interaction, the coefficient on the interaction effect fallsjust short of statistical significance. But divided government, polarization, and the interaction are highlysignificant jointly.
25Importantly, when the dates are backshifted two years, they capture the last two years of the GRHregime. So it is also possible that GRH had a lagged effect on procedural performance.
18
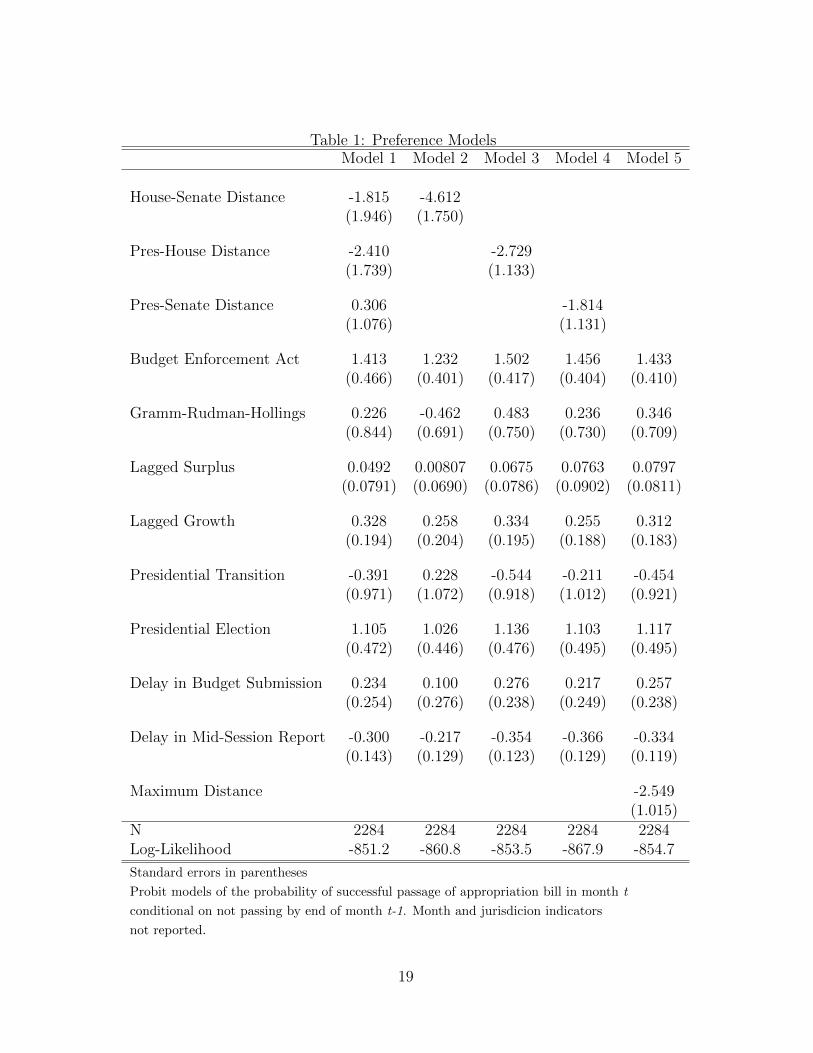
Table 1: Preference ModelsModel 1 Model 2 Model 3 Model 4 Model 5
House-Senate Distance -1.815 -4.612(1.946) (1.750)
Pres-House Distance -2.410 -2.729(1.739) (1.133)
Pres-Senate Distance 0.306 -1.814(1.076) (1.131)
Budget Enforcement Act 1.413 1.232 1.502 1.456 1.433(0.466) (0.401) (0.417) (0.404) (0.410)
Gramm-Rudman-Hollings 0.226 -0.462 0.483 0.236 0.346(0.844) (0.691) (0.750) (0.730) (0.709)
Lagged Surplus 0.0492 0.00807 0.0675 0.0763 0.0797(0.0791) (0.0690) (0.0786) (0.0902) (0.0811)
Lagged Growth 0.328 0.258 0.334 0.255 0.312(0.194) (0.204) (0.195) (0.188) (0.183)
Presidential Transition -0.391 0.228 -0.544 -0.211 -0.454(0.971) (1.072) (0.918) (1.012) (0.921)
Presidential Election 1.105 1.026 1.136 1.103 1.117(0.472) (0.446) (0.476) (0.495) (0.495)
Delay in Budget Submission 0.234 0.100 0.276 0.217 0.257(0.254) (0.276) (0.238) (0.249) (0.238)
Delay in Mid-Session Report -0.300 -0.217 -0.354 -0.366 -0.334(0.143) (0.129) (0.123) (0.129) (0.119)
Maximum Distance -2.549(1.015)
N 2284 2284 2284 2284 2284Log-Likelihood -851.2 -860.8 -853.5 -867.9 -854.7
Standard errors in parentheses
Probit models of the probability of successful passage of appropriation bill in month t
conditional on not passing by end of month t-1. Month and jurisdicion indicators
not reported.
19
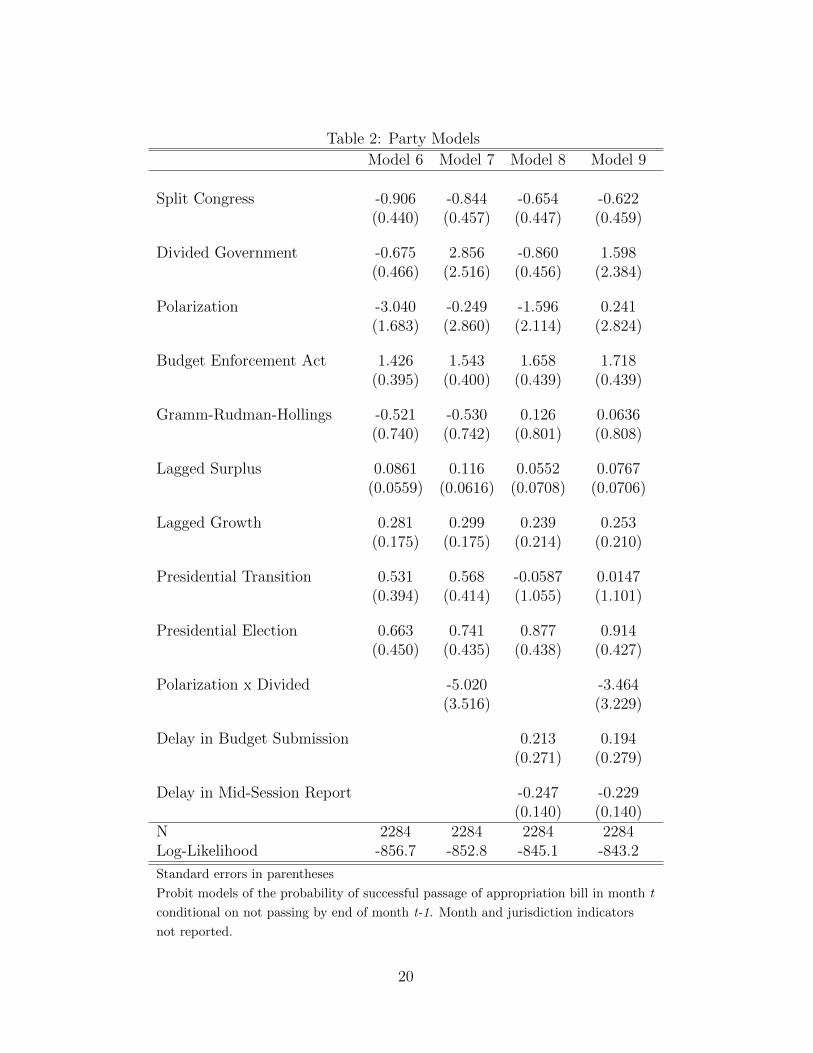
Table 2: Party Models
Model 6 Model 7 Model 8 Model 9
Split Congress -0.906 -0.844 -0.654 -0.622(0.440) (0.457) (0.447) (0.459)
Divided Government -0.675 2.856 -0.860 1.598(0.466) (2.516) (0.456) (2.384)
Polarization -3.040 -0.249 -1.596 0.241(1.683) (2.860) (2.114) (2.824)
Budget Enforcement Act 1.426 1.543 1.658 1.718(0.395) (0.400) (0.439) (0.439)
Gramm-Rudman-Hollings -0.521 -0.530 0.126 0.0636(0.740) (0.742) (0.801) (0.808)
Lagged Surplus 0.0861 0.116 0.0552 0.0767(0.0559) (0.0616) (0.0708) (0.0706)
Lagged Growth 0.281 0.299 0.239 0.253(0.175) (0.175) (0.214) (0.210)
Presidential Transition 0.531 0.568 -0.0587 0.0147(0.394) (0.414) (1.055) (1.101)
Presidential Election 0.663 0.741 0.877 0.914(0.450) (0.435) (0.438) (0.427)
Polarization x Divided -5.020 -3.464(3.516) (3.229)
Delay in Budget Submission 0.213 0.194(0.271) (0.279)
Delay in Mid-Session Report -0.247 -0.229(0.140) (0.140)
N 2284 2284 2284 2284Log-Likelihood -856.7 -852.8 -845.1 -843.2
Standard errors in parentheses
Probit models of the probability of successful passage of appropriation bill in month t
conditional on not passing by end of month t-1. Month and jurisdiction indicators
not reported.
20
the preference and party models. I find no evidence that the magnitude of the previous
years surplus or deficit has any impact on the timing of appropriation bills. Economic
growth, however, does correlate with good procedural performance. A one percent increase
in the GDP growth rate from the previous quarter is sufficient to raise the monthly passage
probability from .5 to .57. There is little evidence that performance is either promoted or
impeded during the first fiscal year of a new administration. But Congress appears to be
somewhat more efficient in the months surrounding presidential elections.
Finally, I turn to the evidence that presidential delays affect congressional performance.
Submission delays of the original budget do not slow down the timing of appropriations. In
fact, there is a positive probability between the delay in initial submission and the monthly
probability of passage (although the standard error of this estimate is large and the effect
is not statistically significant). The delay in the mid-session report does have a negative
and statistically significant effect. A one-standard deviation increase in the (log) delay is
associated with a .10 drop in the monthly probability of passage if the baseline is .5. But
I should repeat the caveat that such estimates may not reflect causal effects if both the
president and Congress are responding to some omitted variable.
7 Does It Matter?
Despite recent concerns about Congress’s recent proclivity to “govern by CR”, there is little
systematic evidence of its consequences on fiscal or economic outcomes. In this section,
I provide some preliminary evidence for two possible effects. First, I examine whether
procedural performance has any clear impact on Congress’s ability to control fiscal outcomes
such as spending or the deficit. Second, I consider whether poor procedural performance
might create economic uncertainties that affect the broader economy.
21
-8-6
-4-2
02
Cha
nge
in S
urpl
us a
s %
of G
DP
0 .2 .4 .6 .8 1Percentage of Appropriation Bills Complete in First Three Months of FY
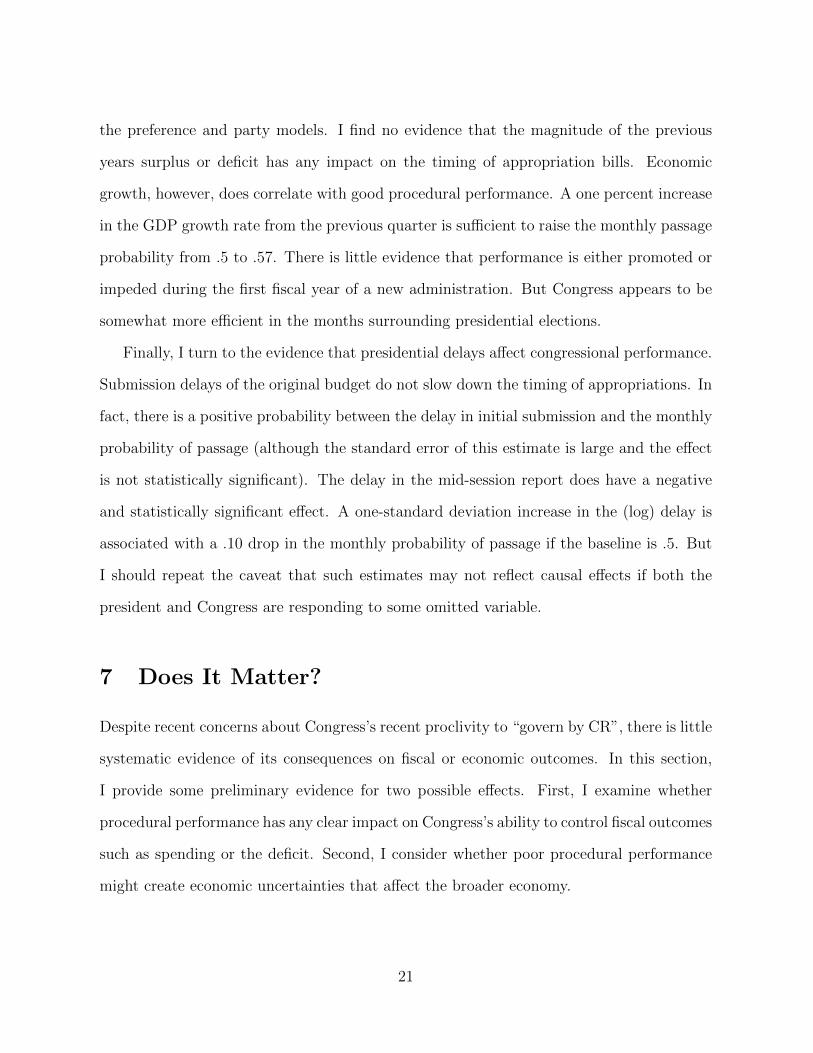
Appropriations Timing and Deficit Reduction
Figure 8: Complete Appropriations and Deficits
7.1 Delayed Appropriations, Deficits, and Spending
To evaluate whether procedural performance affects Congress’s overall fiscal management,
I estimate some simple lagged dependent variable models. Because I am constrained by
a relatively short annual time series, I am unable to estimate more complicated dynamic
models. I consider three different measures of annual procedural performance: the percent-
age of appropriations completed by the beginning of the FY and the percent completed
by second and third months of the fiscal year. As additional controls, I include the GDP
growth rate and an indicator for the Budget Enforcement Act of 1990.
I begin by examining whether there is a connection between fiscal performance and
the changes in the government surplus or deficit. Figure 8 plots the bivariate relationship
between the annual change and surplus and the percentage of appropriation bills completed
by the third month of the fiscal year. Clearly, there is no strong relationship. Significant
deficit reduction coincides with both good and bad procedural performance.
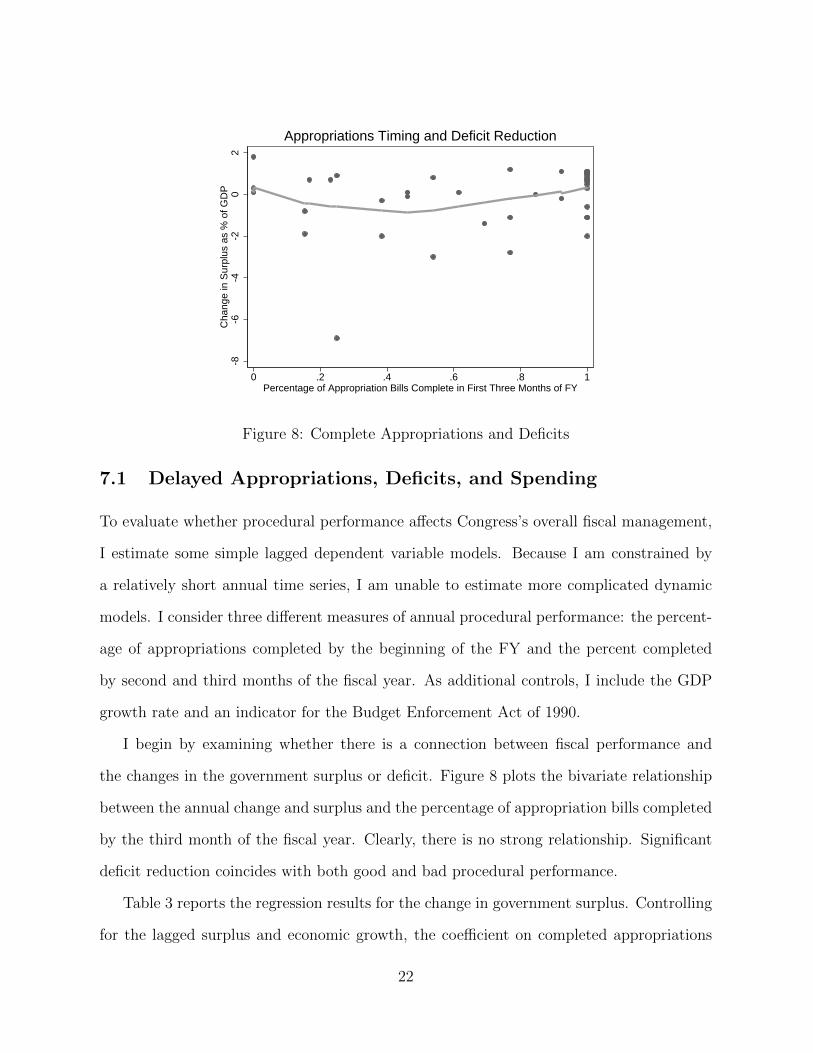
Table 3 reports the regression results for the change in government surplus. Controlling
for the lagged surplus and economic growth, the coefficient on completed appropriations
22
is positive indicating a positive relationship between procedural performance and deficit
reduction. But the coefficients are imprecisely estimated and the relationship falls well
short of standards for statistical significance.26
Table 3: Effect of Completed Appropriations on Change in Surplus
Start of FY Month 2 Month 3Lagged Surplus -0.179 -0.185 -0.188
(0.0702) (0.0695) (0.0699)
Percentage Complete 0.334 0.621 0.559(0.530) (0.561) (0.537)
Growth Rate 1.292 1.300 1.319(0.213) (0.201) (0.199)
BEA 1990 0.534 0.357 0.450(0.429) (0.466) (0.432)
N 39 39 39R-Squared 0.631 0.639 0.638
Standard errors in parentheses
OLS estimates of the effects of completed appropriations on yearly change in surplus.
Different models capture completion rates at different points in the fiscal year.
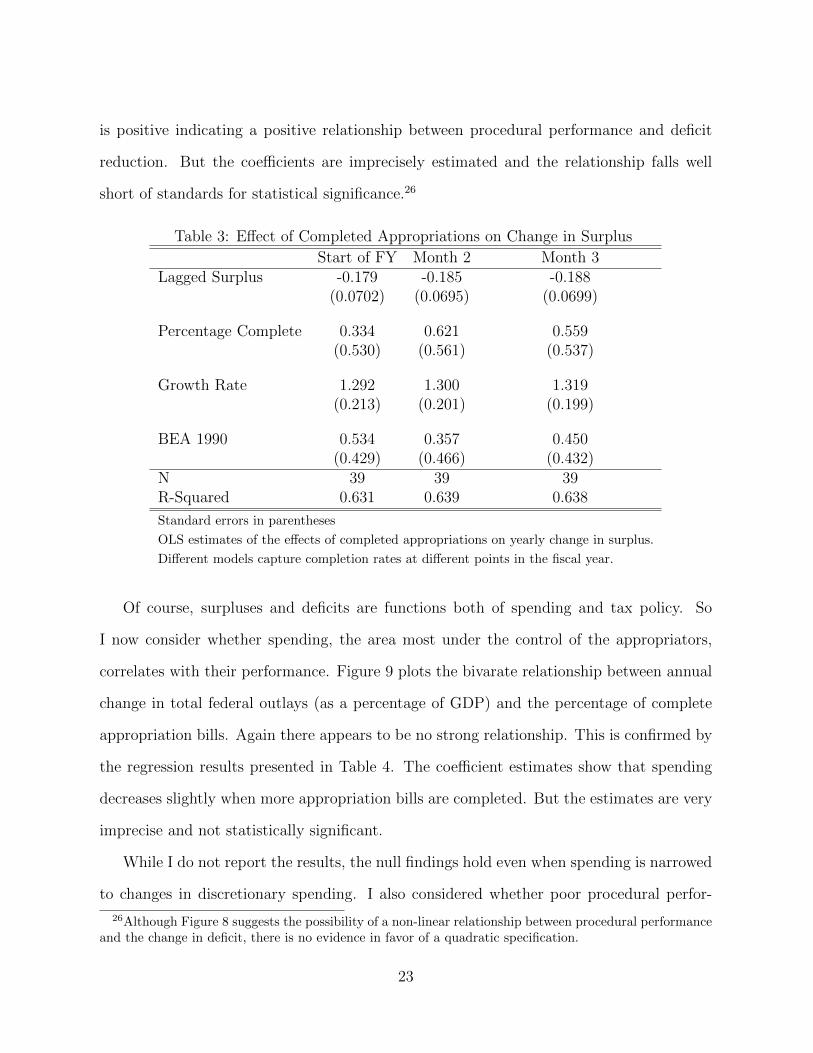
Of course, surpluses and deficits are functions both of spending and tax policy. So
I now consider whether spending, the area most under the control of the appropriators,
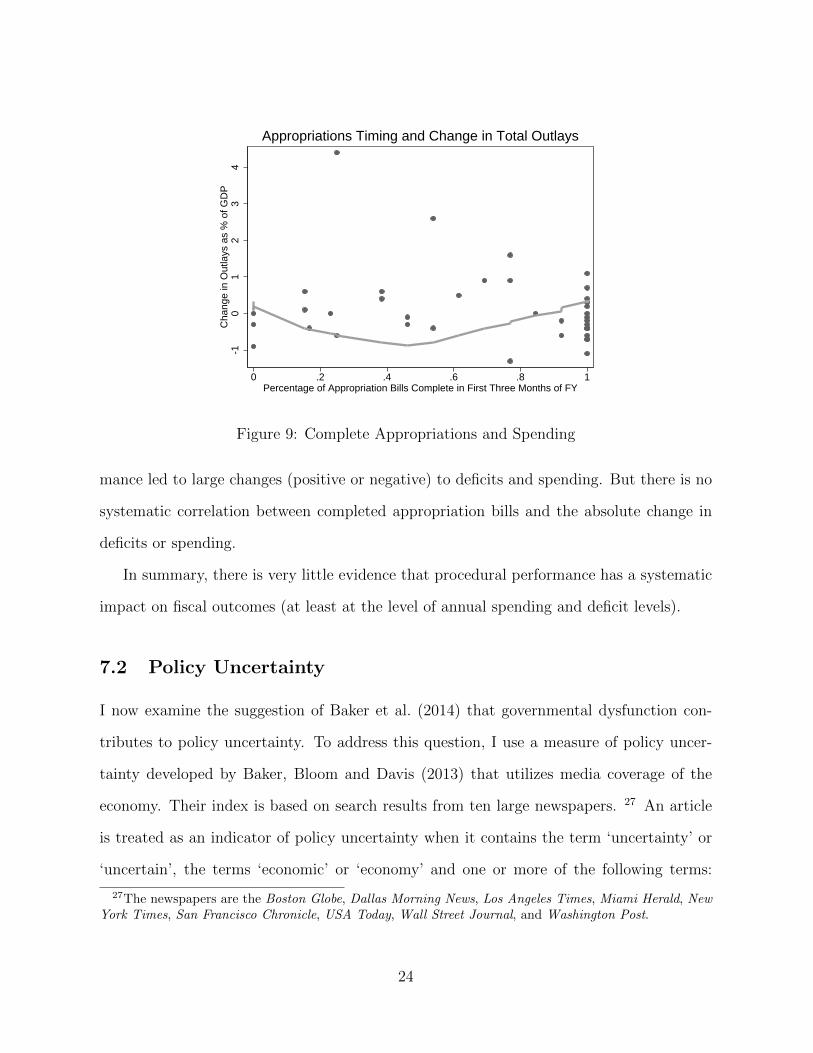
correlates with their performance. Figure 9 plots the bivarate relationship between annual
change in total federal outlays (as a percentage of GDP) and the percentage of complete
appropriation bills. Again there appears to be no strong relationship. This is confirmed by
the regression results presented in Table 4. The coefficient estimates show that spending
decreases slightly when more appropriation bills are completed. But the estimates are very
imprecise and not statistically significant.
While I do not report the results, the null findings hold even when spending is narrowed
to changes in discretionary spending. I also considered whether poor procedural perfor-
26Although Figure 8 suggests the possibility of a non-linear relationship between procedural performanceand the change in deficit, there is no evidence in favor of a quadratic specification.
23
-10
12
34
Cha
nge
in O
utla
ys a
s %
of G
DP
0 .2 .4 .6 .8 1Percentage of Appropriation Bills Complete in First Three Months of FY
Appropriations Timing and Change in Total Outlays
Figure 9: Complete Appropriations and Spending
mance led to large changes (positive or negative) to deficits and spending. But there is no
systematic correlation between completed appropriation bills and the absolute change in
deficits or spending.
In summary, there is very little evidence that procedural performance has a systematic
impact on fiscal outcomes (at least at the level of annual spending and deficit levels).
7.2 Policy Uncertainty
I now examine the suggestion of Baker et al. (2014) that governmental dysfunction con-
tributes to policy uncertainty. To address this question, I use a measure of policy uncer-
tainty developed by Baker, Bloom and Davis (2013) that utilizes media coverage of the
economy. Their index is based on search results from ten large newspapers. 27 An article
is treated as an indicator of policy uncertainty when it contains the term ‘uncertainty’ or
‘uncertain’, the terms ‘economic’ or ‘economy’ and one or more of the following terms:
27The newspapers are the Boston Globe, Dallas Morning News, Los Angeles Times, Miami Herald, NewYork Times, San Francisco Chronicle, USA Today, Wall Street Journal, and Washington Post.
24
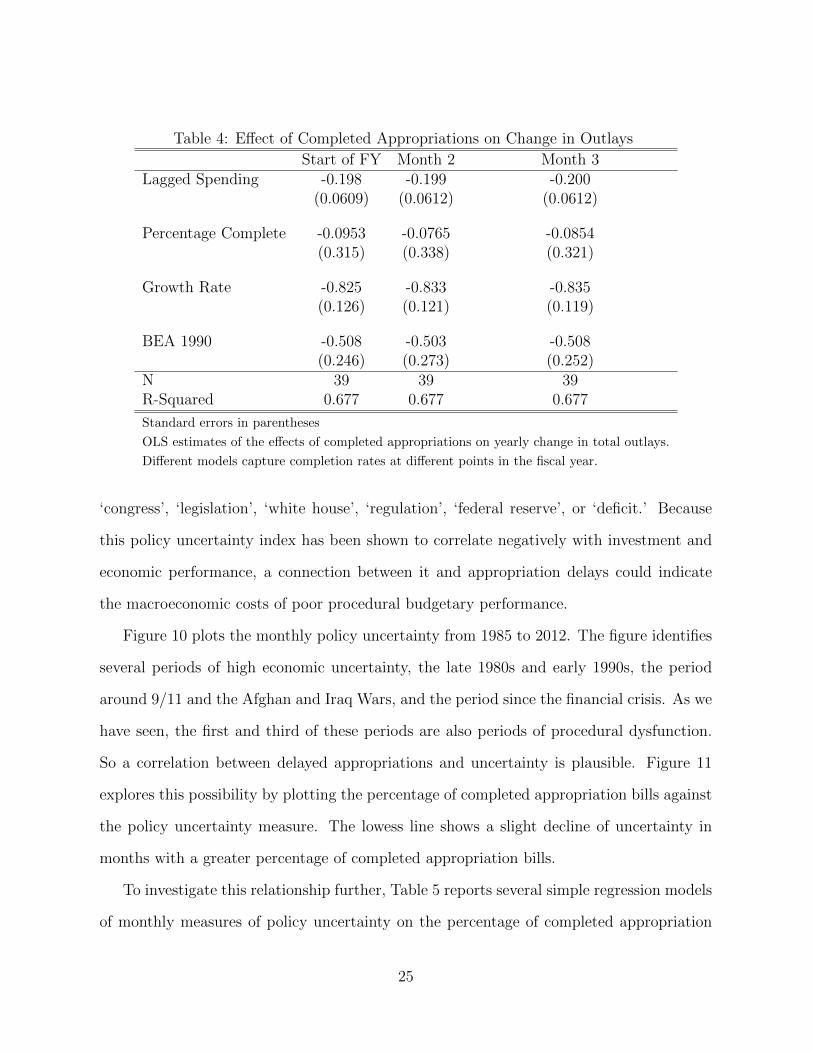
Table 4: Effect of Completed Appropriations on Change in Outlays
Start of FY Month 2 Month 3Lagged Spending -0.198 -0.199 -0.200
(0.0609) (0.0612) (0.0612)
Percentage Complete -0.0953 -0.0765 -0.0854(0.315) (0.338) (0.321)
Growth Rate -0.825 -0.833 -0.835(0.126) (0.121) (0.119)
BEA 1990 -0.508 -0.503 -0.508(0.246) (0.273) (0.252)
N 39 39 39R-Squared 0.677 0.677 0.677
Standard errors in parentheses
OLS estimates of the effects of completed appropriations on yearly change in total outlays.
Different models capture completion rates at different points in the fiscal year.
‘congress’, ‘legislation’, ‘white house’, ‘regulation’, ‘federal reserve’, or ‘deficit.’ Because
this policy uncertainty index has been shown to correlate negatively with investment and
economic performance, a connection between it and appropriation delays could indicate
the macroeconomic costs of poor procedural budgetary performance.
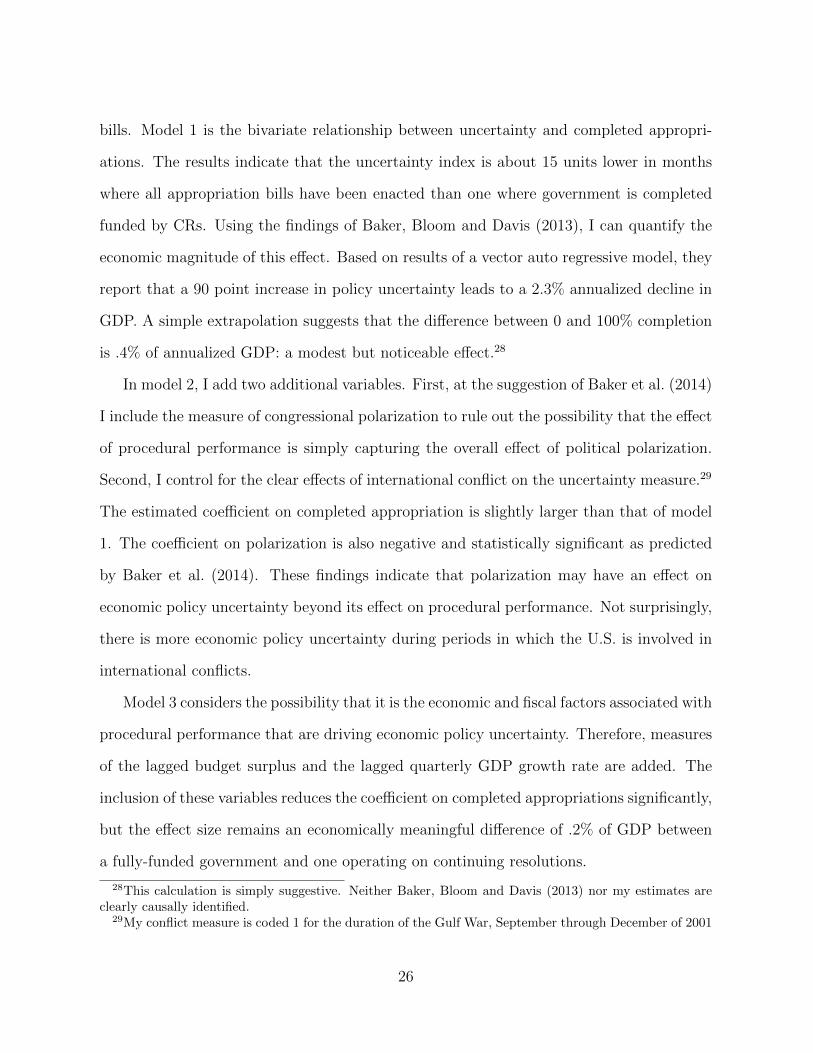
Figure 10 plots the monthly policy uncertainty from 1985 to 2012. The figure identifies
several periods of high economic uncertainty, the late 1980s and early 1990s, the period
around 9/11 and the Afghan and Iraq Wars, and the period since the financial crisis. As we
have seen, the first and third of these periods are also periods of procedural dysfunction.
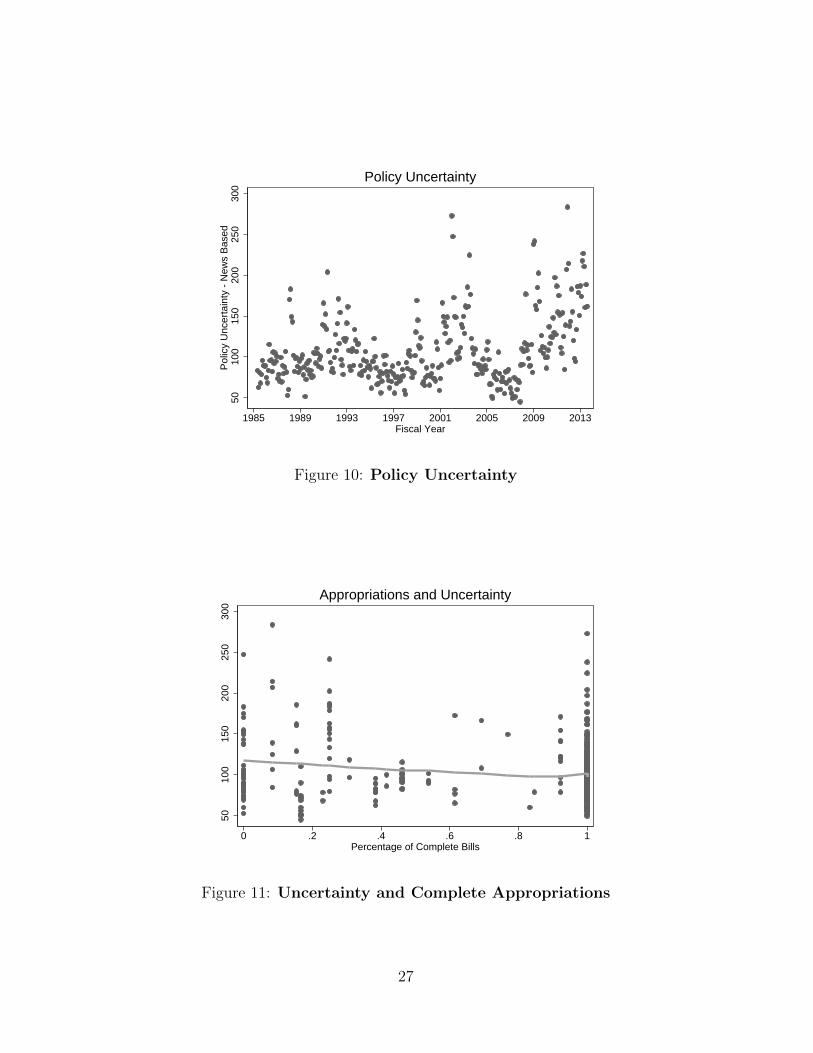
So a correlation between delayed appropriations and uncertainty is plausible. Figure 11
explores this possibility by plotting the percentage of completed appropriation bills against
the policy uncertainty measure. The lowess line shows a slight decline of uncertainty in
months with a greater percentage of completed appropriation bills.
To investigate this relationship further, Table 5 reports several simple regression models
of monthly measures of policy uncertainty on the percentage of completed appropriation
25
bills. Model 1 is the bivariate relationship between uncertainty and completed appropri-
ations. The results indicate that the uncertainty index is about 15 units lower in months
where all appropriation bills have been enacted than one where government is completed
funded by CRs. Using the findings of Baker, Bloom and Davis (2013), I can quantify the
economic magnitude of this effect. Based on results of a vector auto regressive model, they
report that a 90 point increase in policy uncertainty leads to a 2.3% annualized decline in
GDP. A simple extrapolation suggests that the difference between 0 and 100% completion
is .4% of annualized GDP: a modest but noticeable effect.28
In model 2, I add two additional variables. First, at the suggestion of Baker et al. (2014)
I include the measure of congressional polarization to rule out the possibility that the effect
of procedural performance is simply capturing the overall effect of political polarization.
Second, I control for the clear effects of international conflict on the uncertainty measure.29
The estimated coefficient on completed appropriation is slightly larger than that of model
1. The coefficient on polarization is also negative and statistically significant as predicted
by Baker et al. (2014). These findings indicate that polarization may have an effect on
economic policy uncertainty beyond its effect on procedural performance. Not surprisingly,
there is more economic policy uncertainty during periods in which the U.S. is involved in
international conflicts.
Model 3 considers the possibility that it is the economic and fiscal factors associated with
procedural performance that are driving economic policy uncertainty. Therefore, measures
of the lagged budget surplus and the lagged quarterly GDP growth rate are added. The
inclusion of these variables reduces the coefficient on completed appropriations significantly,
but the effect size remains an economically meaningful difference of .2% of GDP between
a fully-funded government and one operating on continuing resolutions.
28This calculation is simply suggestive. Neither Baker, Bloom and Davis (2013) nor my estimates areclearly causally identified.
29My conflict measure is coded 1 for the duration of the Gulf War, September through December of 2001
26
5010
015
020
025
030
0P
olic
y U
ncer
tain
ty -
New
s B
ased
1985 1989 1993 1997 2001 2005 2009 2013Fiscal Year
Policy Uncertainty
Figure 10: Policy Uncertainty
5010
015
020
025
030
0
0 .2 .4 .6 .8 1Percentage of Complete Bills
Appropriations and Uncertainty
Figure 11: Uncertainty and Complete Appropriations
27
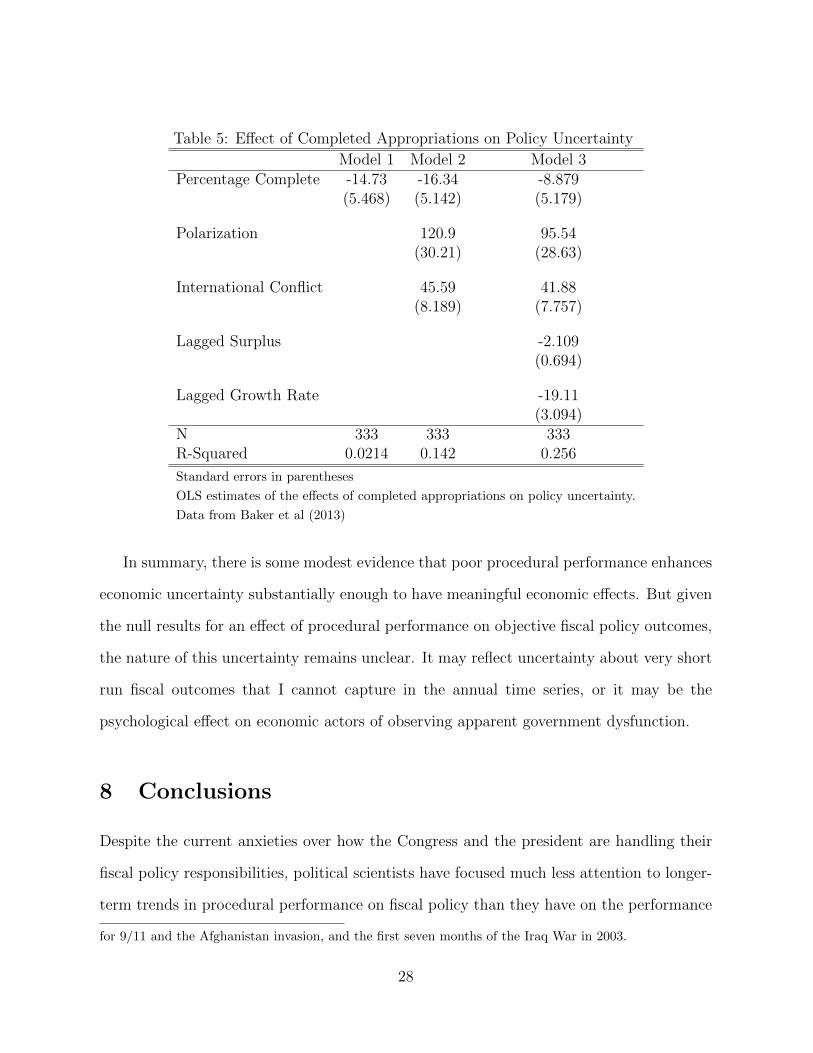
Table 5: Effect of Completed Appropriations on Policy Uncertainty
Model 1 Model 2 Model 3Percentage Complete -14.73 -16.34 -8.879
(5.468) (5.142) (5.179)
Polarization 120.9 95.54(30.21) (28.63)
International Conflict 45.59 41.88(8.189) (7.757)
Lagged Surplus -2.109(0.694)
Lagged Growth Rate -19.11(3.094)
N 333 333 333R-Squared 0.0214 0.142 0.256
Standard errors in parentheses
OLS estimates of the effects of completed appropriations on policy uncertainty.
Data from Baker et al (2013)
In summary, there is some modest evidence that poor procedural performance enhances
economic uncertainty substantially enough to have meaningful economic effects. But given
the null results for an effect of procedural performance on objective fiscal policy outcomes,
the nature of this uncertainty remains unclear. It may reflect uncertainty about very short
run fiscal outcomes that I cannot capture in the annual time series, or it may be the
psychological effect on economic actors of observing apparent government dysfunction.
8 Conclusions
Despite the current anxieties over how the Congress and the president are handling their
fiscal policy responsibilities, political scientists have focused much less attention to longer-
term trends in procedural performance on fiscal policy than they have on the performance
for 9/11 and the Afghanistan invasion, and the first seven months of the Iraq War in 2003.
28
on judicial and executive branch nominations and general legislation. The primary goal of
this chapter is to lay out some of the trends in procedural performance on fiscal policy and
to lay the foundation for future research.
Several of the preliminary findings warrant more intensive future investigation. First,
although there is ample evidence that partisan and ideological conflict impedes performance
in the budget and appropriation process, my results demonstrate that there must be more
to the story. Performance in the relatively less polarized 1980s was poor, it was excellent
through much of the 1990s (with the notable exception of the 1995 government shutdown),
and it has rapidly deteriorated over the past decade. Second, while the timing of the
improved performance of the 1990s does not align exactly with the Budget Enforcement
Act of 1990, the evidence is plausibly consistent with the beneficial effects of spending
caps and pay-as-you go rules. Clearly, more work is needed to isolate these effects. Third,
this chapter raises the crucial question of whether the propensity to govern by CR has
significant effects on outcomes. While there are limitations to my analysis of the effects of
appropriation delay on annual deficit and spending figures, the results do seem to rule out
first-order effects on major fiscal aggregates. At the same time, I present some evidence
consistent with an effect of procedural performance on the expectations of economic actors.
29
References
Baker, Scott, Nicholas Bloom, Brandice Canes-Wrone, Steven J. Davis and Jonathan Rod-
den. 2014. “Why Has U.S. Policy Uncertainty Risen Since 1960?”.
Baker, Scott, Nicholas Bloom and Steven Davis. 2013. “Measuring Economic Policy Un-
certainty.” Chicago Booth Research Paper (13-02).
Cameron, Charles M. 2000. Veto Bargaining: Presidents and the Politics of Negative
Power. Cambridge University Press.
Cameron, Charles and Nolan McCarty. 2004. “Models of Vetoes and Veto Bargaining.”
Annual Review Political Science 7:409–435.
Devins, Neal E. 1988. “Appropriations Redux: A Critical Look at the Fiscal Year 1988
Continuing Resolution.” Duke Law Journal p. 389.
Hanson, Peter. 2013. “Abandoning the Regular Order: Majority Party Influence on Ap-
propriations in the United States Senate.”.
Krehbiel, Keith. 1998. Pivotal Politics: A Theory of U.S. Lawmaking. Chicago: University
of Chicago Press.
Lynch, Megan S. 2013. “The Deeming Resolution: A Budget Enforcement Tool.” Congres-
sional Research Service.
Mann, Thomas E. and Norman J. Ornstein. 2006. The Broken Branch: How Congress is
Failing America and How to Get it Back on Track. Oxford University Press.
McCarty, Nolan. 2007. The Policy Effects of Political Polarization. In Transformations
of American Politics, ed. Paul Pierson and Theda Skocpol. Princeton, NJ: Princeton
University Press.
30
McCarty, Nolan, Keith Poole and Howard Rosenthal. 2006. Polarized American: The
Dance of Ideology and Unequal Riches. Cambridge: MIT Press.
McCubbins, Mathew D. 1991. Party Governance and U.S. Budget Deficits: Divided Gov-
ernment and Fiscal Stalemate. In Politics and Economics in the Eighties, ed. Alberto
Alesina and Geoffrey Carliner. Chicago: University of Chicago Press.
Poole, Keith T. 2000. “Non-parametric Unfolding of Binary Choice Data.” Political Anal-
ysis 8:211–237.
Schick, Allen. 2008. The Federal Budget: Politics, Policy, Process. Brookings Institution
Press.
Sinclair, Barbara. 2006. Party Wars: Polarization and the Politics of National Policy
Making. Vol. 10 University of Oklahoma Press.
Smith, Steven S. 2010. “The Senate Syndrome.” Issues in Governance Studies 35.
Tollestrup, Jessica. 2013. “The Congressional Appropriations Process: An Introduction.”
Congressional Research Service.
White, Joe. 1988. “The Continuing Resolution: A Crazy Way to Govern?” The Brookings
Review 6(3):28–35.
Woon, Jonathan and Sarah Anderson. 2012. “Political Bargaining and the Timing of
Congressional Appropriations.” Legislative Studies Quarterly 37(4):409–436.
31