the current status and future of banking – global banking...
TRANSCRIPT
The Current Status and Future of Banking – Global Banking Annual Report 2017
CONFIDENTIAL AND PROPRIETARY Any use of this material without specific permission of McKinsey & Company is strictly prohibited
Albania, Tirana| 14 November 2017
Last Modified 11/14/2017 2:37 AM
India Standard Time
Printed
Agenda
2 McKinsey & Company
State of the industry
Digital and AA at scale
Eco-systems?
Last Modified 11/14/2017 2:37 AM
India Standard Time
Printed
3 McKinsey & Company
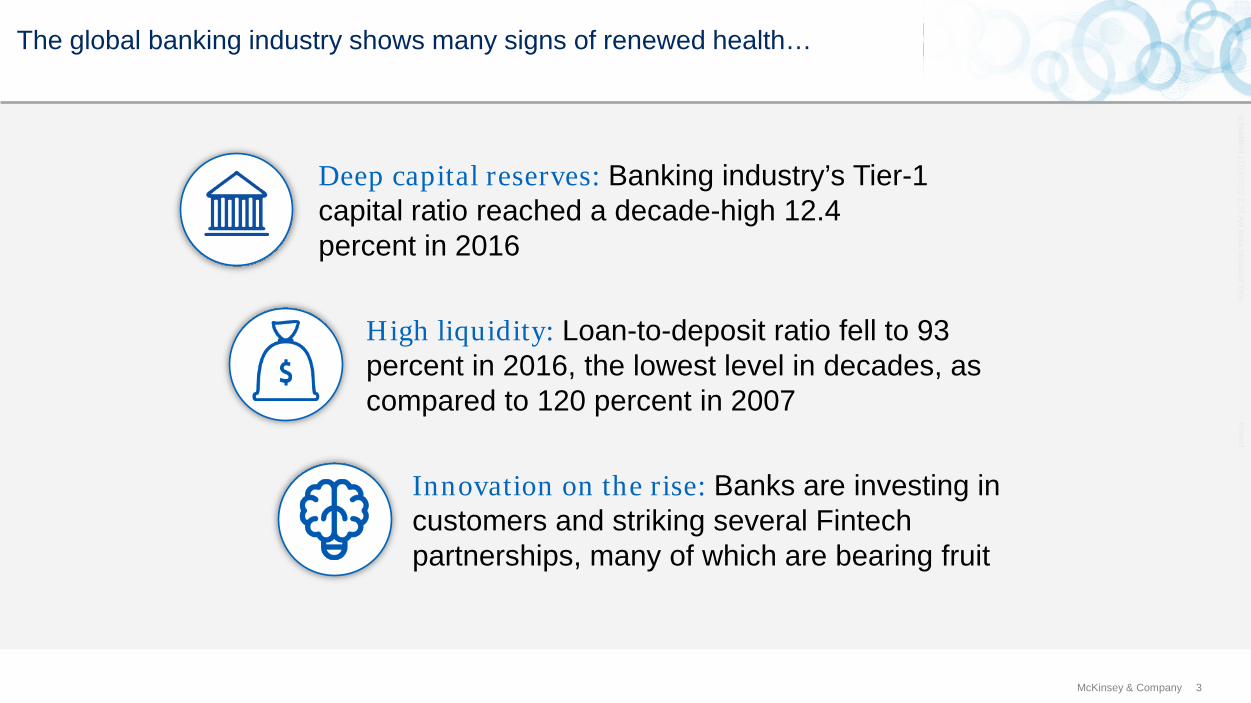
The global banking industry shows many signs of renewed health…
Innovation on the rise: Banks are investing in customers and striking several Fintech partnerships, many of which are bearing fruit
Deep capital reserves: Banking industry’s Tier-1 capital ratio reached a decade-high 12.4 percent in 2016
High liquidity: Loan-to-deposit ratio fell to 93 percent in 2016, the lowest level in decades, as compared to 120 percent in 2007
Last Modified 11/14/2017 2:37 AM
India Standard Time
Printed
4 McKinsey & Company
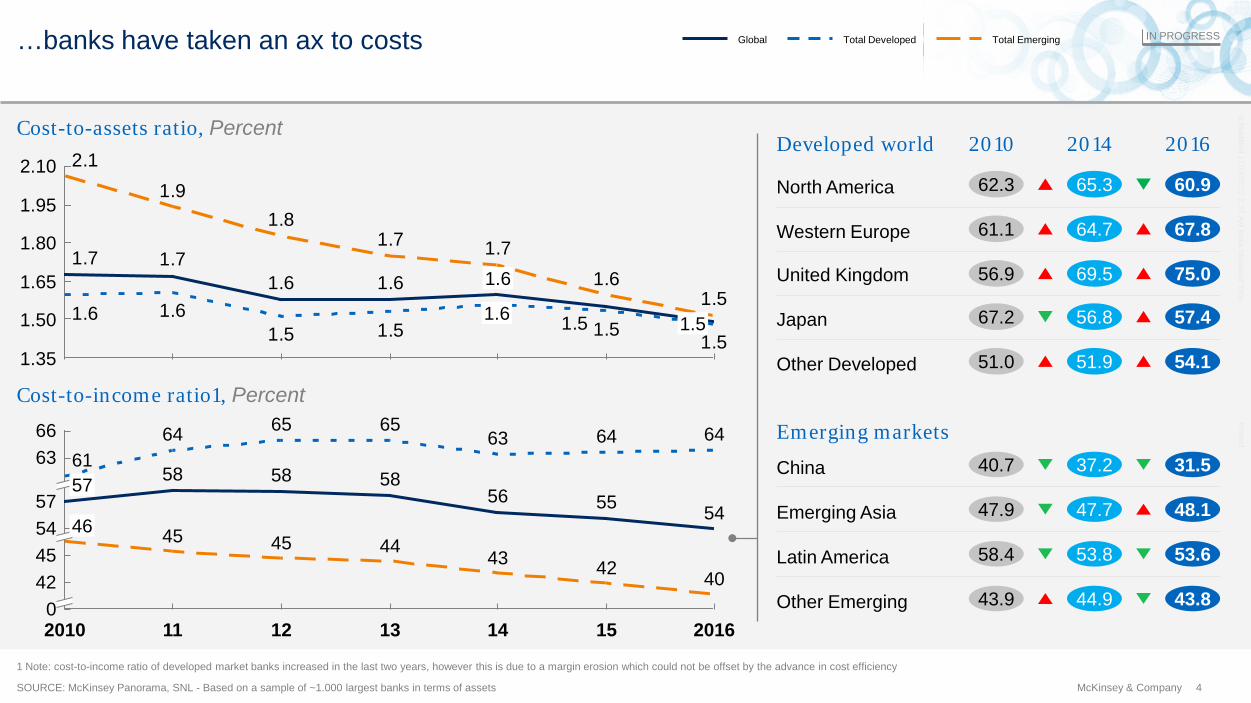
…banks have taken an ax to costs
15
45
0 14 12
57
42
11 13 2016 2010
54
66 63
58 55
64 61
46
58
64
45
58
65
40
56
45 44
64
43
63
54 57
65
42
1.5
1.61.61.71.7
1.51.51.51.5
1.61.61.5
1.61.71.7
1.81.9
2.1
1.50
2.10
1.80
1.65
1.95
1.35
1.5 1.6
1.6
Total Emerging Global Total Developed
Cost-to-income ratio1, Percent
Cost-to-assets ratio, Percent
SOURCE: McKinsey Panorama, SNL - Based on a sample of ~1.000 largest banks in terms of assets
1 Note: cost-to-income ratio of developed market banks increased in the last two years, however this is due to a margin erosion which could not be offset by the advance in cost efficiency
IN PROGRESS
2010 2016 2014 Developed world
Emerging markets 40.7 31.5 37.2 China
58.4 53.6 53.8 Latin America
43.9 43.8 44.9 Other Emerging
47.9 48.1 47.7 Emerging Asia
51.0 54.1 51.9 Other Developed
62.3 60.9 65.3 North America
61.1 67.8 64.7 Western Europe
67.2 57.4 56.8 Japan
56.9 75.0 69.5 United Kingdom
Last Modified 11/14/2017 2:37 AM
India Standard Time
Printed
5 McKinsey & Company
“Great Hype” Crisis New normal “Great Hype” Crisis New normal
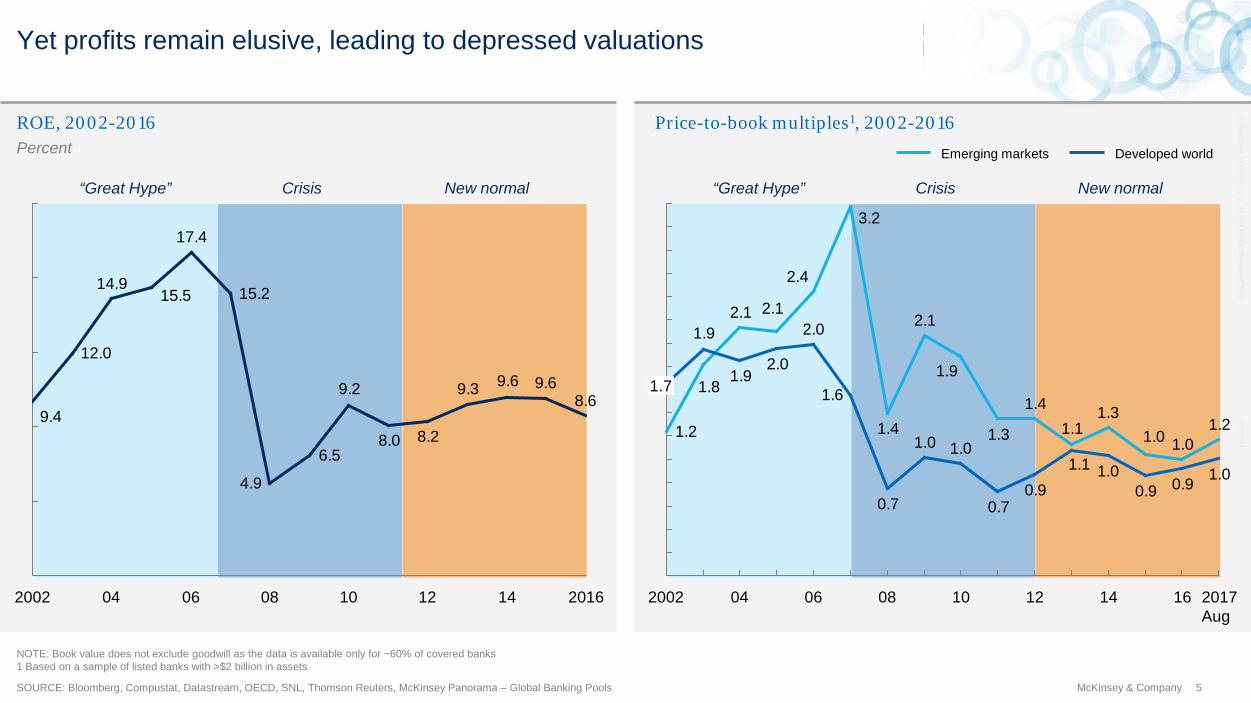
ROE, 2002-2016 Percent
Price-to-book multiples1, 2002-2016
Yet profits remain elusive, leading to depressed valuations
8.69.69.69.3
8.28.0
9.2
6.5
4.9
15.2
17.4
14.9
12.0
9.4
15.5
08 10 06 12 04 2002 2016 14
Developed world Emerging markets
SOURCE: Bloomberg, Compustat, Datastream, OECD, SNL, Thomson Reuters, McKinsey Panorama – Global Banking Pools
NOTE: Book value does not exclude goodwill as the data is available only for ~60% of covered banks 1 Based on a sample of listed banks with >$2 billion in assets
1.21.01.0
1.31.1
1.4
1.9
2.1
1.4
3.2
2.12.1
1.8
1.2 1.3
2.4
1.00.90.91.0
0.90.7
1.01.0
0.7
1.6
2.0
2.01.9
1.9
1.1
08
1.7
04 2002 06 12 2017 Aug
14 16 10
Last Modified 11/14/2017 2:37 AM
India Standard Time
Printed
6 McKinsey & Company SOURCE: SNL, McKinsey Panorama – Global Banking Pools
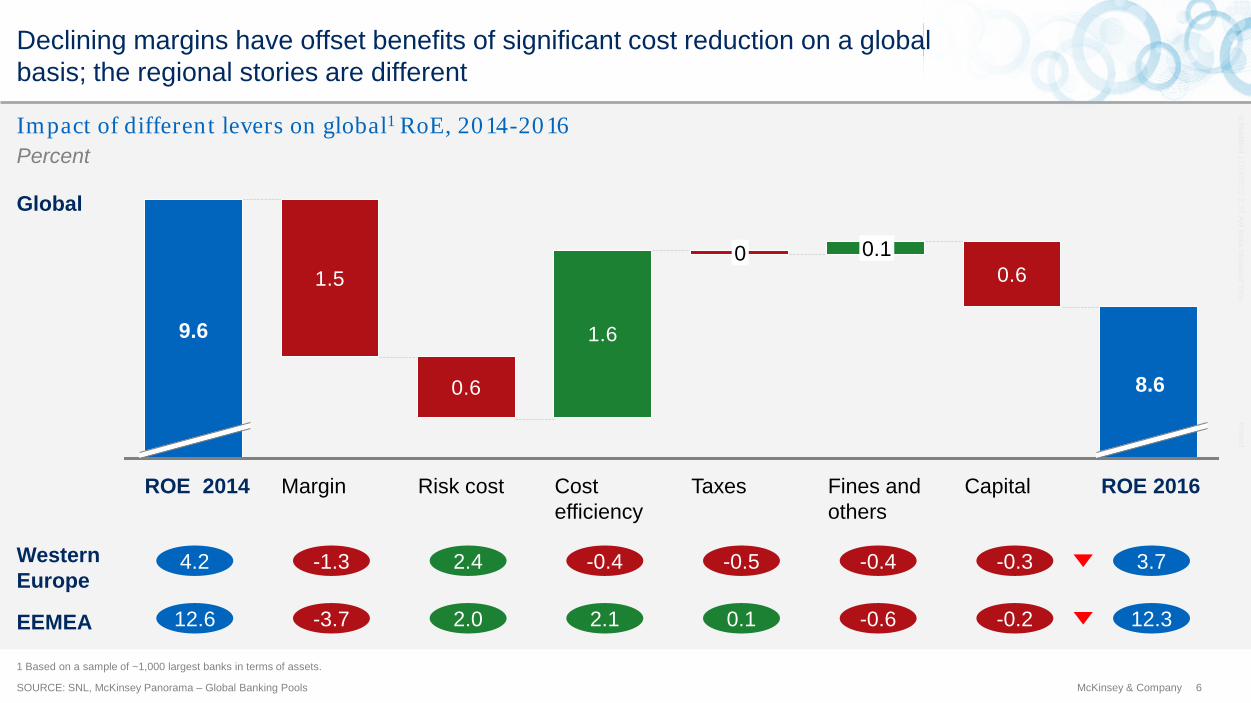
Impact of different levers on global1 RoE, 2014-2016 Percent
EEMEA
Western Europe
-1.3
-3.7
2.4
2.0
-0.4
2.1
-0.5
0.1
-0.4
-0.6
-0.3
-0.2
4.2
12.6
3.7
12.3
Global
1.5
0.6
1.6
0.6
8.6
Capital Risk cost ROE 2016 Taxes
0
Margin Fines and others
9.6
ROE 2014
0.1
Cost efficiency
1 Based on a sample of ~1,000 largest banks in terms of assets.
Declining margins have offset benefits of significant cost reduction on a global basis; the regional stories are different
Last Modified 11/14/2017 2:37 AM
India Standard Time
Printed
7 McKinsey & Company
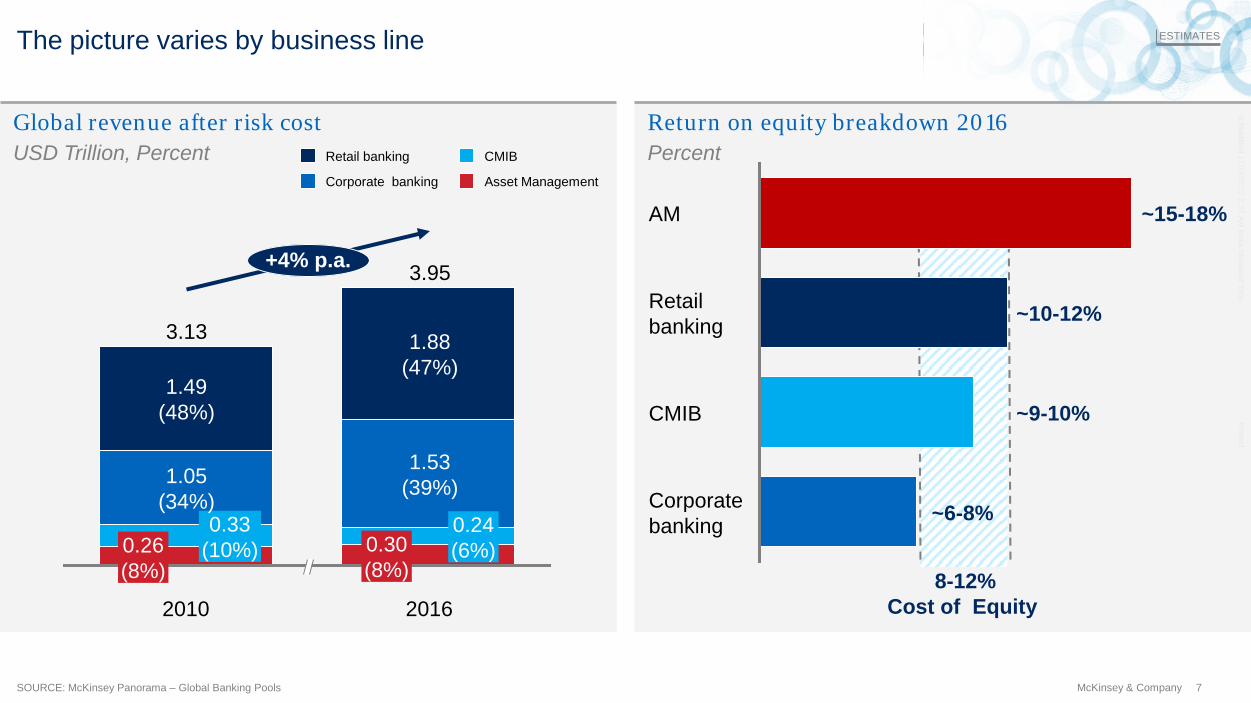
The picture varies by business line
SOURCE: McKinsey Panorama – Global Banking Pools
2016
0.30 (8%)
2010
+4% p.a.
0.33 (10%)
1.49 (48%)
0.24 (6%)
1.53 (39%)
1.88 (47%)
3.13
0.26 (8%)
1.05 (34%)
3.95
Asset Management Corporate banking
CMIB Retail banking
ESTIMATES
USD Trillion, Percent Global revenue after risk cost Return on equity breakdown 2016
Percent
~15-18%
8-12% Cost of Equity
Corporate banking
Retail banking
CMIB
AM
~10-12%
~9-10%
~6-8%
Last Modified 11/14/2017 2:37 AM
India Standard Time
Printed
8 McKinsey & Company
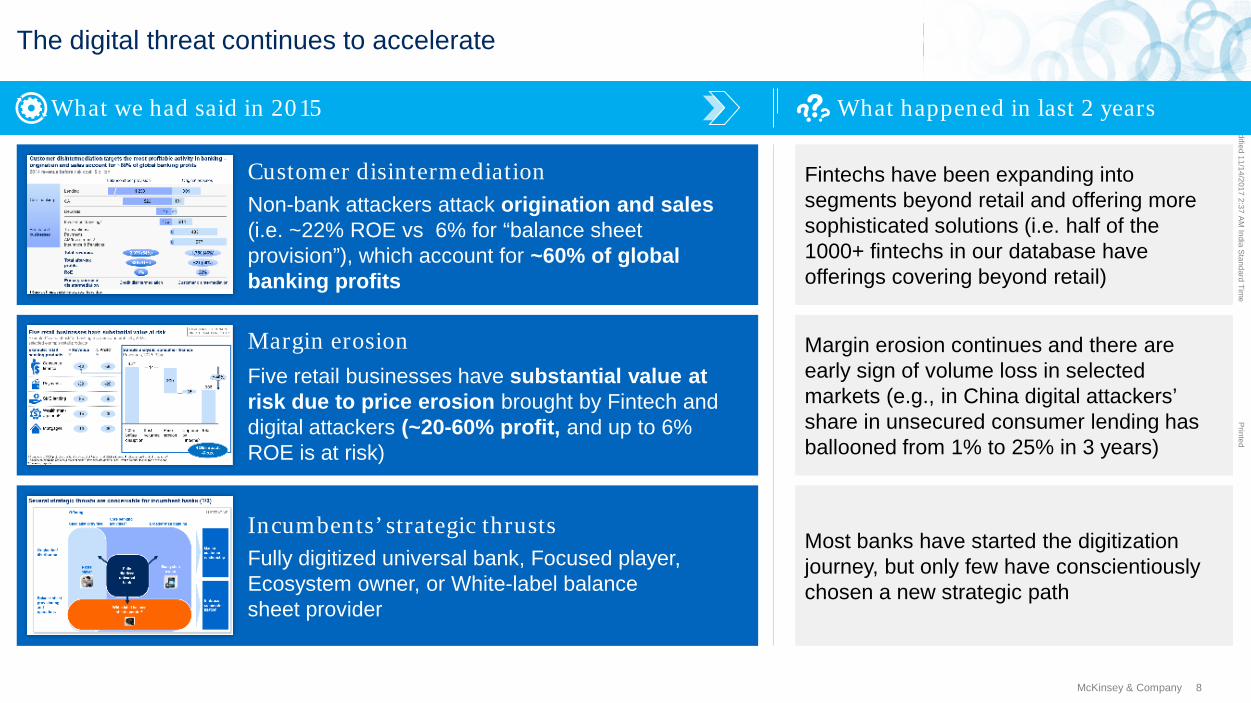
The digital threat continues to accelerate
What we had said in 2015 What happened in last 2 years
Fintechs have been expanding into segments beyond retail and offering more sophisticated solutions (i.e. half of the 1000+ fintechs in our database have offerings covering beyond retail)
Margin erosion continues and there are early sign of volume loss in selected markets (e.g., in China digital attackers’ share in unsecured consumer lending has ballooned from 1% to 25% in 3 years)
Most banks have started the digitization journey, but only few have conscientiously chosen a new strategic path
Customer disintermediation Non-bank attackers attack origination and sales (i.e. ~22% ROE vs 6% for “balance sheet provision”), which account for ~60% of global banking profits
Margin erosion Five retail businesses have substantial value at risk due to price erosion brought by Fintech and digital attackers (~20-60% profit, and up to 6% ROE is at risk)
Incumbents’ strategic thrusts Fully digitized universal bank, Focused player, Ecosystem owner, or White-label balance sheet provider
Last Modified 11/14/2017 2:37 AM
India Standard Time
Printed
9 McKinsey & Company
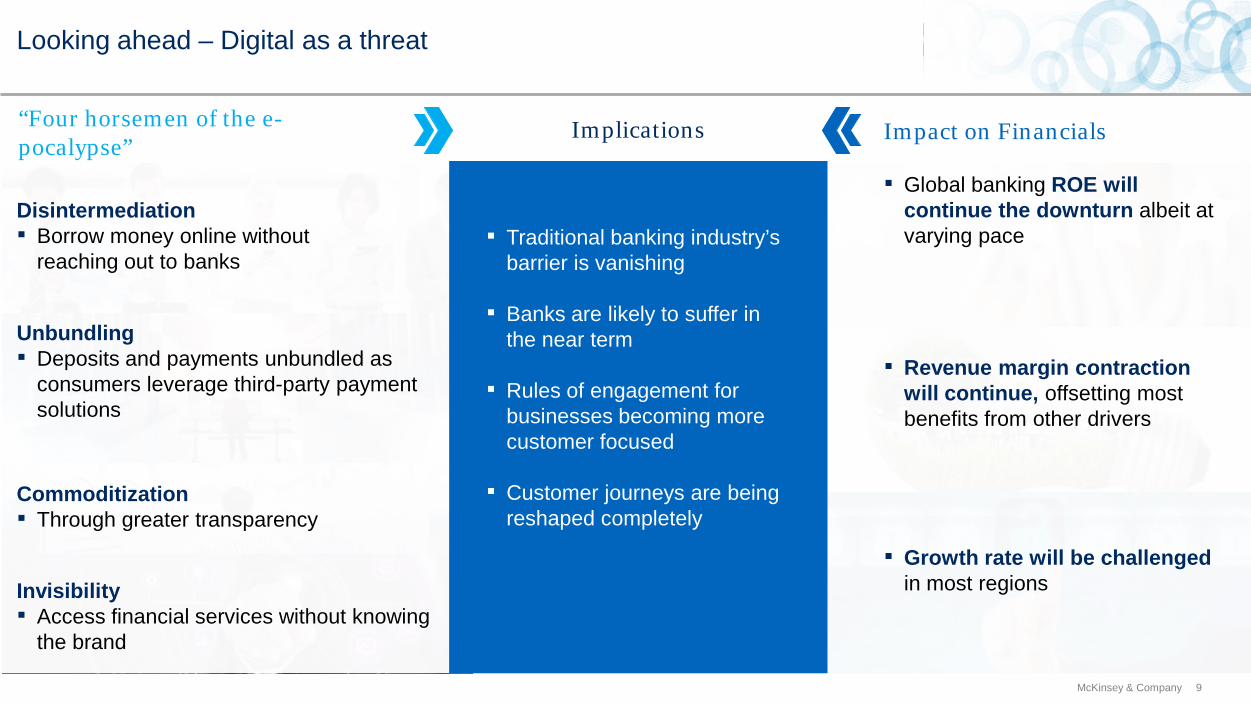
Looking ahead – Digital as a threat
▪ Traditional banking industry’s barrier is vanishing
▪ Banks are likely to suffer in the near term
▪ Rules of engagement for businesses becoming more customer focused
▪ Customer journeys are being reshaped completely
Implications “Four horsemen of the e-pocalypse”
Impact on Financials
▪ Global banking ROE will continue the downturn albeit at varying pace
▪ Revenue margin contraction will continue, offsetting most benefits from other drivers
▪ Growth rate will be challenged in most regions Invisibility
▪ Access financial services without knowing the brand
Commoditization ▪ Through greater transparency
Unbundling ▪ Deposits and payments unbundled as
consumers leverage third-party payment solutions
Disintermediation ▪ Borrow money online without
reaching out to banks
Last Modified 11/14/2017 2:37 AM
India Standard Time
Printed
Agenda
10 McKinsey & Company
State of the industry
Digital and AA at scale
Eco-systems?
Last Modified 11/14/2017 2:37 AM
India Standard Time
Printed
11 McKinsey & Company SOURCE: Annual reports; press searches; McKinsey
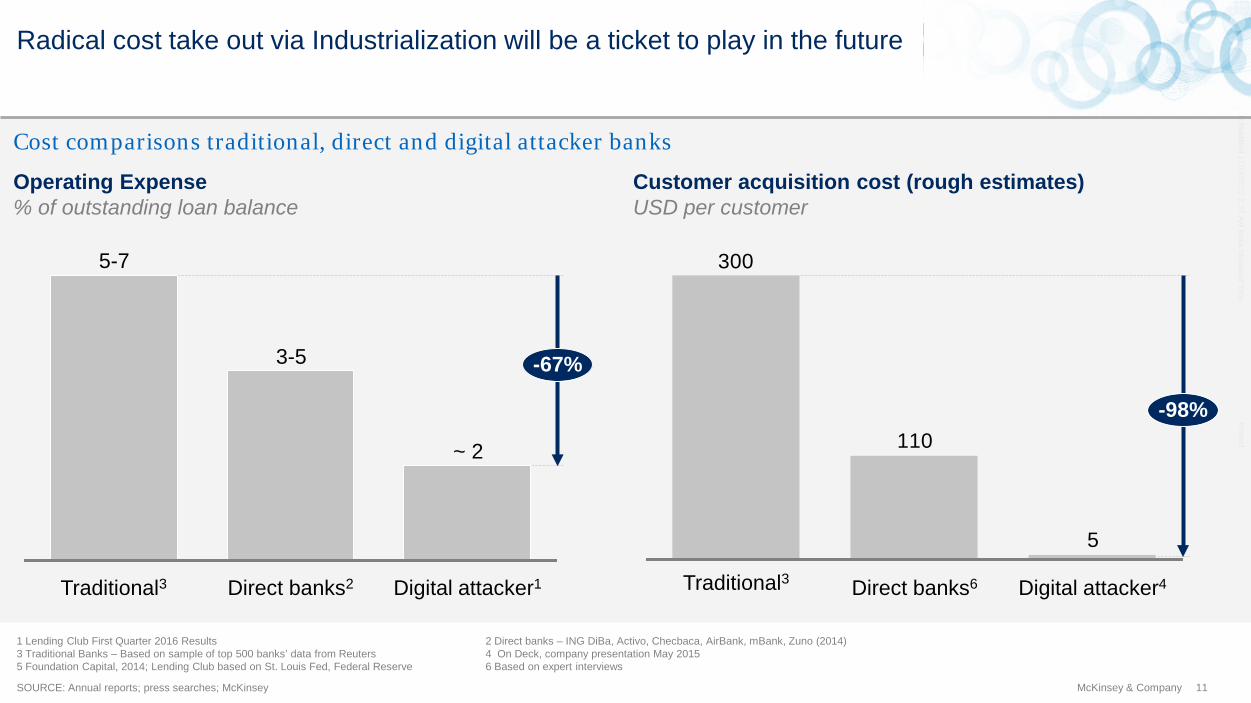
~ 2
-67%
Digital attacker1 Direct banks2
3-5
Traditional3
5-7
5
110
300
Direct banks6
-98%
Digital attacker4 Traditional3
Operating Expense % of outstanding loan balance
Customer acquisition cost (rough estimates) USD per customer
1 Lending Club First Quarter 2016 Results 2 Direct banks – ING DiBa, Activo, Checbaca, AirBank, mBank, Zuno (2014) 3 Traditional Banks – Based on sample of top 500 banks’ data from Reuters 4 On Deck, company presentation May 2015 5 Foundation Capital, 2014; Lending Club based on St. Louis Fed, Federal Reserve 6 Based on expert interviews
Radical cost take out via Industrialization will be a ticket to play in the future
Cost comparisons traditional, direct and digital attacker banks
Last Modified 11/14/2017 2:37 AM
India Standard Time
Printed
12 McKinsey & Company
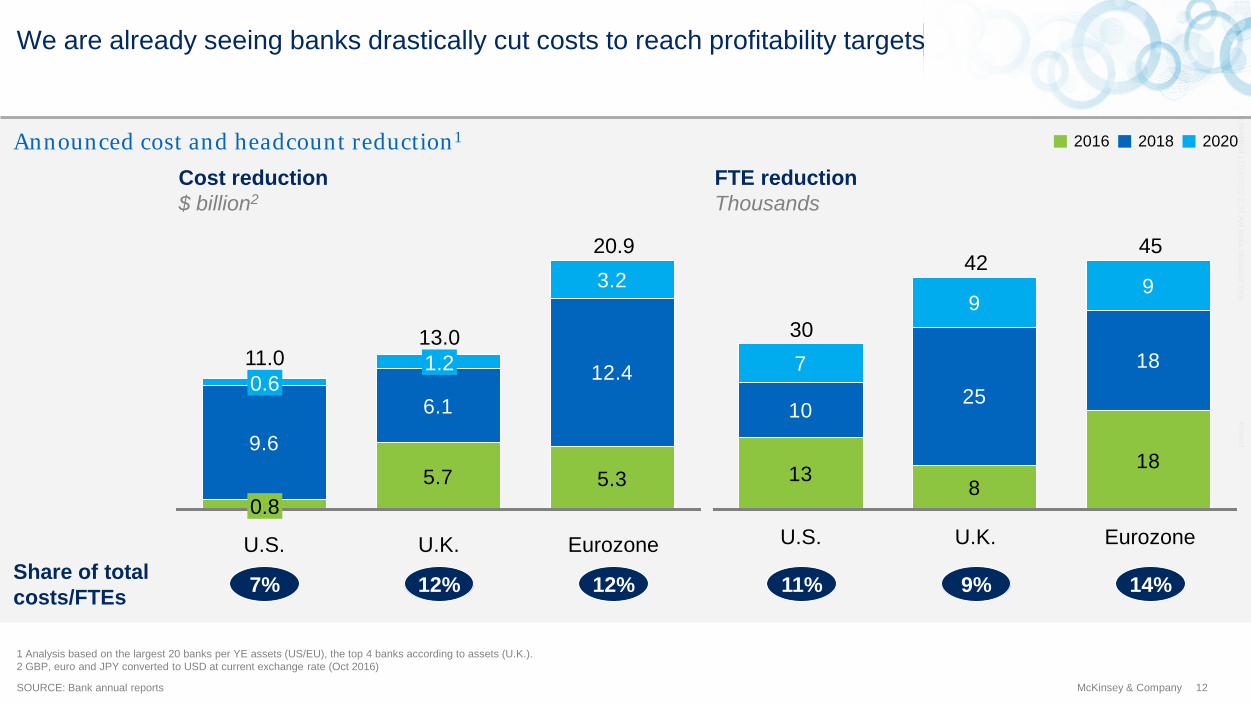
We are already seeing banks drastically cut costs to reach profitability targets
SOURCE: Bank annual reports
Cost reduction $ billion2
FTE reduction Thousands
5.7 5.3
9.6
6.112.4
3.2
U.S. U.K.
0.8
1.2
20.9
11.0 13.0
Eurozone
0.6
138
18
1025
187
99
45
Eurozone U.S.
30
42
U.K.
1 Analysis based on the largest 20 banks per YE assets (US/EU), the top 4 banks according to assets (U.K.). 2 GBP, euro and JPY converted to USD at current exchange rate (Oct 2016)
7% 12% 12% 11% 9% 14% Share of total costs/FTEs
2016 2018 2020 Announced cost and headcount reduction1
Last Modified 11/14/2017 2:37 AM
India Standard Time
Printed
13 McKinsey & Company
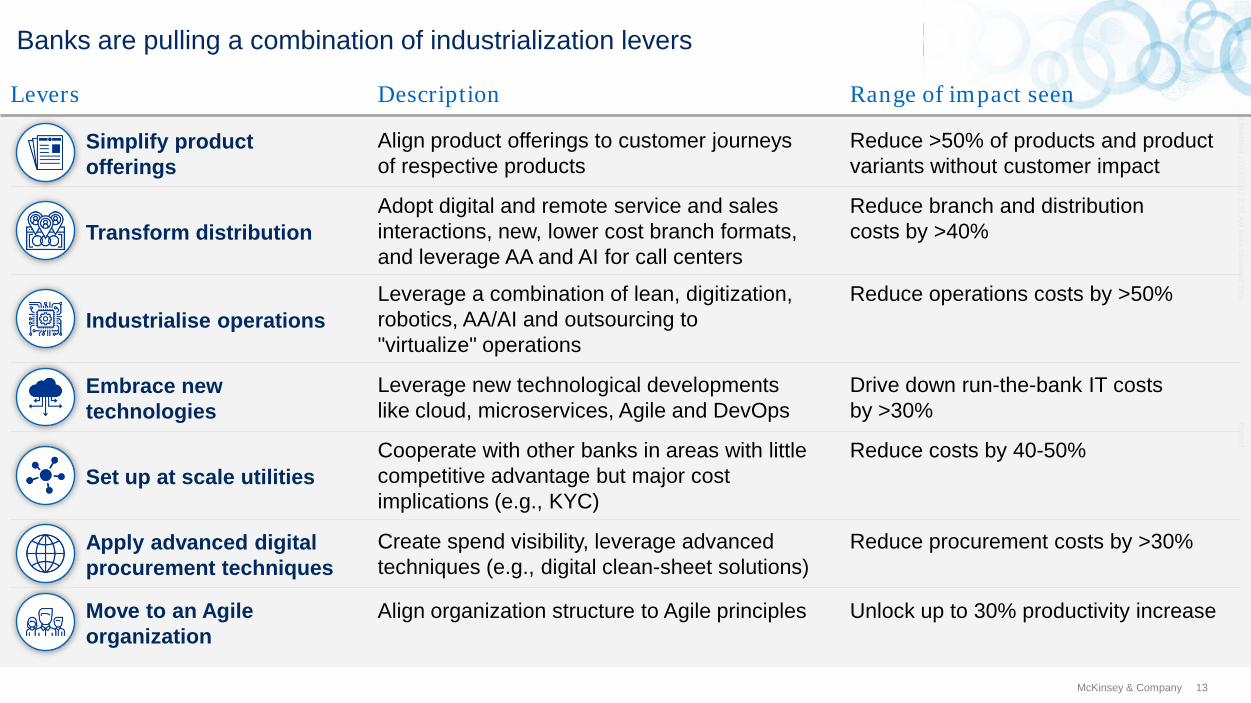
Banks are pulling a combination of industrialization levers
Levers
Industrialise operations Reduce operations costs by >50%
Embrace new technologies
Drive down run-the-bank IT costs by >30%
Set up at scale utilities Reduce costs by 40-50%
Apply advanced digital procurement techniques
Reduce procurement costs by >30%
Move to an Agile organization
Unlock up to 30% productivity increase
Transform distribution Reduce branch and distribution costs by >40%
Description
Leverage a combination of lean, digitization, robotics, AA/AI and outsourcing to "virtualize" operations
Leverage new technological developments like cloud, microservices, Agile and DevOps
Cooperate with other banks in areas with little competitive advantage but major cost implications (e.g., KYC)
Create spend visibility, leverage advanced techniques (e.g., digital clean-sheet solutions)
Align organization structure to Agile principles
Adopt digital and remote service and sales interactions, new, lower cost branch formats, and leverage AA and AI for call centers
Align product offerings to customer journeys of respective products
Simplify product offerings
Reduce >50% of products and product variants without customer impact
Range of impact seen
Last Modified 11/14/2017 2:37 AM
India Standard Time
Printed
14 McKinsey & Company
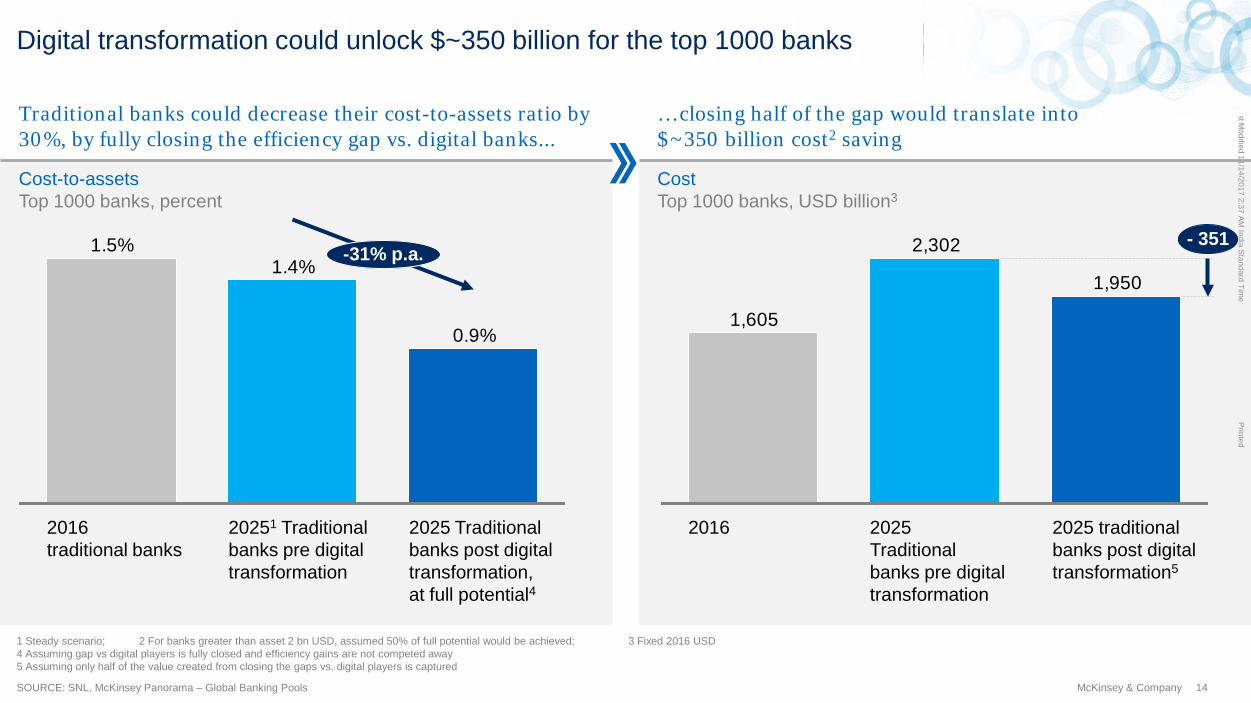
0.9%
1.4%1.5%
2025 Traditional banks post digital transformation, at full potential4
-31% p.a.
2016 traditional banks
20251 Traditional banks pre digital transformation
1,950
2,302
1,605
2016 2025 Traditional banks pre digital transformation
2025 traditional banks post digital transformation5
- 351
1 Steady scenario; 2 For banks greater than asset 2 bn USD, assumed 50% of full potential would be achieved; 3 Fixed 2016 USD 4 Assuming gap vs digital players is fully closed and efficiency gains are not competed away 5 Assuming only half of the value created from closing the gaps vs. digital players is captured
SOURCE: SNL, McKinsey Panorama – Global Banking Pools
Digital transformation could unlock $~350 billion for the top 1000 banks
Cost-to-assets Top 1000 banks, percent
Cost Top 1000 banks, USD billion3
Traditional banks could decrease their cost-to-assets ratio by 30%, by fully closing the efficiency gap vs. digital banks...
… closing half of the gap would translate into $~350 billion cost2 saving

Last Modified 11/14/2017 2:37 AM
India Standard Time
Printed
Agenda
15 McKinsey & Company
State of the industry
Digital and AA at scale
Eco-systems?
Last Modified 11/14/2017 2:37 AM
India Standard Time
Printed
16 McKinsey & Company
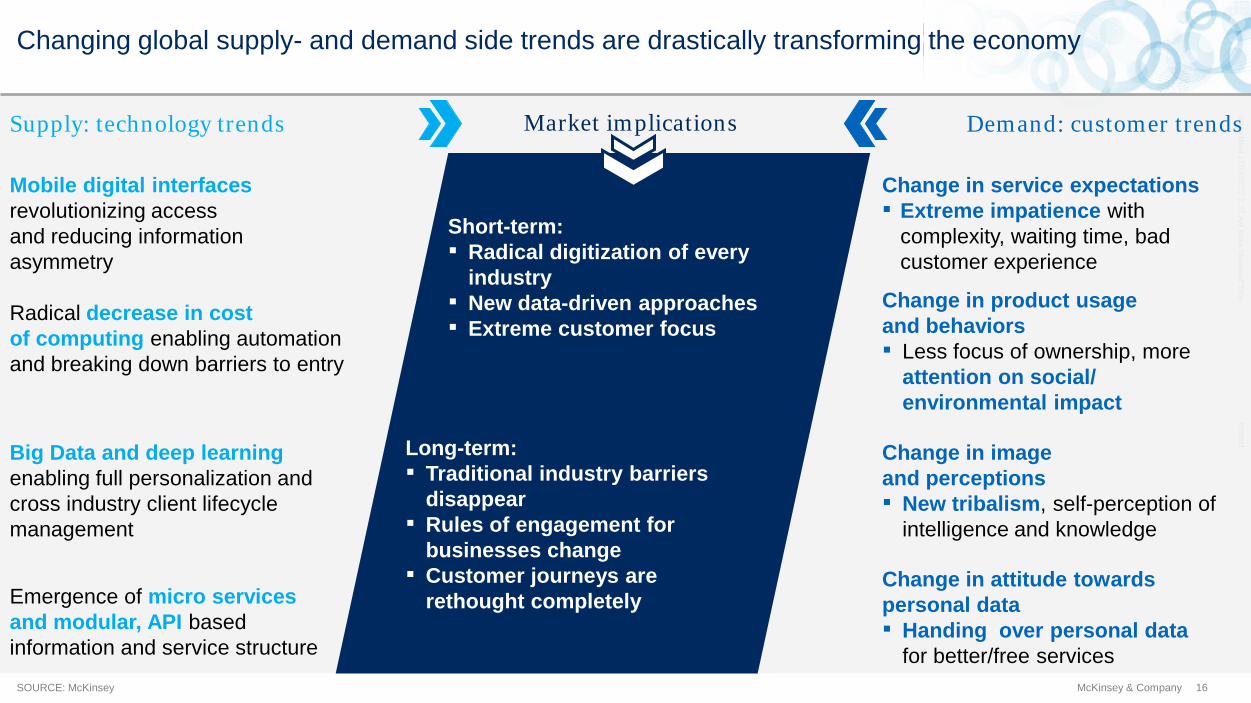
Changing global supply- and demand side trends are drastically transforming the economy
Supply: technology trends Demand: customer trends
Radical decrease in cost of computing enabling automation and breaking down barriers to entry
Change in product usage and behaviors ▪ Less focus of ownership, more
attention on social/ environmental impact
Big Data and deep learning enabling full personalization and cross industry client lifecycle management
Change in image and perceptions ▪ New tribalism, self-perception of
intelligence and knowledge
Mobile digital interfaces revolutionizing access and reducing information asymmetry
Change in service expectations ▪ Extreme impatience with
complexity, waiting time, bad customer experience
Short-term: ▪ Radical digitization of every
industry ▪ New data-driven approaches ▪ Extreme customer focus
Long-term: ▪ Traditional industry barriers
disappear ▪ Rules of engagement for
businesses change ▪ Customer journeys are
rethought completely
Market implications
Emergence of micro services and modular, API based information and service structure
Change in attitude towards personal data ▪ Handing over personal data
for better/free services SOURCE: McKinsey
Last Modified 11/14/2017 2:37 AM
India Standard Time
Printed
17 McKinsey & Company
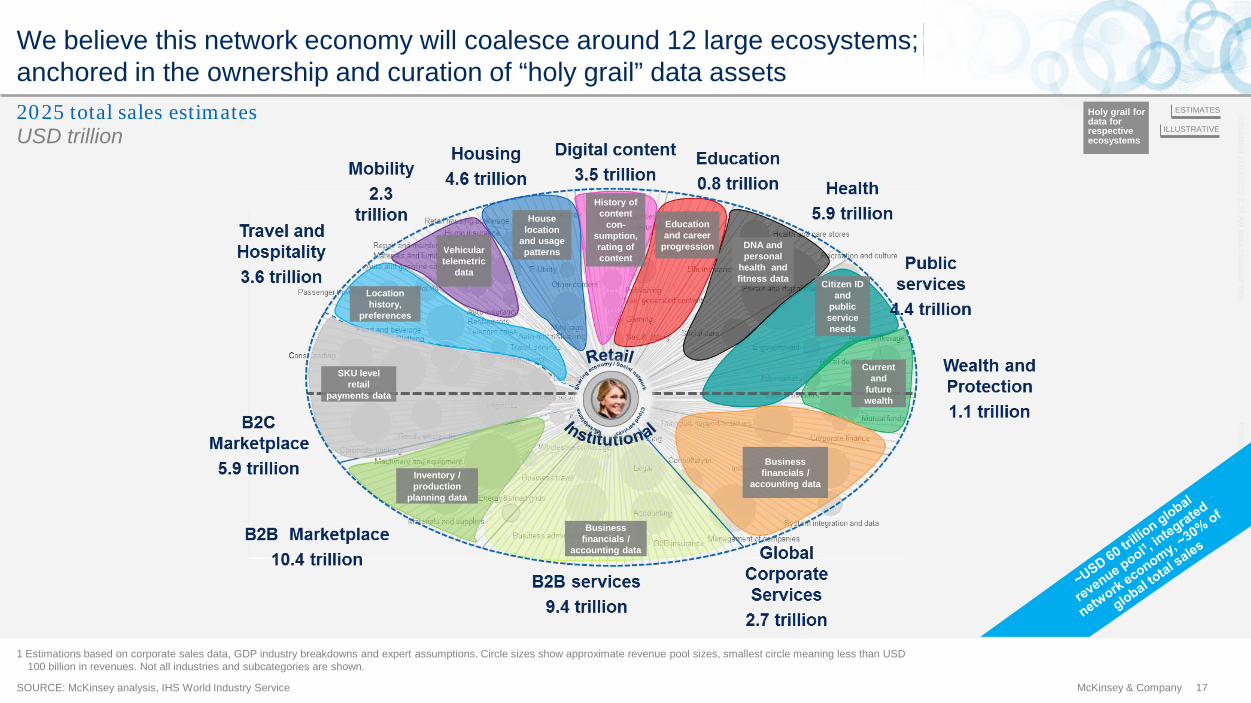
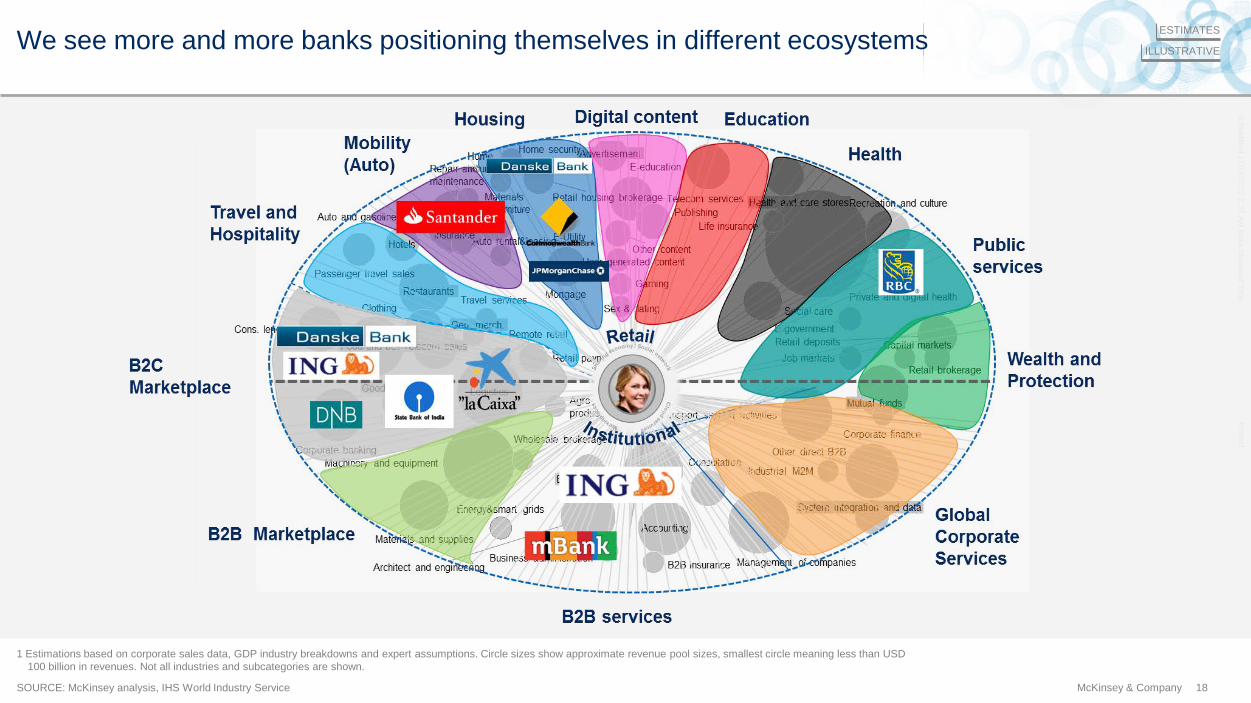
We believe this network economy will coalesce around 12 large ecosystems; anchored in the ownership and curation of “holy grail” data assets
SOURCE: McKinsey analysis, IHS World Industry Service
USD trillion 2025 total sales estimates
SKU level retail
payments data
House location
and usage patterns
History of content
con-sumption, rating of content
DNA and personal
health and fitness data
Inventory / production
planning data
Business financials /
accounting data
Vehicular telemetric
data
Education and career
progression
Citizen ID and
public service needs
Current and
future wealth
Business financials /
accounting data
Location history,
preferences
ILLUSTRATIVE
Holy grail for data for respective ecosystems
ESTIMATES
1 Estimations based on corporate sales data, GDP industry breakdowns and expert assumptions. Circle sizes show approximate revenue pool sizes, smallest circle meaning less than USD 100 billion in revenues. Not all industries and subcategories are shown.
Last Modified 11/14/2017 2:37 AM
India Standard Time
Printed
18 McKinsey & Company
We see more and more banks positioning themselves in different ecosystems
SOURCE: McKinsey analysis, IHS World Industry Service
ILLUSTRATIVE
ESTIMATES
1 Estimations based on corporate sales data, GDP industry breakdowns and expert assumptions. Circle sizes show approximate revenue pool sizes, smallest circle meaning less than USD 100 billion in revenues. Not all industries and subcategories are shown.
Last Modified 11/14/2017 2:37 AM
India Standard Time
Printed
19 McKinsey & Company
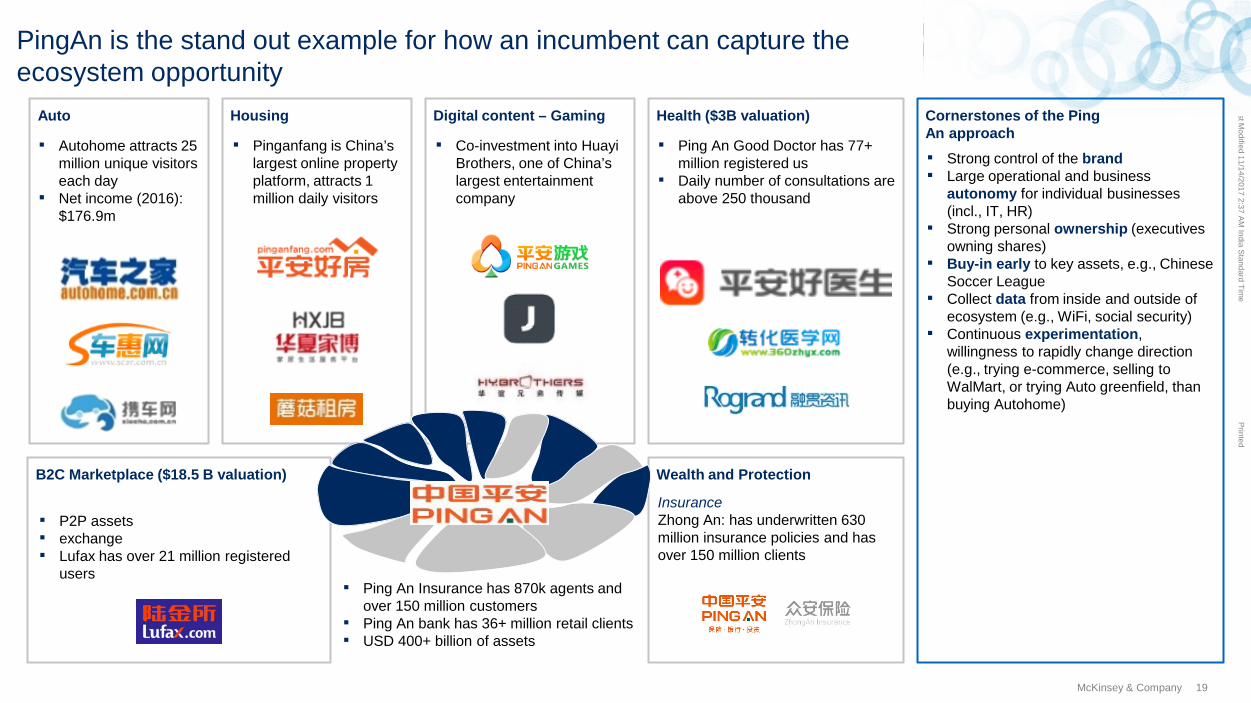
PingAn is the stand out example for how an incumbent can capture the ecosystem opportunity
Cornerstones of the Ping An approach
Housing
Wealth and Protection
Health ($3B valuation) Digital content – Gaming Auto
B2C Marketplace ($18.5 B valuation)
Insurance Zhong An: has underwritten 630 million insurance policies and has over 150 million clients
▪ Ping An Good Doctor has 77+ million registered us
▪ Daily number of consultations are above 250 thousand
▪ Co-investment into Huayi Brothers, one of China’s largest entertainment company
▪ Pinganfang is China’s largest online property platform, attracts 1 million daily visitors
▪ Autohome attracts 25 million unique visitors each day
▪ Net income (2016): $176.9m
▪ P2P assets ▪ exchange ▪ Lufax has over 21 million registered
users ▪ Ping An Insurance has 870k agents and
over 150 million customers ▪ Ping An bank has 36+ million retail clients ▪ USD 400+ billion of assets
▪ Strong control of the brand ▪ Large operational and business
autonomy for individual businesses (incl., IT, HR)
▪ Strong personal ownership (executives owning shares)
▪ Buy-in early to key assets, e.g., Chinese Soccer League
▪ Collect data from inside and outside of ecosystem (e.g., WiFi, social security)
▪ Continuous experimentation, willingness to rapidly change direction (e.g., trying e-commerce, selling to WalMart, or trying Auto greenfield, than buying Autohome)
Last Modified 11/14/2017 2:37 AM
India Standard Time
Printed
20 McKinsey & Company
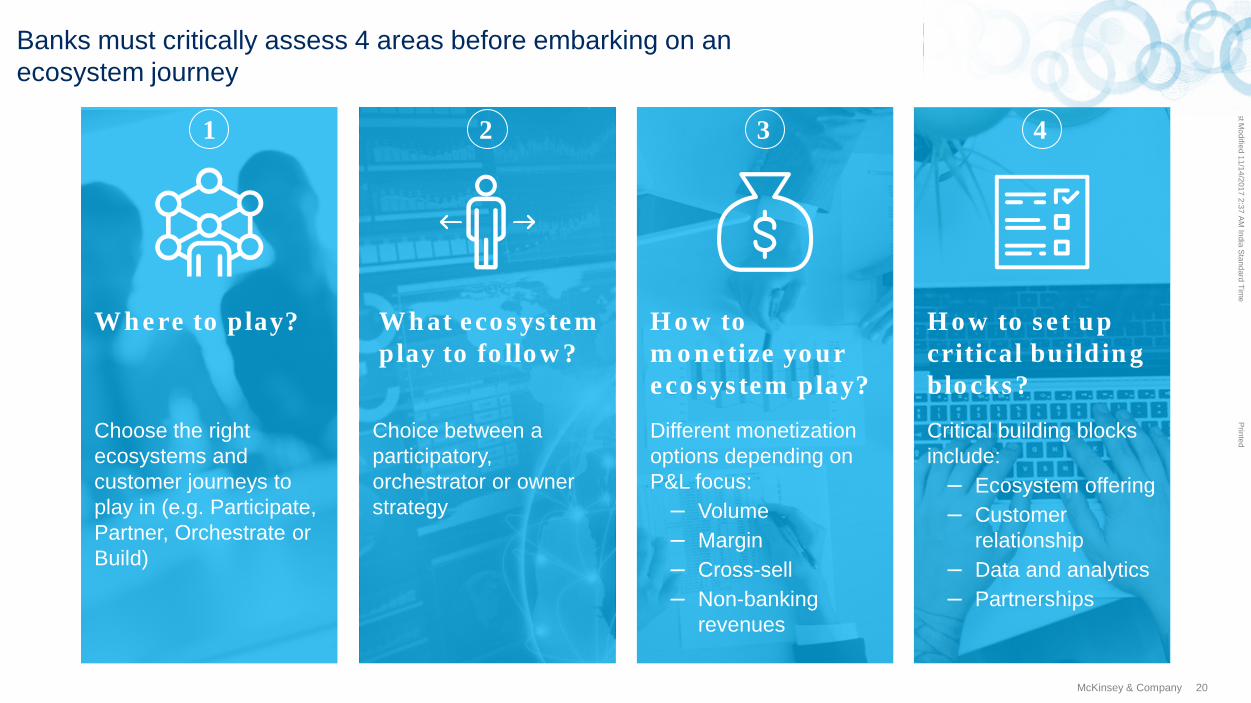
Banks must critically assess 4 areas before embarking on an ecosystem journey
1 2 3
4
How to set up critical building blocks?
How to monetize your ecosystem play?
What ecosystem play to follow?
Where to play?
Choose the right ecosystems and customer journeys to play in (e.g. Participate, Partner, Orchestrate or Build)
Different monetization options depending on P&L focus:
– Volume – Margin – Cross-sell – Non-banking
revenues
Critical building blocks include:
– Ecosystem offering – Customer
relationship – Data and analytics – Partnerships
Choice between a participatory, orchestrator or owner strategy
Last Modified 11/14/2017 2:37 AM
India Standard Time
Printed
21 McKinsey & Company
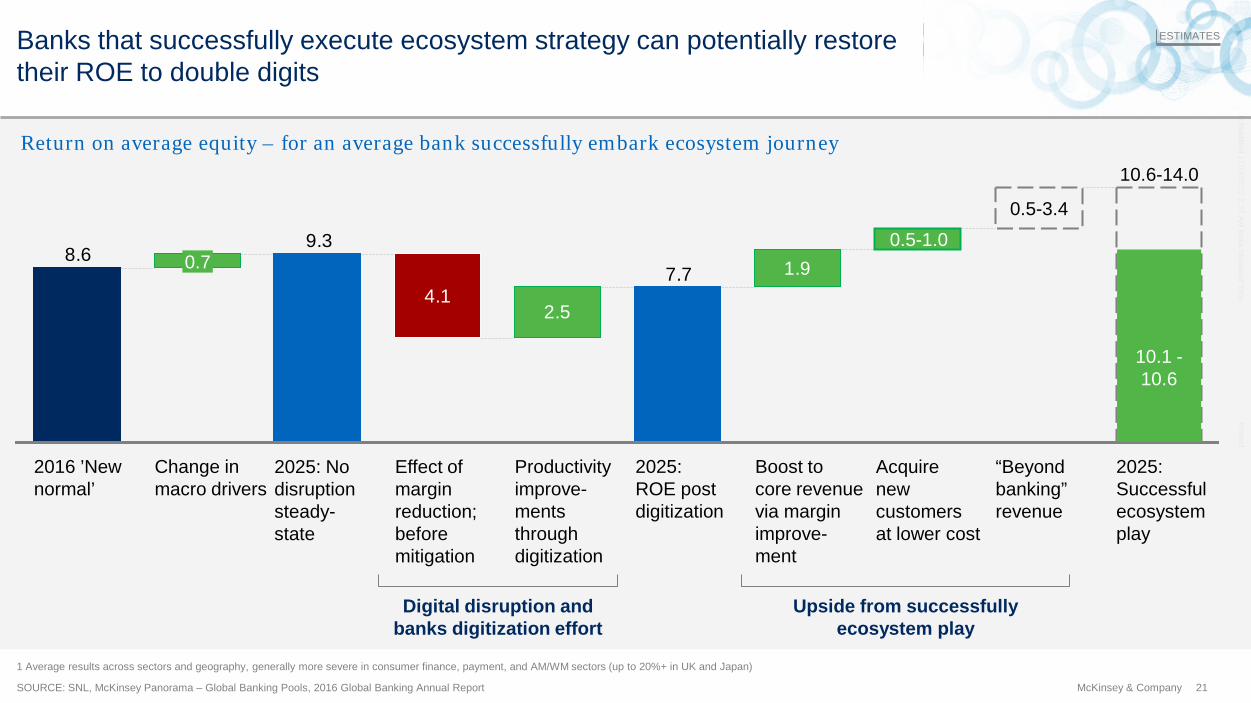
Banks that successfully execute ecosystem strategy can potentially restore their ROE to double digits
SOURCE: SNL, McKinsey Panorama – Global Banking Pools, 2016 Global Banking Annual Report
1 Average results across sectors and geography, generally more severe in consumer finance, payment, and AM/WM sectors (up to 20%+ in UK and Japan)
ESTIMATES
Upside from successfully ecosystem play
Return on average equity – for an average bank successfully embark ecosystem journey
7.7
9.38.6
1.9
2.54.1
Boost to core revenue via margin improve- ment
0.5-1.0 0.7
2025: ROE post digitization
Change in macro drivers
2016 ’New normal’
2025: Successful ecosystem play
Productivity improve-ments through digitization
10.6-14.0
“Beyond banking” revenue
0.5-3.4
Acquire new customers at lower cost
Effect of margin reduction; before mitigation
2025: No disruption steady- state
10.1 -10.6
Digital disruption and banks digitization effort