the costs of training health professionals in the … · ii the costs of training health...
TRANSCRIPT

The cosTs of Training healTh professionals in The republic of Moldova
Republic of MoldovaHealth Policy Paper Series No. 12


The cosTs of Training healTh professionals in The republic of Moldova

II The cosTs of Training healTh professionals in The republic of Moldova
Address requests about publications of the WHO Regional Office for Europe to: Publications WHO Regional Office for Europe UN City, Marmorvej 51 DK-2100 Copenhagen Ø Denmark Tel.: +45 45 33 70 00; Fax: +45 45 33 70 01Alternatively, complete an online request form for documentation, health information, or for permission to quote or translate, on the Regional Office web site (http://www.euro.who.int/pubrequest).
All rights reserved. The Regional Office for Europe of the World Health Organization welcomes requests for permission to reproduce or translate its publications, in part or in full.
The designations employed and the presentation of the material in this publication do not imply the expres-sion of any opinion whatsoever on the part of the World Health Organization concerning the legal status of any country, territory, city or area or of its authorities, or concerning the delimitation of its frontiers or boundaries. Dotted lines on maps represent approximate border lines for which there may not yet be full agreement.
The mention of specific companies or of certain manufacturers’ products does not imply that they are en-dorsed or recommended by the World Health Organization in preference to others of a similar nature that are not mentioned. Errors and omissions excepted, the names of proprietary products are distinguished by initial capital letters.
All reasonable precautions have been taken by the World Health Organization to verify the information con-tained in this publication. However, the published material is being distributed without warranty of any kind, either express or implied. The responsibility for the interpretation and use of the material lies with the reader. In no event shall the World Health Organization be liable for damages arising from its use. The views expressed by authors, editors, or expert groups do not necessarily represent the decisions or the stated policy of the World Health Organization.
© World Health Organization 2014
Keywords
CoNtiNuiNg MediCal eduCatioNeduCatioN, PubliC HealtH PRofeSSioNalfiNaNCial MaNageMeNtNuRSeSPHySiCiaNSPubliC HealtH

IIIThe cosTs of Training healTh professionals
in The republic of Moldova
conTenTsacknowledgements ..................................................................................................................................................................................................................................iVlist of abbreviations................................................................................................................................................................................................................................... Vlist of tables and figures .......................................................................................................................................................................................................................Viexecutive summary ................................................................................................................................................................................................................................. Vii1. background, scope and purpose of the study ..........................................................................................................................................................12. Methods of costing health professionals’ training ................................................................................................................................................3
2.1 Some premises about costs and costing ......................................................................................................................................................32.2 Method a: average cost of training based on output volumes..............................................................................................72.3 Method b: average cost of training based on activity analysis ...............................................................................................82.4 Method C: average cost of training based on cost centres (step-down method) ........................................... 122.5 Method d: differential cost of training ....................................................................................................................................................... 142.6 Costing joint outputs: training, care and research .......................................................................................................................... 17
3. Health professionals’ training in the Republic of Moldova ....................................................................................................................... 193.1 organization of health professionals’ training .................................................................................................................................... 19
3.1.1 training of medical doctors ................................................................................................................................................................ 193.1.2 training of nurses and other health professionals with specialized secondary education . 253.1.3 Continuing medical education (CMe) ...................................................................................................................................... 26
3.2 financing of health professionals’ training ............................................................................................................................................. 273.2.1 budgeting ............................................................................................................................................................................................................ 273.2.2 financial management ........................................................................................................................................................................... 31
4. Costing health professionals’ training in the Republic of Moldova .................................................................................................. 364.1 baseline data ........................................................................................................................................................................................................................ 364.2 Cost of training medical doctors ...................................................................................................................................................................... 384.3 Cost of training nurses and other health professionals with specialized secondary education ....... 53
5. a roadmap for decision-making in health professionals’ training..................................................................................................... 575.1 better cost information for better policies .............................................................................................................................................. 575.2 Should the number of medical and nursing graduates be increased? ....................................................................... 605.3 Suggestions for the future ...................................................................................................................................................................................... 63
5.3.1 Monitoring of resource consumption ...................................................................................................................................... 635.3.2 definition of funding mechanisms ............................................................................................................................................. 645.3.3 Pricing of health professionals’ training ................................................................................................................................. 64
References ........................................................................................................................................................................................................................................................ 66annex 1. admissions to State university of Medicine and Pharmacy “Nicolae testemiţanu”, all levels of
instruction, 2003–2012 .............................................................................................................................................................................................. 69annex 2. graduates of State university of Medicine and Pharmacy “Nicolae testemiţanu”, all levels of
instruction, 2003–2012 .............................................................................................................................................................................................. 70annex 3. average number of trainees enrolled at State university of Medicine and Pharmacy “Nicolae
testemiţanu”, all levels of instruction, 2003–2012 .......................................................................................................................... 71annex 4. admissions, graduates and average number of students enrolled in medical colleges and
CMe centres for health professionals with secondary education, 2003–2012 ................................................... 72annex 5. tuition fees charged to Moldovan students enrolled on a contractual basis at the State
university of Medicine and Pharmacy “Nicolae testemiţanu” (Mdl), 2003– 2012 .......................................... 73

IV The cosTs of Training healTh professionals in The republic of Moldova
acKnowledgeMenTsThis report was produced through the biennial collaborative agreements, covering 2012–2013, between the Ministry of Health of the Republic of Moldova and the World Health Organization (WHO). The publication forms part of the Health Policy Papers series launched in 2011 with the aim of strengthening the health system in the Republic of Moldova in line with the national health policy and strategy for the development of the health-care system.
This document has been produced with the financial assistance of the EU project “Better manag-ing the mobility of health professionals in the Republic of Moldova” coordinated by the WHO Country Office in the Republic of Moldova. One of the specific objectives of the project includes expansion of the information and knowledge base on the migration of Moldovan health profes-sionals for ensuring greater use of evidence in policy decisions, in order to provide an important basis for decisions concerning health personnel management by the authorities of the Republic of Moldova. The selection and interpretation of the findings as presented in this report are solely those of the report team and do not necessarily reflect the views of either WHO or the European Commission.
A number of people and organizations should be acknowledged for their essential contributions to the preparation of this publication:
• Luca G Brusati, Professor, Interdepartmental Centre of Research on Welfare (CIWE), University of Udine (Udine, Italy) & Centre for Research on Health and Social Care Management (CERGAS), Bocconi University (Milan, Italy) – the principal author;
• Galina Perfilieva, Programme Manager, Human Resources for Health, Division of Health Systems and Public Health, WHO Regional Office for Europe, Copenhagen, for her overall supervision of the assessment;
• Jarno Habicht, WHO Representative in the Republic of Moldova for his guidance and valuable support;
• Ala Nemerenco, Team Leader, “Better managing the mobility of health professionals in the Republic of Moldova” project, WHO Country Office in the Republic of Moldova, Chisinau, for her constant guidance and valuable insights throughout the process of col-lecting, validating and presenting data in this report;
• Altin Malaj, Project Coordinator, WHO Regional Office for Europe, Copenhagen, for his constructive feedback on many drafts of this document;
• Ina Hristescu, Consultant, Ministry of Health of the Republic of Moldova; Svetlana Lupasco, Chief Economist, State University of Medicine and Pharmacy “Nicolae Testemiţanu”, Chisinau; Tatiana Nicu, Chief Accountant, National College of Medicine and Pharmacy “Raisa Pacalo”, Chisinau; Violeta Josanu, Chief Accountant, Continuing Medical Education Centre for Medical and Pharmaceutical Professionals with Secondary Education, Chisinau; and Angela Tomacinschii, Head of Department, University Clinic of Primary Health Care, State University of Medicine and Pharmacy “Nicolae Testemiţanu”, Chisinau – for their invaluable contributions to data collection and provision of oppor-tunities to share views.
Thanks are also due to the organizations that kindly gave permission to use their information sources for the analysis presented here, including: Ministry of Health of the Republic of Moldova; State University of Medicine and Pharmacy “Nicolae Testemiţanu”, Chisinau; National College of Medicine and Pharmacy “Raisa Pacalo”, Chisinau; and Continuing Medical Education Centre for Medical and Pharmaceutical Professionals with Secondary Education, Chisinau.

VThe cosTs of Training healTh professionals
in The republic of Moldova
lisT of abbreviaTionsCaPeX capital expenditureCMe continuing medical educationeRP enterprise resource planningMdl Moldovan leiuS$ united States dollar000s thousands

VI The cosTs of Training healTh professionals in The republic of Moldova
Tables and figuresTables
table 3.1. admissions to undergraduate medical education, by faculty, academic year 2012–2013 ............... 20table 3.2. admissions to residency-based postgraduate medical education, by specialty, academic
year 2012–2013 ............................................................................................................................................................................................................ 22table 4.1. average accounting expenditures for one year of undergraduate medical training (Mdl),
2003–2012......................................................................................................................................................................................................................... 39table 4.2. average accounting expenditure for one year of residency training (Mdl), 2003–2012 ................... 40table 4.3. average accounting expenditure for one year of fellowship training (Mdl), 2003–2012 ................. 41table 4.4. average accounting expenditure for one year of master’s degree training (Mdl), 2003–2012 ....... 42table 4.5. average accounting expenditure for one month of CMe (Mdl), 2003–2012 ................................................ 43table 4.6. average cost for one year of undergraduate medical training Mdl 000s), 2003–2012 ....................... 45table 4.7. average cost for one year of residency training (Mdl 000s), 2003–2012 .......................................................... 46table 4.8. average cost for one year of fellowship training (Mdl 000s), 2003–2012......................................................... 47table 4.9. average cost for one year of master’s degree training (Mdl 000s), 2003–2012 .......................................... 48table 4.10. average cost for one month of CMe (Mdl 000s), 2003–2012 ........................................................................................ 49table 4.11. library costs associated with training of doctors and pharmacists (Mdl 000s), 2010–2012 ......... 50table 4.12. dormitory subsidies associated with training of doctors and pharmacists (Mdl 000s),
2010–2012......................................................................................................................................................................................................................... 51table 4.13. Reference cost for one year of medical training for all levels of university education (Mdl),
average 2010–2012 .................................................................................................................................................................................................. 52table 4.14. Reference cost for full cycle of medical training for all levels of university education (Mdl/
uS$), average 2010–2012 ................................................................................................................................................................................... 53table 4.15. average cost for one year of specialized secondary medical education (Mdl), 2010–2012........... 54table 4.16. average cost for one month of CMe for health professionals with secondary specialized
education (Mdl), 2010–2012 ......................................................................................................................................................................... 55table 4.17. Reference cost for one year of specialized secondary medical education (Mdl), average
2010–2012......................................................................................................................................................................................................................... 55table 4.18. Reference cost for full cycle of specialized secondary medical education (Mdl/uS$),
average 2010–2012 .................................................................................................................................................................................................. 56table 5.1. Comparison of average accounting expenditure with average costs and tuition fees for
one year of undergraduate medical training (Mdl), 2008–2012 ................................................................................ 58
Figures
fig. 2.1. framework for calculation of average cost of training based on activity analysis ........................................9fig. 2.2. framework for calculation of differential cost of training .................................................................................................. 15fig. 5.1. Relationships between functions and objectives of a health system .................................................................... 61fig. 5.2. overview of dynamics influencing cost effectiveness of health professionals’ training in
the Republic of Moldova ..................................................................................................................................................................................... 62fig. 5.3. Reference framework for value-based pricing of training services for employers in
destination countries ............................................................................................................................................................................................. 65

VIIThe cosTs of Training healTh professionals
in The republic of Moldova
execuTive suMMaryThe issue of international mobility of health professionals has attracted significant at-tention in the health policy community over the last few years. Uneven distribution of the stock of health professionals (both on a global scale and within each WHO Region) is further compounded by an increase in international migratory processes as (more and more often) doctors, nurses and other health professionals trained in one country settle in a different country and provide their services there, attracted by better working and living conditions. Some migrate after serving for a while in the country where they were trained, taking with them valuable first-hand experience. More worryingly, many migrate immediately after completing their studies, signalling that this might have been their plan since enrolment.
Migration to a new country is undoubtedly a basic human right. Yet this phenomenon deserves attention in policy terms, as the ability to retain qualified health professionals is essential for any health system to deliver its expected outcomes. The issue is even more relevant when it is taken into account that, for obvious reasons, destination coun-tries are wealthier than sending countries, yet the former enjoy a financial benefit at the expense of the latter since they can employ health professionals without bearing the expenditures needed for their training. This implicit subsidy raises obvious concerns, in terms of fairness, that cannot be easily solved.
International mobility of health professionals is a global issue but the significant imbal-ances it presents means that the WHO European Region is not immune to this problem. With very high levels of brain drain and brain waste, the Republic of Moldova offers a case in point. Information about the international mobility of Moldovan health pro-fessionals is still incomplete, but the statistics compiled by Galbur (2010) show (for in-stance) that only 38% of the graduates who completed residency or fellowship training from 2003 to 2009 were working for public health services providers in the Republic of Moldova in 2010. Even accounting for graduates hired by private health services provid-ers or practising independently, this figure still suggests that half of the expenditure on medical training was showing no material benefit.
The size of the phenomenon justifies an effort to obtain better understanding of its driv-ers and implications in order to take corrective policy actions. This is the overall ob-jective of the EC-funded project “Better managing the mobility of health professionals in the Republic of Moldova”. In the framework of this project, an important piece of

VIII The cosTs of Training healTh professionals in The republic of Moldova
information to be supplied to policy-makers is the cost of brain drain. However, this is an area with no settled methodology: some authors include the social costs for the send-ing country (in terms of lost benefits); others include the overall cost of training health professionals (starting from primary school education); and the corresponding figures are estimated relying on different proxies.
For the purpose of this report a more conservative estimate has been chosen, focusing on the expenditures borne directly by the health system of the Republic of Moldova to train doctors, nurses and other health professionals with specialized secondary educa-tion. As yet, the medical and nursing educational institutions in the Republic of Moldova lack fully fledged cost accounting systems. Hence, the average cost of training had to be estimated on the basis of cash accounting information, introducing the corrections required to provide a reliable estimate of resource consumption.
In the Republic of Moldova, the organizational and financial arrangements between medical and nursing educational institutions and the health services providers where students develop their practical skills simplify the challenge faced elsewhere when cal-culating the cost of medical and nursing training (i.e. the presence of joint outputs for training, research and health service provision). Medical research is performed almost exclusively by the Academy of Sciences of Moldova. In addition, contracts between edu-cational institutions and health services providers are based on the assumption that the value of the clinical activities performed by the academic staff offset the reimbursements associated with the health services they help to provide. Hence, cross-payment for using health services providers as training bases is limited to utility costs. In line with this as-sumption, for the purposes of this report it was posited that all the expenditures borne by medical and nursing educational institutions are instrumental in training activities.
Calculation of reliable cost estimates presented a two-pronged challenge. Firstly, cash accounting records the moment when expenditures are borne but calculation of costs requires the moment when resources are actually used to support medical and nursing education to be taken into account. Hence, depreciation of capital expenditure (CAPEX) had to be introduced. Secondly, and most importantly, most faculties and levels of in-struction have both budget-funded and contract-based training which influences ac-counting records, since some inputs are funded from budget and others are paid from fees, even when those inputs are used to provide educational services to both cate-gories of students. This internal allocation of expenditures is justified by the need to comply with accounting regulations but is a source of distorted information because it is currently used as the starting point to update students’ fees, as if it truly expresses

IXThe cosTs of Training healTh professionals
in The republic of Moldova
resource consumption. Therefore, for this study it was necessary to distinguish the costs borne exclusively for a given category of students (e.g. scholarships for budget-funded students) from costs allocated to categories for accounting purposes but actually used for all students.
The resulting figures highlight that five years of undergraduate medical training cost Moldovan taxpayers about US$ 13 500 for a budget-sponsored student; contract-based training for the same profile costs US$ 9300 (gross of fees). Similarly, three years of residency training for a therapeutic profile cost US$ 9400 for budget-sponsored students and US$ 5400 for fee-paying students, bringing the total cost of training to US$ 22 900 and US$ 14 700, respectively. For nurses and other professionals with specialized sec-ondary medical education, three years of training are estimated to cost US$ 3000 for budget-sponsored students and US$ 2000 (gross of fees) for contract-based students.
The figures provided by this report can serve as the basis for more comprehensive es-timates of the overall social cost of brain drain. However, it is suggested here that the actual expenditures borne directly by the health system of the Republic of Moldova are more relevant for policy-makers because they highlight the opportunity cost of a dis-torted policy in the field of human resources for health. This information is even more important at a time when the legal status and funding mechanisms of Moldovan higher education institutes are undergoing sweeping reforms.
The results of the report suggest that the medical educational system of the Republic of Moldova trains far too many people (taking into account the real absorption capac-ity of domestic health services providers) and charges too little to fee-paying students, granting them a subsidy funded by Moldovan taxpayers. In addition, there is systematic failure to enforce the obligation for students who receive a state scholarship to work for public sector providers, thereby offering them a sizable implicit subsidy paid by taxpay-ers. In brief, the picture emerging from this report shows clearly that the way in which medical, nursing and other health professionals’ training is currently funded creates strong incentives that promote, rather than deter, brain drain.


1The cosTs of Training healTh professionals
in The republic of Moldova
1. Background, scope and purpose of the studyThe possibility to migrate from a country and settle elsewhere is undoubtedly a basic human right. Yet, in the case of the Republic of Moldova it must be acknowledged that international migration of health professionals in the past 20 years has resulted in a significant amount of brain drain and brain waste. Doctors, nurses and other health pro-fessionals trained in the Republic of Moldova leave for destination countries, mostly EU Member States, where they gain employment outside the health sector, or in jobs other than those for which they were trained. This results in brain waste. According to Galbur (2010), only 38% of the graduates who completed residency or fellowship train-ing from 2003 to 2009 were working for public health services providers in the Republic of Moldova in 2010. Health professionals leave their home country either immediately after graduation or after working in the health sector for several years. Due to migration, the Republic of Moldova registers a net financial loss resulting from the costs associated with medical or nursing training. If migration takes place over a long period of time, the losses include the years of service that migrant health professionals would have pro-vided to the home country. Conversely, many destination countries train fewer health professionals than required and depend on immigration to make up the shortfall. In this way countries such as the Republic of Moldova are effectively paying to train staff who then support health services’ provision in wealthier countries.
The EC-funded project “Better managing the mobility of health professionals in the Republic of Moldova” pursues the overall objective of strengthening the country’s ca-pacity to manage the mobility of Moldovan health professionals and to build up a better framework for legal migration between the Republic of Moldova and the EU in order to mitigate the negative impacts of migration on the Moldovan health system, as well as facilitating the reintegration of returning health professionals.
In the framework of this project, Specific Objective 1 is “to expand the information and knowledge base on the migration of Moldovan health professionals, in order to pro-vide an improved basis for decisions concerning health personnel management by the Moldovan authorities”. Within the activities envisaged in the corresponding project component, a study was commissioned with the aim of elucidating the average cost per graduate of training for medical doctors and nurses in the Republic of Moldova, and thus

2 The cosTs of Training healTh professionals in The republic of Moldova
appreciating the cost of brain drain and brain waste. The study was required specifically to address seven original research questions.
1. What is the annual number of admissions for the past 10 years (for all levels)?2. What is the annual number of graduates for the past 10 years (for all levels)?3. What is the annual training capacity (in numbers) for each educational
establishment?4. What are the annual costs of the Medical University and College of Nursing
(staff, operations, equipment, etc.) [as annual average for the last 10-year period]?
5. What are the tuition fees, accommodation fees, meals costs, transport costs, costs of textbooks, uniform for general primary and secondary education and for medical and nursing education (per each year of education)?1
6. What is the average cost of training for general medical and nursing education?7. Is it possible to increase the number of medical and nursing graduates per year?
If yes, what would be the number of fresh graduates per year? What would be the financial bill linked to the increase?
To provide evidence-based answers to these questions, Section 2 begins with a dis-cussion of the methodological alternatives available for costing health professionals’ training, outlining the requirements, advantages and disadvantages of each approach. Section 3 describes the patterns adopted in the Republic of Moldova for the organiza-tion and funding of the system ensuring the training at all levels of health professionals of different profiles; research questions 1, 2 and 3 are addressed in the annexes to this chapter. Section 4 summarizes the key findings of this study, addressing in particular re-search questions 4, 5 and 6. Section 5 presents the key insights emerging from this study, addressing research question 7 and offering some recommendations on how to use cost information to improve decision-making in health professionals’ training.
1 For the reasons discussed in section 4.1. the study focused on the cost of medical and nursing educa-tion. The cost of meals and uniforms has not been accounted for, since they are purchased independently by students; the same applies to the cost of textbooks and of transportation (costs associated with libraries and transportation subsidies paid out by educational institutions have been accounted for).

3The cosTs of Training healTh professionals
in The republic of Moldova
2. Methods of costing health professionals’ training2.1 Some premises about costs and costing
Economic analysis in health care in general – and, more specifically, the analysis of health-related services and activities – has become increasingly important over the last few years. This happens because resource constraints (both financial and material) dic-tate the need to increase the cost effectiveness of not only health systems as a whole, but also their components. Effectiveness has been a longstanding matter of concern in the field of health professionals’ training, but the other side of the coin (i.e. its cost) also deserves attention. This is even more important in a country such as the Republic of Moldova, which is missing much of the return on this investment due to brain drain and brain waste.
Some important premises must be spelled out before addressing the specifics of each costing method. These are necessary to understand the informational value of any figure presented as the answer to the basic question underlying this assignment: how much does it cost to train a health professional? They are also intended to help understand that the wildly different figures on the cost of training in different countries available in the literature are likely to depend on the use of different methods, and not on different underlying conditions alone.
By definition, costs measure resource consumption and therefore costing means quanti-fying in monetary terms the amount of resources used. But in absolute terms there is no such thing as the true cost of a product or service; and generally speaking there is no one appropriate method. Resource consumption can be calculated to meet different infor-mation needs (e.g. choice between alternative decisions, such as in-house provision ver-sus outsourcing; comparison across training institutions; planning at national level or at the level of a specific training provider; reimbursement; price setting). Consequently, the suitability of a costing method can be assessed only once the information needs to be met have been clearly spelled out (Mendoza & Bescos, 2001; Nyland & Petterson, 2004). The point is to assess whether a method will allow information needs to be met; only in this perspective is it possible to assess whether one approach to costing is superior

4 The cosTs of Training healTh professionals in The republic of Moldova
to another. This implies that different figures can be the answer to different information needs.
In this section, available techniques are grouped into four clusters based on the ap-proach used to calculate health professionals’ training costs. These are presented start-ing with a description of the simplest method, before progressing through the more sophisticated alternatives. The grouping is based on the review of international prac-tices in this area, performed both on the basis of the relevant literature (e.g. Kummer, Bednash & Redman, 1987; Schilling, 1987; Carrin & Evlo, 1992; Catturi et al., 1995; Jones & Korn, 1997; Northcott & Llewellyn, 2002; Barretta, 2005) and on the author’s profes-sional experience in a variety of countries across western and eastern Europe (Brusati, 2006a; 2006b).
Each method has advantages and disadvantages that must be taken into account when selecting an approach to meet a given information need. Each of the four clusters con-tains a modicum of variations, but these concern specific technical choices rather than the overarching rationale behind the method. A standard format is provided for each method: a description of the rationale and underlying principles, followed by a quantita-tive example to clarify the way in which it works. Requirements are spelled out, together with possible variations that can exist in specific techniques belonging to the same clus-ter (linked again to the information needs to be met, variations refer primarily to what items must be included and what items must be excluded for costing purposes) and, finally, a discussion of the general strengths and weaknesses.
It is important to remember that the methods presented here address costing rather pricing issues. Cost information can be, and often is, used for financing purposes (e.g. Ellwood, 1997). Here, the focus is on the first step of the decision-making process be-cause financing decisions in the real world are made more complex by the pursuit of objectives other than sheer cost reimbursement (e.g. cost containment; incentives to improve efficiency or geographical redistribution; incentives to develop or curtail certain activities).
In the following pages it is assumed that the reader is familiar with the difference be-tween costs (i.e. resource consumption) and expenses (i.e. monetary outlays): resource consumption might take place at a different time from when the expense was borne. For instance, consumption materials purchased in a given year might be used in the following year; overtime accrued in a given period might be paid out much later; and investments are expected to have a useful economic life lasting over several years. Many

5The cosTs of Training healTh professionals
in The republic of Moldova
training institutions (especially if they are state-funded) face the practical challenge of relying on a cash-based rather than an accrual-based accounting system. For example, accountants would record the expenses borne in setting up a new educational labora-tory but would not calculate the depreciation rate which, under an accrual-based ac-counting system, would be used to measure utilization of the laboratory (i.e. resource consumption).
When discussing the cost of health professionals’ training, it is also important to bear in mind the difference between average and marginal (or differential) costs.2 The former concept is straightforward – when accounting for the amount of resources used to de-liver training, average costs include both:
• the full value of the resources used specifically to train a single trainee, such as consumption materials or a state-sponsored scholarship (direct costs);
• a share of the value of resources not used specifically to train a single trainee, such as the salary of an instructor or the heating costs of a building (indirect costs).
Marginal costs measure the value of the additional resources needed. For instance, to train one more student, enrol one more group of applicants, or offer one more postgrad-uate specialization (and, vice versa, the value of the resources saved if an extra student is not trained; additional group of applicants is not enrolled, or existing specialization is discontinued). A significant share of the overall costs of a training institution is either fixed (i.e. does not change with activity volumes) or semi-fixed (i.e. changes only in case of significant variations in activity volumes). For example, one additional student is un-likely to require more instructors, but an additional intake of 100 students most probably will. As a consequence, average costs in a training institution are usually much higher than marginal costs. The methods presented in sections 2.2, 2.3 and 2.4 are meant to calculate average costs, whereas the method presented in section 2.5 is meant to calcu-late differential costs.
A further clarification must be made. All the formulae associated with the methods de-scribed below can be applied either to the calculation of actual costs (i.e. taking account of the exact expenditure actually undertaken by a given training institution at a given time) or to the calculation of so-called standard costs (i.e. taking account of reference expenditures). For example, the reference cost of an instructor, rather than the specific
2 Differential costs are sometimes referred to as incremental costs. Consequently, differential analysis is also called incremental analysis. Differential is more precise than incremental because the same method must take into account not only cost increases, but also cost decreases.
6 The cosTs of Training healTh professionals in The republic of Moldova
salary of a specific professor in a specific year or month; or the average cost of a syringe on the market, rather than the specific unit cost of a specific model of syringe, featured on a specific invoice of a specific health services provider at a specific time. Both options can be appropriate but will depend on the need that information is meant to satisfy. As a rule of thumb, actual costs are used when analysing past expenditures (although standard costs could also be used), whereas standard costs are used when considering decisions for the future. For instance, actual costs can be used to compare the efficiency levels of different medical colleges; standard costs are used to establish a new funding scheme based on cost reimbursements.
Four methods for costing health professionals’ training are presented in the following sections. An additional approach can be found in the health economics literature but is not considered here –the use of regression analysis to explain the difference in the cost of treatment between teaching and non-teaching hospitals (e.g. Dobson et al., 1994; Mechanic, Coleman & Dobson, 1998; López-Casasnovas & Saez, 1999). This approach is intrinsically complex since it requires available data to be corrected to account for differences in case mix, resulting in a percentage that expresses the increased cost of treatment in teaching hospitals versus non-teaching hospitals rather than the average cost of training for medical training. Two other reasons make it impossible to use this ap-proach in the case of the Republic of Moldova. Firstly, the country has only one medical university, so the corresponding data set is not suitable for regression analysis. Secondly, and most importantly, this medical university does not deliver health services directly, but rather contributes to health services provision in the hospitals that serve as its clini-cal bases, thus blurring any cost comparison.
Last but not least, and in keeping with the terms of reference, the analysis is limited to the costs associated with the training process taking place in medical universities or colleges. Especially when associated with the international mobility of health-care professionals, other studies have included additional items when calculating the cost of brain drain. These include the cost of primary and secondary education; estimates of the expected benefits had health professionals not left their home country; or the opportunity cost of alternative investments of the money spent on their training (e.g. Kirigia et al., 2006a, 2006b; Muula & Panulo, 2007; Mills et al., 2011). Although these methods are legitimate – especially in order to understand the value (rather than the cost) of the investment in health professionals’ training – they are not well established in the literature, basically resulting in ad hoc calculations based on proxies and subjec-tive assumptions. Moreover, they have few practical applications except for possible use

7The cosTs of Training healTh professionals
in The republic of Moldova
as supporting evidence in international negotiations with destination countries. For this reason, they are not covered here.
2.2 Method A: average cost of training based on output volumes
The method that determines the cost of training based on the number of trainees is the simplest and most straightforward of the four described here. This method envisages the following steps.
1. Calculation of the aggregate costs of all the inputs utilized by a given training institution within a given time frame (a);
2. Calculation of the total number of people trained within a given time frame (b);3. Calculation of the average cost of a trainee (a/b).
For instance, if the overall annual costs of a faculty of continuing medical education amount to MDL 10 million and that faculty offers attendance at two-week postgraduate training courses to 8000 doctors, then the full cost per trainee is obviously MDL 10 mil-lion/8000 trainees = MDL 1250.
A variation of this approach suitable for training institutions delivering longer training programmes requires the calculation, according to the same method, of the average cost required to train a health professional for a year: if c is the overall number of students enrolled, then the full cost of a year of training is a/c.3 The full cost of a training pro-gramme can be calculated by multiplying the full cost of a year of training by the number of years (d) associated with the training of a given professional: in formal terms:
cost of training = a / c × d
For example, if the overall yearly costs of a medical university amount to MDL 30 million and that university records a total of 15 000 students enrolled in that year, then the aver-age cost of a single year of training averages MDL 2000 (30 million/15 000). If training for a given professional profile takes six years, then this method calculates the average train-ing cost of a graduate with that professional profile as MDL 2000 X 6 years = MDL 12 000.
3 A practical problem in this case is the fact that enrolments are measured over an academic year, whereas cost information is recorded on the basis of a fiscal year which, in the Republic of Moldova, corresponds to a calendar year. The difference can be overlooked unless costs or enrolments are subject to significant fluctuations.

8 The cosTs of Training healTh professionals in The republic of Moldova
As anticipated in section 2.1, strictly speaking, costs should refer to the amount of re-sources used, which does not correspond to financial outlays. In principle, therefore, the method described here requires the depreciation of assets (i.e. distribution of their cost over the years of their useful economic life). For instance, the full amount spent on a new piece of equipment or major repair work to an operating theatre in a university clinic should not be included in the amount a for the year in which the sum was paid out. Rather, it should be divided (in accounting terms – depreciated) across several/many years, taking account of the expected life of the piece of equipment or the repair work. Different analytical techniques within this category can be distinguished primar-ily because of different accounting technicalities used for the distribution of the cost of assets over time.
This method is well known because of its simplicity. One obvious limitation is the fact that, by using a single measure of output (e.g. number of trainees; number of years of training), it provides only a rough estimate of resource consumption. For example, the training of a surgeon or of a dental technician is clearly much more resource intensive than the training of a health-care manager or an epidemiologist. In brief, by relying on averages this method systematically underestimates the cost of expensive training pro-grammes and overestimates the cost of inexpensive programmes. This method is also more suitable for single-product organizations or for organizations offering comparable products. Consequently, it fits better in a training institution that delivers only a single type of degree than in a training institution offering programmes of different length us-ing different delivery formats. This method can be useful as a basis for reimbursement but entails the need for cross-subsidies since this would result in overpayments for in-expensive training programmes (which in turn might introduce a bias against expensive programmes in decision-making within training institutions). This method is unsuitable for cost comparisons (unless comparing training institutions offering exactly the same programmes) because it adds costs with very different drivers. In particular, it highlights higher costs across the board for all the training programmes provided by institutions offering resource-intensive specializations.
2.3 Method B: average cost of training based on activity analysis
Method A takes a top-down macro approach, ranging from the overall expenditures of a training institution to the cost of training an individual professional. Method B takes the

9The cosTs of Training healTh professionals
in The republic of Moldova
opposite approach, looking at the specific resources needed to train a given professional and adding them to calculate its cost. This method envisages the following steps.
1. Listing of all the activities needed from different specialist profiles in order to train a given trainee.
2. Listing of all the resources required to deliver each activity, in terms of quality and quantity (e.g. x hours of instructor’s time, divided by the average number of trainees; y pairs of single-use gloves; z units of a given consumable).
3. Identification of the unit cost associated with each resource (e.g. r as the hourly salary of an instructor, s as the cost of single-use gloves, t as the cost of a unit of that consumable).
4. Calculation of the cost of training the trainee by adding the results obtained by multiplying the quantity of material inputs required to deliver all the technical steps by their unit cost; in formal terms, cost of training = Σ (x × r + y × s + z × t + …).
Fig. 2.1. Framework for calculation of average cost of training based on activity analysis
In principle, this approach can be used to focus on individual trainees but, in practice, most training is provided to groups of trainees. Given that each trainee in a group gener-ally uses up the same services, it is simpler to cost all the activities (as described above) needed to train an entire group and then divide this overall cost by the size of that group in order to calculate the cost of training a single trainee. Exceptions can be made for the extra costs associated with entitlements, (e.g. scholarships, free access to a dormitory or other services) but strictly speaking these are not training costs.
For example, a two-week postgraduate training course on modern laboratory analyses requires 72 contact hours with instructors and the full-time involvement of two lab-oratory technicians, plus a given amount of reagents and other consumables. In the

10 The cosTs of Training healTh professionals in The republic of Moldova
bottom-up micro approach described here, this requires the total cost associated with the consumption of all inputs to be divided by the number of people taking that post-graduate training course.
Assume that: • the instructors are external experts paid on a hourly basis and receive MDL 100
per hour; • the laboratory technicians work full time (48 weeks) in that faculty of post-
graduate medical education and have an average cost of MDL 48 000 per year/ MDL 1000 per week;
• consumables for an average two-week postgraduate training course cost MDL 4000; and
• on average, 30 trainees attend the course.
Hence, the overall cost of that two-week postgraduate training course for each trainee, excluding accommodation and travel costs, is (100 × 72 + 1000 × 2 + 4000)/30 = MDL 440.
As highlighted by this example, this approach requires the cost of any input that is not used exclusively for the provision of a single unit of that service to be distributed on the basis of a parameter expressing consumption patterns (in accounting terms – allocation of indirect costs). For instance, the cost of a laboratory exam would include not only the cost of reagents but also a share of equipment costs, distributed first over the years of its useful economic life (i.e. depreciation) and then over the number of exams in a given year. In the example above, the approach used to quantify full-time staff costs relies on the same principle: the estimated weekly salary of MDL 1000 is based on the assumption that the staff delivers training services in each and every week of the year (the yearly cost can be divided by 48 weeks to account for holidays, but time is also used for coordi-nation and planning work, retraining, mentoring of junior staff, idle time, sick leave, etc.).
In the format described above, this method does not consider (and thus does not ac-count for) the inputs that are not directly related to the training process in a quantifiable manner. All indirect services are not included: these include not only cleaning and disin-fection, security, accounting or human resources management; but also heating, lighting and other utilities, or the cost of the building itself. Support services such as libraries or computer classes could also be very difficult to account for. In some cases a simpli-fied approach is used for the calculation of overheads: rather than trying to identify a parameter expressing resource consumption patterns, they are simply summed up as direct costs, either as a fixed amount (e.g. + MDL 300 for each trainee) or as a percentage

11The cosTs of Training healTh professionals
in The republic of Moldova
(e.g. + 25% of direct costs). A similar alternative accounts for direct costs on the basis of the approach presented above; then allocates overheads based on the rationale behind method A – dividing overheads by the number of training days per trainee (in training in-stitutions offering shorter courses) or by the number of trainees enrolled in a given year (in training institutions offering longer programmes), and multiplying the resulting figure to account for the days or years of training received (for applications of this approach see Valberg et al., 1994; Spollen, Dixon & Hindle, 2003; Bobroff, Gordon & Garanhani, 2009). Logically, these top-down approaches are at odds with the bottom-up logic behind the method described in this paragraph. However, they do allow estimation of the full cost (as in method C below) without the need to establish an expensive integrated cost ac-counting system.
Different analytical techniques included into this category can be distinguished because of two subsets of accounting technicalities.
1. What resources and, consequently, what costs (in particular, what indirect costs?) are actually included or excluded in the calculation? In accounting terms – what is the cost configuration? For instance, should waste removal or main-tenance of gardens surrounding a medical university be included in the cost of training?
2. What parameter (single base) or parameters (multiple base) are used for al-locating indirect costs to individual services? In accounting terms – what al-location bases are used? For instance, should heating costs be allocated on the basis of square metres, cubic metres or number of trainees?
These approaches are sometimes used for reimbursement purposes because they allow efficient resource consumption to be rewarded (unlike method A, which automatically translates wasteful usage of inputs into higher costs). When improved efficiency is the goal, many of the technicalities adopted for costing are not decided single-handedly by the training institution, but rather imposed by the financing body.
In logical terms, this method is simple and provides a fair account of resource usage, especially direct costs (i.e. variable costs + fixed costs used specifically for the provi-sion of that service, such as dedicated staff units). This method has the important ad-vantage that it can be used for comparisons (across training institutions, countries or time), on condition that the cost configuration includes a limited share of indirect costs and thus allows primarily a comparison of direct costs. More generally, indirect costs are problematic because the choice of allocation bases is often debatable, and different

12 The cosTs of Training healTh professionals in The republic of Moldova
allocation bases will lead to the calculation of different unit costs. This method also has the major practical limitation of being very time-consuming (especially for longer train-ing programmes) because it requires the collection of a large amount of analytical data. As such, it is appropriate when the cost of very specific training activities must be calcu-lated, but too expensive and burdensome when large numbers are involved, becoming even more so if costs must be calculated on an ongoing basis. Under these conditions, method C proves more cost effective.
2.4 Method C: average cost of training based on cost centres (step-down method)
The concept of full costing means that the configuration used to calculate the amount of resources needed to train a health professional includes not only direct costs (in accounting terms – direct costing) but also all indirect costs, allocated on the basis of parameters.
In theory, the full costing of health professionals’ training could be achieved through the ad hoc bottom-up approach described in section 2.3. In practice, such an approach is likely to be very time-consuming. Therefore, full costing systems are based on inte-grated accounting procedures which use a top-down approach to systematically allocate all costs to the accounting objects that must be costed (in this case, the training of a doctor or a nurse).
Integrated cost accounting systems envisage the identification of cost centres at differ-ent levels. A cost centre is an accounting object to which costs can be attributed univo-cally. In traditional cost accounting systems, cost centres tend to correspond to organi-zational units since, as a rule, staff members and equipment are attributed to a specific unit, and tracking systems are usually already in place to measure output levels and the usage of consumption materials (e.g. drugs) and intermediate services (e.g. X-rays). Cost centres can be distinguished between final cost centres (responsible for service delivery to external customers) and intermediate cost centres (responsible for service delivery to other cost centres – internal customers). The costs attributed to intermediate cost cen-tres can be allocated to final cost centres using parameters expressing how much of the output of the former is used by the latter: this is the so-called step-down method. For instance, the costs of the library or the human resources department can be distributed among the faculties of a medical university using the number of students or the number of staff members employed by each chair as parameters for allocation (for an application

13The cosTs of Training healTh professionals
in The republic of Moldova
of this approach, see Young 2003a). In more sophisticated enterprise resource planning (ERP) systems, cost centres can also be associated with accounting objects other than or-ganizational units, particularly to activities and processes (activity-based costing). In this way it is possible to cost (for instance) the admission process or a training programme.
A modern ERP system allows simultaneous costing of a multiplicity of different account-ing objects, and consequently can serve as a major source of cost information for deci-sion-making at different levels. This method envisages the following steps.
1. Identification of final cost centres (i.e. the accounting objects to be costed).2. Identification of intermediate cost centres (i.e. cost pools which are not rel-
evant in themselves but serve as a step for allocating costs to final cost centres).3. Identification of the relationships between intermediate and final cost centres,
and consequently of the parameters to be used to allocate the costs of the former to the latter.
4. Definition of the patterns needed to feed existing information about the cost of inputs (e.g. from the general accounting ledger) into the cost accounting system.
Similarly to method B, different analytical techniques included in this category can be distinguished because of three subsets of accounting technicalities.
1. What are the cost centres and how they are linked to one another (sometimes called the architecture of the cost accounting system)?
2. What is the cost configuration of the object to be costed (full costing could actu-ally include or exclude certain expenditures, e.g. exclude general administration or all overheads)?
3. What parameters are selected for allocating the costs of intermediate cost cen-tres to final cost centres (in accounting terms – what allocation bases will be used)?
The advantage of this method is that it tends to mirror more closely actual resource consumption, since there is much less reliance on averages. As an example, this meth-od is likely to aid understanding that health-care management classes cost less as they use few or no support staff, consumables and intermediate services but the training of surgeons is likely to cost much more due to greater use of trainers’ time, support staff, consumables and intermediate services. Thus, this method provides valuable infor-mation to decision-makers, suitable to enable them to understand cost drivers, control

14 The cosTs of Training healTh professionals in The republic of Moldova
expenditure trends and make broader and more proactive use of their resources. In short, this method serves as a managerial decision-support system.
This method has the negative quality of being relatively complex, at least in terms of information flows. It also requires a fully developed cost accounting system, which in turn requires dedicated staff and financial resources. Moreover, it is not appropriate for meaningful comparisons of training costs across different institutions since, by defini-tion, full costs include a share of overheads. Even assuming that the architecture of cost centres, cost configurations and allocation bases are the same across all training institu-tions (as some countries tried to decree in the past), the resulting figures are too aggre-gate to understand whether a difference in the full cost of training is due to productive efficiency, quality levels, input costs or different volumes of overheads.4
2.5 Method D: differential cost of training
This method is logically different from methods A to C, primarily retrospective approach-es which aim to identify summary measures of the resources used to train health pro-fessionals. Method D addresses a different question: what does it take to train a health professional? A peculiarity of this approach is that it can be used prospectively and ret-rospectively – both to account for what happened in the past and to estimate what could happen in the future. In other terms, it can be used not only for feedback, but also for feedforward (technically, other methods can also be applied in this way but because of the way that their input information is defined, the resulting figures do not hold the same informational value).
The main idea behind method D is to consider the difference before and after a particu-lar decision. In accounting terms, this implies a focus on differential costs only – that is, on those costs that have changed (retrospective view) or would change (prospective view) following a given decision such as the admission of an additional trainee, intro-duction of a new training programme or establishment of a medical simulations centre. For example, a decision to expand the role of a medical simulations centre might not affect the consumption of some inputs (e.g. instructors’ contact hours), but others will record higher or lower consumption levels, with corresponding impacts on costs. As a
4 To clarify this point, consider two medical colleges located in different buildings in different geographical areas. Differences in full costs would arise, for example, from different heating costs and from the age and features of the buildings in which each college operates. In turn, these influence repair and maintenance costs. Such variations will certainly produce differences in the full costs of training a health professional borne by the two medical colleges, but a comparison between these two figures is unlikely to serve as a suitable basis on which to assess performance.

15The cosTs of Training healTh professionals
in The republic of Moldova
consequence, this method envisages steps similar to those described for method B, but used in such a way to emphasize the differential impact of a given decision.
1. Listing of all the activities needed from different professional profiles in order to deliver a given service, separately before and after a given decision (e.g. de-veloping certain skills in a university clinic rather than a medical simulations centre).
2. Listing of all the resources required to deliver each activity, in terms of quality and quantity, separately before and after a given decision.
3. Identification of the differences in terms of material inputs between the status before and after a certain decision (e.g. a higher intake of students requires payment for a contracted instructor to oversee group activities, and uses more consumables).
4. Identification of the unit cost associated with each resource which is different in quantity or quality before and after a certain decision (e.g. j as the cost of the equipment, k as the cost of one dose of the expensive drug, l as the cost of one dose of the cheaper drug, and m as the cost of one minute of doctor’s time, calculated as in the example in section 2.2).
5. Calculation of the impact associated with the decision (e.g. differential cost ob-tained by comparing the cost of delivering that programme before and after the Ministry of Health’s decision to enrol a higher number of state-sponsored students).
Fig. 2.2. Framework for calculation of differential cost of training

16 The cosTs of Training healTh professionals in The republic of Moldova
As an example, consider the requirement to decide whether a series of retraining cours-es should be offered as online programmes. It is assumed that the programmes and the final evaluation patterns can be designed to rule out cheating by course participants, and that the subject is compatible with online education (e.g. health economics or epidemi-ology). On one hand, offering these programmes online would reduce the need to heat, clean and maintain a number of classrooms, and could even allow rented property to be given up or premises owned by the training institution to be sold or rented out. On the other hand, it might be necessary to hire specialists to support instructors in adapting their materials for online education; purchase licences for online education software; or equip instructors with webcams, headsets or upgraded computers to ensure effective interactions with course participants. In a broader perspective, employer organizations might need to equip a computer room for online education but could save significant costs on travel, accommodation and daily subsistence allowances. Once the alternatives have been clearly described and a standpoint selected (e.g. of a training institution), it is possible to calculate whether switching to online education would require extra costs or would actually entail savings (for an application of this approach see Mennin & Martinez-Burrola, 1986).
It should be clear from the example that this method provides important information for funding decisions. Although the resulting figures may not be fully suitable for a re-imbursement system, they do allow an estimation of the financial implications of a de-cision. For instance, evidence may suggest that watching an educational video can be a good substitute for witnessing a real-life surgical operation; that training of general practitioners should be extended by six months; or that certain specializations should be available in selected colleges rather than across the country. This method allows not only an ex post assessment of the extent of the increase or decrease in costs associated with these decisions, but also an ex ante estimation of their costs or savings.
It goes without saying that this costing method is suitable for accounting for the financial implications of following a given decision, but in itself is not sufficient to take a decision. More correctly, it is only suitable upon a restrictive condition: that is, if it is assumed that different training approaches ensure identical outcomes in terms of learning effective-ness. Whenever this condition is not met, both differential costs and differential learning outcomes should be taken into account; in other words, a full cost-effectiveness analysis should be performed.
17The cosTs of Training healTh professionals
in The republic of Moldova
2.6 Costing joint outputs: training, care and research
When discussing the cost of training health professionals in the Republic of Moldova it is necessary to note that the debate at global level focuses on identifying training costs in educational programmes that simultaneously produce health services and clinical research. The challenge of distinguishing between the resources used for training and those used for research purposes is not exclusive to medical universities. In the health sector, these two are also closely intertwined with health services provision.
Joint production (i.e. instances when some resources are used for two or more outputs) leads to confusion and even conflict since training, care and research are usually funded from different sources and according to different mechanisms. For instance, when an instructor discusses a given patient’s health conditions with a resident during a visit, should this be classified as training or patient care? Both outputs are being produced simultaneously therefore such activity is neither exclusively training nor exclusively pa-tient care, so the resources used and the corresponding costs cannot be allocated con-vincingly to either the former or the latter (Gavett & Mushlin, 1986).
This problem was originally acknowledged in an ambitious study of medical school costs carried out in 1958 in the United States of America by the Association of American Medical Colleges (Carroll, 1958 cited in Gavett & Mushlin, 1986). Since that study, a number of papers have struggled with the issue of cost allocation in a situation of joint production; only very few studies acknowledge the intrinsically arbitrary nature of this approach. A rare exception, remarkable in its lucidity, was published in the Journal of Medical Education:
Where several activities are carried on jointly – as teaching, patient service, and research are mingled in medical schools – a nonarbitrary allocation of costs is impossible and classical cost accounting cannot find the “true” cost of one output […] This may be frustrating, but it is inescapable nonetheless. There is no use looking for a clever cost accountant with a new technique nor a sophis-ticated economist with a new idea. The problem with finding a meaningful way to assign all of the cost of production (activity) to individual products in circum-stances of joint production is not one of conceptual difficulty but of conceptual impossibility (Koehler & Slighton, 1973 cited in Gavett & Mushlin, 1986).

18 The cosTs of Training healTh professionals in The republic of Moldova
The calculation of training, care and research costs is a simpler venture if each output consumes its own exclusive set of resources. The arrangements in place in the health sector of the Republic of Moldova allow the assumption that this is the case: the re-sources used by the Medical University and the medical colleges are used for training purposes only. This is because the collaboration agreement under which hospitals serve as clinical bases regulates the contribution of academic staff members to health services provision. Also, research is limited in scope and largely funded by ad hoc grants, since most research activities are entrusted to the Moldovan Academy of Sciences and not to universities. This is not the case in most other countries, so for comparison purposes it should be borne in mind that cost estimates for health professionals’ training cited by most of the international literature are based on arbitrary apportionments of resource consumption among training, care and research.

19The cosTs of Training healTh professionals
in The republic of Moldova
3. Health professionals’ training in the Republic of Moldova3.1 Organization of health professionals’ training5
3.1.1 Training of medical doctors
In the Republic of Moldova, health professionals with higher education (i.e. doctors, pharmacists, dentists) are trained in one single medical university. Originally estab-lished as the State Institute of Medicine in 1945, The State University of Medicine and Pharmacy “Nicolae Testemiţanu” is located in the capital city, Chisinau.
Higher and postgraduate education in medicine and pharmacy are carried out in line with Article 28 of the Law on Education No. 547-XIII, dated 21 July 1995. The State University of Medicine and Pharmacy “Nicolae Testemiţanu” offers training in four facul-ties: Medicine, Pharmacy, Dentistry and Public Health. Specialized higher education lasts five or six years and accounts for a total number of 60 transferable credits for each year of education. By the end of this training, all students who pass the graduation exams re-ceive a doctor’s or pharmacist’s diploma, entitling them to participate in the competition for admission to postgraduate residency training or to master’s degree research studies.
The competitive admission process at the State University of Medicine and Pharmacy “Nicolae Testemiţanu” aims to select candidates based on the knowledge and skills re-quired in the faculty to which they apply. Competitions are organized by faculties within the approved admission quotas, depending on the candidates’ pre-university institu-
5 Health professionals with higher and specialized secondary education are trained based on the Law on Health Protection No. 411-XII, dated 28 March 1995; Law on Education No. 547-XIII, dated 21 July 1995; Law on Medical Profession No. 264-XVI, dated 27 October 2005; Government Decision No. 1006 approving the Development programme for medical and pharmaceutical education in the Republic of Moldova for 2011–2020, dated 27 October 2010; Regulation on Residency Postgraduate Studies; Classifier of specializations re-lated to the training of personnel in higher education institutions in Area 7 “Health” (Law No. 142 dated 7 July 2005 on approving the nomenclature of areas for professional training and specialties for training in higher education institutions, cycle I, Annex 2) and other normative acts in force. For an overview on the health sys-tem of the Republic of Moldova see Turcanu et al. (2012).

20 The cosTs of Training healTh professionals in The republic of Moldova
tion, language chosen for training, place of residence and social status. For instance, the following quotas were established in 2012.
Candidates’ pre-university institution: 80% of the places envisaged in the admission plan for budgetary funding are reserved for holders of high school diplomas; 20% for holders of specialized secondary education diplomas. The latter is further divided on the basis of applicants’ professional qualifications.
1. Language chosen for training: 80% of the places are reserved for training in Romanian; 20% for training in Russian.
2. Place of residence: the quotas for applicants from urban or rural settlements are defined by the Ministry of Health.
3. Social status: 15% of the places in each faculty are reserved for priority groups. These include orphans; children with first and second degree of disability; chil-dren with physical impairments, children whose parents have disabilities or took part in military actions to defend the integrity and independency of the Republic of Moldova or international military operations; children from families with many children; graduates of schools in Transnistria; Roma children; and young people who have completed military service.
4. The same criteria are used for both contract-based (involving the payment of tuition fees) and budgetary-funded admissions. The number of contract-based students is also capped; this option is available only for the faculties of medi-cine, pharmacy and dentistry, since the Faculty of Public Health trains only stu-dents with budgetary funding.
For the academic year 2012–2013, a total of 750 candidates from the Republic of Moldova were admitted to undergraduate medical education. The breakdown by facul-ties is shown in Table 3.1.
Table 3.1. Admissions to undergraduate medical education, by faculty, academic year 2012–2013
Faculty Budgetary funding Contract-based fundingMedicine 385 100Pharmacy 30 75Dentistry 35 75Public Health 50 0
Total 500 250

21The cosTs of Training healTh professionals
in The republic of Moldova
Source: State University of Medicine and Pharmacy “Nicolae Testemitanu”, unpublished report, 2014.
Obviously, foreign students are only enrolled on a contractual basis, provided that they pass exams in chemistry, biology and English. A total of 341 foreign candidates were admitted for the academic year 2012–2013. There is no formal ceiling to the number of foreign contract-based students, this is set by the University on the basis of capacity (of instructors, teaching auditoriums, equipment).
Postgraduate medical education is carried out via residency training for doctors and pharmacists. This was introduced in the Republic of Moldova based on Government Decision No. 502 “On the improvement and restructuring of postgraduate medical edu-cation”, dated 15 July 1994. Initially, residency training lasted two or three years but in 2001 this was increased to four years for surgical profile specializations, and to five years for the neurosurgery profile. Residency training lasts three years for the therapeutic pro-file, including the training of family physicians; and two years for pharmacy and thera-peutic dentistry. During the last year of study, the training includes at least six months of compulsory activity within a district-level health services provider. Residency graduates are issued with a licence diploma entitling the holder to practice independently, but also to continue his or her education via fellowship training6 or a doctorate.
Currently 118 specializations are offered for postgraduate training of doctors and phar-macists in the Republic of Moldova, including:
• 31 specializations for residency training, including 28 specializations for gradu-ates of the Medicine Faculty and one specialization for graduates of each of the other faculties;
• 87 narrow specializations for fellowship training, including 68 clinical and para-clinical specializations for doctors’ training, 10 specializations for training in preventive medicine, 5 specializations for training in pharmacy and 4 specializa-tions for training in dentistry.
The breakdown by specialty, according to the admission plan for residency-based post-graduate medical education for academic year 2012–2013 is shown in Table 3.2.
6 The secundariat clinic [clinical fellowship] is a two-year post-university qualification providing specializa-tion in a narrow field of medicine. Fellows gain a level of theoretical knowledge and practical skills beyond those acquired in university education and residency. Those completing a residency programme in internal medicine may specialize in endocrinology or hepatology, for example. The course is financed only from budget sources, is conducted only in Romanian and is run as a daily programme. The Ministry of Health sets the num-ber of places in accordance with system requirements.

22 The cosTs of Training healTh professionals in The republic of Moldova
Table 3.2. Admissions to residency-based postgraduate medical education, by special-ty, academic year 2012–2013
Specialty No. of placesanaesthesiology and reanimation 42infectious diseases 8cardiology 8surgery, including paediatric 42epidemiology 28pharmacy 104clinical pharmacology 8phthisiopneumology 16hygiene 16imaging 16rehabilitation and physical medicine 7internal medicine 16family medicine 69emergency medicine 16laboratory medicine 8microbiology 8morphopathology 16neurosurgery 7neurology, including paediatric 16obstetrics and gynaecology 28ophthalmology 7orthodontia 9orthopaedics & traumatology, incl. paediatric 14otorhinolaryngology 7paediatrics 24prosthetic dentistry 8psychiatry 16stomatology 138surgical stomatology 7urology 7
Source: State University of Medicine and Pharmacy “Nicolae Testemitanu”, unpublished report, 2014.

23The cosTs of Training healTh professionals
in The republic of Moldova
As an alternative to residency-based postgraduate medical education, graduates in medicine or pharmacy may be admitted to a two-year master’s degree programme in research. Usually these graduates receive training as future lecturers in fundamental disciplines such as anatomy, pathological anatomy, histology.
Admission to residency and fellowship training is based on budgetary funding but for-eign students can be admitted on a contractual basis. This general principle does not apply to master’s degree training, which is primarily attended by trainees studying on a contractual basis.
The State University of Medicine and Pharmacy “Nicolae Testemiţanu” was accredited at national level in 2001 and 2007, and evaluated by international organizations in 2001 and 2005. Currently, 6200 young people from the Republic of Moldova and 26 other countries worldwide are studying in 75 departments, 10 University courses and 21 scien-tific laboratories located in recently refurbished clinics and outpatient centres. Training is provided in Romanian, Russian, English and French; and based on modern programmes. The majority of these are aligned with European standards, implementing integrated-based training and using approaches such as interactive formats, problem-based learn-ing, clinical cases and cases at patients’ bedsides, evidence-based medicine, virtual pro-grammes, standardized patients, distance training, in-service training and telemedicine. The University boasts a highly qualified teaching staff, including 14 academicians and associates of the Moldovan Academy of Sciences, 145 doctors habilitatus7 and 522 PhDs in medicine, most of whom are University professors or lecturers.
Very modern training centres have been established to improve the theoretical and prac-tical training of family doctors, pharmacists and dentists. These include the Centre for Training and Testing Practical Skills; University Clinic of Primary Health Care; University Pharmaceutical Centre and two University dental clinics. In August 2013, a sophisticated multipurpose medical simulations centre was opened and launched into operation.
Government Decision No. 42, dated 12 January 2006 approved the activity of the clin-ics under the State University of Medicine and Pharmacy “Nicolae Testemiţanu”. These act as the clinical bases for the University departments located within medical-sanitary
7 In many countries (e.g. Austria, Bulgaria, Czech Republic, Denmark, Finland, France, Germany, Hungary, Italy, Poland, Portugal, Slovakia, Sweden, Switzerland and all post-soviet countries) the title of doctor habili-tatus is conferred on PhD graduates for the successful defence of a second dissertation based on more ad-vanced research work than their first dissertation, usually following a postdoctoral programme. As a rule, a PhD is required to hold an assistant professor post, but a doctor habilitatus is required to be awarded a full professorship.

24 The cosTs of Training healTh professionals in The republic of Moldova
institutions. University clinics provide undergraduate, postgraduate and continuing ed-ucation for doctors and pharmacists, while delivering health services to patients and the overall population. Currently, these are located within 22 national-level health ser-vices providers, 17 city-level health services providers and 2 health services providers overseen by ministries other than the Ministry of Health. The clinics are endowed with the equipment and premises needed to ensure an effective learning experience for un-dergraduate students, residents, postgraduate students and participants attending the Faculty of Continuing Medical and Pharmaceutical Education, as well as the employees of scientific chairs and laboratories.
Functioning of the clinics is regulated by collaboration agreements signed between the University and the health services providers hosting the clinics. The former pays the salaries of University staff members performing curative activities, as well as all utility and maintenance costs. The consumables required to deliver health services to patients are paid by the providers hosting the clinics. In their capacity as health-service providers, the latter are reimbursed by the National Health Insurance Company for all the cases they treat.
According to Annex 2 of the “Regulation on compensation of public health services pro-viders’ employees belonging to the compulsory health insurance system” (Government Decision No. 1593, dated 29 December 2003), University staff members receive a sup-plement for medical assistance provided to patients of the facility hosting the clinic. The supplement depends on the tasks fulfilled: department heads, university professors and lecturers get up to a 50% increase in their salary; University assistants and scientific re-searchers get 75% of a doctor’s basic salary, and also gain valuable practical experience as medical workers. Budgetary allocations and other financial resources allowed by law (including funds from international projects and grants) are used for maintaining equip-ment in the clinics and to purchase additional medical equipment needed for modern educational, therapeutic and scientific activities.
The answers to research questions 1, 2 and 3 concerning medical education (i.e. average numbers of admissions, of graduates and of students enrolled at the State University of Medicine and Pharmacy “Nicolae Testemiţanu”, for all levels of instruction, 2003–2012) are featured in annexes 1, 2 and 3 to this report.8 For each level of instruction, the an-nexes highlight separately the number of trainees funded by budgetary allocations as well as the number of Moldovan and foreign trainees admitted on a contractual basis.
8 Detailed breakdown by specialization of the medical doctors completing postgraduate medical education from 2003 to 2009 is available in Galbur, 2010.

25The cosTs of Training healTh professionals
in The republic of Moldova
3.1.2 Training of nurses and other health professionals with specialized secondary education
Training of health professionals with specialized secondary education is carried out in five institutions: the National College of Medicine and Pharmacy in Chisinau and medical colleges in Balti, Orhei, Ungheni and Cahul, respectively. The Nursing School employs 490 staff members, including 14 instructors with superior training qualifications, 60 with first training qualifications and 130 with second training qualifications.
Admission to medical colleges takes place on a competitive basis, and is open to gradu-ates of general secondary schools (gymnasium level, nine years of study), of lyceums (12 years of study) and of vocational secondary institutions (nine years of study plus two to three years of vocational training). Candidates can choose from the seven professional qualifications listed below; teaching takes place in Romanian and Russian. Training takes five years for gymnasium graduates and three years for lyceum students. The profes-sional qualification of caregiver (infirmiera) is the exception, requiring only one year of training. Admissions can be funded by budgetary allocations or be contract-based, in-volving the payment of tuition fees: the number of both budget-funded and contract-based admissions is established every year by a Governmental decision. The following professional qualifications are available as budget-funded or contract-based training:
• nurse (three or five years of training, depending on previous general education); • pharmacist-laboratory technician (three years); • dental technician (three years).
The following qualifications are available only via budget-funded training: • midwife (three years); • hygienist-epidemiologist assistant (three years); • laboratory technician (three years); • caregiver (infirmieră) (one year).
The functioning of clinics in which medical college students practice is regulated by a Ministry of Health order identifying the health services providers responsible for practi-cal training of students and by the collaboration agreements signed between the medi-cal colleges and the health services providers hosting the clinics.
The answers to research questions 1, 2 and 3 concerning nurses and other health profes-sionals with specialized secondary education (i.e. number of admissions, of graduates

26 The cosTs of Training healTh professionals in The republic of Moldova
and of students enrolled in medical colleges, 2003–2012) are featured in Annex 4. This highlights separately the number of trainees funded by budgetary allocations and the number of Moldovan trainees admitted on a contractual basis.
3.1.3 Continuing medical education (CME)
Regardless of their institution’s status or form of ownership, all health professionals working in the Republic of Moldova must undergo compulsory attestation every five years of activity, in order to assess their level of professional qualification. Attestation is carried out by dedicated commissions established by the Ministry of Health and is meant to ascertain that health professionals have attended continuous education and are per-forming well. Following attestation, health professionals are awarded a higher qualifica-tion category (ranging from no category to second, first and superior) depending on their level of professional training and accumulated experience.
For the purposes of attestation, over five years doctors are expected to accumulate 325 credits of continuing medical education (CME) (250 for training programmes in educa-tional institutions + 75 for publications, participation in scientific events, etc.); pharma-cists are expected to accumulate 200 credits (175+25); and nurses and other health pro-fessionals with secondary specialized education are expected to accumulate 175 credits (150 for training programmes in educational institutions + 25 for publications, partici-pation in scientific events, etc.). Credits are granted according to the actual number of hours spent in CME.
The Faculty of Continuing Medical and Pharmaceutical Education of the State University of Medicine and Pharmacy “Nicolae Testemiţanu” was established on 2 April 1962 with the aim of ensuring the ongoing training of doctors and pharmacists. This plays an im-portant role in CME: 63 000 doctors have improved their qualifications in this faculty in which around 200 highly qualified instructors (including professors, associate profes-sors, lecturers) offer over 400 refresher courses. Courses range in length from two weeks to one month, and are constantly updated on the basis of the latest achievements of modern medicine. Doctors attending the Faculty are trained within the university clinics located in national- and city-level health services providers.
CME for health professionals with secondary specialized education is ensured by the CME centres for medical and pharmaceutical professionals with secondary education in Chisinau and Balti. These health professionals can choose from the following refresher courses:
1. curative assistance (family doctor’s nurse, nurse, feldsher, emergency feldsher);
27The cosTs of Training healTh professionals
in The republic of Moldova
2. diagnostics assistance (functional diagnostics nurse, laboratory technician, ra-diologist technician);
3. rehabilitation assistance (physiotherapy, kinesiotherapy, massage, balneotherapy);
4. obstetrical assistance (midwifery);5. preventive medicine assistance (hygienist-epidemiologist nurse, feldsher-bac-
teriologist, bacterial-laboratory technician);6. dental assistance (dental technician, dentist, nurse);7. pharmaceutical assistance (pharmacist-laboratory technician);8. statistician (medical statistician with secondary education, methodology spe-
cialist, medical registrar).
Training institutions offering refresher courses are no longer funded by direct budgetary allocations. Since 2011, such courses have been provided on a contractual basis that requires employers of attendees to pay tuition fees. Public health services providers must invest in training no less than 2% of their budgetary allocations from the National Health Insurance Company. Tuition fees are set and approved pursuant to Annex 4 to Government Decision No. 928, dated 13 August 2007, with subsequent additions and amendments (Government Decision No. 710, dated 6 August 2010).
The answers to research questions 1, 2 and 3 concerning CME are also featured in the annexes –the number of admissions and graduates of programmes of the Faculty of Continuing Medical and Pharmaceutical Education of the State University of Medicine and Pharmacy “Nicolae Testemiţanu” 2003–2012 are featured in Annex 1 and 2, respec-tively; corresponding data for the CME centres for health professionals with second-ary education are featured in Annex 4. The annexes highlight separately the number of trainees funded by budgetary allocations (up until 2010) and the number of trainees admitted on a contractual basis.
3.2 Financing of health professionals’ training
3.2.1 Budgeting
In the Republic of Moldova, education is financed in line with the budgetary policy set out in Law No. 847-XIII on the budget system and the budget process, dated 24 May 1996; annual state budget laws; spending limits set in the Action Plan for the de-velopment of the mid-term budgetary framework and the draft budget approved via

28 The cosTs of Training healTh professionals in The republic of Moldova
Government Decision No. 82, dated 24 January 2006; and budgetary circulars issued by the Ministry of Finance.
Limited financial resources on one hand, and shortages of health professionals on the other, compel the institutions dealing with health professionals’ training to identify and implement modern training formats and cost-effective technologies. To improve the existing situation, Government Decision No. 1006, dated 27 October 2010 approved the Programme for the development of medical and pharmaceutical education in the Republic of Moldova for 2011–2020.
Budgetary allocations represent the main funding source for the institutions in the state medical education system, although they may also benefit from other financing streams, such as:
• revenues from training, requalification and retraining of health professionals on a contractual basis;
• revenues from providing other services and executing works on a contractual basis;
• revenues from fees paid for educational institutions’ dormitories; • revenues from renting out assets, with Ministry of Health approval; • revenues from scientific research work carried out on a contractual basis; • donations and revenues from international cooperation, individuals and legal
entities.
The Ministry of Finance plays a pivotal role in distributing financial resources. When esti-mating spending limits, the Ministry applies a number of correcting factors determining the allocation of resources towards both increasing and decreasing expenditure (e.g. one-off spending, expenditures related to the duration of some programmes). For all the branches, increased expenditures for personnel in the budgetary sector and indexation of expenditures for goods and services have been the main factors over recent years.
Development of the state budget proposal for medical education starts with the drafting of the mid-term budgetary framework. This document defines a coherent framework for policies and public resources, serving as the starting point for the draft state budget for the following year. Expenditures are planned in a mid-term perspective of three years (i.e. the next year and following two years). Development of the mid-term budgetary framework starts with the strategic planning of public spending, including the spend-ing priorities in medical education, and includes the links between policy priorities in

29The cosTs of Training healTh professionals
in The republic of Moldova
medical education and resource allocation, as well as efficient use of the limited public resources.
Development of the mid-term budgetary framework is coordinated by sector-specific working groups. The Ministry of Health is part of the working group for education, which is overseen by the Ministry of Education, but the Ministry of Finance establishes the financial policy and the resources earmarked for medical education. The Ministry of Health has two main tasks: (i) to identify, develop and justify the policy priorities for medical education; and (ii) to identify the spending needs that serve as the basis for planning and developing budget proposals for all categories of medical education.
Sector spending strategies, including those for medical education, are developed in line with the spending limits that are presented for endorsement and approval by the Ministry of Finance. After an in-depth analysis of the policies and expenditures ear-marked for medical education, the Ministry of Finance sets the final spending limits and submits them for government approval.
Following approval of the mid-term budgetary framework, the Ministry of Finance de-velops and issues budgetary instructions quantifying the financial allocations earmarked for medical education for each of the following categories:
• higher education • postgraduate education • courses and educational institutions providing continuing education of health
professionals • specialized secondary medical education.
The definition of financial allocations earmarked for medical education allows the Ministry of Health to develop the mid-term budget within a realistic perspective. On the basis of instructions from the Ministry of Finance, the Ministry of Health starts develop-ing the state budget draft for medical education. This includes the budget proposals from all the medical education institutions, identifying the thresholds of spending needs. The approach used to calculate the financial resources’ thresholds for the medical education institutions is based on historical data (i.e. derives from previous year’s expenditures ).
The budget proposals for all the medical education institutions detail all the expenditures under their management (by items and paragraphs) from all types of spending sources, based on the priorities of every institution. These include the following expenditures:

30 The cosTs of Training healTh professionals in The republic of Moldova
• compensation for instructors and administrative and support personnel, in-cluding salaries, salary top-ups, complementary remuneration, financial aid and monetary awards,9 set according to the norms provided in Law No. 355-XVI on Salary system in the budgetary sector, dated 23 December 2005 and Government Decision No. 381 on Conditions of employment of staff of budget-ary units, dated 13 April 2006;
• compulsory state social insurance contributions; • compulsory health insurance premiums; • recurring expenditures, including payments for:
- utility services (electricity, heating, gas, water and sewerage, waste disposal);
- procurement and maintenance of low-value and disposable objects and materials, stationery, learning materials and manuals, periodicals and books, equipment, devices and inventory;
- publication of learning materials; - mail and telecommunication, transportation, current repair work of
buildings and premises, rental of goods and services, security; - information technology works; - professional training of personnel; - employees’ missions.
• student scholarships, set pursuant to Government Decision No. 1009 dated 1 September 2006 on the amount of scholarships and other forms of social as-sistance for students attending higher education institutions as well as special-ized and professional secondary education institutions, and people studying at postgraduate level;
• CAPEX, including: - procurement of fixed assets; - capital repair work of university buildings, libraries, dormitories, sport
halls and other sociocultural facilities.
Capital investments allocated by the Ministry of Finance through the Ministry of Health are also included in this section. These are established through special procedures and not allocated permanently to any specific sector.
9 Financial aid is a supplement to the salary based on the worker’s special request (e.g. related to some personal issues/sickness/death of relatives); monetary awards are supplements to the salary based on results achieved, high-quality work, age celebration (50 and 60 years) or other contingencies.

31The cosTs of Training healTh professionals
in The republic of Moldova
The budget proposals developed by each medical education institution distinguish be-tween two sources of funding: (i) allocations from the state budget; and (ii) funds from the so-called special means account (i.e. extra-budgetary revenues). Special financial means include three categories of revenues: (i) fee-based services; (ii) rental of assets; and (iii) grants, sponsorships and donations. These budget proposals are submitted to the Ministry of Heath for revision and approval within the limits set by the Ministry of Finance. Medical education institutions may also submit evidence-based proposals for additional expenditures not included in these limits.
Having analysed the budget proposals from each medical education institution, the Ministry of Health calculates aggregated expenditure for each category of medical edu-cation according to the annexes requested by the Ministry of Finance. Budget proposals for the next year, forecasted estimates for the two subsequent years (setting the limits of expenditures for every category of medical education), and detailed information memos are submitted to the Ministry of Finance for revision and approval. At the same time, the Ministry of Health notifies the Ministry of Finance of needs for which there is no financial provision, but are strictly necessary for the educational institutions under its subordination.
The Ministry of Finance systematizes and reviews these budget proposals and updates the general framework of resources and expenditure limits for the Ministry of Health for the macro-category – education. The two ministries then start negotiations on all the budget proposals submitted, discussing all expenditure items (including those not included in the original limits) and possibly resulting in the allocation of additional fi-nancial resources for medical education in the Ministry of Health’s draft budget. The Ministry of Finance aggregates all the budget proposals at the level of authority and economic branch (e.g. medicine or agriculture). The resulting draft state budget is sub-mitted for approval to the Government of the Republic of Moldova before being put before Parliament.
3.2.2 Financial management
Based on the budgetary allocations received in accordance with the State Budget Law, the Ministry of Health distributes the expenditure limits for the development of the bud-get for each educational institution based on expenditures per student. The expenditure limits for the State University of Medicine and Pharmacy “Nicolae Testemiţanu” and the institutions dealing with CME are already set in the State Budget Law.

32 The cosTs of Training healTh professionals in The republic of Moldova
Each education institution develops an annual expenditure plan to be funded from ei-ther budgetary allocations or extra-budgetary revenues, with specific expenditure limits for every month of the year. These are submitted for Ministry of Health approval and development of general financing plans which, in turn, are submitted to the Ministry of Finance for coordination.
Medical colleges deposit all financial resources (including both budgetary allocations and extra-budgetary revenues) in the State Treasury accounts for disbursement accord-ing to annual expenditure plans. For 2012, budgetary allocations accounted for 80.5% of total financing resources, and extra-budgetary revenues accounted for 19.5%. For 2013, budgetary allocations accounted for 78.8% of total financing resources, and extra-bud-getary revenues for 21.2%.
Any deviation from the expenditure plan during the year should be discussed and ap-proved by the Ministry of Health and the Ministry of Finance: the Treasury issues the requested resources only on the basis of Ministry of Finance approval. This pattern of financial management is rather cumbersome because it is difficult to forecast and envis-age all the dynamics that might occur during the year when managing a large institution with many different activities. Additional difficulties arise from capitalization of the bal-ance in the special means account, since tuition fees are collected at the beginning of the academic year but cannot be spent if they exceed the limits set in the State Budget Law. This means that financial resources cannot be used to address specific needs, mak-ing effective management impossible.
The State University of Medicine and Pharmacy “Nicolae Testemiţanu” has different fi-nancial management patterns, following the reforms recently introduced in the Republic of Moldova. As of 1 January 2013 all state higher education institutions became autono-mous entities acting on the basis of the conditions stipulated in the new version of Art. 49 of the Law on Education, as amended by Law No. 178, dated 11 July 2012, and in line with the “Regulation on the operation of state higher education institutions in financial autonomy conditions”, approved via Government Decision No. 983, dated 22 December 2012.
The University has a certain degree of autonomy. It is entitled to elect its own governing bodies, determine its organizational structure and, within human resources, may select not only its scientific-educational and research staff but also administrative personnel. The University also has the academic autonomy to approve its own plans for educational activities and scientific research. Regarding financial autonomy, the University obtained

33The cosTs of Training healTh professionals
in The republic of Moldova
a higher level of freedom to manage the resources originating from budgetary alloca-tions, as well as those deriving from extra-budgetary revenues. Hence, from the financial management standpoint, the University is able to:
• perform activities in conditions of self-management, based on non-profit prin-ciples, in keeping with the provisions set forth by the Government;
• administer financial resources, including budgetary allocations, through bank accounts rather than State Treasury accounts;
• use available resources for carrying out statutory activities according to its own decisions;
• coordinate with the relevant ministry to set tuition fees charged for contract-based enrolment and prices for service provision and performed work, so as to ensure the fulfilment of statutory goals and objectives;
• accumulate its own revenues from tuition fees, service provision, performed work and other specific activities, according to the Nomenclature of provided services approved by the Government;
• manage real estate, fixed assets and the entire invested capital, and ensure opti-mal conditions for the development of the proprietary assets of the institution;
• use the resources and the related rights to fulfil the statutory goals of the state higher education institution.
Financial autonomy must be exercised in keeping with the law and general principles of public accountability. It is based on the following possible sources of revenue:
• resources allocated for educational services provided by the University, based on the contract signed with the funder for the training of specialized personnel according to the Plan (State Order), and for social assistance to students who are orphans or under guardianship or tutorship;
• resources obtained from tuition fees charged to students, residents, clinical fel-lows, graduate students, and CME programme participants;
• resources from the state budget for research and development activities ob-tained on a competitive basis (both organized by the Academy of Sciences and based on international projects), and from the provision of research and devel-opment services performed on a contractual basis;
• rent and lease contracts; • donations and sponsorships; • interest from bank deposits of available financial resources.
Budgetary allocations are managed by the Ministry of Health through separate State Treasury accounts for undergraduate education, postgraduate education, residency

34 The cosTs of Training healTh professionals in The republic of Moldova
education, fellowship training and master’s degree education. Additionally, the Ministry allocates financial resources for scholarships and other forms of social assistance, and for maintenance of students’ dormitories, according to the standard set forth in norma-tive acts. Financial resources granted from the state budget for the educational services provided by the University are allocated for the financial year. In line with the contract signed between the Ministry of Health and the University, the Ministry transfers the relevant resources to the University’s bank account on a monthly basis for management at the discretion of the University.
In the State Budget Law for 2013, allocations for educational services provided by the University to fulfil the Plan (State Order) for the training of specialized personnel were based on the budgetary allocations for 2012, in line with the policies approved in the mid-term budgetary framework.
So far, budgetary allocations have been calculated based on the need to remunerate hu-man resources and pay for utility services, scholarships and other expenditures. As the state budget cannot cover all the costs, the number of budget-funded students is set in the Plan (State Order) for the training of specialized personnel. A transition period of two years (2013 and 2014) was established. During this time the formula for the allocation of funding per student shall be used to calculate theoretical funding levels, but actual funding will be calculated according to the standards in force.
As a consequence of these reforms, budgetary allocations in 2012 accounted for 60.8% of the total financing resources of the State University of Medicine and Pharmacy “Nicolae Testemiţanu”, with special means accounting for 38.1%. In 2013 the budgetary share accounted for only 50%, due to the removal of any ceiling on income from extra-budgetary revenues.
Starting from 2013, the University is required to develop an annual estimate of reve-nues and expenditures, with the obligation to ensure that these balance. In line with Government Decision No. 983 on adjustment of state budget expenditures to the Plan (State Order) for the training of specialized personnel, dated 22 December 2012, during the transition period the average number of students, residents, fellow clinical doctors, postgraduate students and the average total cost per student shall be used for the de-velopment of the yearly budget. Based on the provisions of this Decision, the average total cost per student should be calculated based on the average number of undergradu-ate students, residents, fellows and postgraduate students, both full- and part-time (the latter accounted for as 0.4 of a full-time equivalent), from the annual reports on the

35The cosTs of Training healTh professionals
in The republic of Moldova
number of students for the two years preceding the year for which the draft budget is developed. The cost per student calculated by the Ministry of Health when distributing resources should include the following inputs:
• payroll expenditures, including compensation, compulsory state social insur-ance contributions and compulsory health insurance premiums;
• procurement of goods, services and works necessary to ensure the develop-ment of the educational and scientific research process;
• procurement of fixed assets for educational and scientific research purposes.
It should be noted that an official methodology for the calculation of the training cost per student has been discussed, but not yet approved. As a consequence, it is impossible to use a cost-based approach to determine budgetary allocations for state-sponsored students or to set tuition fees for students enrolled on a contractual basis. The university system does not use the concepts of full-time equivalent students and absorption coef-ficients differentiated on the basis of the type of education, which could be adopted as a funding mechanism reflecting the variation in costs across different levels of education and different specialties.
Resources for scientific research activities funded from the state budget are allocated via the Academy of Sciences, based either on the programmes and projects won on a competitive basis or the contracts signed between the Academy and the scientific labo-ratories of the State University of Medicine and Pharmacy “Nicolae Testemiţanu”.

36 The cosTs of Training healTh professionals in The republic of Moldova
4. Costing health professionals’ training in the Republic of Moldova4.1 Baseline data
Research question 6 is the main focus of the assignment: what is the average cost of training for general medical and nursing education in the Republic of Moldova? As an-ticipated in section 2, the answer to such a question depends on the specific information needs to be met. Taking practical constraints into account, it was decided to address the question using the top-down approach described in section 2.2 (method A). The corre-sponding results are presented in section 4.2. The bottom-up approach described in sec-tion 2.3 (method B) was considered but ultimately discarded, since it proved too time-consuming in terms of data collection. The approach described in section 2.4 (method C) could not be used, since it assumes the establishment of a fully developed cost account-ing system in the State University of Medicine and Pharmacy “Nicolae Testemiţanu” and the medical colleges, intended to calculate costs on an ongoing basis. The approach de-scribed in section 2.5 (method D) is suitable to calculate differential rather than average costs, so was not used for the purposes of this report. As anticipated in section 2.1, two more approaches (i.e. use of regression analysis to explain the difference in the cost of treatment between teaching and non-teaching hospitals; estimate of the benefits health-care professionals were expected to provide to their home country if they had not left) have been discarded because of their methodological limitations.
Research questions 4 and 5 refer to the baseline data needed to address the core ques-tion about the average cost of training for medical and nursing education in the Republic of Moldova. They specifically request identification of:
• annual costs of the Medical University and Nursing College (staff, operations, equipment, etc.) [as annual average for the last ten-year period];
• tuition fees, accommodation fees, meal costs, transport costs, costs of text-books, uniform for general primary and secondary education and for medical and nursing education (per each year of education).

37The cosTs of Training healTh professionals
in The republic of Moldova
In order to address these questions, and taking account of data availability, it was agreed to collect the annual expenditures of the State University of Medicine and Pharmacy “Nicolae Testemiţanu” as well as the consolidated figures for all five nursing colleges for the following inputs:
• teaching staff (including laboratory staff) • non-teaching staff (including IT staff) • learning materials (e.g. books, consumables for laboratories) • other consumables • maintenance • library • dormitories • student scholarships and transportation subsidies.10
Information was also collected on the tuition fees charged to students enrolled on a con-tractual basis. There were three reasons why costs associated with general primary and secondary education per each year of education were not collected.
1. Collecting this information would have required a close partnership with the Ministry of Education, especially in order to determine reference costs to be used across the Republic of Moldova, since average costs are likely differ widely from school to school.
2. Any cost information would need to be adjusted to account for inflation, since some analytical data would date back to the 1990s.
Most importantly, though, the costing of primary and secondary education is required when comparing the overall investment with the benefits health professionals were ex-pected to provide to their home country if they had not left (i.e. an approach discarded due to its limited reliability).11
10 No cost information is available about canteens. Consequently, it was assumed that they are all run on a market basis and so should not be included in estimates of the cost of training health professionals. It was decided not to account for the cost of meals, uniforms, transportation (except transportation subsidies) and textbooks (except those funded by library costs) since, for both medical and nursing education, they are funded by each student rather than the state budget.11 As an example, both Kirigia et al. (2006a, 2006b) and Mills et al. (2011) include the cost of primary and secondary education in their assessment of the cost of health professionals’ brain drain in Kenya. Kirigia et al. (2006a) use micro figures obtained from a single school, thus estimating the cost per student of primary and secondary education cycles at US$ 10 963 and US$ 6 865, respectively. Mills et al. (2011) take a macro approach, multiplying gross domestic product (GDP) per capita by the public expenditure for each pupil as a percentage of GDP per capita. For 2008, this produces estimates of the cost per student of primary and sec-ondary education cycles at US$ 2831.40 and US$ 1396.80, respectively (i.e. only 25% and 20% of the figures provided by Kirigia et al.).

38 The cosTs of Training healTh professionals in The republic of Moldova
Obviously, it is possible to calculate average figures based on annual expenditures. It was decided not to do so as the number of trainees has changed significantly over time, as have regulations about admissions, enrolment fees and unit costs.
Wherever possible, separate figures were collected for different levels of instruction and for Moldovan students enrolled on the basis of budgetary funding, Moldovan students enrolled on a contractual basis and foreign students. These were based on the cost al-location parameters used by the State University of Medicine and Pharmacy “Nicolae Testemiţanu” and the medical colleges. This distinction is relevant because the cost of training health professionals in the Republic of Moldova tends to be associated with governmental funding only, and the full picture is more complex.
4.2 Cost of training medical doctors
Annex 3 presents the average number of students enrolled in different levels of instruc-tion at the State University of Medicine and Pharmacy “Nicolae Testemiţanu” from 2003 to 2012, distinguishing between those enrolled on the basis of budgetary funding and those enrolled on a contractual basis. These figures allow a straightforward preliminary calculation of the average cost of one year of training – dividing the annual expenditures made available by the relevant accounting departments by the average number of en-rolled students. The corresponding average figures are presented in Tables 4.1. to 4.5. inclusive.

39The cosTs of Training healTh professionals
in The republic of Moldova
Tabl
e 4.
1. A
vera
ge a
ccou
nting
exp
endi
ture
for o
ne y
ear o
f und
ergr
adua
te m
edic
al tr
aini
ng (M
DL),
2003
–201
2
20
1220
1120
1020
0920
0820
0720
0620
0520
0420
03bu
dget
contra
ctbu
dget
contra
ctbu
dget
contra
ctbu
dget
contra
ctbu
dget
contra
ctbu
dget
contra
ctbu
dget
contra
ctbu
dget
contra
ctbu
dget
contra
ctbu
dget
contra
ctAv
erag
e nu
mbe
r of
stud
ents
3 03
72
243
3 08
01
941
3 06
61
677
2 98
41
583
2 68
71
641
2 35
51
790
2 06
11
972
1 87
91
991
1 83
01
932
1 84
41
940
Tota
l av
erag
e nu
mbe
r of
stud
ents
5 28
05
021
4 74
34
567
4 32
84
145
4 03
33
870
3 76
23
784
Cost
per
st
uden
t w
ithou
t CA
PEX
28 90
118
728
26 54
517
424
23 71
516
994
21 79
713
030
15 03
612
695
13 54
011
639
11 33
110
563
8 246
11 28
16 8
9910
671
6 135
9 201
Aver
age
(bud
get +
co
ntra
ct)
24 5
7923
019
21 3
3918
758
14 1
4812
719
10 9
569
807
8 83
67
707
Cost
per
st
uden
t in
clud
ing
CAPE
X
34 37
426
256
30 22
128
201
24 06
322
222
22 52
715
804
16 60
015
956
14 51
114
629
12 30
613
852
12 37
213
753
6899
13 25
16 1
7414
855
Aver
age
(bud
get +
co
ntra
ct)
30 9
2529
440
23 4
1220
196
16 3
5616
356
14 5
6213
062
13 0
8310
161

40 The cosTs of Training healTh professionals in The republic of Moldova
Tabl
e 4.
2. A
vera
ge a
ccou
nting
exp
endi
ture
for o
ne y
ear o
f res
iden
cy tr
aini
ng (M
DL),
2003
–201
2
2012
2011
2010
2009
2008
2007
2006
2005
2004
2003
budge
tcon
tract
budge
tcon
tract
budge
tcon
tract
budge
tcon
tract
budge
tcon
tract
budge
tcon
tract
budge
tcon
tract
budge
tcon
tract
budge
tcon
tract
budge
tcon
tract
Aver
age
num
ber o
f re
siden
ts1 4
2982
1 416
481 3
4545
1 327
531 3
6250
1 320
491 3
7558
1 409
601 4
2257
1 480
62
Tota
l av
erag
e nu
mbe
r of
resid
ents
1 51
11
464
1 39
01
380
1 41
21
369
1 43
31
469
1 47
91
542
Cost
per
re
siden
t w
ithou
t CA
PEX
32 1
9831
404
33 4
0531
671
23 2
1521
837
17 1
4613
358
9 88
78
655
Cost
per
re
siden
t in
clud
ing
CAPE
X
32 2
4431
725
33 8
1832
006
24 3
0122
468
18 4
1415
118
11 0
8910
838

41The cosTs of Training healTh professionals
in The republic of Moldova
Tabl
e 4.
3. A
vera
ge a
ccou
nting
exp
endi
ture
for o
ne y
ear o
f fel
low
ship
trai
ning
(MDL
), 20
03–2
012
2012
2011
2010
2009
2008
2007
2006
2005
2004
2003
budge
tcon
tract
budge
tcon
tract
budge
tcon
tract
budge
tcon
tract
budge
tcon
tract
budge
tcon
tract
budge
tcon
tract
budge
tcon
tract
budge
tcon
tract
budge
tcon
tract
Aver
age
num
ber o
f fe
llow
s10
31
124
111
81
110
210
03
786
8210
7818
7018
6717
Tota
l av
erag
e nu
mbe
r of
fello
ws
104
125
119
112
103
8492
9688
84
Cost
per
fe
llow
w
ithou
t CA
PEX
12 8
2510
378
11 8
8513
729
13 7
0115
117
11 4
869
713
7 17
03
246
Cost
per
fe
llow
in
clud
ing
CAPE
X
12 8
2510
378
11 8
8513
729
13 7
0118
135
12 4
8012
597
9 00
93
246

42 The cosTs of Training healTh professionals in The republic of Moldova
Tabl
e 4.
4. A
vera
ge a
ccou
nting
exp
endi
ture
for o
ne y
ear o
f mas
ter’s
deg
ree
trai
ning
(MDL
), 20
03–2
012
2012
2011
2010
2009
2008
2007
2006
2005
2004
2003
budge
tcon
tract
budge
tcon
tract
budge
tcon
tract
budge
tcon
tract
budge
tcon
tract
budge
tcon
tract
budge
tcon
tract
budge
tcon
tract
budge
tcon
tract
budge
tcon
tract
Aver
age
num
ber o
f m
aste
r’s
stud
ents
450
045
045
578
6513
4413
712
016
017
0
Tota
l nu
mbe
r of
mas
ter’s
st
uden
ts
5445
4557
7357
2012
1617
Cost
per
m
aste
r’s
stud
ent
with
out
CAPE
X
11 3
1113
351
10 4
606
730
6 18
98
851
12 0
805
858
3 55
63
394
Cost
per
m
aste
r’s
stud
ent
incl
udin
g CA
PEX
11 3
1113
351
10 4
607
105
7 19
316
956
15 8
805
858
3 55
63
394

43The cosTs of Training healTh professionals
in The republic of Moldova
Tabl
e 4.
5. A
vera
ge a
ccou
nting
exp
endi
ture
for o
ne m
onth
of C
ME
(MDL
), 20
03–2
012
2012
2011
2010
2009
2008
2007
2006
2005
2004
2003
budge
tcon
tract
budge
tcon
tract
budge
tcon
tract
budge
tcon
tract
budge
tcon
tract
budge
tcon
tract
budge
tcon
tract
budge
tcon
tract
budge
tcon
tract
budge
tcon
tract
Aver
age
num
ber
of C
ME
parti
cipan
ts,
mon
ths
337
234
628
812
227
314
131
014
333
112
932
910
847
088
365
8330
565
Tota
l av
erag
e nu
mbe
r of
CM
E pa
rticip
ants
, m
onth
s
337
348
410
414
453
460
437
558
448
370
Cost
per
CM
E pa
rticip
ant
(one
mon
th)
with
out
CAPE
X
3 48
73
318
2 62
82
429
1 46
01
207
978
533
592
629
Cost
per
CM
E pa
rticip
ant
(one
mon
th)
inclu
ding
CA
PEX
4 23
83
827
2 83
12
573
2 54
91
472
2 12
61
170
621
653

44 The cosTs of Training healTh professionals in The republic of Moldova
Simplicity is an obvious advantage of this approach, but does it provide a realistic measure of resource consumption? For instance, why is the average accounting expenditure from 2003 to 2007 higher for undergraduate students enrolled on a contractual basis than for students enrolled on the basis of bud-getary funding, notwithstanding the incidence of scholarships and other benefits paid out to the latter?
The explanation lies in the detailed figures made available by the accounting department of the State University of Medicine and Pharmacy “Nicolae Testemiţanu”, together with the explanation of financial management practices used in medical training institutions featured in section 3.2. The average ac-counting expenditures associated with different categories of trainees reflect neither exclusively direct costs (e.g. scholarships for students enrolled on the basis of budgetary funding, or language training for foreign students) nor indirect costs allocated on the basis of parameters. In 2003 and 2004, for instance, CAPEX totalling well over MDL 15 million was attributed to undergraduate students enrolled on a con-tractual basis, but it is most likely that the corresponding investment served budget-sponsored students too. Conversely, labour costs for 2012 highlight that 86% of instructors’ salaries is attributed to budget-sponsored students, with the remaining 14% allocated to fee-paying students. The allocation is very different for the salaries of support staff (39.3% and 60.7%, respectively) but it is likely that both budget-sponsored and fee-paying students used the services of teaching and support staff in similar ways. The same inconsistencies are apparent in expenditures associated with utilities.
Two approaches were used to correct for the effects of this biased allocation. Firstly, for current expen-ditures, by identifying both direct (basically only scholarships and other benefits such as access to dor-mitories and reimbursement of travel cards) and indirect costs for each level of instruction. Direct costs were divided by the number of budged-sponsored students only; indirect costs by the total number of students enrolled in that level of instruction. Secondly, by reflecting the fact that investments contribute to educational processes beyond the year in which the outlay is made. Hence, every CAPEX was depreci-ated evenly over five years, and the depreciation allowances corresponding to each year were included among indirect costs and divided by the total number of students enrolled in that level of instruction.12
The results of these calculations are presented in the following tables (Tables 4.6–4.10, inclusive). The re-sulting picture is very similar for both fellowship and master’s degree training because the small number of students (particularly of students enrolled on a contractual basis) makes it difficult to cover indirect costs by attributing them to these lines of activity. Differences appear concerning residency training and CME and, most importantly, with reference to undergraduate medical education.
12 Since CAPEX before 2003 is not available, all depreciation allowances before 2007 would have been un-derestimated. Thus the unit cost of training for those years would have been underestimated, distorting the picture of the growth in costs over time. To introduce a partial correction to this bias, depreciation for 2006 is calculated as 25% of CAPEX from 2003 to 2006; depreciation for 2005 is calculated as 33% of CAPEX from 2003 to 2005; depreciation for 2004 is calculated as 50% of CAPEX in 2003 and 2004; and all CAPEX for 2003 is added to indirect costs for that year.

45The cosTs of Training healTh professionals
in The republic of Moldova
Tabl
e 4.
6. A
vera
ge c
ost f
or o
ne y
ear o
f und
ergr
adua
te m
edic
al tr
aini
ng (M
DL 0
00s)
, 200
3–20
12
20
1220
1120
1020
0920
0820
0720
0620
0520
0420
03bu
dget
contra
ctbu
dget
contra
ctbu
dget
contra
ctbu
dget
contra
ctbu
dget
contra
ctbu
dget
contra
ctbu
dget
contra
ctbu
dget
contra
ctbu
dget
contra
ctbu
dget
contra
ctAv
erag
e nu
mbe
r of
stud
ents
3 03
72
243
3 08
01
941
3 06
61
677
2 98
41
583
2 68
71
641
2 35
51
790
2 06
11
972
1 87
91
991
1 83
01
932
1 84
41
940
Tota
l av
erag
e nu
mbe
r of
stud
ents
5 28
05
021
4 74
34
567
4328
4 14
54
033
3 87
03
762
3 78
4
Dire
ct c
osts
pe
r stu
dent
4.89
0.13
4.79
0.12
4.81
0.14
4.27
0.12
2.95
0.10
2.79
0.09
2.08
0.04
1.58
0.05
0.71
0.05
0.74
0.09
Indi
rect
co
st p
er
stud
ent
21.7
120
.03
18.1
815
.92
12.2
811
.09
9.87
9.02
8.46
7.30
CAPE
X pe
r st
uden
t3.
472.
621.
771.
972.
002.
162.
312.
472.
132.
92
Cost
per
st
uden
t w
ithou
t CA
PEX
26.6
021
.84
24.8
320
.15
22.9
918
.33
20.2
016
.04
15.2
312
.38
13.8
911
.18
11.9
59.
9110
.60
9.06
9.18
8.51
8.04
7.39
Aver
age
(bud
get +
co
ntra
ct)
24.5
823
.02
21.3
418
.76
14.1
512
.72
10.9
69.
818.
847.
71
Cost
per
st
uden
t in
clud
ing
CAPE
X30
.07
25.3
227
.45
22.7
824
.76
20.1
022
.16
18.0
117
.23
14.3
816
.05
13.3
514
.26
12.2
213
.07
11.5
411
.31
10.6
410
.96
10.3
1
Aver
age
(bud
get +
co
ntra
ct)
28.0
525
.64
23.1
120
.73
16.1
514
.88
13.2
612
.28
10.9
710
.62

46 The cosTs of Training healTh professionals in The republic of Moldova
Tabl
e 4.
7. A
vera
ge c
ost f
or o
ne y
ear o
f res
iden
cy tr
aini
ng (M
DL 0
00s)
, 200
3–20
12
2012
2011
2010
2009
2008
2007
2006
2005
2004
2003
budge
tcon
tract
budge
tcon
tract
budge
tcon
tract
budge
tcon
tract
budge
tcon
tract
budge
tcon
tract
budge
tcon
tract
budge
tcon
tract
budge
tcon
tract
budge
tcon
tract
Aver
age
num
ber o
f re
siden
ts1
429
821
416
481
345
451
327
531
362
501
320
491
375
581
409
601
422
571
480
62
Tota
l av
erag
e nu
mbe
r of
resid
ents
1 51
11
464
1 39
01
380
1 41
21
369
1 43
31
469
1 47
91
542
Dire
ct
cost
s per
re
siden
t11
.36
0.00
11.0
70.
0011
.02
0.00
11.2
10.
0011
.04
0.23
11.4
00.
008.
480.
507.
010.
423.
550.
433.
430.
00
Indi
rect
co
st p
er
resid
ent
21.4
520
.70
22.7
420
.90
12.5
610
.84
8.99
6.62
6.46
5.36
CAPE
X pe
r re
siden
t0.
410.
530.
761.
051.
221.
521.
671.
751.
742.
18
Cost
per
re
siden
t w
ithou
t CA
PEX
32.8
121
.45
31.7
720
.70
33.7
622
.74
32.1
020
.90
23.6
012
.79
22.2
510
.84
17.4
79.
4913
.63
7.04
10.0
16.
898.
795.
36
Aver
age
(bud
get +
co
ntra
ct)
32.2
031
.40
33.4
031
.67
23.2
121
.84
17.1
513
.36
9.89
8.65
Cost
per
re
siden
t in
clud
ing
CAPE
X33
.23
21.8
632
.30
21.2
334
.52
23.5
033
.15
21.9
524
.81
14.0
123
.77
12.3
619
.13
11.1
615
.38
8.80
11.7
58.
6310
.98
7.55
Aver
age
(bud
get
+con
trac
t)32
.61
31.9
434
.16
32.7
224
.43
23.3
618
.81
15.1
111
.63
10.8
4

47The cosTs of Training healTh professionals
in The republic of Moldova
Tabl
e 4.
8. A
vera
ge c
ost f
or o
ne y
ear o
f fel
low
ship
trai
ning
(MDL
000
s), 2
003–
2012
2012
2011
2010
2009
2008
2007
2006
2005
2004
2003
budge
tcon
tract
budge
tcon
tract
budge
tcon
tract
budge
tcon
tract
budge
tcon
tract
budge
tcon
tract
budge
tcon
tract
budge
tcon
tract
budge
tcon
tract
budge
tcon
tract
Aver
age
num
ber o
f fe
llow
s10
31
124
111
81
110
210
03
786
8210
7818
7018
6717
Tota
l av
erag
e nu
mbe
r of
fello
ws
104
125
119
112
103
8492
9688
84
Dire
ct c
osts
pe
r fel
low
10.3
50.
008.
940.
009.
930.
0011
.72
0.00
12.0
90.
0012
.24
0.00
9.27
0.00
7.47
0.00
3.72
0.00
3.80
0.00
Indi
rect
co
st p
er
fello
w2.
581.
512.
042.
221.
963.
753.
223.
644.
210.
22
CAPE
X pe
r fe
llow
0.00
0.41
0.58
1.11
1.52
1.87
1.44
1.52
0.92
0.00
Cost
per
fe
llow
w
ithou
t CA
PEX
12.9
22.
5810
.45
1.51
11.9
72.
0413
.94
2.22
14.0
51.
9615
.99
3.75
12.4
93.
2211
.11
3.64
7.93
4.21
4.01
0.22
Aver
age
(bud
get +
co
ntra
ct)
12.8
310
.38
11.8
813
.73
13.7
015
.12
11.4
99.
717.
173.
25
Cost
per
fe
llow
in
clud
ing
CAPE
X12
.92
2.58
10.8
51.
9112
.55
2.62
15.0
53.
3315
.57
3.48
17.8
65.
6213
.93
4.66
12.6
45.
168.
855.
134.
010.
22
Aver
age
(bud
get
+con
trac
t)12
.83
10.7
812
.46
14.8
415
.22
16.9
812
.93
11.2
48.
093.
25

48 The cosTs of Training healTh professionals in The republic of Moldova
Tabl
e 4.
9. A
vera
ge c
ost f
or o
ne y
ear o
f mas
ter’s
deg
ree
trai
ning
(MDL
000
s), 2
003–
2012
2012
2011
2010
2009
2008
2007
2006
2005
2004
2003
budget
contra
ctbud
getcon
tract
budget
contra
ctbud
getcon
tract
budget
contra
ctbud
getcon
tract
budget
contra
ctbud
getcon
tract
budget
contra
ctbud
getcon
tract
Aver
age
num
ber o
f m
aste
r’s
stud
ents
450
4545
578
6513
4413
712
1617
Tota
l nu
mbe
r of
mas
ter’s
st
uden
ts54
4545
5773
5720
1216
17
Dire
ct c
osts
pe
r mas
ter’s
st
uden
t0.
000.
00
0.00
0.
00
0.00
5.00
0.00
4.97
0.00
3.37
0.00
3.43
2.
76
2.72
Indi
rect
cos
t pe
r mas
ter’s
st
uden
t11
.31
13.3
510
.46
6.68
5.64
7.72
9.89
2.43
0.79
0.68
CAPE
X pe
r m
aste
r’s
stud
ent
0.35
2.47
2.81
2.22
1.67
1.89
0.95
0.00
0.00
0.00
Cost
per
m
aste
r’s
stud
ent
with
out
CAPE
X
11.3
111
.31
13.3
513
.35
10.4
610
.46
6.68
6.68
10.6
45.
6412
.69
7.72
13.2
69.
895.
862.
433.
560.
793.
390.
68
Aver
age
(bud
get +
co
ntra
ct)
11.3
113
.35
10.4
66.
736.
198.
8512
.08
5.86
3.56
3.39
Cost
per
m
aste
r’s
stud
ent
incl
udin
g CA
PEX
11.6
611
.66
15.8
315
.83
13.2
713
.27
8.90
8.90
12.3
27.
3214
.57
9.61
14.2
110
.84
5.86
2.43
3.56
0.79
3.39
0.68
Aver
age
(bud
get +
co
ntra
ct)
11.6
615
.83
13.2
78.
957.
8610
.74
13.0
35.
863.
563.
39

49The cosTs of Training healTh professionals
in The republic of Moldova
Tabl
e 4.
10. A
vera
ge c
ost f
or o
ne m
onth
of C
ME
(MDL
000
s), 2
003–
2012
2012
2011
2010
2009
2008
2007
2006
2005
2004
2003
budge
tcon
tract
budge
tcon
tract
budge
tcon
tract
budge
tcon
tract
budge
tcon
tract
budge
tcon
tract
budge
tcon
tract
budge
tcon
tract
budge
tcon
tract
budge
tcon
tract
Aver
age
num
ber
of C
ME
parti
cipan
ts,
mon
ths
337
234
628
812
227
314
131
014
333
112
932
910
847
088
365
8330
565
Tota
l av
erag
e nu
mbe
r of
CM
E pa
rticip
ants
, m
onth
s
337
348
410
414
453
460
437
558
448
370
Cost
per
CM
E pa
rticip
ant
(one
mon
th)
with
out
CAPE
X
3.49
3.32
2.63
2.43
1.46
1.21
0.98
0.53
0.59
0.63
CAPE
X pe
r CM
E pa
rticip
ant,
one
mon
th0.
630.
540.
610.
740.
660.
440.
500.
230.
020.
02
Cost
per
CM
E pa
rticip
ant
(one
mon
th)
inclu
ding
CA
PEX
4.12
3.86
3.24
3.17
2.12
1.64
1.48
0.76
0.62
0.65

50 The cosTs of Training healTh professionals in The republic of Moldova
The calculations described above do not provide perfect measures of resource con-sumption: they correct the bias arising from arbitrary allocation of indirect costs be-tween budget-sponsored and fee-paying students and introduce depreciation of CAPEX. However, they do not correct arbitrary allocation of indirect costs and CAPEX among different levels of instruction.
Two expenditure items must still be added before arriving at a comprehensive estimate of the cost of training health professionals – the cost of libraries and dormitories. For libraries, it was assumed that different levels of instruction make similar use of these facilities. Also, libraries are used not only by trainees but also by instructors keeping abreast of the most recent developments in their area of specialization. Taking account of these factors, and the limited amount of research taking place outside the Academy of Science, the overall annual expenditure associated with the library of the State University of Medicine and Pharmacy “Nicolae Testemiţanu” (including both science and teach-ing budgetary allocations) was divided by the average number of trainees attending the University, as calculated in Annex 3. Recognizing that the expenditure associated with a library is actually a capital investment, it was decided to calculate the average over the last three years rather than use different figures for 2010, 2011 and 2012. The resulting figure is the share of library costs associated on average with each year of training for doctors and pharmacists across all levels of instruction (Table 4.11).
Table 4.11. Library costs associated with training of doctors and pharmacists (MDL 000s), 2010–2012
2012 2011 2010 Average 2010–2012
Library (science) 2 494.9 1 819.5 1 796.7 2 037.0Library (education) 1 938.1 1 568.8 1 400.3 1 635.7Total library expenditures 4 433.0 3 388.3 3 197.0 3 672.8Overall number of trainees 7 286.0 7 003.0 6 707.0 6 998.7Share of library costs per trainee per year 0.608 0.484 0.477 0.523
Share of library costs per trainee per month 0.051 0.040 0.040 0.044
Calculating the costs of dormitories within the overall cost of training is more complex – they are not needed by all trainees and occupancy rates vary over time, with noticeable implications for the average cost per bed. Moreover, different types of accommodation are available, and beneficiaries are expected to pay a monthly fee (ranging from MDL

51The cosTs of Training healTh professionals
in The republic of Moldova
43.2 to MDL 199 in 2012) differentiated on the basis of the level of instruction and en-rolment status (budget-sponsored/ fee-paying). It was therefore decided to calculate the average cost per bed in University dormitories and the average monthly fee paid by different categories of trainees from 2010 to 2012 (Table 4.12). The difference in these figures would provide a measure of the investment required to provide subsidized ac-commodation to budget-sponsored students.
Table 4.12. Dormitory subsidies associated with training of doctors and pharmacists (MDL), 2010–2012
2012 2011 2010 Average 2010–2012
Average cost per bed in University dormitories 582 856 510 649
Monthly fee for budget-sponsored students 199 175 151 175
Monthly subsidy to budget-sponsored students 383 681 359 474
Monthly fee for budget-sponsored residents, fellows and master’s students 211 190 171 191
Monthly subsidy to budget-sponsored residents, fellows and master’s students 371 666 339 459
Monthly fee for CME participants 375 375 571 440Monthly subsidy to CME participants 207 481 -61 209
Having ascertained these figures, it is now possible to address the first part of research question 6 – that is, to calculate a comprehensive reference cost of training for medi-cal education. Notwithstanding the normalization introduced by depreciating CAPEX instead of allocating it entirely at the time of outlay, the figures in Tables 4.6 to 4.10 show an irregular pattern over time. Since the organization of training did not undergo major changes, these differences are probably due to the arbitrary allocation of indirect costs and CAPEX among different levels of instruction. In particular, it is likely that the steep increase in the number of foreign students enrolled on a contractual basis and the discontinuation of budget-sponsored in-service training induced a shift of some staff and equipment costs from residency, fellowship and master’s degree training to under-graduate training and CME. To compensate at least in part for this phenomenon, it was decided that the average cost of medical training over the last three years would be used as a reference.

52 The cosTs of Training healTh professionals in The republic of Moldova
Table 4.13 shows the results of these calculations for all levels of instruction, distinguish-ing between the reference cost of trainees enrolled on the basis of budgetary funding and those enrolled on a contractual basis. Although not all budget-sponsored students actually use dormitories, for simplicity the cost of subsidized accommodation was added to their costs. Only one figure is presented for master’s degree training and CME – the reference cost of training can be considered the same for both categories as no direct costs were specifically attributed either to budget-sponsored or to fee-paying trainees attending this level of instruction in the three years taken into account (see Tables 4.9 and 4.10).
Table 4.13. Reference cost for one year of medical training for all levels of university education (MDL), average 2010–2012
2012 2011 2010 Average 2010–2012
Library costs
Dormitory subsidy TOTAL
Undergraduate medical training (budget)
30 074 27 448 24 762 27 428 523 5 688 33 639
Undergraduate medical training (contract)
25 317 22 775 20 100 22 731 523 0 23 254
Residency training (budget) 33 226 31 937 34 517 33 227 523 5 508 39 258
Residency training (contract)
21 863 21 234 23 496 22 198 523 0 22 721
Fellowship training (budget) 12 924 10 855 12 548 12 109 523 5 508 18 140
Fellowship training (contract)
2 579 1 912 2 619 2 370 523 0 2 893
Master’s degree training 11 662 15 825 13 272 13 586 523 5 508 19 617
CME (one month) 4 120 3 856 3 243 3 740 44 209 3 993
The reference cost for one year of training can then be used to calculate the reference cost for the entire training cycle. Table 4.14 shows the estimates for the most common duration for all levels of instruction; as outlined in section 3.1, residency training can be longer or shorter but the corresponding figure can be calculated easily. To facilitate international comparisons, reference costs for each training cycle are expressed also in United States dollars (US$).

53The cosTs of Training healTh professionals
in The republic of Moldova
Table 4.14. Reference cost for full cycle of medical training for all levels of university education (MDL/US$), average 2010–2012
Cost per year (MDL)
Duration (years)
Cost per cycle
(MDL)
MDL/US$ rate
Cost per cycle (US$)
Undergraduate medical training (budget), five years 33 639 5 168 195 12.5 13 456
Undergraduate medical training (contract), five years 23 254 5 116 270 12.5 9 302
Undergraduate medical training (budget), six years 33 639 6 201 834 12.5 16 147
Undergraduate medical training (contract), six years 23 254 6 139 524 12.5 11 162
Residency training (budget), therapeutic profile 39 258 3 117 774 12.5 9 422
Residency training (contract), therapeutic profile 22 721 3 68 163 12.5 5 453
Residency training (budget), surgical profile 39 258 4 157 032 12.5 12 563
Residency training (contract), surgical profile 22 721 4 90 884 12.5 7 271
Fellowship training (budget) 18 140 2 36 280 12.5 2 902Fellowship training (contract) 2 893 2 5 786 12.5 463Master’s degree training 19 617 2 39 234 12.5 3 139CME (one month) 3 993 1/12 - 12.5 319
4.3 Cost of training nurses and other health professionals with specialized secondary education
The approach used to calculate the cost of training medical doctors can be used for the training of nurses and other health professionals with specialized secondary education. Annex 4 summarizes the average number of students enrolled from 2003 to 2012 in all five medical colleges and two CME centres for medical and pharmaceutical professionals with secondary education. A straightforward calculation provides the average account-ing expenditure for one year of training –dividing the annual expenditures supplied by the accounting departments of medical colleges by the number of enrolled students. Available figures do not distinguish between expenditures associated with budget-spon-sored and fee-paying students; as a consequence, there is no need to reallocate indirect costs. It is necessary, however, to ensure that relevant direct costs (e.g. scholarships) are
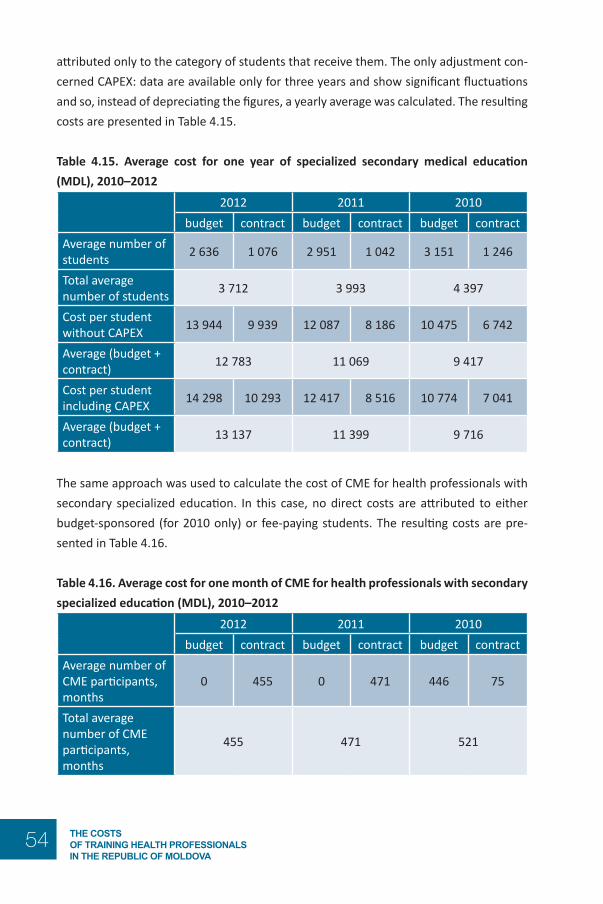
54 The cosTs of Training healTh professionals in The republic of Moldova
attributed only to the category of students that receive them. The only adjustment con-cerned CAPEX: data are available only for three years and show significant fluctuations and so, instead of depreciating the figures, a yearly average was calculated. The resulting costs are presented in Table 4.15.
Table 4.15. Average cost for one year of specialized secondary medical education (MDL), 2010–2012
2012 2011 2010
budget contract budget contract budget contractAverage number of students 2 636 1 076 2 951 1 042 3 151 1 246
Total average number of students 3 712 3 993 4 397
Cost per student without CAPEX 13 944 9 939 12 087 8 186 10 475 6 742
Average (budget + contract) 12 783 11 069 9 417
Cost per student including CAPEX 14 298 10 293 12 417 8 516 10 774 7 041
Average (budget + contract) 13 137 11 399 9 716
The same approach was used to calculate the cost of CME for health professionals with secondary specialized education. In this case, no direct costs are attributed to either budget-sponsored (for 2010 only) or fee-paying students. The resulting costs are pre-sented in Table 4.16.
Table 4.16. Average cost for one month of CME for health professionals with secondary specialized education (MDL), 2010–2012
2012 2011 2010
budget contract budget contract budget contractAverage number of CME participants, months
0 455 0 471 446 75
Total average number of CME participants, months
455 471 521

55The cosTs of Training healTh professionals
in The republic of Moldova
2012 2011 2010
budget contract budget contract budget contractCost per CME participant (one month) without CAPEX
1 156 1 030 1 434
Cost per CME participant (one month) including CAPEX
1 199 1 071 1 471
On the basis of these figures, it is now possible to provide an answer to the second part of research question 6 – that is, to calculate a comprehensive reference cost of train-ing for nursing education. The figures in Tables 4.15 and 4.16 show a puzzling pattern over time: a steep increase in the average cost of specialized secondary education and a drop in the average cost of CME, notwithstanding a decline in the number of par-ticipants. Again, these differences could be due to indirect costs being reallocated from CME centres for health professionals with secondary education to medical colleges. In other words, it is likely that the discontinuation of budget-sponsored in-service training induced some staff costs to be shifted from CME to specialized secondary education. To compensate, at least in part, for this phenomenon it was decided that the average cost of specialized secondary medical education over the last three years should be used as a reference. Unfortunately, information about library costs and dormitory subsidies are not available and so the calculation is very simple. Results are summarized in Table 4.17.
Table 4.17. Reference cost for one year of specialized secondary medical education (MDL), average 2010–2012
2012 2011 2010 Average 2010–2012
Library costs
Dormitory subsidy TOTAL
Specialized secondary medical education (budget)
14 298 12 417 10 774 12 496 n/a n/a 12 496
Specialized secondary medical education (contract)
10 293 8 516 7 041 8 617 n/a 0 8 617

56 The cosTs of Training healTh professionals in The republic of Moldova
2012 2011 2010 Average 2010–2012
Library costs
Dormitory subsidy TOTAL
CME for health professionals with secondary specialized education (one month)
1 199 1 071 1 471 1 247 n/a n/a 1 247
n/a: not available.
The reference cost for one year of specialized secondary medical education can then be used to calculate the reference cost for the entire educational cycle. Table 4.18. shows the corresponding estimates for students who graduated from a gymnasium (five years) and from a lyceum (three years). Again, to facilitate international comparisons, refer-ence costs for each educational cycle are also expressed in US$.
Table 4.18. Reference cost for full cycle of specialized secondary medical education (MDL/US$), average 2010–2012
Cost per year, MDL
Duration (years)
Cost per cycle, MDL
MDL/US$ rate
Cost per cycle, US$
Specialized secondary medical education (budget), three years 12 496 3 37 489 12.5 2 999
Specialized secondary medical education (contract), three years
8 617 3 25 850 12.5 2 068
Specialized secondary medical education (budget), five years 12 496 5 62 481 12.5 4 998
Specialized secondary medical education (contract), five years 8 617 5 43 083 12.5 3 447
CME for health professionals with secondary specialized education, one month
not applicable 1/12 1 247 12.5 100

57The cosTs of Training healTh professionals
in The republic of Moldova
5. A roadmap for decision-making in health professionals’ training5.1 Better cost information for better policies
The figures reported in sections 4.2 and 4.3 provide a basis on which it is possible to estimate the amount of taxpayers’ money that the Ministry of Health of the Republic of Moldova invests in training each of its health professionals. It is enough to add the cost of the relevant training programmes attended to the cost of any CME programme taken following graduation. Hence, the investment in a budget-sponsored family physi-cian who has just completed residency training can be estimated at MDL 285 969 (US$ 22 878); and the investment on a budget-sponsored surgeon who has also undergone four months of CME can be estimated at MDL 374 838 (US$ 29 987).
As anticipated in section 2.2, calculation of the average cost of training based on output volumes does not account for the different resource intensity associated with the train-ing of different professional profiles. Therefore, it is likely that the approach used in this report overestimates the actual cost of training family physicians and underestimates the cost of training surgeons. A finer-grained calculation would require a fully developed activity analysis, providing separate cost estimates for all relevant inputs for each train-ing programme, or the establishment of a comprehensive cost accounting system in all training institutions (see sections 2.3 and 2.4).
Nevertheless, this analysis can provide valuable information for decision-making. Fee setting provides a useful example and is an area of special concern, especially following the increased freedom to raise extra-budgetary revenues granted to the State University of Medicine and Pharmacy “Nicolae Testemiţanu”. Based on the figures reported in sec-tion 4 it is possible to compare average accounting expenditures for one year of under-graduate medical training with the cost calculated according to the method described in section 4.2 (both including and excluding CAPEX) and with the tuition fees for third-year Moldovan students attending the Faculty of Medicine over the last five years.

58 The cosTs of Training healTh professionals in The republic of Moldova
Tabl
e 5.
1. C
ompa
rison
of a
vera
ge a
ccou
nting
exp
endi
ture
with
ave
rage
cost
s and
tuiti
on fe
es fo
r one
yea
r of u
nder
grad
uate
med
ical
trai
n-in
g (M
DL),
2008
–201
2
2012
2011
2010
2009
2008
Budg
etCo
ntra
ctBu
dget
Cont
ract
Budg
etCo
ntra
ctBu
dget
Cont
ract
Budg
etCo
ntra
ctW
ithou
t CAP
EXAv
erag
e ac
coun
ting
expe
nditu
re p
er
stud
ent
28 9
0118
728
26 5
4517
424
23 7
1516
994
21 7
9713
030
15 0
3612
695
Aver
age
cost
per
st
uden
t26
600
21 8
4324
825
20 1
5322
987
18 3
2520
197
16 0
4515
230
12 3
77
Incl
udin
g CA
PEX
Aver
age
acco
untin
g ex
pend
iture
per
st
uden
t
34 3
7426
256
30 2
2128
201
24 0
6322
222
22 5
2715
804
16 6
0015
956
Aver
age
cost
per
st
uden
t30
074
25 3
1727
448
22 7
7524
762
20 1
0022
165
18 0
1217
233
14 3
80
Tuiti
on fe
e fo
r fe
e-pa
ying
third
-ye
ar st
uden
ts17
400
12 3
0012
300
11 6
0010
300

59The cosTs of Training healTh professionals
in The republic of Moldova
Table 5.1 highlights that, contrary to conventional wisdom in the Republic of Moldova, students enrolled on a contractual basis do not subsidize medical training, even though the fee recently increased to MDL 17 400. If a share of library costs (MDL 523, as cal-culated in Table 4.11) is added, the average yearly cost of contract-based undergradu-ate training in 2012 is MDL 25 840. In other words, contract-based students receive a subsidy from the Ministry of Health equal to 48.5% of the amount they pay. The fee for 2012 is actually very close to the average accounting expenditure in 2011 for contract-based training, excluding CAPEX (MDL 17 424), but (as discussed) this figure grossly un-derestimates actual resource consumption. Based on these figures, it is also possible to calculate the amount of taxpayers’ money that the Ministry of Health of the Republic of Moldova invests in training students enrolled on a contractual basis: using 2012 data, the amount spent to subsidize a five-year undergraduate degree in medicine equals (MDL 25 840 - 17 400) × 5 = MDL 42 200/US$ 3 376.
It is now possible to address research question 7, which includes three sub-questions:7a: Is it possible to increase the number of medical and nursing graduates per year?7b: If yes, what would be the number of fresh graduates per year?7c: What would be the financial bill linked to the increase?
The dynamics of admissions and graduations over the last ten years, as reported in Annexes 1, 2 and 3, signals that the State University of Medicine and Pharmacy “Nicolae Testemiţanu” was able to accommodate a significant increase in the volume of both un-dergraduate and postgraduate trainees. This is also due to the flexibility granted by reli-ance on clinics based in mainstream health services providers. Facilities and educational programmes have certainly evolved over the same time span, but available information does not allow assessment of any improvement or deterioration in learning outcomes. The dynamics concerning specialized secondary medical education are less straightfor-ward, as reported in Annex 4, with an increase in graduations but a steep decline in admissions, probably linked to the inadequate salaries granted to nurses (Galbur, 2011). Based on this evidence, it is possible to assume that Moldovan training institutions would be able to increase further the number of both medical and nursing graduates.
The financial bill linked to any increase in medical and nursing graduates would depend on many variables, including in particular the size of the increase and the contractual terms for enrolment. This calculation is an example of differential costing, as explained in section 2.5: a handful of additional graduates would have almost no impact on overall costs, whereas a significant increase would probably entail a dedicated investment to in-crease capacity. If additional graduates were enrolled on a contractual basis, the balance

60 The cosTs of Training healTh professionals in The republic of Moldova
would probably be favourable for training institutions, since the extra revenue would be higher than differential costs.13 A similar effect would result if additional budgetary al-locations were used to fund the training of more graduates.
In such a situation, the financial interests of training institutions might be at odds with the public interest. According to Galbur (2010), only 1275 of 3324 graduates who com-pleted residency or fellowship training from 2003 to 2009 (i.e. 38%) were working as doctors for public health services providers in the Republic of Moldova in 2010. If these data are correct, then the figures mentioned at the beginning of this section should be multiplied by three – that is, the Ministry of Health should, on average, train three people at a total cost of MDL 857 907 (US$ 68 633) in order to produce one more family physician who is actually providing services to the Moldovan population. In brief, it is likely that the number of doctors and nurses graduating from Moldovan training institu-tions can be increased but, taking account of the huge incidence of brain drain and brain waste, it is very doubtful whether it should.
5.2 Should the number of medical and nursing graduates be increased?
The costing exercise presented in this report is not only relevant in itself, but also be-cause of the insights provided on the organization and financing of the entire system of health professionals’ training in the Republic of Moldova. This section presents some general remarks, focusing on what are considered to be the critical weaknesses to be addressed; section 5.3 presents some practical suggestions stemming from the costing exercise.
It is a given that a fully developed medical university and a network of medical colleges are fundamental requirements of the health system of an independent country. In the terminology of WHO (2000), though, the stewardship function should ensure that fi-nancing – and, more specifically, strategic purchasing – introduces suitable incentives for resource creation and for health professionals’ training in particular, since training has a major impact on health services delivery, and ultimately on the overall performance of the health system.
13 This remark does not contradict the fact that students enrolled on a contractual basis enjoy a significant subsidy from the state: the fees they pay are lower than the average cost of training, because a large share of fixed and semi-fixed costs are funded through budgetary allocations and anyway are much higher than the differential cost of training.

61The cosTs of Training healTh professionals
in The republic of Moldova
Fig. 5.1. Relationships between functions and objectives of a health system
Source: WHO, 2000.
In 2010, less than 40% of those who graduated from residency or fellowship training, and about 60% of those who graduated from medical colleges, from 2003 to 2009 were working for public health services providers in the Republic of Moldova (Galbur, 2010). This means that a huge share of the resources invested in training health professionals is wasted, as taxpayers’ money earmarked for health professionals’ training do not pay off in terms of better care from the Moldovan health service and might actually be subsidiz-ing medical and nursing services in wealthier countries. It appears that the cost effective-ness of health professionals’ training in the Republic of Moldova is undermined by three biased incentives that stem implicitly from existing funding mechanisms.
The first biased incentive regards trainees: the provision of state-funded pre-service training, coupled with a scholarship and subsidized accommodation, but without the firm obligation to work for public (or at least Moldovan) health services providers follow-ing graduation. The obligation is there on paper but enforcement mechanisms are basi-cally non-existent. As a consequence, trainees can (and do) complete state-sponsored medical or nursing training and then pursue better employment opportunities abroad or in other industries.
The second biased incentive regards training institutions: the underestimation of bud-getary allocations meant to cover the costs incurred in training state-sponsored medical and nursing students, balanced by the right to admit growing numbers of fee- paying students. This behaviour is understandable, since fee-paying students allow pursuit of

62 The cosTs of Training healTh professionals in The republic of Moldova
scale economies and help to make up shortfalls. But this emphasis has an extremely negative effect as an oversupply of doctors and nurses makes it difficult to find employ-ment; helps keeping salaries low; and, ultimately, fuels migration or flight to careers out-side health care, thus justifying the training of additional cohorts of health professionals.
The third biased incentive regards destination countries: the opportunity for funding bodies to save on health professionals’ training, and for employers to hire doctors and nurses at lower salaries than they would negotiate if they had to recover the cost of training that they received free of charge. Especially in countries dealing with budget cuts and demanding patients, these lower salaries provide a very welcome help in bal-ancing the books, making the option of hiring foreign health professionals even more attractive.
Fig. 5.2. Overview of dynamics influencing cost effectiveness of health professionals’ training in the Republic of Moldova
Detailed discussion of how to correct these imbalances goes beyond the scope of this report, but it is clear that better enforcement of the obligation to serve in public health services providers following graduation would help to address the first and the third bias. This requires not only a legal challenge but also adequate planning and organiza-tion, since health services providers should create the conditions for new graduates to take up vacancies. The latter requirement alone would probably help to address the second bias, since a more explicit link between new graduates and available vacancies
63The cosTs of Training healTh professionals
in The republic of Moldova
would allow the establishment of more realistic ceilings on the number of state-spon-sored trainees. This should be coupled with a fine-tuning of the mechanisms used to fund training institutions, as discussed in more detail in section 5.3.2. It appears that ad-dressing these imbalances would serve the interests of Moldovan citizens much better than further increases in the number of medical and nursing graduates.
5.3 Suggestions for the future
As posited in section 2.1, costs are not absolute truths but quantities calculated for spe-cific purposes. Therefore, costing is useful only inasmuch as it produces information that improves policy or managerial practice. In the case of health professionals’ training in the Republic of Moldova, better cost information can be relevant for three different pur-poses, corresponding to three different institutional levels:
1. monitoring of resource consumption (primarily useful for training institutions);2. definition of funding mechanisms (primarily useful for the Ministry of Health
and the Ministry of Finance);3. pricing of health professionals’ training (primarily useful for possible negotia-
tions with employers in destination countries).
5.3.1 Monitoring of resource consumption
The existing accountability framework requires the information systems currently in place in Moldovan training institutions to focus on tracking expenditure rather than monitoring resource usage patterns. By measuring actual outlays against budgeted out-lays, these information systems help ensure compliance in the disbursement of funds rather than comparing input consumption with performance. Increasing degrees of au-tonomy now attributed to training institutions are likely to require a cultural shift from a legal to a managerial approach, as well as the adoption of new tools.
International evidence shows that the introduction of accrual-based accounting does not make much difference for state-funded institutions but a management accounting system could offer an important contribution in improving efficiency and effectiveness. This is especially true if coupled with systematic monitoring of learning outcomes and other non-financial information, and provided it is used primarily to compare perfor-mance and improve resource allocation rather than to punish poor performers. Well-designed, forward-looking management accounting systems would supply the informa-tion needed to help decide, for instance, whether all 118 postgraduate specializations

64 The cosTs of Training healTh professionals in The republic of Moldova
can be provided in the Republic of Moldova in a cost-effective manner or should be out-sourced, or whether the responsibilities for training nurses and other health profession-als with specialized secondary education could be reallocated across nursing colleges.
5.3.2 Definition of funding mechanisms
The introduction of a formula-based cost reimbursement mechanism for health profes-sionals’ training was discussed around 2010. New discussions are ongoing, but in prac-tice the Ministry of Finance defines yearly budgetary allocations to training institutions based on historical expenditure levels. Since these allocations do not cover all expenses, and total resource consumption changes little with increased numbers of trainees, train-ing institutions tend to maximize throughput by attracting fee-paying students whenever possible, no matter whether trainees will eventually find a job.
Adoption of improved funding mechanisms should be the logical consequence of the increased degrees of autonomy now attributed to training institutions. Following the ex-perience of other countries, the State Order could be turned into a fully-fledged service contract incorporating a funding formula agreed with the Ministry of Finance. Ideally, the formula should not be based on the full cost of training a health professional as this mechanism would not reduce the incentive to increase student intakes. Rather it should account for the efficiency gains offered by scale and scope economies, for instance by using different reimbursement patterns for fixed costs (e.g. equipment, maintenance, administrative staff salaries); semi-fixed costs (e.g. trainers’ salaries, consumables); and variable costs (e.g. student scholarships). Some form of mission budgeting could also help to break the vicious circle that currently induces training institutions to increase the number of trainees in order to maximize their revenues. A predefined, transpar-ent mechanism to determine the size of budgetary allocations would certainly improve accountability, but is difficult to achieve since any decision in this respect is ultimately political, and the Ministry of Finance is unwilling to tie its hands for the future.
5.3.3 Pricing of health professionals’ training
Since pre-service training is funded to a significant extent by the state budget, for practi-cal purposes all taxpayers in the Republic of Moldova subsidize from their own pockets not only the Moldovan doctors and nurses who decide to move abroad, but also the foreign employers (e.g. health ministries, health services providers, families in need of home care) who can save on training costs and hire less expensive workers (having re-ceived training for free, they have no corresponding investment to recover).

65The cosTs of Training healTh professionals
in The republic of Moldova
The idea that destination countries might reimburse the amount originally invested in health professionals’ training was envisaged as one of the possible solutions to compen-sate for the loss associated with brain drain, but there are several reasons why it is not possible to reach such a settlement ex post. It seems more reasonable to imagine that a formal agreement concerning the training of a group of health professionals could be signed ex ante between a training institution and an employer, group of employers (e.g. a hospital association) or a ministry. Under this scenario, Moldovan training providers should remember that prices in a market economy are set on the basis of value (i.e. the benefit received by end beneficiaries when using a product or service) rather than the direct and indirect costs borne to make that product or service available. The following formula can be used to estimate the value to an employer in a destination country of a health professional trained abroad (Nagle, Hogan & Zale, 2010):
cost of training that professional in the destination country +
net value associated with the advantages or disadvantages of a professional trained abroad
The resulting estimate provides the maximum price employers in a destination country would be willing to pay for the training of a given health professional in the Republic of Moldova. This analytical framework indicates that the training costs borne by Moldovan institutions are still relevant – not as the basis for the calculation of prices, but rather as the lower end of the window in which a price can be agreed.
Fig. 5.3. Reference framework for value-based pricing of training services for employ-ers in destination countries
66 The cosTs of Training healTh professionals in The republic of Moldova
references1. Barretta A (2005). The difficulties presented by cost comparison for health care
trusts: an empirical analysis. Public Management Review, 7(4):589–613.2. Bobroff MC, Gordon PA, Garanhani ML (2009). Total educational costs of an inte-
grated nursing curriculum. Rev Lat Am Enfermagem. 17(1):14–20.3. Brusati L (2006a). International best practices in the costing of health services.
In: Фрезоргер А.Д. Наука и образование в XXI веке: динамика развития в евразийском пространстве. [In: Frezorger AD, editor. Nauka i obrazovanie v XXI veke: dinamika razvitiya v evrasiiskom prostranstve [Science and education in the 21st century: the dynamics of development in the Eurasian area]. Pavlodar: Pavlodarskii Universitet:63–7.
4. Brusati L (2006b). Rozrakhunok vartosti medychnogo standartu [The costing of a medical standard]. In: Ross G, Novichkova O, editors). Posibnyk dlya rozrobnykiv klinichnykh rekomendacii/medychnykh standartiv [Manual for the development of clinical protocols/medical standards] Kiev: NICARE. ISBN 966-8571-22-3.
5. Carrin G, Evlo K (1992). Une méthodologie pour le calcul des coûts des soins de san-té et leur recouvrement. Geneva: World Health Organization (Série Macroéconomie et Santé No. 2; http://apps.who.int/iris/handle/10665/60059, accessed 15 April 2014).
6. Carroll AJ (1958). A study of medical costs. Evanston, IL: Association of American Medical Colleges.
7. Catturi G et al. (1995). La determinazione dei costi nelle aziende ospedaliere. Valenze gestionali ed aspetti operativi. Recenti progressi in medicina, 86(3).
8. Dobson A et al. (1994). Analysis of teaching hospital costs. Washington, DC: Association of American Medical Colleges.
9. Ellwood S (1996). Full-cost pricing rules within the National Health Service inter-nal market: accounting choices and the achievement of productive efficiency. Management Accounting Research, 7(1):25–51.
10. Galbur O (2010). Report: on the assessment of the number of graduates of post-graduate studies (residency and secondary clinical) and of the medicine colleges and the level of employment for the past seven years. In: Health Services and Social Assistance Project [website]. Chisinau: Ministry of Health of the Republic of Moldova (http://old.ms.gov.md/en/public/ international/projectseng/healthserv-socassispro/, accessed 12 May 2014).
11. Galbur O (2011). Report: referring to assess the costs related to health human resources. In: Health Services and Social Assistance Project [website]. Chisinau:

67The cosTs of Training healTh professionals
in The republic of Moldova
Ministry of Health of the Republic of Moldova (http://old.ms.gov.md/en/public/in-ternational/projectseng/healthserv socassispro/, accessed 12 May 2014).
12. Gavett JW, Mushlin AI (1986). Calculating the costs of training in primary care. Med Care. 24(4):301–12.
13. Jones RF, Korn D (1997). On the cost of educating a medical student. Acad Med. 72(3):200–210.
14. Kirigia JM, Gbary AR, Muthuri LK, Nyoni J, Seddoh A (2006a). The cost of health professionals’ brain drain in Kenya. BMC Health Services Research, 6(89) doi:10.1186/1472-6963-6-89.
15. Kirigia JM, Gbary AR, Nyoni J, Seddoh A, Muthuri LK et al. (2006b). The cost of health-related brain drain to the WHO African Region. African Journal of Health Sciences, 13(3–4):1–12.
16. Koehler JE, Slighton RL (1973). Activity analysis and cost analysis in medical schools. Journal of Medical Education, 48(6):531–50.
17. Kummer K, Bednash G, Redman B (1987). Cost model for baccalaureate nursing edu-cation. J Prof Nurs. 3(3):176–189.
18. López-Casasnovas G, Saez M (1999). The impact of teaching status on average costs in Spanish hospitals. Health Econ. 8(7):641–51.
19. Mechanic R, Coleman K, Dobson A (1998). Teaching hospital costs: implications for academic missions in a competitive market. JAMA. 280(11):1015–9.
20. Mendoza C, Bescos P-L (2001). An explanatory model of managers’ information needs: implications for management accounting. The European Accounting Review, 10(2).
21. Mennin SP, Martinez-Burrola N (1986). The cost of problem-based vs traditional medical education. Med Educ. 20(3):187–94.
22. Mills EJ, Kanters S, Hagopian A, Bansback N, Nachega J, Alberton M et al. (2011). The financial cost of doctors emigrating from sub-Saharan Africa: human capital analy-sis. BMJ, 343:d7031.
23. Muula AS, Panulo B Jr. (2007). Lost investment returns from the migration of medi-cal doctors from Malawi. Tanzan Health Res Bull. 9(1):61–4.
24. Nagle TT, Hogan JE, Zale J (2010). The strategy and tactics of pricing: a guide to grow-ing more profitably. Fifth edition. New York: Prentice Hall.
25. Northcott D, Llewellyn S (2002). Challenges in costing health care services: re-cent evidence from the UK. International Journal of Public Sector Management, 15(3):188–203.
26. Nyland K, Petterson IJ (2004). The control gap: the role of budgets, accounting in-formation and (non-) decisions in hospital settings. Financial Accountability and Management, 20(1):77–102.

68 The cosTs of Training healTh professionals in The republic of Moldova
27. Schilling JS (1987). Studying the costs of nursing education: seven decades of ef-forts. Nurs Health Care. 8(10):575–80.
28. Spollen M, Dixon P, Hindle G (2003). Research on additional costs of teach-ing in NHS Scotland: report for Standing Committee on Resource Allocation Act Sub-Group. Edinburgh: Scottish Executive (http://www.scotland.gov.uk/Publications/2004/03/19121/34767, accessed 15 April 2014).
29. Turcanu G, Domente S, Buga M, Richardson E (2012). Republic of Moldova health system review. Health Syst Transit. 14(7):1–151.
30. Valberg LS, Conyea MA, Sinclair DG, Wade J (1994). Planning the future academic medical centre. CMAJ. 151(11):1581–7.
31. WHO (2000). The world health report 2000 – health systems: improving perfor-mance. Geneva: World Health Organization.
32. Young DW (2003a). GME: at what cost? Healthc Financ Manage. 57(11):42–4, 47–8.33. Young DW (2003b). Management accounting in health care organizations. San
Francisco CA: Jossey-Bass.

69The cosTs of Training healTh professionals
in The republic of Moldova
Ann
ex 1
. Adm
issi
ons t
o St
ate
Uni
vers
ity
of M
edic
ine
and
Phar
mac
y “N
icol
ae
Test
emiţa
nu”,
all l
evel
s of i
nstr
uctio
n, 2
003–
2012
Tipu
l de
învă
ţăm
înt
2012
2011
2010
2009
2008
2007
2006
2005
2004
2003
Învă
ţăm
înt s
uper
ior,
tota
l1
091
1 13
31
090
952
1 12
095
992
885
886
375
6in
clus
iv: -
bud
geta
ri50
047
950
056
083
073
468
047
144
233
6- c
ontr
act R
M25
027
925
015
015
015
014
833
134
931
0 -c
ontr
act s
trăi
ni34
137
534
024
214
075
100
5672
110
Rezid
enţia
t, to
tal
628
600
554
517
477
466
440
434
477
482
incl
usiv
: - b
udge
tari
615
544
548
495
453
456
415
415
456
472
-con
trac
t str
ăini
1356
622
2410
2519
2110
Secu
ndar
iat,
tota
l40
3947
5248
5141
4245
41in
clus
iv: -
bud
geta
ri40
3946
5048
5040
4040
37 -c
ontr
act s
trăi
ni x
x 1
2x
11
25
4
Mas
tera
t, to
tal
5724
2123
3723
327
88
incl
usiv
: - b
udge
tari
16x
x x
x3
77
88
- con
trac
t RM
4124
2123
3720
25x
x x
Perfe
ction
area
cad
relo
r, to
tal
med
ici ş
i far
mac
işti5
875
5 23
76
219
6 28
96
265
5 21
74
672
4 45
94
830
4 68
6
incl
usiv
: - b
udge
tari
x x
4 69
44
745
4 65
04
026
3 47
73
147
3 14
93
385
- con
trac
t RM
5 87
55
237
1 52
51
544
1 61
51
191
1 19
51
312
1 68
11
301
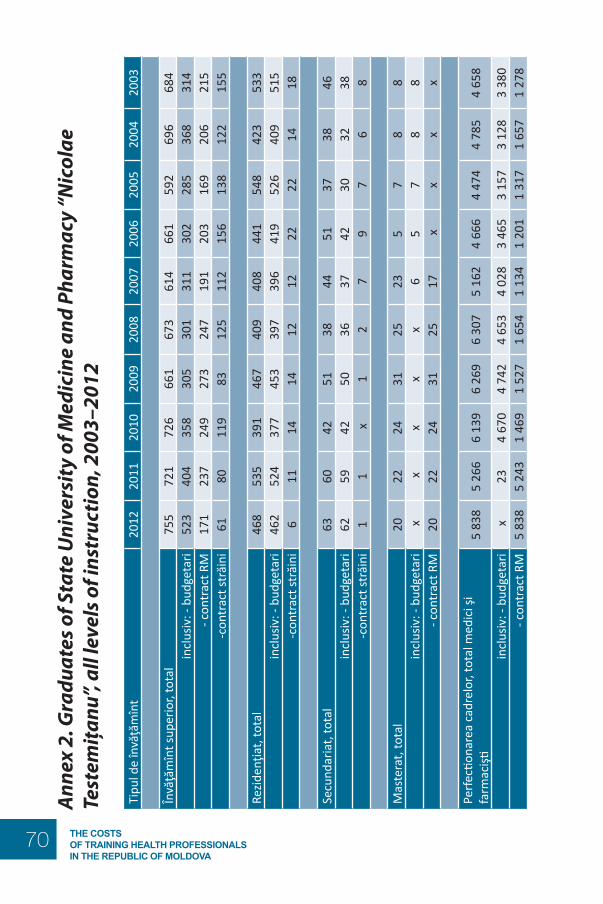
70 The cosTs of Training healTh professionals in The republic of Moldova
Ann
ex 2
. Gra
duat
es o
f Sta
te U
nive
rsit
y of
Med
icin
e an
d Ph
arm
acy
“Nic
olae
Te
stem
iţanu
”, al
l lev
els o
f ins
truc
tion,
200
3–20
12
Tipu
l de
învă
ţăm
înt
2012
2011
2010
2009
2008
2007
2006
2005
2004
2003
Învă
ţăm
înt s
uper
ior,
tota
l75
572
172
666
167
361
466
159
269
668
4in
clus
iv: -
bud
geta
ri52
340
435
830
530
131
130
228
536
831
4- c
ontr
act R
M17
123
724
927
324
719
120
316
920
621
5 -c
ontr
act s
trăi
ni61
8011
983
125
112
156
138
122
155
Rezid
enţia
t, to
tal
468
535
391
467
409
408
441
548
423
533
incl
usiv
: - b
udge
tari
462
524
377
453
397
396
419
526
409
515
-con
trac
t str
ăini
611
1414
1212
2222
1418
Secu
ndar
iat,
tota
l63
6042
5138
4451
3738
46in
clus
iv: -
bud
geta
ri62
5942
5036
3742
3032
38 -c
ontr
act s
trăi
ni1
1 x
12
79
76
8
Mas
tera
t, to
tal
2022
2431
2523
57
88
incl
usiv
: - b
udge
tari
x x
x x
x 6
57
88
- con
trac
t RM
2022
2431
2517
xx
xx
Perfe
ction
area
cad
relo
r, to
tal m
edic
i şi
farm
acişti
5 83
85
266
6 13
96
269
6 30
75
162
4 66
64
474
4 78
54
658
incl
usiv
: - b
udge
tari
x23
4 67
04
742
4 65
34
028
3 46
53
157
3 12
83
380
- con
trac
t RM
5 83
85
243
1 46
91
527
1 65
41
134
1 20
11
317
1 65
71
278

71The cosTs of Training healTh professionals
in The republic of Moldova
Ann
ex 3
. Ave
rage
num
ber o
f tra
inee
s enr
olle
d at
Sta
te U
nive
rsit
y of
Med
icin
e an
d Ph
arm
acy
“Nic
olae
Tes
tem
iţanu
”, al
l lev
els o
f ins
truc
tion,
200
3–20
12
Tipu
l de
învă
ţăm
înt
2012
2011
2010
2009
2008
2007
2006
2005
2004
2003
Învă
ţăm
înt s
uper
ior,
tota
l5
280
5 02
14
743
4 56
74
328
4 14
54
033
3 87
03
762
3 78
4in
clus
iv: -
bug
etar
i3
037
3 08
03
066
2 98
42
687
2 35
52
061
1 87
91
830
1 84
4- c
ontr
act R
M1
022
962
950
1 02
81
120
1 25
01
336
1 30
81
180
1 18
9 -
cont
ract
stră
ini
1 22
197
972
755
552
154
063
668
375
275
1
Rezid
enţia
t, to
tal
1 51
11
464
1 39
01
380
1412
1 36
91
433
1 46
91
479
1 54
2in
clus
iv: -
bug
etar
i1
429
1 41
61
345
1 32
71
362
1 32
01
375
1 40
91
422
1 48
0 -
cont
ract
stră
ini
8248
4553
5049
5860
5762
Secu
ndar
iat,
tota
l10
412
511
911
310
384
9296
8884
incl
usiv
: - b
uget
ari
103
124
118
110
100
7882
7870
67 -
cont
ract
stră
ini
11
12
36
1018
1817
Mas
tera
t, to
tal
5445
4557
7357
2012
1617
incl
usiv
: - b
uget
ari
4x
x x
813
1312
1617
- con
trac
t RM
5045
4557
6544
7x
x x
TOTA
L, F
ULL
-TIM
E ST
UDE
NTS
6 94
96
655
6 29
76
117
5 91
65
655
5 57
85
447
5 34
55
427
Perfe
ction
area
cad
relo
r, to
tal m
edic
i şi
farm
acişti
337
348
410
414
453
460
437
558
448
370
incl
usiv
: - b
uget
ari
x 2
288
273
310
331
329
470
365
305
- con
trac
t RM
337
346
122
141
143
129
108
8883
65
OVE
RALL
TO
TAL,
ALL
LEV
ELS
OF
INST
RUCT
ION
7 28
67
003
6 70
76
531
6 36
96
115
6 01
56
005
5 79
35
797

72 The cosTs of Training healTh professionals in The republic of Moldova
Anne
x 4. A
dmiss
ions
, gra
duat
es a
nd a
vera
ge n
umbe
r of s
tude
nts e
nrol
led
in m
edica
l co
llege
s and
CM
E ce
ntre
s for
hea
lth p
rofe
ssio
nals
with
seco
ndar
y edu
catio
n (2
003–
2012
)Ti
pul i
nstit
uţie
i20
1220
1120
1020
0920
0820
0720
0620
0520
0420
03
1. N
umăr
ul d
e el
evi,
curs
anţi
înm
atric
ulaţ
i la
stud
iiÎn
văţă
mîn
t med
iu d
e sp
ecia
litat
e1
164
1 16
41
100
1 06
41
457
1 45
51
778
1 75
01
635
1 45
7bu
get
766
766
800
814
1 25
71
220
771
750
750
700
cont
ract
398
398
300
250
200
235
1 00
71
000
885
757
Perfe
ction
area
cad
relo
r (as
isten
ţi m
edic
ali)
6 25
16
520
7 24
57
726
7 93
88
018
5 93
25
783
2 06
22
052
buge
tx
x6
058
6 53
26
783
7 09
85
722
5 45
11
874
1 95
1co
ntra
ct6
251
6 52
01
187
1 19
41
155
920
210
332
188
101
2. N
umăr
ul d
e el
evi,
curs
anţi
abso
lven
ţiÎn
văţă
mîn
t med
iu d
e sp
ecia
litat
e1
230
1 33
71
309
1 18
61
180
853
873
898
809
775
buge
t1
033
849
780
511
596
475
467
547
484
590
cont
ract
197
488
529
675
584
378
406
351
325
185
Perfe
ction
area
cad
relo
r (as
isten
ţi m
edic
ali)
6 24
26
513
7 21
07
706
7 90
57
979
5 87
55
737
2 04
82
030
buge
tx
x6
043
6 52
56
766
7 07
05
681
5 41
11
860
1 92
9co
ntra
ct6
242
6 51
31
167
1 18
11
139
909
194
326
188
101
3. N
umăr
ul m
ediu
de
elev
i, cu
rsan
ţi
Învă
ţăm
înt m
ediu
de
spec
ialit
ate
3 71
23
993
4 39
74
809
4 90
84
763
4 47
33
779
3 17
02
704
buge
t2
636
2 95
13
151
3 19
32
801
2 29
81
960
1 85
21
722
1 65
3co
ntra
ct1
076
1 04
21
246
1 61
62
107
2 46
52
513
1 92
71
448
1 05
1
Perfe
ction
area
cad
relo
r (as
isten
ţi m
edic
ali)
455
471
521
536
535
526
417
441
220
245
buge
tx
x44
645
846
746
840
642
020
523
8co
ntra
ct45
547
175
7868
5811
2115
7

73The cosTs of Training healTh professionals
in The republic of Moldova
Ann
ex 5
. Tui
tion
fees
cha
rged
to M
oldo
van
stud
ents
enr
olle
d on
cont
ract
ual b
asis
at
Sta
te U
nive
rsit
y of
Med
icin
e an
d Ph
arm
acy
“Nic
olae
Tes
tem
iţanu
” (M
DL)
, 20
03–2
012
Tipu
l de
învă
ţăm
înt
2012
2011
2010
2009
2008
2007
2006
2005
2004
2003
Med
icin
a ge
nera
lă,
Sănă
tate
Pub
lică
anul
I17
400
17 4
0017
400
xx
xx
8 20
07
200
6 60
0
Med
icin
a ge
nera
lă,
Sănă
tate
Pub
lică
anul
II17
400
17 4
0012
300
11 7
0011
600
x8
200
7 20
06
600
6 00
0
Med
icin
a ge
nera
lă,
Sănă
tate
Pub
lică
anul
III
17 4
0012
300
12 3
0011
600
10 3
008
200
7 20
06
600
6 00
06
000
Med
icin
a ge
nera
lă,
Sănă
tate
Pub
lică
anul
IV12
300
12 3
0012
200
10 3
009
000
7 20
06
600
6 00
06
000
6 00
0
Med
icin
a ge
nera
lă,
Sănă
tate
Pub
lică
anul
V12
300
12 2
0010
800
9 00
07
900
6 60
06
000
6 00
06
000
5 90
0
Med
icin
a ge
nera
lă,
Sănă
tate
Pub
lică
anul
VI
12 2
0010
800
9 50
07
900
7 20
06
000
6 00
06
000
5 90
05
000
Farm
acie
anu
l I18
200
18 2
0018
200
11 7
0011
700
11 6
009
400
8 20
07
200
6 60
0Fa
rmac
ie a
nul I
I18
200
18 2
0012
300
11 7
0011
600
9 40
08
200
7 20
06
600
6 00
0Fa
rmac
ie a
nul I
II18
200
12 3
0012
300
11 6
0010
300
8 20
07
200
6 60
06
000
6 00
0Fa
rmac
ie a
nul I
V12
300
12 3
0012
200
10 3
009
000
7 20
06
600
6 00
06
000
6 00
0Fa
rmac
ie a
nul V
12 3
0012
200
10 8
009
000
7 90
06
600
6 00
06
000
6 00
05
900

74 The cosTs of Training healTh professionals in The republic of Moldova
Tipu
l de
învă
ţăm
înt
2012
2011
2010
2009
2008
2007
2006
2005
2004
2003
Stom
atol
ogie
anu
l I20
300
20 3
0020
300
14 9
0014
900
13 6
0011
400
10 2
009
000
9 10
0St
omat
olog
ie a
nul I
20 8
0020
800
16 1
0015
400
14 3
0011
900
10 7
009
700
9 10
08
500
Stom
atol
ogie
anu
l III
21 5
0016
800
16 8
0014
900
13 6
0011
200
10 2
009
600
9 00
09
000
Stom
atol
ogie
anu
l IV
17 0
0017
000
15 9
0013
800
12 5
0010
400
9 80
09
200
9 20
09
200
Stom
atol
ogie
anu
l V
17 2
0016
100
14 7
0012
700
11 6
0010
000
9 40
09
400
9 40
09
300
Rezid
enţia
t20
900
20 9
0020
900
xx
xx
xx
xRe
ziden
ţiat î
n st
omat
olog
ie a
nul I
24 3
0024
300
24 3
00x
xx
xx
xx
Rezid
enţia
t în
stom
atol
ogie
anu
l II
24 4
0024
400
24 4
00x
xx
xx
xx
Rezid
enţia
t în
stom
atol
ogie
anu
l III
24 6
0024
600
24 6
00x
xx
xx
xx
Secu
ndar
iat
20 9
0020
900
20 9
00x
xx
xx
xx
Mas
tera
t15
500
15 5
0015
500
15 5
0015
500
15 5
0015
500
xx
xPe
rfecti
onar
ea
cadr
elor
: -
med
ici p
rofil
te
rape
utic
4 80
04
800
4 80
01
790
1 79
01
680
1 43
01
100
970
650
- med
ici p
rofil
ch
irurg
ical
6 73
06
730
6 73
02
150
2 15
01
980
1 69
01
300
1 16
078
0
- far
mac
işti1
290
1 29
01
290
740
740
590–
700
552
425
170
154


The WHO RegionalOffice for Europe
The World Health Organization (WHO) is aspecialized agency of the United Nationscreated in 1948 with the primary responsibilityfor international health matters and publichealth. The WHO Regional Office for Europeis one of six regional offices throughout theworld, each with its own programme gearedto the particular health conditions of thecountries it serves.
Member States
AlbaniaAndorraArmeniaAustriaAzerbaijanBelarusBelgiumBosnia and HerzegovinaBulgariaCroatiaCyprusCzech RepublicDenmarkEstoniaFinlandFranceGeorgiaGermanyGreeceHungaryIcelandIrelandIsraelItalyKazakhstanKyrgyzstanLatviaLithuaniaLuxembourgMaltaMonacoMontenegroNetherlandsNorwayPolandPortugalRepublic of MoldovaRomaniaRussian FederationSan MarinoSerbiaSlovakiaSloveniaSpainSwedenSwitzerlandTajikistanThe former YugoslavRepublic of MacedoniaTurkeyTurkmenistanUkraineUnited KingdomUzbekistan
Original: ENGLISH
WHO Regional Office for Europe
UN City, Marmorvej 51
DK-2100 Copenhagen Ø Denmark
Tel.: +45 45 33 70 00; Fax: +45 45 33 70 01
E-mail: [email protected]
WHO Regional Of ce for EuropeScher gsvej 8, DK-2100 Copenhagen Ø, DenmarkTel.:+45 39 17 17 17. Fax +45 39 17 18 18E-mail: [email protected]
Biroul Regional pentruEuropa al OMS
Organizaţia Mondială a Sănătăţii (OMS)este o agenţie specializată a NaţiunilorUnite creată în 1948 care este nemijlocitresponsabilă de subiectele sănătăţii internaţionale şi sănătatea publică. BiroulRegional pentru Europa al OMS esteunul din cele şase birouri regionale careexistă în lume, ecare având programulsău propriu adaptat la condiţiile speci cede sănătate ale ţărilor deservite.
Statele Membre
AlbaniaAndoraArmeniaAzerbaidjanBelarusBelgiaBosnia şi HerţegovinaBulgariaCroaţiaCipruRepublica CehăDanemarcaElveţiaEstoniaFederaţia RusăFinlandaFosta Republică Iugoslavă MacedoniaFranţaGeorgiaGermaniaGreciaUngariaIslandaIrlandaIsraelItaliaKazahstanKîrgîzstanLetoniaLituaniaLuxemburgMaltaMarea BritanieMonacoMuntenegruNorvegiaOlandaPoloniaPortugaliaRepublica MoldovaRomâniaSan MarinoSerbiaSlovaciaSloveniaSpaniaSuediaTadjikistanTurciaTurkmenistanUcrainaUzbekistan
WHOLIS E96178Original: ENGLEZĂ
sistemului sănătății
Biroul Regional pentruEuropa al OMS
Organizaţia Mondială a Sănătăţii (OMS)este o agenţie specializată a NaţiunilorUnite creată în 1948 care este nemijlocitresponsabilă de subiectele sănătăţiiinternaţionale şi sănătatea publică. BiroulRegional pentru Europa al OMS esteunul din cele şase birouri regionale careexistă în lume, ecare având programulsău propriu adaptat la condiţiile speci cede sănătate ale ţărilor deservite.
Statele Membre
AlbaniaAndoraArmeniaAzerbaidjanBelarusBelgiaBosnia şi HerţegovinaBulgariaCroaţiaCipruRepublica CehăDanemarcaElveţiaEstoniaFederaţia RusăFinlandaFosta Republică Iugoslavă MacedoniaFranţaGeorgiaGermaniaGreciaUngariaIslandaIrlandaIsraelItaliaKazahstanKîrgîzstanLetoniaLituaniaLuxemburgMaltaMarea BritanieMonacoMuntenegruNorvegiaOlandaPoloniaPortugaliaRepublica MoldovaRomâniaSan MarinoSerbiaSlovaciaSloveniaSpaniaSuediaTadjikistanTurciaTurkmenistanUcrainaUzbekistan
WHOLIS E96178Original: ENGLEZĂ
COSTURILE, EFECTELE ASUPRA SĂNĂTĂŢII ŞI COST – EFICACITATEA STRATEGIILOR DE CONTROL AL TUTUNULUI ÎN REPUBLICA MOLDOVA
Autori:Ghenadie ŢurcanuGalina ObrejaIon Şalaru
Republica MoldovaSeria de lucrări în domeniul politicilor de sănătate Nr. 2
MINISTERUL SĂNĂTĂȚII
The policy papers series aims
to strengthen the health system