the costs and benefits of investing in a toilet - ifs summaries... · the costs and benefits of...
TRANSCRIPT
Evaluating development policy at IFS
The costs and benefits of investing in a toilet
Views from Indian and Nigerian households and their policy implications
Britta AugsburgBet CaeyersFrancisco Oteiza
The costs and benefits of investing in a toilet
Views from Indian and Nigerian households and their policy implications
Britta Augsburg, Bet Caeyers and Francisco Oteiza1
Institute for Fiscal Studies
© The Institute for Fiscal Studies, June 2015 ISBN: 978-1-909463-94-3
The development field has put much emphasis on sanitation in recent years. Safe
sanitation has been recognised to be an indispensable element of disease
prevention and primary health care programmes (e.g. the Declaration of Alma-Ata,
1978).2 It isolates faeces from the environment and, with that, breaks the faecal–
oral transmission pathways associated with open defecation (OD) that would
otherwise lead to significant disease burdens; see, for example, WHO (2014)3 and
Roma and Pugh (2012).4 In addition to its importance for public and private
health, safe sanitation benefits individual households on a wide range of other
aspects, including time savings, comfort, increased productivity, greater safety and
a higher social status.
In most developing countries, however, the gap that needs to be crossed to reach
full sanitation coverage is substantial. Worldwide, 1.1 billion people still defecate
in the open.5 There is increasing government action to boost sanitation uptake –
1 The authors gratefully acknowledge funding from the ESRC-DFID Grant ES/J009253/1. The
research in India was funded by the Strategic Impact Evaluation Fund (SIEF), World Bank as well
as FINISH and WASTE Netherlands, and research in Nigeria was funded by the Bill & Melinda
Gates Foundation via WaterAid. 2 See http://www.euro.who.int/__data/assets/pdf_file/0009/113877/E93944.pdf. 3 ‘Preventing diarrhoea through better water, sanitation and hygiene: exposures and impacts in low- and middle-income countries’, https://extranet.who.int/iris/restricted/bitstream/10665/150112/1/9789241564823_eng.pdf. 4 E. Roma and I. Pugh, ‘Toilets for Health. A report by the London School of Hygiene and Tropical Medicine in collaboration with Domestos’, 2012 (http://www.lshtm.ac.uk/newsevents/features/2012/toilets_for_health.pdf). 5 Joint Monitoring Programme for Water Supply and Sanitation, ‘Progress on drinking water and sanitation: 2012 update’, Technical report, WHO/UNICEF, 2012 (http://www.wssinfo.org/fileadmin/user_upload/resources/JMP-2012-Annual-Report.pdf).
© Institute for Fiscal Studies, 2014
2
for instance, through subsidy programmes – but it is not clear whether this will be
sufficient to tackle the tremendous sanitation challenge. Some rough back-of-the-
envelope calculations suggest that the Government of India, for example, would
have to construct 81 toilets per minute – day and night – starting 1 January 2015
to meet its goal of eliminating OD by the end of 2019, or 41 toilets per minute to
meet the United Nation’s goal of eliminating OD by 2025.6
Given the limits to public spending, many sanitation programmes aim to persuade
households themselves to invest in the construction of a toilet. Put in economic
jargon, these interventions assume that the expected private returns from
investing in a private household toilet (e.g. better health, comfort, status, etc.) are
at least as high as the costs the household is expected to incur. One comprehensive
study on the costs and benefits of toilet construction was conducted by the Water
and Sanitation Program (WSP), launched in 2007 and implemented in more than
20 countries in Asia and Africa. While the primary focus of this study was on
attributing dollar amounts to a country’s losses due to improper sanitation,7 the
study also reports findings at the individual level, confirming that private quality
household sanitation is a worthwhile investment for households to make.8
Nonetheless, sanitation uptake is low and improvements in sanitation
infrastructure in developing countries are slow. If it is indeed such a worthwhile
investment, then why are the 1.1 billion people currently defecating in the open
and not raising the funds to make this investment?
Researchers at the Institute for Fiscal Studies (IFS) are working on a number of
sanitation evaluation studies, two of them in India (in the states of Maharashtra
and Tamil Nadu) and one in Nigeria (in Enugu and Ekiti); these are two of the main
6This is based on the following rough back-of-the-envelope calculations: Current number of household (of on average 4.5 household members) without sanitation=194.1 million (assuming 70% OD), additional number of households projected by 2019=13.3million (2025=32.1 million), [194.1 million + 0.7*13.3million]/[5years(11years)*365days*24hours*60minutes]. 7 The results are startling: for example, 18 African countries are estimated to lose around US$5.5 billion a year due to poor sanitation, implying annual economic losses between 1 and 2.5 per cent of GDP. 8 See, for example, WSP Research Brief, ‘The economic returns of sanitation interventions in Indonesia’, 2011. Another study concentrating on private returns is conducted in Maharashtra, India. The focus of this study is however on the estimating the economic value of the average “treatment effect” of a community demand-driven water and sanitation programme, rather than estimating the value of the sanitation systems more generally. (S.K.Pattanayak, C.Poulos, J.Yang & S.Patil (2010). "How valuable are environmental health interventions? Evaluation of water and sanitation programmes in India" Bulletin of the World Health Organization 2010;88:535-542. doi: 10.2471/BLT.09.066050
© Institute for Fiscal Studies, 2014
3
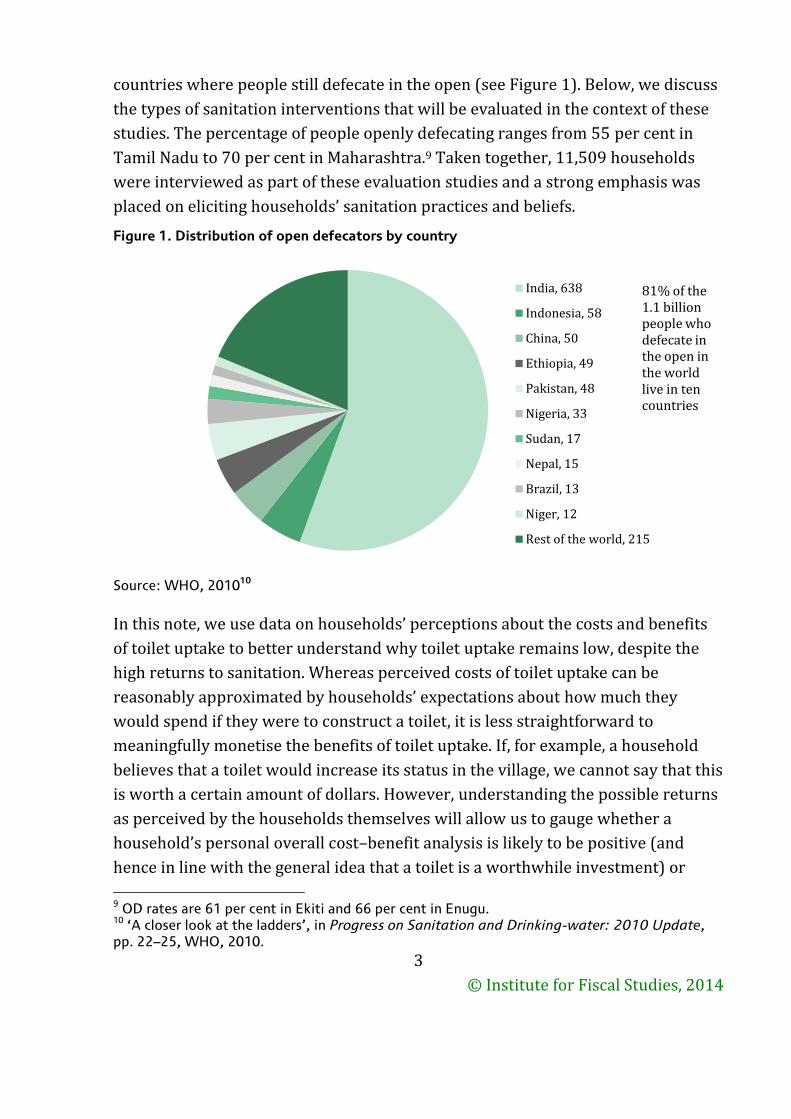
countries where people still defecate in the open (see Figure 1). Below, we discuss
the types of sanitation interventions that will be evaluated in the context of these
studies. The percentage of people openly defecating ranges from 55 per cent in
Tamil Nadu to 70 per cent in Maharashtra.9 Taken together, 11,509 households
were interviewed as part of these evaluation studies and a strong emphasis was
placed on eliciting households’ sanitation practices and beliefs.
Figure 1. Distribution of open defecators by country
Source: WHO, 201010
In this note, we use data on households’ perceptions about the costs and benefits
of toilet uptake to better understand why toilet uptake remains low, despite the
high returns to sanitation. Whereas perceived costs of toilet uptake can be
reasonably approximated by households’ expectations about how much they
would spend if they were to construct a toilet, it is less straightforward to
meaningfully monetise the benefits of toilet uptake. If, for example, a household
believes that a toilet would increase its status in the village, we cannot say that this
is worth a certain amount of dollars. However, understanding the possible returns
as perceived by the households themselves will allow us to gauge whether a
household’s personal overall cost–benefit analysis is likely to be positive (and
hence in line with the general idea that a toilet is a worthwhile investment) or
9 OD rates are 61 per cent in Ekiti and 66 per cent in Enugu. 10 ‘A closer look at the ladders’, in Progress on Sanitation and Drinking-water: 2010 Update, pp. 22–25, WHO, 2010.
India, 638
Indonesia, 58
China, 50
Ethiopia, 49
Pakistan, 48
Nigeria, 33
Sudan, 17
Nepal, 15
Brazil, 13
Niger, 12
Rest of the world, 215
81% of the 1.1 billion people who defecate in the open in the world live in ten countries
© Institute for Fiscal Studies, 2014
4
negative. Combining this then with the fact that households are not investing in
toilets, we will be able to conclude with some policy recommendations on what
type of sanitation interventions could be appropriate.
Understanding the reasons behind limited toilet ownership
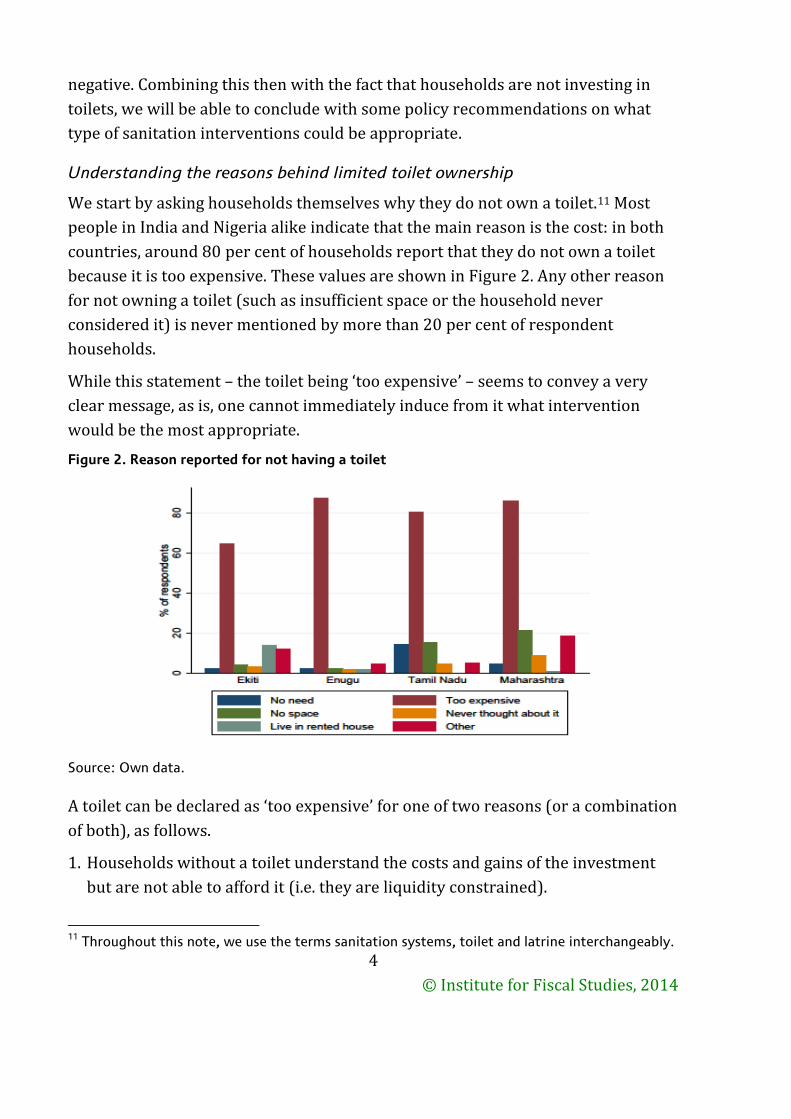
We start by asking households themselves why they do not own a toilet.11 Most
people in India and Nigeria alike indicate that the main reason is the cost: in both
countries, around 80 per cent of households report that they do not own a toilet
because it is too expensive. These values are shown in Figure 2. Any other reason
for not owning a toilet (such as insufficient space or the household never
considered it) is never mentioned by more than 20 per cent of respondent
households.
While this statement – the toilet being ‘too expensive’ – seems to convey a very
clear message, as is, one cannot immediately induce from it what intervention
would be the most appropriate.
Figure 2. Reason reported for not having a toilet
Source: Own data.
A toilet can be declared as ‘too expensive’ for one of two reasons (or a combination
of both), as follows.
1. Households without a toilet understand the costs and gains of the investment
but are not able to afford it (i.e. they are liquidity constrained).
11 Throughout this note, we use the terms sanitation systems, toilet and latrine interchangeably.
© Institute for Fiscal Studies, 2014
5
2. Households without toilets underestimate returns or overestimate costs, and
hence do not consider a toilet to be a worthwhile investment (even though they
could potentially afford it).
Clearly, it is important for the design of sanitation interventions to understand
which of the above points is the dominant reason for the observed non-uptake. If
the cost of toilets is seen as appropriate given the expected returns (i.e.
households would be willing to invest if they were able to; see point 1), then policy
makers and development agencies should focus on interventions that alleviate
liquidity constraints. If, however, households underestimate returns and/or
overestimate costs (see point 2), then any intervention that aims at inducing
sanitation uptake should provide households with information on the actual costs
and benefits. In many cases, a combination of these two would be the appropriate
way forward.
We use the very rich set of information on sanitation practices and habits, as well
as beliefs and perceptions collected as part of the impact evaluation studies, to
shed light on what drives households’ prevailing view that toilets are too
expensive. We start by discussing the expected costs and benefits from the
perspective of the household. Then we weigh one against the other and relate our
conclusions to findings from experimental sanitation impact evaluation studies,
providing insight that can guide sanitation intervention design choices in the
future.
Are households well informed about the costs of constructing a toilet?
What do households expect a toilet to cost and how do these expectations compare
to actual costs (i.e. are beliefs about the costs of constructing a personal household
toilet accurate)?
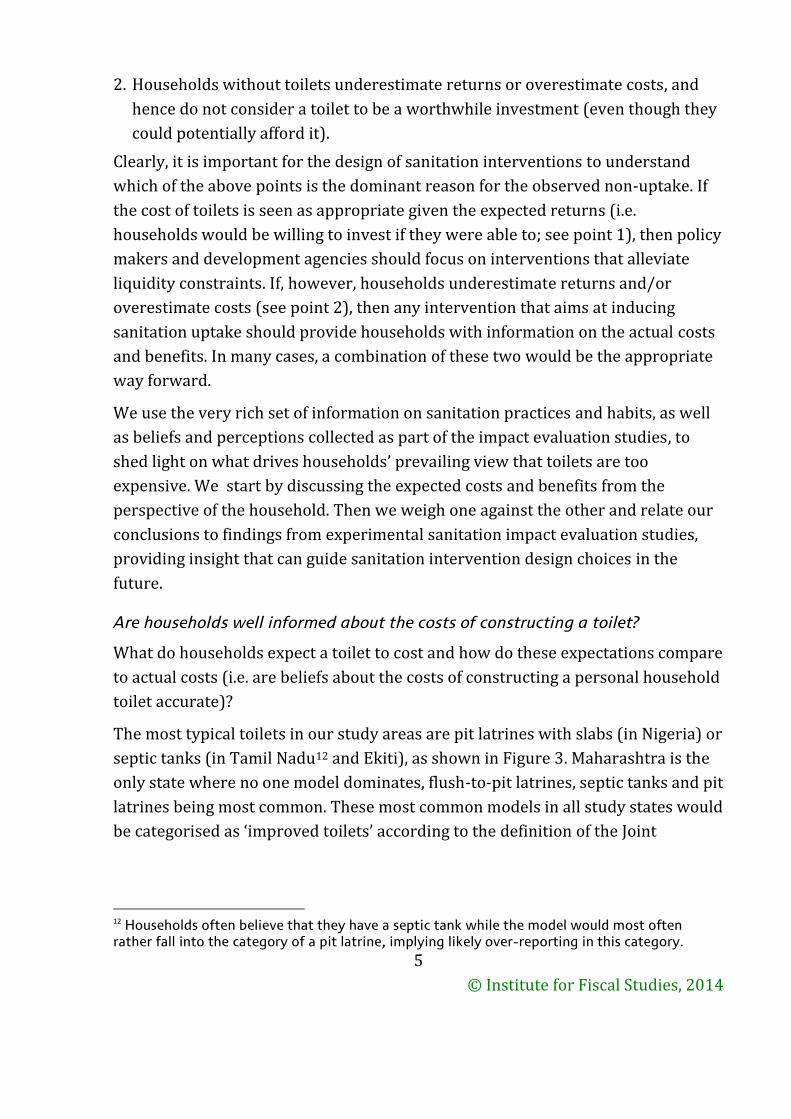
The most typical toilets in our study areas are pit latrines with slabs (in Nigeria) or
septic tanks (in Tamil Nadu12 and Ekiti), as shown in Figure 3. Maharashtra is the
only state where no one model dominates, flush-to-pit latrines, septic tanks and pit
latrines being most common. These most common models in all study states would
be categorised as ‘improved toilets’ according to the definition of the Joint
12 Households often believe that they have a septic tank while the model would most often rather fall into the category of a pit latrine, implying likely over-reporting in this category.
© Institute for Fiscal Studies, 2014
6
Monitoring Programme for Water Supply and Sanitation (2012),13 implying that
they hygienically separate human excreta from human contact.
To construct such a toilet, the household would, at a minimum, have to invest in
digging a pit and constructing some version of a slab over this pit. The household
can then improve on this most basic model by, for example, lining the pit,
constructing a (strong) superstructure, adding a second pit to be used when the
first is filled, etc. A household would typically need to invest not only in materials
but also in labour, such as a mason, carpenter, bricklayer, etc. Indeed, in India for
example, 92 per cent of households with a toilet report that they hired a mason for
the toilet construction.
Figure 3. Types of toilets owned
Source: Own data.
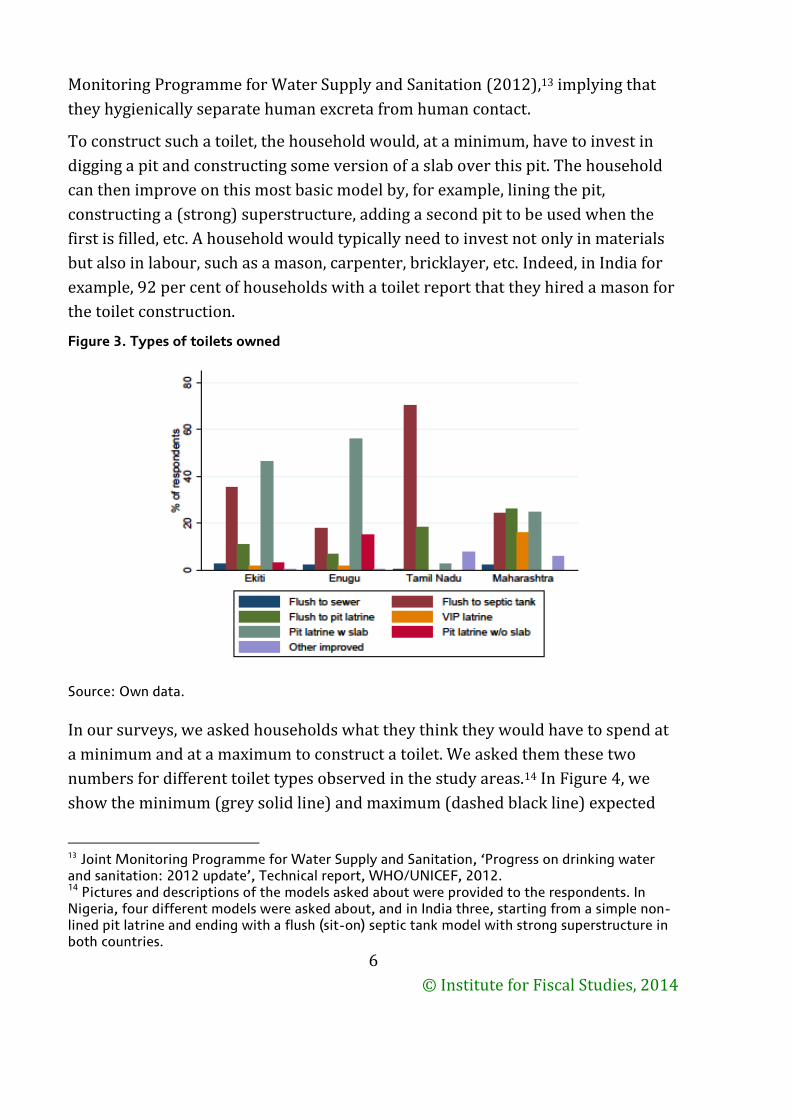
In our surveys, we asked households what they think they would have to spend at
a minimum and at a maximum to construct a toilet. We asked them these two
numbers for different toilet types observed in the study areas.14 In Figure 4, we
show the minimum (grey solid line) and maximum (dashed black line) expected
13 Joint Monitoring Programme for Water Supply and Sanitation, ‘Progress on drinking water and sanitation: 2012 update’, Technical report, WHO/UNICEF, 2012. 14 Pictures and descriptions of the models asked about were provided to the respondents. In Nigeria, four different models were asked about, and in India three, starting from a simple non-lined pit latrine and ending with a flush (sit-on) septic tank model with strong superstructure in both countries.
© Institute for Fiscal Studies, 2014
7
costs reported by households that do not own a toilet. We add to this information
the amount that households with a toilet reported to have spent on their toilet
construction (vertical line).
Figure 4. Expected minimum and maximum cost (2015 USD)
Note: The figure presents kernel density approximations of the expected values reported by the
households.
The results are likely to come as a surprise for many: contrary to what is often
believed, an average household, in both India and Nigeria, seems either to have a
relatively accurate (Ekiti, Maharashtra) idea of the amount needed to invest in a
private household latrine or to underestimate the costs (Enugu, Tamil Nadu). We
see that, in both countries, the average expected minimum and maximum
investment amounts lie respectively either just below and above, or both below,
the actual costs incurred and reported by households that have already
constructed a toilet.15,16 At the same time, the graphs also reveal that a
15 When taking the midpoint as the average expected cost in Maharashtra, households slightly overestimate the investment requirements. The average overestimated amount is USD 50, 11 per cent of the average reported costs. This could potentially be driven by the fact that the range of toilet models owned in this state is wider than in the other study states.
0
.0005
.001
.0015
.002
.0025
0 500 1000 1500Ekiti - Nigeria
0
.0005
.001
.0015
.002
0 500 1000 1500Enugu - Nigeria
0
.001
.002
.003
.004
0 500 1000 1500Tamil Nadu - India
0
.001
.002
.003
0 500 1000 1500Maharashtra - India
Expected minimum cost Expected maximum cost
© Institute for Fiscal Studies, 2014
8
considerable number of households do still overestimate the costs of a toilet: 13
per cent of households in Tamil Nadu and 41–48 per cent in the other three states
provide a minimum cost estimate that exceeds the average construction cost
observed in their state.
In addition, one has to consider that these initial investment costs are not the only
costs a household with a toilet incurs.17 However, the evidence suggests that the
average household in these states bases the statement that it does not own a toilet
because it is ‘too expensive’ on fairly accurate cost assumptions.18
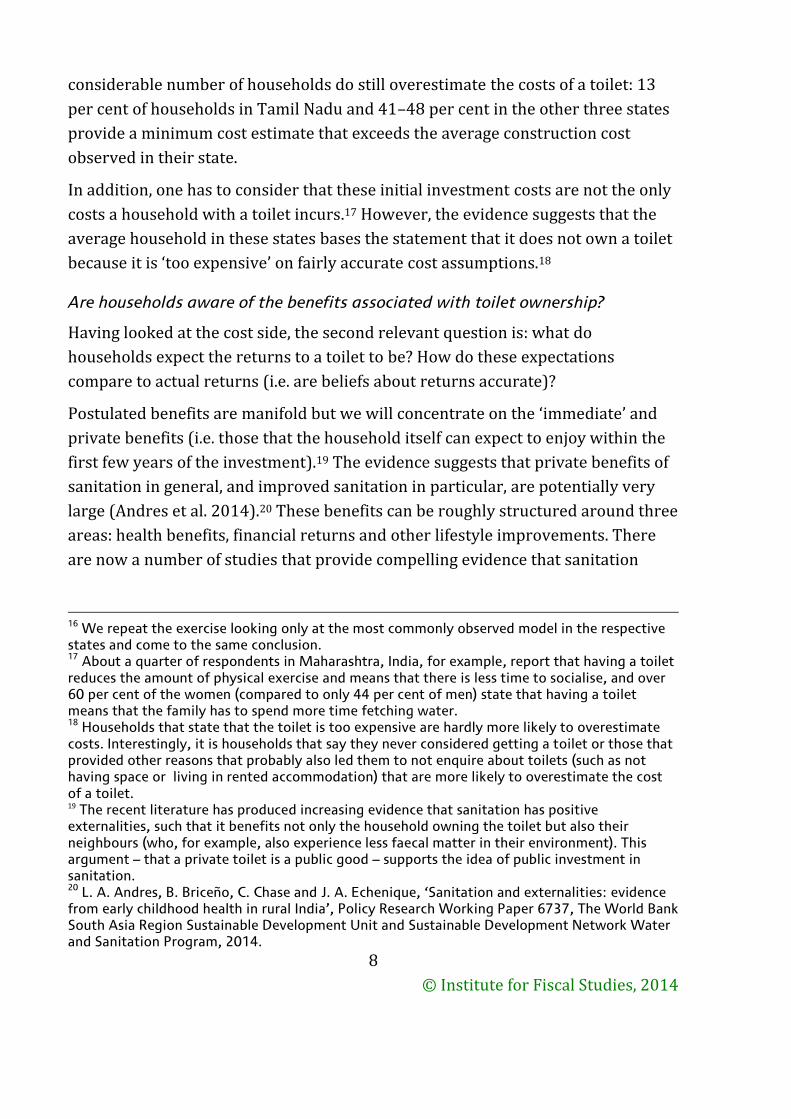
Are households aware of the benefits associated with toilet ownership?
Having looked at the cost side, the second relevant question is: what do
households expect the returns to a toilet to be? How do these expectations
compare to actual returns (i.e. are beliefs about returns accurate)?
Postulated benefits are manifold but we will concentrate on the ‘immediate’ and
private benefits (i.e. those that the household itself can expect to enjoy within the
first few years of the investment).19 The evidence suggests that private benefits of
sanitation in general, and improved sanitation in particular, are potentially very
large (Andres et al. 2014).20 These benefits can be roughly structured around three
areas: health benefits, financial returns and other lifestyle improvements. There
are now a number of studies that provide compelling evidence that sanitation
16 We repeat the exercise looking only at the most commonly observed model in the respective states and come to the same conclusion. 17 About a quarter of respondents in Maharashtra, India, for example, report that having a toilet reduces the amount of physical exercise and means that there is less time to socialise, and over 60 per cent of the women (compared to only 44 per cent of men) state that having a toilet means that the family has to spend more time fetching water. 18 Households that state that the toilet is too expensive are hardly more likely to overestimate costs. Interestingly, it is households that say they never considered getting a toilet or those that provided other reasons that probably also led them to not enquire about toilets (such as not having space or living in rented accommodation) that are more likely to overestimate the cost of a toilet. 19 The recent literature has produced increasing evidence that sanitation has positive externalities, such that it benefits not only the household owning the toilet but also their neighbours (who, for example, also experience less faecal matter in their environment). This argument – that a private toilet is a public good – supports the idea of public investment in sanitation. 20 L. A. Andres, B. Briceño, C. Chase and J. A. Echenique, ‘Sanitation and externalities: evidence from early childhood health in rural India’, Policy Research Working Paper 6737, The World Bank South Asia Region Sustainable Development Unit and Sustainable Development Network Water and Sanitation Program, 2014.
© Institute for Fiscal Studies, 2014
9
interventions reduce diarrhoeal diseases (Fewtrell et al., 2005;21 Cameron and
Shah 2013;22 Clasen et al. 201523) and improve underweight conditions and
stunting in children (Humphrey 2009;24 Spears 201225). Such malnourishment
has been shown to have longer-term consequences on the accumulation of human
capital and productivity (Victoria et al. 200826), which might be avoided through
improved sanitation.
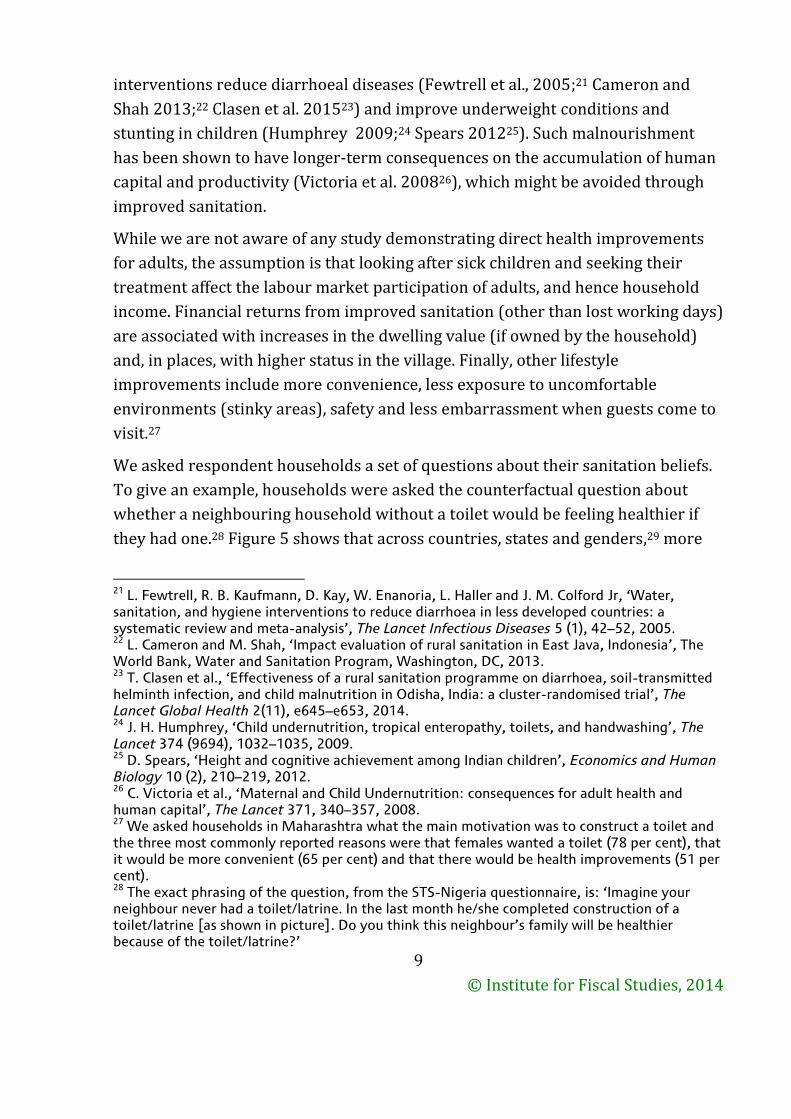
While we are not aware of any study demonstrating direct health improvements
for adults, the assumption is that looking after sick children and seeking their
treatment affect the labour market participation of adults, and hence household
income. Financial returns from improved sanitation (other than lost working days)
are associated with increases in the dwelling value (if owned by the household)
and, in places, with higher status in the village. Finally, other lifestyle
improvements include more convenience, less exposure to uncomfortable
environments (stinky areas), safety and less embarrassment when guests come to
visit.27
We asked respondent households a set of questions about their sanitation beliefs.
To give an example, households were asked the counterfactual question about
whether a neighbouring household without a toilet would be feeling healthier if
they had one.28 Figure 5 shows that across countries, states and genders,29 more
21 L. Fewtrell, R. B. Kaufmann, D. Kay, W. Enanoria, L. Haller and J. M. Colford Jr, ‘Water, sanitation, and hygiene interventions to reduce diarrhoea in less developed countries: a systematic review and meta-analysis’, The Lancet Infectious Diseases 5 (1), 42–52, 2005. 22 L. Cameron and M. Shah, ‘Impact evaluation of rural sanitation in East Java, Indonesia’, The World Bank, Water and Sanitation Program, Washington, DC, 2013. 23 T. Clasen et al., ‘Effectiveness of a rural sanitation programme on diarrhoea, soil-transmitted helminth infection, and child malnutrition in Odisha, India: a cluster-randomised trial’, The Lancet Global Health 2(11), e645–e653, 2014. 24 J. H. Humphrey, ‘Child undernutrition, tropical enteropathy, toilets, and handwashing’, The Lancet 374 (9694), 1032–1035, 2009. 25
D. Spears, ‘Height and cognitive achievement among Indian children’, Economics and Human Biology 10 (2), 210–219, 2012. 26 C. Victoria et al., ‘Maternal and Child Undernutrition: consequences for adult health and human capital’, The Lancet 371, 340–357, 2008. 27 We asked households in Maharashtra what the main motivation was to construct a toilet and the three most commonly reported reasons were that females wanted a toilet (78 per cent), that it would be more convenient (65 per cent) and that there would be health improvements (51 per cent). 28 The exact phrasing of the question, from the STS-Nigeria questionnaire, is: ‘Imagine your neighbour never had a toilet/latrine. In the last month he/she completed construction of a toilet/latrine [as shown in picture]. Do you think this neighbour’s family will be healthier because of the toilet/latrine?’
© Institute for Fiscal Studies, 2014
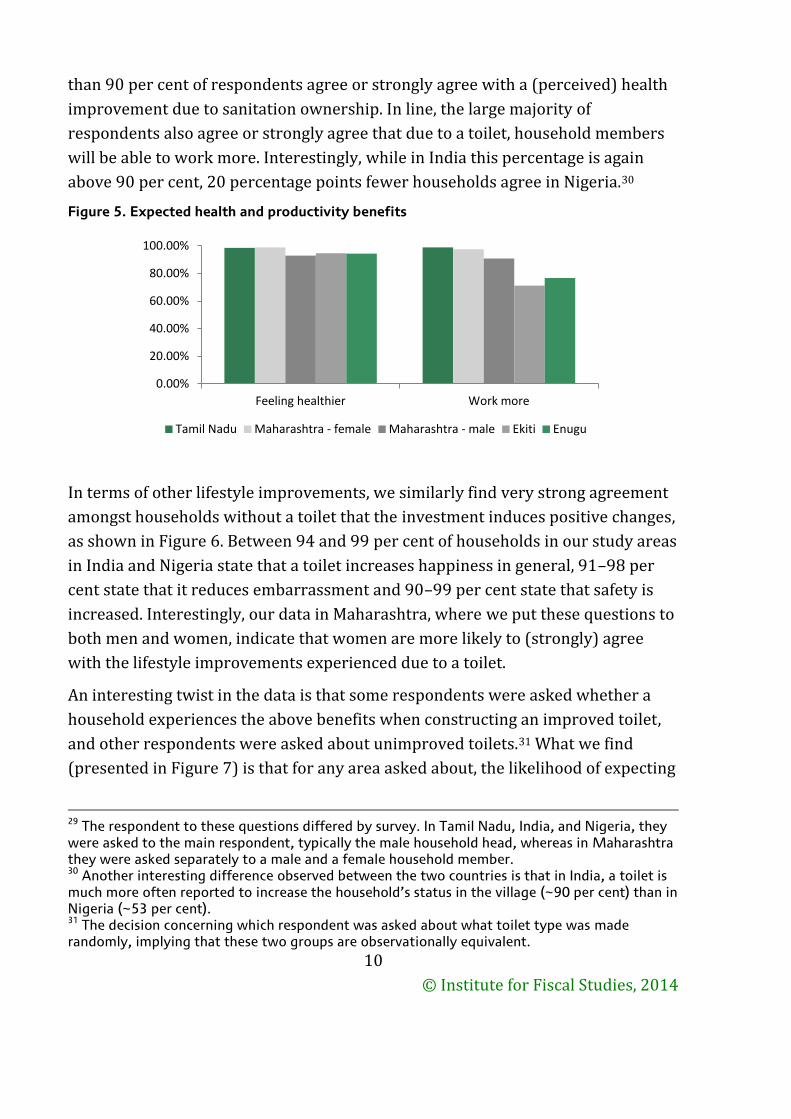
10
than 90 per cent of respondents agree or strongly agree with a (perceived) health
improvement due to sanitation ownership. In line, the large majority of
respondents also agree or strongly agree that due to a toilet, household members
will be able to work more. Interestingly, while in India this percentage is again
above 90 per cent, 20 percentage points fewer households agree in Nigeria.30
Figure 5. Expected health and productivity benefits
In terms of other lifestyle improvements, we similarly find very strong agreement
amongst households without a toilet that the investment induces positive changes,
as shown in Figure 6. Between 94 and 99 per cent of households in our study areas
in India and Nigeria state that a toilet increases happiness in general, 91–98 per
cent state that it reduces embarrassment and 90–99 per cent state that safety is
increased. Interestingly, our data in Maharashtra, where we put these questions to
both men and women, indicate that women are more likely to (strongly) agree
with the lifestyle improvements experienced due to a toilet.
An interesting twist in the data is that some respondents were asked whether a
household experiences the above benefits when constructing an improved toilet,
and other respondents were asked about unimproved toilets.31 What we find
(presented in Figure 7) is that for any area asked about, the likelihood of expecting
29 The respondent to these questions differed by survey. In Tamil Nadu, India, and Nigeria, they were asked to the main respondent, typically the male household head, whereas in Maharashtra they were asked separately to a male and a female household member. 30 Another interesting difference observed between the two countries is that in India, a toilet is much more often reported to increase the household’s status in the village (~90 per cent) than in Nigeria (~53 per cent). 31 The decision concerning which respondent was asked about what toilet type was made randomly, implying that these two groups are observationally equivalent.
0.00%
20.00%
40.00%
60.00%
80.00%
100.00%
Feeling healthier Work more
Tamil Nadu Maharashtra - female Maharashtra - male Ekiti Enugu
© Institute for Fiscal Studies, 2014
11
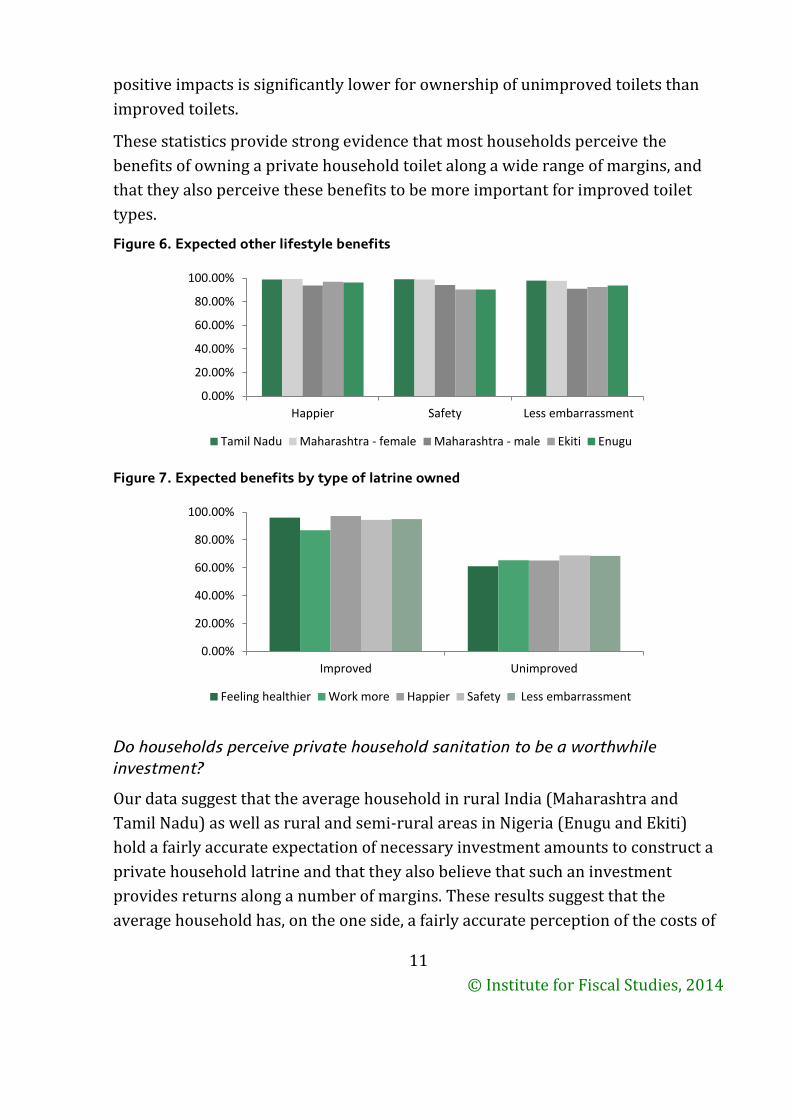
positive impacts is significantly lower for ownership of unimproved toilets than
improved toilets.
These statistics provide strong evidence that most households perceive the
benefits of owning a private household toilet along a wide range of margins, and
that they also perceive these benefits to be more important for improved toilet
types.
Figure 6. Expected other lifestyle benefits
Figure 7. Expected benefits by type of latrine owned
Do households perceive private household sanitation to be a worthwhile
investment?
Our data suggest that the average household in rural India (Maharashtra and
Tamil Nadu) as well as rural and semi-rural areas in Nigeria (Enugu and Ekiti)
hold a fairly accurate expectation of necessary investment amounts to construct a
private household latrine and that they also believe that such an investment
provides returns along a number of margins. These results suggest that the
average household has, on the one side, a fairly accurate perception of the costs of
0.00%
20.00%
40.00%
60.00%
80.00%
100.00%
Happier Safety Less embarrassment
Tamil Nadu Maharashtra - female Maharashtra - male Ekiti Enugu
0.00%
20.00%
40.00%
60.00%
80.00%
100.00%
Improved Unimproved
Feeling healthier Work more Happier Safety Less embarrassment
© Institute for Fiscal Studies, 2014
12
toilet construction and, on the other, a clear knowledge of the wide range of
private benefits that toilet ownership carries. However, the conversion of these
benefits into monetary gains (or savings) is a challenging exercise, and the cost–
benefit calculation remains of unclear sign.
The overwhelming agreement by households on the gains from toilet construction
seems to suggest, though, that their beliefs are in line with the general view that
sanitation is a worthwhile (private) investment. The observed non-uptake of
sanitation by a large part of the population in these two countries, must therefore
be – at least partly – driven by liquidity constraints.
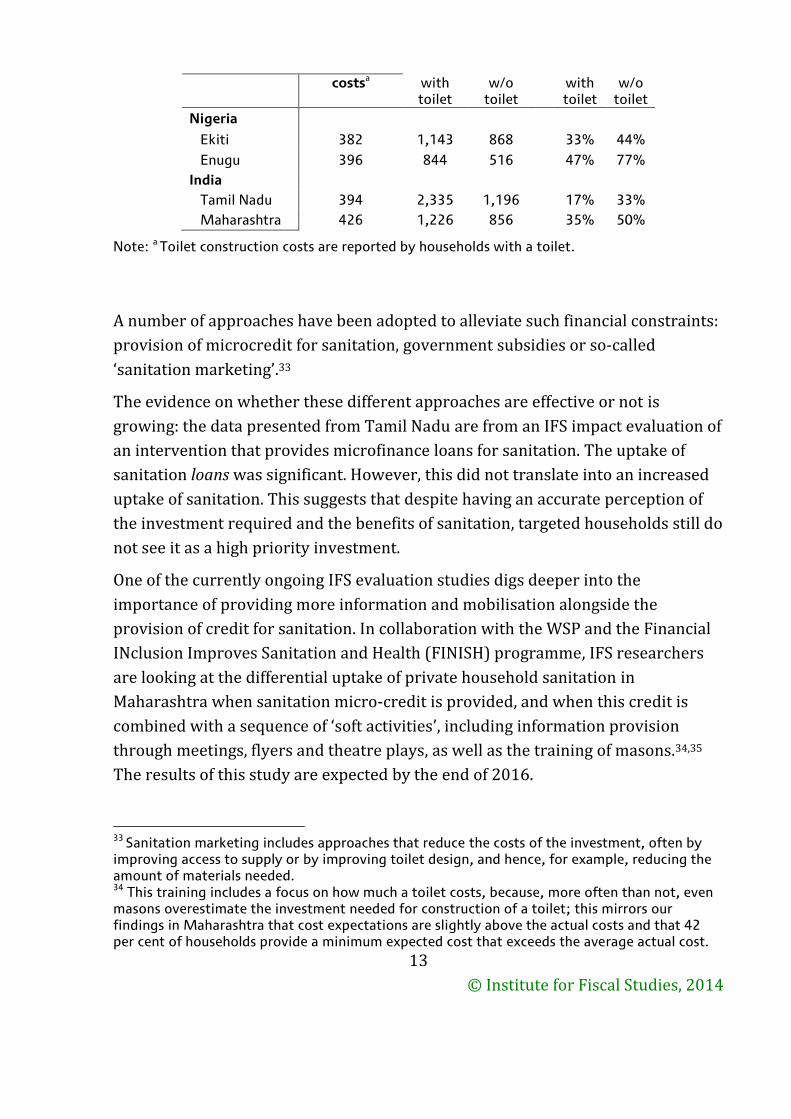
This should not come as a surprise when considering how substantial this
investment is for a poor household. By relating the reported expenditures for
latrine construction to annual average household income, we show that the
average household in these study areas had to invest between 17 and 47 per cent
of their annual household income for the construction of a private latrine (see
Table 1). Households that do not own a toilet are, on average, poorer than those
with a toilet. They would have to invest between 33 per cent (Tamil Nadu) and 77
per cent (Enugu) of their annual household income to construct a toilet of the kind
typical in their area.32 Not only is this a substantial investment amount, the means
of raising it are also limited: 92 per cent of households in Maharashtra, for
example, report that they financed their toilets with savings or transfers from
family and friends, whereas 62 per cent of those without a toilet report that they
are not able to save the required amount and most are not aware of any institution
that would provide credit for such an investment.
What does this imply for the design of sanitation interventions?
The presented statistics provide compelling evidence that liquidity constraints for
private latrine investments are a binding and substantial constraint to sanitation
uptake. Any sanitation intervention that aims to increase household sanitation
coverage needs to address these financial barriers.
Table 1. Toilet construction costs and household income (USD)
Country and state
Toilet construction
Average annual HH income
Cost/income
32 In line, 59 per cent (64 per cent) of female (male) respondents in Maharashtra state that all community members struggle to fund the construction of a toilet, and 88 per cent (91 per cent) state that only the poor do so.
© Institute for Fiscal Studies, 2014
13
costsa with toilet
w/o toilet
with toilet
w/o toilet
Nigeria
Ekiti 382 1,143 868 33% 44%
Enugu 396 844 516 47% 77%
India
Tamil Nadu 394 2,335 1,196 17% 33%
Maharashtra 426 1,226 856 35% 50%
Note: a Toilet construction costs are reported by households with a toilet.
A number of approaches have been adopted to alleviate such financial constraints:
provision of microcredit for sanitation, government subsidies or so-called
‘sanitation marketing’.33
The evidence on whether these different approaches are effective or not is
growing: the data presented from Tamil Nadu are from an IFS impact evaluation of
an intervention that provides microfinance loans for sanitation. The uptake of
sanitation loans was significant. However, this did not translate into an increased
uptake of sanitation. This suggests that despite having an accurate perception of
the investment required and the benefits of sanitation, targeted households still do
not see it as a high priority investment.
One of the currently ongoing IFS evaluation studies digs deeper into the
importance of providing more information and mobilisation alongside the
provision of credit for sanitation. In collaboration with the WSP and the Financial
INclusion Improves Sanitation and Health (FINISH) programme, IFS researchers
are looking at the differential uptake of private household sanitation in
Maharashtra when sanitation micro-credit is provided, and when this credit is
combined with a sequence of ‘soft activities’, including information provision
through meetings, flyers and theatre plays, as well as the training of masons.34,35
The results of this study are expected by the end of 2016.
33 Sanitation marketing includes approaches that reduce the costs of the investment, often by improving access to supply or by improving toilet design, and hence, for example, reducing the amount of materials needed. 34 This training includes a focus on how much a toilet costs, because, more often than not, even masons overestimate the investment needed for construction of a toilet; this mirrors our findings in Maharashtra that cost expectations are slightly above the actual costs and that 42 per cent of households provide a minimum expected cost that exceeds the average actual cost.
© Institute for Fiscal Studies, 2014
14
The available evidence to date suggests that the provision of subsidies seems to be
an effective approach for toilet uptake. Gertler et al. (2015)36 show that an
intervention by the Government of India in Maharashtra, which provided subsidies
for poor households in combination with community mobilisation activities,
increased sanitation uptake by 23.8 percentage points. This is complemented by
the finding from an unrelated study by Hammer and Spears (2013),37
implemented in the same state and analysing the same intervention, that the
additional impact of community mobilisation on sanitation uptake is around 8.2
percentage points. Of similar magnitude are recent findings by Guiteras et al.
(2015),38 which show that a pure subsidy provision programme in Bangladesh
increased sanitation uptake by 14 percentage points.
However, there is evidence to suggest that subsidies are not the most effective way
of increasing toilet usage: 13.42 per cent of interviewed households in Tamil Nadu
reportedly received subsidies for the construction of a toilet but we find that these
households are significantly more likely to have a household member openly
defecating despite owning the toilet.39
Instead of providing credit or subsidies, the third approach, which has an element
of reducing costs and which has received a lot of attention in recent years, is that
of sanitation marketing. This is a market-based approach, addressing both demand
and supply of sanitation. The idea behind this approach is that stimulating both
demand and supply allows households to afford a toilet or to upgrade their
existing facilities, and also assures providers that their products will find
customers.
The IFS, in collaboration with WaterAid, is currently undertaking research on such
an approach in Enugu and Ekiti, Nigeria. In addition to the sanitation marketing
demand creation component, a more intense community mobilisation
35
The programme implemented in Tamil Nadu had a small awareness creation component, which was, however, not very intense. 36 P. Gertler, M. Shah, M. L. Alzua, L. Cameron, S. Martinez and S. Patil, ‘How does health promotion work? Evidence from the dirty business of eliminating open defecation’, NBER Working Paper no. 20997, 2015. 37 J. Hammer and D. Spears, ‘Village sanitation and children's human capital : evidence from a randomized experiment by the Maharashtra government’, Policy Research Working Paper 6580, The World Bank Sustainable Development Network Water and Sanitation Program, 2013. 38 R. Guiteras, J. Levinsohn and A. M. Mobarak, ‘Encouraging sanitation investment in the developing world: a cluster-randomized trial’, Science 348 (6237), 903–906, 2015. 39 Further evidence is provided that this difference in usage rates is not exclusively driven by the fact that households which received subsidies are poorer and thus less likely to use the toilet.
© Institute for Fiscal Studies, 2014
15
(Community-Led Total Sanitation) is part of the study. Additional findings by
Guiteras et al. (2015) suggest that such a combined approach is crucial. They find
that the implementation of a pure supply-side intervention (as well as a pure
community motivation intervention) was not successful in increasing sanitation
uptake.
The results of these studies will contribute to our understanding of which
interventions are effective at persuading households to invest in private
sanitation. However, each of these typically targets only one part of the
population: subsidies are more often than not targeted at the (very) poor, and
micro-finance targets households that are able to repay a loan (i.e. the not-so-
poor). Only sanitation marketing has a wider audience; however, it is an audience
that might remain liquidity constrained and hence be unable to take up sanitation.
It is important to be aware of such implicit targeting and remaining constraints,
especially when the overall aim is to fully eliminate OD.