the conversation index: volume 2
DESCRIPTION
Today, social gives consumers a direct link to brands. And brands recognize the huge responsibility that comes with thisalways-on, first-person input. As consumers convey exactly what they need and want, brands that take action will catapultbeyond loyalty to real advocacy.Social provides a window into your real-world customers. The data comes fast and furious, and capturing, analyzing – and,most important, acting on – these insights drives true, customer-centric change across companies, and even entire industries.The Conversation Index takes 5.8 million data points – real input from consumers directly to our clients – and uncovers trends thathelp you get and stay ahead of what consumers really want.TRANSCRIPT

The Conversation IndexVolume 2

The Conversation IndexVolume 2
#Q3index www.TheConversationIndex.com

Social data: The new currency Consumers have always had opinions, recommendations, and input.
Today, social gives consumers a direct link to brands. And brands recognize the huge responsibility that comes with this always-on, first-person input. As consumers convey exactly what they need and want, brands that take action will catapult beyond loyalty to real advocacy.
Social provides a window into your real-world customers. The data comes fast and furious, and capturing, analyzing – and, most important, acting on – these insights drives true, customer-centric change across companies, and even entire industries.
The Conversation Index takes 5.8 million data points – real input from consumers directly to our clients – and uncovers trends that help you get and stay ahead of what consumers really want.
We look beyond the data to the people behind it. We shine a light on what they’re telling one another. And how it matters to your brand.
Read on. And stay tuned. We update this Index every quarter with insights directly from consumers, turning their conversations into business-building actions for you.
Best,
Erin Nelson (@erinclaire) Chief Marketing Officer, Bazaarvoice

Table of ContentsSocial data: The new currency ............................................................................................ 5
Consumer input: Table stakes ............................................................................................. 8
Fully mobile: Browsing’s just the beginning .......................................................................... 11
Long-term financial customers less satisfied, more vocal .......................................................... 14
Older consumers are not keeping quiet ................................................................................ 16
Newer customers want “easy” Long-time customers want “courteous” ...................................... 19
The net-net: Financial services customers want to help ........................................................... 21
Shipping problems sink product ratings ............................................................................... 23
Consumer feedback follows a predictable, informative lifecycle ............................................... 24
Social data: Window into real-world consumers ..................................................................... 26
The methodology behind The Conversation Index ................................................................. 27
Want more? ...................................................................................................................... 28
Contact us........................................................................................................................ 29
About Bazaarvoice ........................................................................................................... 31
8
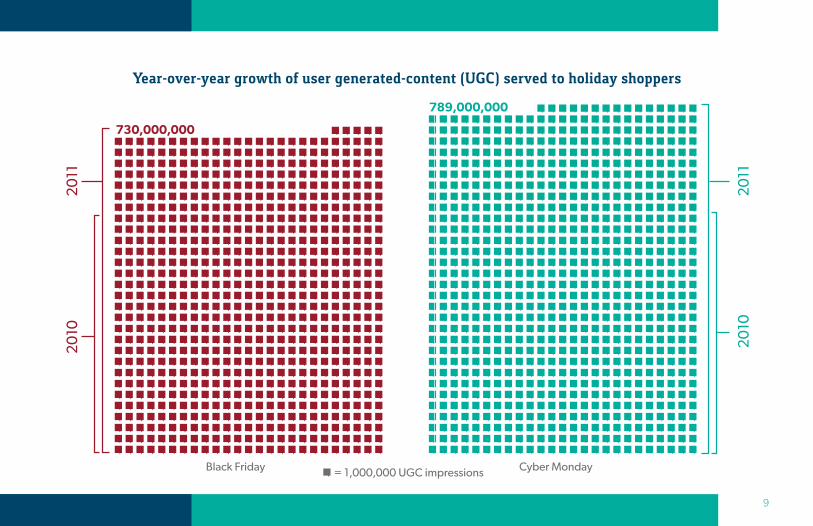
Consumer input: Table stakes It’s no surprise that consumers demand user-generated content – first-person opinions and insights from other consumers like them. And use of user-generated content for holiday shopping continues to gain momentum.
On Black Friday 2011, consumers were served nearly 730 million impressions of user-generated content on Bazaarvoice client sites, a 39% increase over 2010 numbers. And Cyber Monday served up nearly 789 million impressions of user-generated content, a 42% jump from Cyber Monday 2010.
But if you’re not in retail, do these trends mean anything to you? Absolutely. Even when making business-related purchases or service decisions, consumers turn to trusted input from others like themselves.
Take charge: What’s your business’ equivalent to Black Friday? Start now to garner consumer input to prepare for your big selling season. Then use these trusted insights to fuel decisions everywhere your consumers buy: online, via social, on mobile devices, and in stores.
And understand that consumer conversations about your brand and products are happening, with or without you. Put these conversations to work for you, to build trust with consumers and get first-person insights that can build brand advocacy.
Blog: Data: the humble hero of Black Friday and Cyber Monday - www.bv-url.com/7g9h
9
Year-over-year growth of user generated-content (UGC) served to holiday shoppers
Black Friday Cyber Monday= 1,000,000 UGC impressions
10
Ap
ril
Perc
enta
ge
of u
sag
e b
y d
evic
e
May
June July
Aug
ust
Sep
tem
ber
Other
AppleiPhone™
AppleiPad™
Android™9%
24% 24%
17%19%
17%
12%
30%
37%
43%
40%
50%
54%
37%
34%
36%
34%
27%29%
5% 4%
7%6%
5%
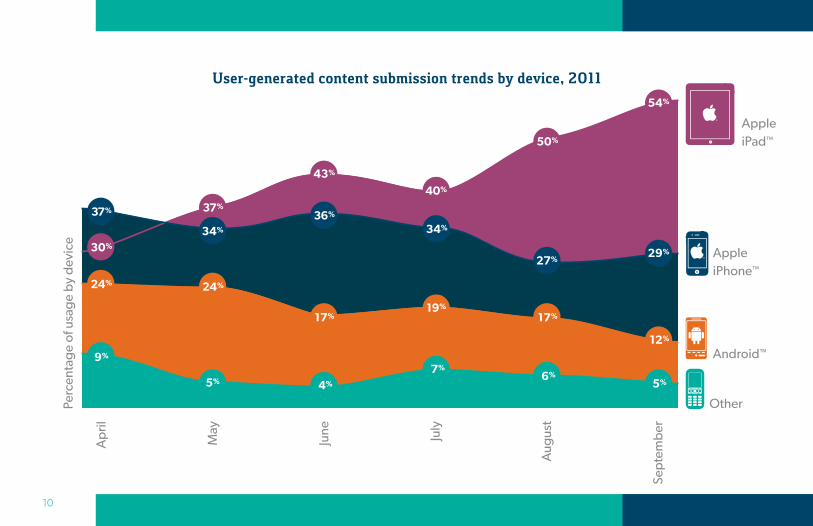
User-generated content submission trends by device, 2011
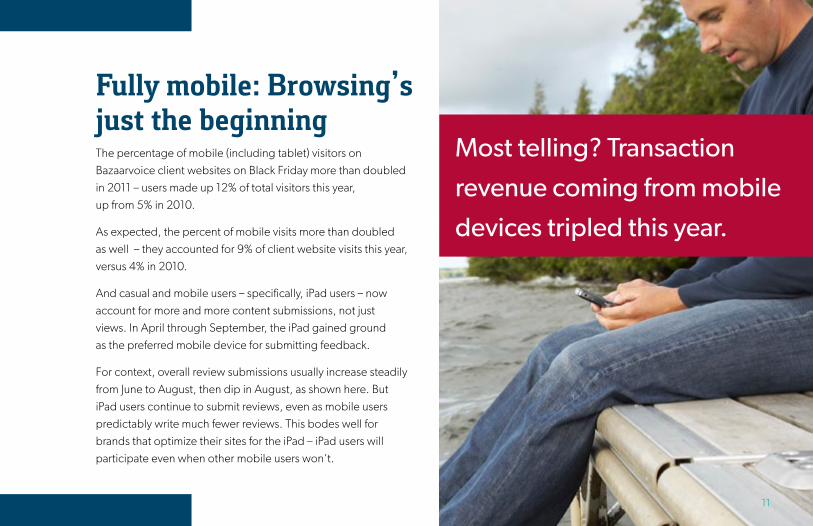
Fully mobile: Browsing’s just the beginning The percentage of mobile (including tablet) visitors on Bazaarvoice client websites on Black Friday more than doubled in 2011 – users made up 12% of total visitors this year, up from 5% in 2010.
As expected, the percent of mobile visits more than doubled as well – they accounted for 9% of client website visits this year, versus 4% in 2010.
And casual and mobile users – specifically, iPad users – now account for more and more content submissions, not just views. In April through September, the iPad gained ground as the preferred mobile device for submitting feedback.
For context, overall review submissions usually increase steadily from June to August, then dip in August, as shown here. But iPad users continue to submit reviews, even as mobile users predictably write much fewer reviews. This bodes well for brands that optimize their sites for the iPad – iPad users will participate even when other mobile users won’t.
211
Most telling? Transaction
revenue coming from mobile
devices tripled this year.
Most telling? Transaction revenue coming from mobile devices tripled this year (around 2% in 2010 to around 6% in 2011), evidence that shoppers are using mobile for more than just browsing or bookmarking to buy later.
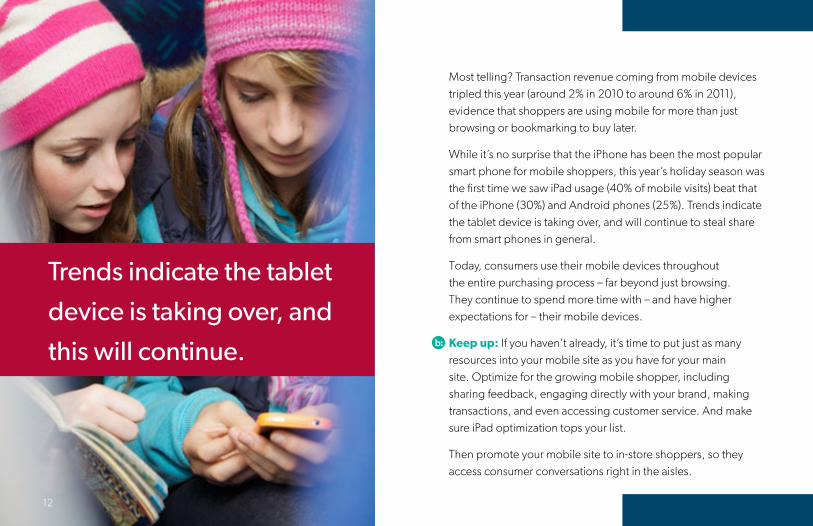
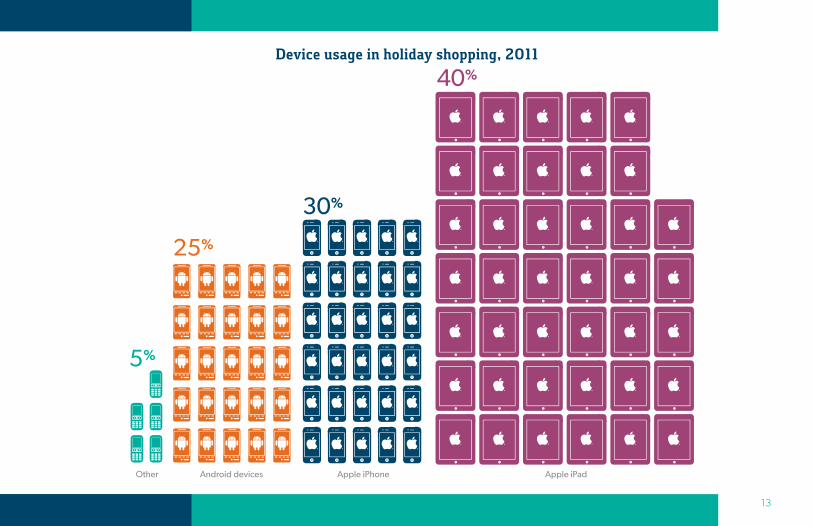
While it’s no surprise that the iPhone has been the most popular smart phone for mobile shoppers, this year’s holiday season was the first time we saw iPad usage (40% of mobile visits) beat that of the iPhone (30%) and Android phones (25%). Trends indicate the tablet device is taking over, and will continue to steal share from smart phones in general.
Today, consumers use their mobile devices throughout the entire purchasing process – far beyond just browsing. They continue to spend more time with – and have higher expectations for – their mobile devices.
Keep up: If you haven’t already, it’s time to put just as many resources into your mobile site as you have for your main site. Optimize for the growing mobile shopper, including sharing feedback, engaging directly with your brand, making transactions, and even accessing customer service. And make sure iPad optimization tops your list.
Then promote your mobile site to in-store shoppers, so they access consumer conversations right in the aisles.
12
Trends indicate the tablet
device is taking over, and
this will continue.
13
40%
30%
25%
5%
Other Android devices Apple iPhone Apple iPad
Device usage in holiday shopping, 2011
Long-term financial customers less satisfied, more vocalWhen asking for customer input online, financial services firms – including insurance, banks, credit card companies, and credit unions – also ask “How long have you been a customer or member?”
Turns out, customers for 20+ years rate financial products less favorably than new customers. Those who have been customers for less than a year rate products 8% more positively, on average, than these long-tenured clients.
But all is not lost: 77% of long-term customers say they would recommend their financial firms to others – they’re the second largest segment of promoters for these types of firms.
Plus, these customers contribute more content than any other group – they create 32% of total product reviews.
These long-term customers get detailed: Contributors who have been customers for 10+ years write about 30% more content than first-year customers. The longer submissions may indicate that they consider the financial firm a partner, and want to help improve products and services.
Pay attention: While it stands to reason that longer-term clients have more interactions and therefore more opportunities for disappointment, long-term relationships are key – obviously it’s cheaper to keep a client than to find a new one. These long-term customers have a lot to say, so listen up – and take action.
Don’t gloss over the details; this content tells you exactly what’s wrong, what’s right, and everything in between (so you don’t have to guess). When you engage with contributors, make sure to put as much into your responses as they did into their content.
14
15
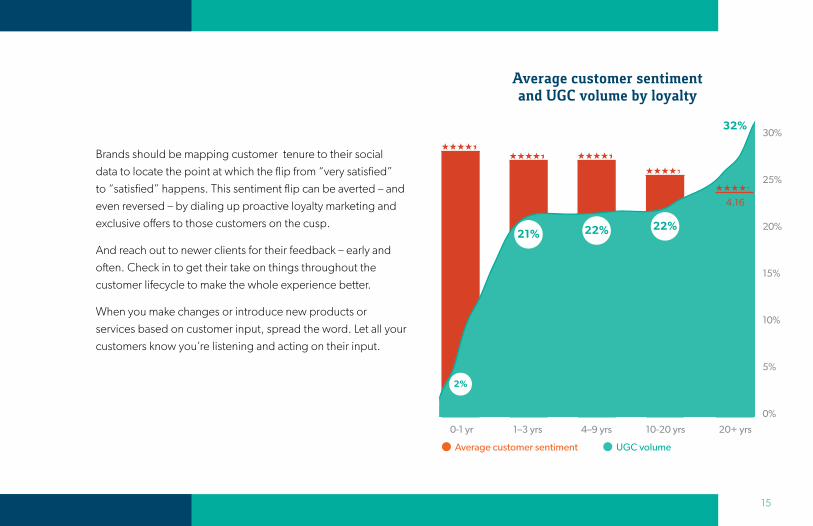
Brands should be mapping customer tenure to their social data to locate the point at which the flip from “very satisfied” to “satisfied” happens. This sentiment flip can be averted – and even reversed – by dialing up proactive loyalty marketing and exclusive offers to those customers on the cusp.
And reach out to newer clients for their feedback – early and often. Check in to get their take on things throughout the customer lifecycle to make the whole experience better.
When you make changes or introduce new products or services based on customer input, spread the word. Let all your customers know you’re listening and acting on their input.
Average customer sentiment UGC volume
0-1 yr
4.484.44 4.44
1–3 yrs 4–9 yrs 10-20 yrs 20+ yrs
4.29
30%
25%
20%
15%
10%
5%
0%
32%
4.16
22%21%22%
2%
Average customer sentiment and UGC volume by loyalty
16
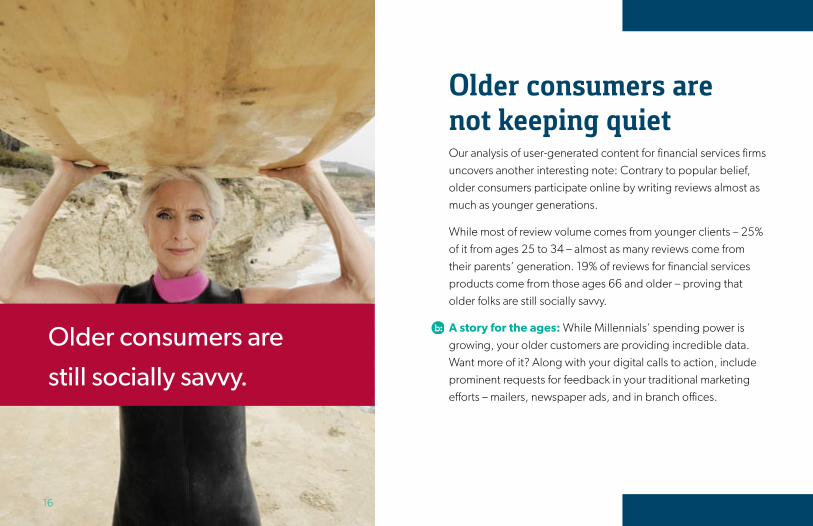
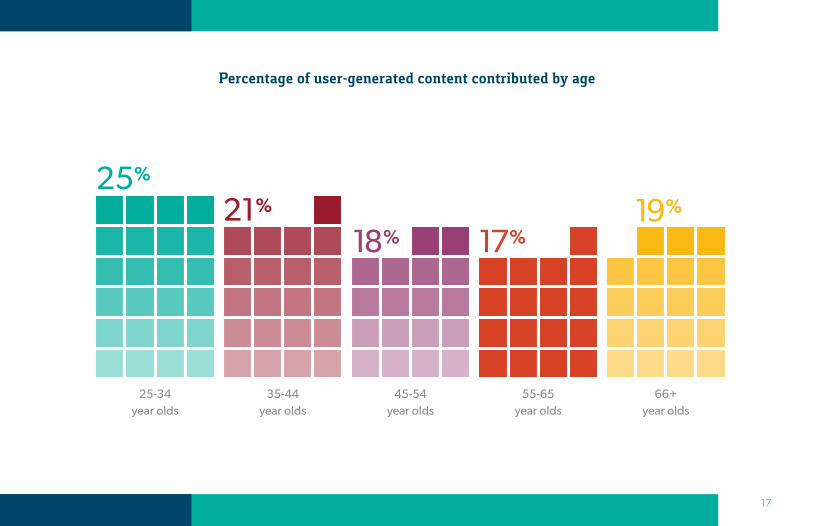
Older consumers are not keeping quietOur analysis of user-generated content for financial services firms uncovers another interesting note: Contrary to popular belief, older consumers participate online by writing reviews almost as much as younger generations.
While most of review volume comes from younger clients – 25% of it from ages 25 to 34 – almost as many reviews come from their parents’ generation. 19% of reviews for financial services products come from those ages 66 and older – proving that older folks are still socially savvy.
A story for the ages: While Millennials’ spending power is growing, your older customers are providing incredible data. Want more of it? Along with your digital calls to action, include prominent requests for feedback in your traditional marketing efforts – mailers, newspaper ads, and in branch offices.
Older consumers are
still socially savvy.
17
25-34year olds
35-44year olds
45-54year olds
55-65year olds
66+year olds
17%
19%
24%
18%19%
17%21%
25%
Percentage of user-generated content contributed by age

convenient simple
easygreat
quick
happy
experience awesome
courteous
friendly
helpful
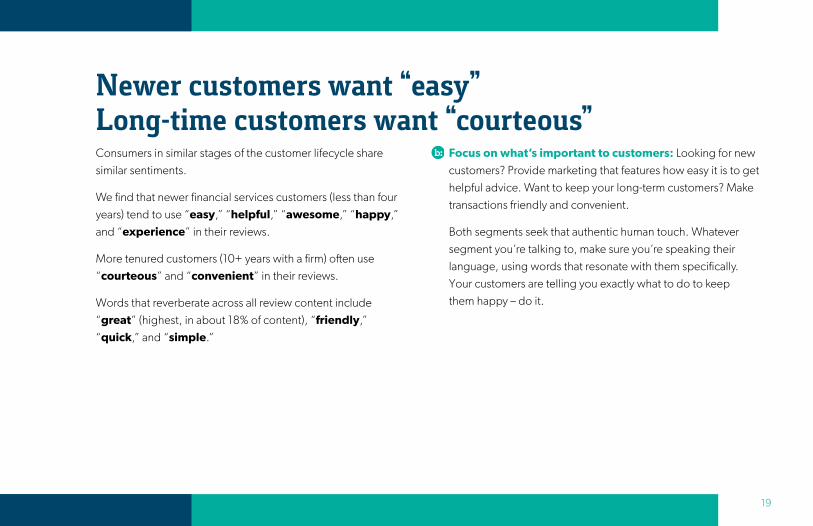
Newer customers want “easy” Long-time customers want “courteous”Consumers in similar stages of the customer lifecycle share similar sentiments.
We find that newer financial services customers (less than four years) tend to use “easy,” “helpful,” “awesome,” “happy,” and “experience” in their reviews.
More tenured customers (10+ years with a firm) often use “courteous” and “convenient” in their reviews.
Words that reverberate across all review content include “great” (highest, in about 18% of content), “friendly,” “quick,” and “simple.”
Focus on what’s important to customers: Looking for new customers? Provide marketing that features how easy it is to get helpful advice. Want to keep your long-term customers? Make transactions friendly and convenient.
Both segments seek that authentic human touch. Whatever segment you’re talking to, make sure you’re speaking their language, using words that resonate with them specifically. Your customers are telling you exactly what to do to keep them happy – do it.
19

These customers want companies to acknowledge
their issues, act on them to let them know their
feedback is heard and important.
20
The net-net: Financial services customers want to help It’s notoriously difficult to switch vendors for anything financial, whether it’s homeowner’s insurance or a banking institution. Once a customer chooses, they often stay for a long, long time.
These customers want companies to acknowledge their issues and act on them to let them know their feedback is heard and important.
The bottom line? Take care of these customers – don’t take them for granted. Their opinions will tell you exactly how to find more loyal, long-term customers like them.
Use their words in marketing, let their opinions fuel future products. Financial woes of years past have eroded some consumers’ trust of financial institutions – enabling them to see and share first-person opinions helps build authenticity and trust for your financial brand.
Blog: How banks can place people at the center of the online experience - www.bv-url.com/edk4 21
22
4.0
3.0
2.0
Average rating
Percentage of mentions of shipping, by industry
All industries
Retail Manufacturing Apparel &accessories
Consumerelectronics
Homeimprovement
Housewares Massmerchant
Sportinggoods
4.5
3.5
2.5
Average shipping issue rating
2.5%
1.6%1.6% 1.6%
0.7%
2.0%
1.5%1.6%
0.8%
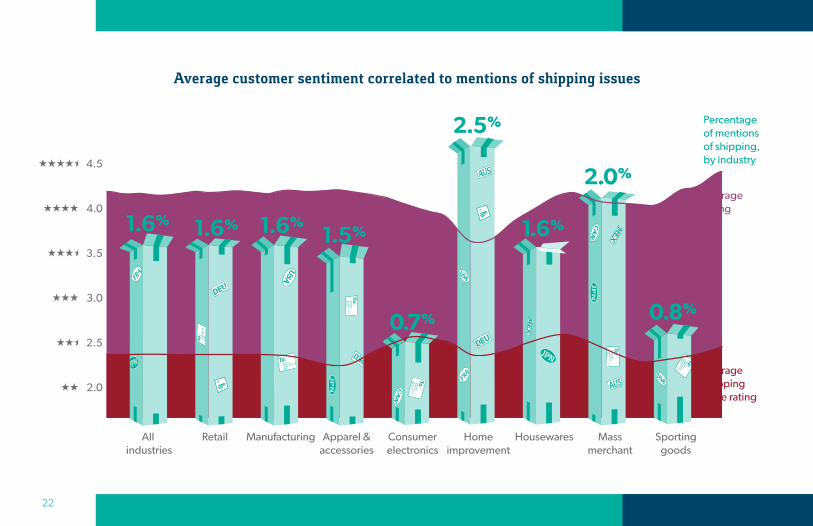
Average customer sentiment correlated to mentions of shipping issues
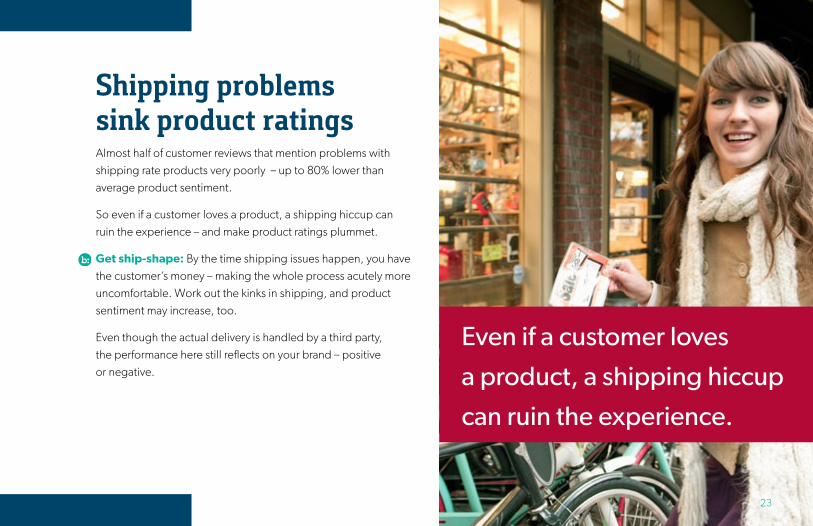
Shipping problems sink product ratings Almost half of customer reviews that mention problems with shipping rate products very poorly – up to 80% lower than average product sentiment.
So even if a customer loves a product, a shipping hiccup can ruin the experience – and make product ratings plummet.
Get ship-shape: By the time shipping issues happen, you have the customer’s money – making the whole process acutely more uncomfortable. Work out the kinks in shipping, and product sentiment may increase, too.
Even though the actual delivery is handled by a third party, the performance here still reflects on your brand – positive or negative.
23
Even if a customer loves
a product, a shipping hiccup
can ruin the experience.
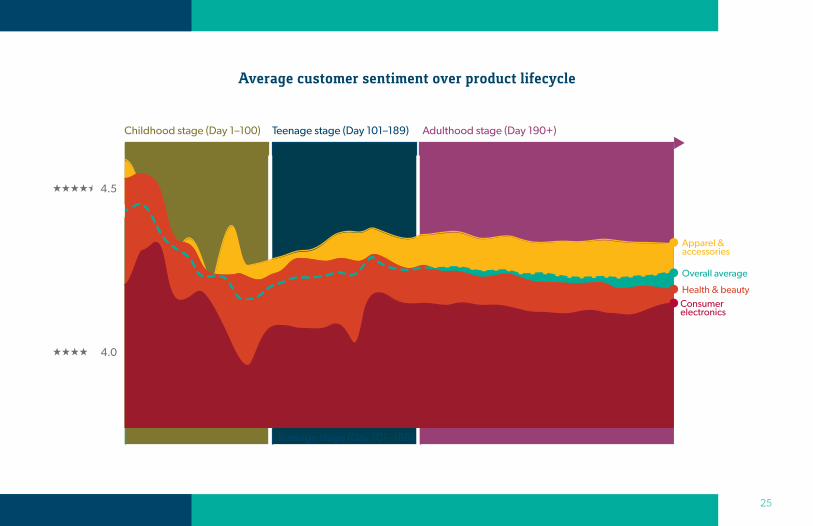
Consumer feedback follows a predictable, informative lifecycleWhen consumer feedback starts rolling in on a new product, there’s a clear lifecycle trend for this consumer sentiment. Understanding these cycles helps you make the most of user-generated content.
The first 100 days of reviews can be characterized as the Childhood stage. There’s heavy growth in review volume, and the input can consist of extreme high and low ratings. Don’t overreact to this volatility; it’s actually healthy. The negative feedback allows you to mitigate potential problems early on, while the positive comments help hone your marketing and advertising messages.
The next 100 to 190 days generally see fairly steady growth in review volume, and usually just a few bumps – up or down – in average product sentiment. We call this the Teenage stage, where the average rating starts to become more stable.
From 190 days on, consider this the Adulthood phase of the review lifecycle. Review submissions plateau naturally, so overall volume grows more slowly, and the average rating for the product is usually set at this point. If you’ve made product improvements based on early feedback, you’ll likely see the payoff in more positive sentiment here.
Ride the cycle: Ask for consumer opinions early and often. The earlier you get consumer feedback – including Q&A, opinions, and first-person experiences – the better the data. Jump-start these conversations by making it easy for consumers to contribute, to get feedback that helps improve products and marketing.
Pull consumer feedback into product lifecycle planning. Early consumer feedback helps iron out potential product problems, while later insights reflect how consumers feel about the product once they have owned it a few months. The product team should pull consumer sentiment reports at regular intervals to gauge satisfaction at every phase of the product cycle, and plan for future product iterations. And if you improve or change a product along the way, authentic, first-person feedback can show what consumers think about the change – first hand.
24 Blog: Three reasons most companies aren’t getting full value from social data - www.bv--url.com/cw9m
25
4.0
4.5
Childhood stage (Day 1–100) Teenage stage (Day 101–189) Adulthood stage (Day 190+)
Childhood stage (Day 1–100) Teenage stage (Day 101–189) Adulthood stage (Day 190+)
Apparel &accessories
Health & beauty
Overall average
Consumer electronics
Average customer sentiment over product lifecycle
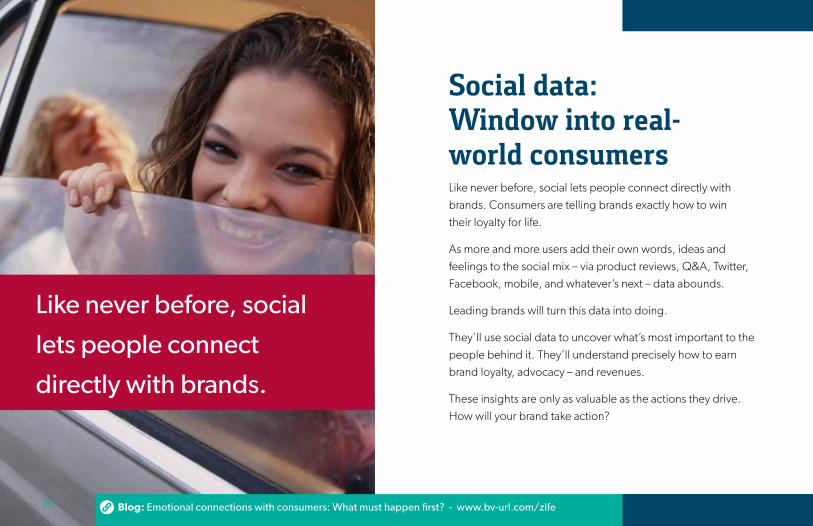
Social data: Window into real- world consumersLike never before, social lets people connect directly with brands. Consumers are telling brands exactly how to win their loyalty for life.
As more and more users add their own words, ideas and feelings to the social mix – via product reviews, Q&A, Twitter, Facebook, mobile, and whatever’s next – data abounds.
Leading brands will turn this data into doing.
They’ll use social data to uncover what’s most important to the people behind it. They’ll understand precisely how to earn brand loyalty, advocacy – and revenues.
These insights are only as valuable as the actions they drive. How will your brand take action?
26
Like never before, social
lets people connect
directly with brands.
Blog: Emotional connections with consumers: What must happen first? - www.bv-url.com/zlfe
The methodology behind The Conversation IndexBazaarvoice powers online consumer and brand conversations on hundreds of our clients’ sites, including some of the world’s largest brands. We have served more than 260 billion impressions of user-generated content – including first-person consumer opinions, feedback, experiences, and Q&A. From this massive pool of social data, our in-house analyst team – which specializes in turning data into insights – has extracted select groundbreaking findings, featured in this report.
We based our findings on a sampling of 5.8 million pieces of user-generated content indexed during Q3 2011 – July through September, plus year-over-year analysis in some cases. These data points came from consumers in 210 countries around the world.
27
Want more?This paper should provoke action, to encourage you to dig deep into what your customers really want. And they will tell you.
Bazaarvoice enables the world’s biggest brands to capture, analyze, and most importantly, act upon social data – to drive true, customer-centric change.
Bazaarvoice helps clients replace guesswork with precise, always-on insight about their products, services, and customers. The result? Our clients create products that customers crave, provide service based on what customers want, deliver targeted marketing messages that get real attention, and therefore enjoy a distinct competitive advantage. All because brands listen and act on what matters to the people who matter the most.
Bazaarvoice turns data into doing.
28
Contact usThis paper should raise just as many questions as it answers. Contact us at bazaarvoice.com to see how we help brands gain invaluable consumer and product insights by enabling conversations.
United States: (866) 522-9227
United Kingdom: +44 (0) 208.080.1100
France: +33 1 56 60 54 45
Germany: +49.89.24218508
Netherlands +31.20.301.2169
Australia / Asia-Pacific: +61.2.9362.2200
Sweden: +46.8.463.1083
29

30
31
About Bazaarvoice Bazaarvoice’s Software as a Service (SaaS) solutions have powered more than 260 billion customer conversations on brand web sites like Best Buy, Blue Shield of California, Costco, Dell, Macy’s, P&G, Panasonic, QVC, and USAA. The company connects organizations to their influencers through a unique network that reaches hundreds of millions of consumers around the globe, enabling authentic customer-powered marketing. Through syndication, analytics, partnerships, and consulting, Bazaarvoice brings the voice of the customer to the center of their clients’ business strategy, proving “social” can drive measured revenue growth and cost savings for manufacturing, retail, travel, and financial services companies. Headquartered in Austin, the company has offices in Amsterdam, London, Munich, Paris, Stockholm, and Sydney. For more information and access to client success stories, visit www.bazaarvoice.com, read the blog at www.bazaarvoice.com/blog, and follow on Twitter at www.twitter.com/bazaarvoice.
31