the contribution of agriculture to sustainable development in jamaica
TRANSCRIPT

THE CONTRIBUTION OF AGRICULTURE TO SUSTAINABLE DEVELOPMENT IN JAMAICA
Joaquín Arias Segura1
1 Joaquín Arias is an Economist and Regional Specialist in the Trade and Policies Program for the Andean Region of the Inter-American Institute for Cooperation on Agriculture (IICA). The support received from Dr. Derrick Deslandes, Director of the Centre of Excellence in the Ministry of Agriculture & Fisheries in the preparation and finalization of the document is greatly appreciated. The statistical data and help provided by Moreland Wilson, research assistant to Dr. Deslandes, was essential for the realization of the study. Diane Francis, IICA’s Regional Policy and Trade Specialist in the Caribbean an Region, made invaluable technical comments to this report.

© Inter-American Institute for Cooperation on Agriculture (IICA). 2010
IICA encourages the fair use of this document. Proper citation is requested.
This publication is also available in electronic (PDF) format from IICA’s Web site at http:www.iica.int.
Editorial coordination: Joaquín Arias Segura Mechanical editing: Paul MurphyLayout: Zona CreativaCover design: Zona CreativaPrinted: IICA Headquarters
San José, Costa Rica 2010
Arias Segura, Joaquín The contribution of agriculture to sustainable development
in Jamaica / IICA – San José, C.R.: IICA, 2010. 36 p.; 15.2 x 22.8 cm.
ISBN13: 978-92-9248-284-8
1. Agriculture 2. Sustainability 3. Rural development 4. Economic development 5. Economic growth 6. Jamaica I. IICA II. Título
AGRIS DEWEY E14 338.9

3The Contribution Of Agriculture To Sustainable Development In Jamaica
Dr. the Honourable Christopher Tufton Minister of Agriculture & Fisheries
Foreword
The last decade has seen agriculture re-emerging on top of the national agenda. Historically, agriculture has been recognised as being important to reducing poverty and promoting rural development. However, there is growing recognition that the effects of agricultural policies and programs go beyond the direct benefit to rural livelihoods. The sector has strong linkages with the rest of the economy, and this is one of the most powerful ways in which it aids economic growth and supports nation building. When agriculture grows, so does the economy in general, speeding up the reduction of rural and urban poverty.
This paper shows that the contribution of agriculture to GDP is, in fact, underreported. It outlines an alternative approach to assessing the sector’s performance and introduces the concept of expanded agriculture, which seeks to highlight agriculture’s linkages with the wider economy. This expanded concept of agriculture concept provides a general framework which policy makers can use to effect change in different areas of the economy.
By providing this alternative view of agriculture’s contribution to GDP, this paper goes a far way in helping policy makers to improve the effectiveness of development assistance to agriculture, and investors to have a better idea of potential yields on their investments.


5The Contribution Of Agriculture To Sustainable Development In Jamaica
Executive Summary
The purpose of this study is to provide a more accurate measure of the true contribution of agriculture to Jamaica’s economic development. It addresses three specific and critical issues: Firstly, it introduces, explains and applies the concept of “expanded agriculture”. Secondly, it calculates backward and forward linkages between the agricultural sector and other important sectors of the economy. Thirdly, based on an expanded conception of the agricultural sector, it explores the real impact of agriculture on the country’s overall economic activity and its potential to affect overall economic growth. The traditional approach also excludes backward linkages, the extent to which agriculture contributes to economic growth by absorbing inputs from other local or domestic sectors such as manufacturing or trade services.
The paper shows that conventional measurement of growth in agriculture does not reflect changes in income, but changes in physical volumes of output only. In 2001, while agriculture’s growth was reported as 6.3% over the previous year, factor income declined by -0.5%. The situation in 2005 was just the opposite; while primary agriculture declined by -8.1%, agricultural factor income grew by 5.1%. Determining agriculture’s linkages on the basis of the generation and use of income is equally important in measuring its true contribution to economic development. This study shows that intermediate procurement represents 29% of the costs incurred by the primary agricultural sector. The Processed Food, Agro-industry and the Hotels and Restaurants sectors are those with the strongest backward linkages to the primary agricultural sector. Every increase of one dollar in production in the Processed Food sector results in a demand for 11.5 cents worth of agricultural inputs. Every increase of one dollar in production in the Agro-industry sector results in a demand for 15.2 cents worth of agricultural inputs. Every increase of one dollar in production in the Hotel and Restaurants sector results in a demand for 10 cents worth of agricultural inputs.

6
Linkages with the Tourism Sector
Tourist demand for local foods may hold great potential for creating and strengthening linkages between agriculture and tourism. There are already important backward linkages between the Hotels and Restaurants sector and the Primary Agriculture and Processed Food sectors. Of total tourism output, 18.2% is intermediate inputs from the processing Food sector, and 9.6% is intermediate inputs from the Primary Sector. A second level of linkages arises from the fact that inputs from the Primary Agricultural sector represent 11.5% of total output in the Processed Food sector, which is then demanded as inputs by the Hotels and Restaurants sector.
Similarly, the forward linkages of Primary Agriculture and the Processed Food industry are important to the Hotels and Restaurants sector. Hotels and Restaurants absorb an estimated 8.8% and 11.9% of the total output from Primary Agriculture and the Processed Food sector, respectively. At the same time, for every one dollar of Primary Agriculture production, 16 cents is sold to the Processed Food sector, which, in turn, supplies 12 cents of its total output to hotels and restaurants.
The production of tropical fruits and vegetables offers significant potential for establishing direct linkages between local agriculture and tourism in Jamaica. Statistical tests provide evidence of dynamic backward and forward linkages between agriculture and the other sectors of the economy. In examining the long-run backward elasticities from 1966 to 1996, a 1% increase in GDP of the rest of the economy (excluding primary agriculture) had a long-run positive impact on the agricultural sector of 0.95%. However, when data for the period 1997-2007 were added to the sample, the backward relationship becomes negative and statistically significant. This could mean that the rest of the economy (which does not include agriculture) grew at the expense of agriculture, or that resources had actually been withdrawn from agriculture and shifted to other economic sectors. At the very least it means that growth in the other economic sectors is not associated with growth in agriculture, which provides evidence of the weakness in the level of linkages between agriculture and other industries.

7The Contribution Of Agriculture To Sustainable Development In Jamaica
Revealed trade comparative advantage
Productivity levels are normally reflected in the country’s trade performance. Revealed comparative advantage indexes were calculated for the agro-food trade sector for the 2004-2008 period. This paper begins by looking first at an indicator of Jamaica’s overall agricultural trade performance. During the 2004-2008 period, Jamaica imported an annual average of US $853 million of agro-food products, while it exported US $319 million. In 2008, imports into Jamaica accounted for 3.14 dollars for every dollar of exports, revealing Jamaica’s high level of dependence on imports of agro-food products. As of 2008, the share of agro-foods in total merchandise imports was 13%.
Regarding export diversification and value adding, from 2004 to 2008, only 48.7% of all tariff lines in the Agro-food sector (from a total of 874 lines) were exported, of which just 16.7% (or 71 products) showed positive revealed export advantage. In contrast, 83.3% (or 355 products) revealed export disadvantage. Most products exported are primary with little value added, which substantiates the conclusion above of limited development in value adding to primary agriculture output.
Beyond input-output linkages
Traditional methods of calculating agriculture’s contribution to GDP have been challenged because they ignore the role of agriculture in rural development, in the maintenance of the environment and bio-diversity, in poverty reduction and in food security. Agriculture has a particularly important role to play in income growth and poverty reduction. In rural areas, agriculture is an important activity which assures access to both food and a source of income. Notwithstanding the full recognition of the critical importance and increasing role of agriculture in economic development, public sector budgetary allocations and actual expenditures in the agricultural sector continue to be low and woefully inadequate. In Jamaica, an estimated 1.35% of total public expenditure is allocated to the agricultural sector. In contrast, other developing countries typically allocate, on average, between 6% and 8% of the total public budget, while in the developed/industrialized countries, the comparative allocation is between 3% and 5%.

8

9The Contribution Of Agriculture To Sustainable Development In Jamaica
THE CONTRIBUTION OF AGRICULTURE TO SUSTAINABLE DEVELOPMENT IN JAMAICA
Introduction
The purpose of this study is to provide a more accurate measure of the true contribution of agriculture to Jamaica’s economic development. It addresses three specific and critical issues: Firstly, it introduces, explains and applies the concept of “expanded agriculture”. Secondly, it calculates backward and forward linkages between the agricultural sector and other important sectors of the economy. Thirdly, based on an expanded conception of the agricultural sector, it explores the real impact of agriculture on the country’s overall economic activity and its potential to affect overall economic growth. In addressing this third issue, the study focuses on three crucial economic factors: income distribution, poverty reduction and what economists call the multiplier effects.
The study questions the appropriateness of measures of agricultural performance and impact that focus on traditional indicators such as contribution to Gross Domestic Product (GDP – which is the overall output produced by the local economy in any given year). It concludes that a more appropriate measure should be utilized if we are to accurately reflect the sector’s contribution to economic and social development.
Traditionally, the performance of agriculture (including Forestry and Fisheries) has been measured using information about actual output and the sale of raw materials (mainly volumes of fresh produce or crops harvested, livestock slaughtered and fish produced/landed). This practice, however, has led us to undervalue the sector’s contribution to the country’s economic development. This is the case because the approach fails to consider how agricultural production supports and is supported by the output of other economic sectors (like tourism and agro-industry). This is what economists call forward linkages and is an obviously important consideration for an accurate calculation of the performance of any sector. The traditional approach also excludes backward linkages: the extent to which agriculture contributes to economic growth by absorbing inputs from other local or domestic sectors (such as manufacturing or trade services). To the extent that backward and forward linkages are ignored, the additional value (value added) derived from agricultural production is not adequately reflected in the official agricultural statistics of most countries.

10
We hope this study contributes to bringing agriculture to the forefront as a strategic tool to support the country’s macro-economic goals as it attempts to move towards development.
Expanded Agricultural GDP Share
Table 1 (See expanded table in Appendix 1) illustrates the two approaches to measuring the contribution of agriculture to gross domestic product (GDP). Based on the traditional approach, the contribution of agriculture to overall output (GDP) was estimated at 6.14% between 1999 and 2003, 5.07% in 2004-2008 and 4.83% in 2008. In contrast, the expanded approach leads to an estimated contribution of 11.34%, 9.90% and 9.52% over the same time periods. In other words, the expanded approach yields an estimate of the contribution of agriculture that is close to double (on average) the contribution as measured by the traditional methods.
A notable change was observed in the structure of the agro-food sector of Jamaica between the two periods reviewed. There was an increased share of food and non-alcoholic products in agricultural output, in contrast to a reduced share of sugar and molasses and alcoholic beverages. This result is not surprising for the sugar sector, given the number of structural changes that have affected it. These include losses from hurricanes and
PRIMARY AND EXPANDED AGRICULTURAL VALUE ADDED AS A PERCENTAGE OF GDP (CONSTANT PRICES, 1999 - 2008), JAMAICA
SECTOR 1999-2003 2004-2008 2008Agriculture, Forestry & Fishing 6.14% 5.07% 4.83%Manufacture Linked to Agriculture1 5.18% 5.15% 4.69%Expanded Agriculture GDP share 11.34% 9.90% 9.52%Expanded/Primary Agricultural Share 1.85 1.95 1.97
Source: The author, based on data from the National Income and Product 2008 report by STATIN.
1 It does not include the manufacture of wood and products made of wood and cork for lack of disaggregation in the available national accounts reports; neither does it include the value added generated by the water industry.
TABLE 1:

11The Contribution Of Agriculture To Sustainable Development In Jamaica
efforts at privatization following the significant erosion of preferential access to European markets.
In comparison to the ratio of expanded to primary GDP of 1.9 for Jamaica, the results for 10 other countries in the Americas (IICA, 2005) ranged from 2.9 for Costa Rica to 11.6 for the United States (Table 2). The differences reflect a tighter and more organized relationship (linkages) between agriculture and other sectors (especially the manufacturing and processing sectors).
GROSS DOMESTIC PRODUCT AND AGRICULTURAL VALUE ADDED IN US$ THOUSAND MILLIONS AND AS A PERCENTAGE, FOR 19971
Agriculture and Agrifood
Agriculture and Agrifood
Ratio Agri-culture and
Agrifood
GDP AgGDP 2 AgGDP/GDP GDP GDP/GDP GDP/AgGDP
(1) (2) (3) (4) (5) (6=4/2)Argentina 326 14.9 4.60% 104.9 32.20% 7Brazil 789.7 34 4.30% 206.9 26.20% 6.1
Canada 631.1 11.5 1.80% 96.5 15.30% 8.4
Chile 76.1 4.3 5.60% 24.4 32.10% 5.7Colombia 94.6 7.6 8.00% 30.4 32.10% 4Mexico 388.8 17.9 4.60% 95.2 24.50% 5.3Peru 64.9 4.3 6.60% 20.6 31.80% 4.8Uruguay 19.1 1.2 6.20% 6.6 34.80% 5.6United States 7,945.2 55.4 0.70% 644.9 8.10% 11.6
Venezuela 83.7 3.4 4.00% 17.2 20.50% 5.1Costa Rica3 22 2.5 11.30% 7.2 32.50% 2.9
Source: IICA (2005). Based on data from GTAP 5.0 and the SAM of Costa Rica for 1997.
TABLE 2:
2 Includes: agriculture. forestry and fishing (chapters 01 to 04 of the CPC and 05 of the ISIC).3 Includes: primary sector plus food and manufactured goods derived from this sector (chapters 21 to 25 of the CPC and 17 to 22 of the ISIC).4 For Costa Rica, the primary sector consists of the first 9 lines of the SAM97; for agriculture and agrifood, 10 through 23 are added.

12
Agricultural Factor Income Growth
The issue of ‘under-valuation’ in agriculture is not limited to the traditional measurement of its share in GDP. ‘Growth’ estimates of agriculture also have limitations that are linked to the traditional method of national accounting (see Paz, Benavides and Arias). The conventional measurement of growth in agriculture does not reflect changes in income, but changes in the physical volumes of output only. Such growth indicators (rendered in constant prices) provide only a partial view of agriculture’s performance. It is important, therefore, to analyze the sector’s performance in terms of income generation. This is particularly important because high price inflation can lead simultaneously to an expansion in agricultural revenue (in current dollars), as well as to similar increases in the cost of agricultural inputs. This, for example, has been the case over the past five years. However, it is not uncommon for positive growth in agricultural output to lead to a decline in agricultural commodity prices as a result of a glut in supply (Table 2). This, in turn, can create serious discontent among farmers since their income actually decreases as a result of the lower prices.
This study has, therefore, sought to measure the performance of agriculture by evaluating its impact on the income of farmers. This method estimates agricultural growth performance as the “evolution of real factor income”5
by focusing on the impact of agricultural performance on the purchasing power of each dollar earned from agriculture. This data is revealing.
In 2001, while agriculture’s growth was reported as 6.3% over the previous year (Table 3), factor income declined by -0.5%. The situation in 2005 was just the opposite; while primary agriculture declined by -8.1%, agricultural factor income grew by 5.1%. The difference between both measures is explained mainly by the relative changes in agricultural prices versus overall prices in the economy. Changes in agricultural prices were primarily affected by exogenous shocks such as 9/11 in 2001 and numerous hurricanes over the period under review. On average, from 2004-2007, the agricultural sector, measured in terms of volume, grew by 2.75%, while income increased at a higher average rate of 3.79%. It should be clear, therefore, that the different approaches to measurement
5 The Factor Income is equal to the sum of “compensation of employees” (salaries and other labor cost) and “net operating surplus” (profits, land rents, net interest, self-employment income and other).

13The Contribution Of Agriculture To Sustainable Development In Jamaica
provide different perspectives on agriculture’s contribution. Whether the contribution of agriculture to the growth of GDP is measured in “quantum” or physical terms or in terms of its contribution to the income of agricultural producers, it has important implications for policy design.
Destination and Use of Agricultural Output
As an economy develops and becomes more diversified, the share of the primary agricultural sector in overall domestic output (GDP) should decline. At the same time, the sector should develop strong linkages with the rest of the economy. The extent to which this is happening in the Jamaican economy can be established by using a supply and use table to ‘trace’ and examine these important linkages between agriculture and other sectors.
An analysis of the ‘use’ of Jamaica’s agricultural output shows that the sector is an important supplier of inputs for other areas of production. Approximately 39.0% of primary agricultural output goes to satisfy what
TABLE 3:
Source: Paz, Benavides and Arias.
GROWTH IN AGRICULTURAL GDP: VOLUME AND INCOME MEASURES, 2000-2007, JAMAICA
YearAgricultural
GDP, at constant prices
Year changes
Real Agricultural
Factor Income
Year changes
2000 21206 212062001 22552 6.3% 21096 -0.5%2002 20971 -7.0% 19241 -8.8%2003 21984 4.8% 18288 -5.0%2004 20275 -7.8% 18670 2.1%2005 18626 -8.1% 19615 5.1%2006 21588 15.9% 20567 4.9%2007 21157 -2.0% 20855 1.4%
Average Growth 2004-2007 2.75% 3.79%

14
is called “intermediate demand” (as inputs into the production of other goods for additional processing or re-sale) (Table 4).
However, intermediate demand for primary agricultural products in other countries averaged 73.8%, 1.9 times more than the figure estimated for Jamaica (Table 5).
TABLE 4:
Source: Arias, J., based on Input-Output Tables by STATIN, year 2000.
AGGREGATE DEMAND BY EXPENDITURE COMPONENTS, 2000 (IN PERCENTAGES), JAMAICA
Industry Primary Sector
Processed Food
Hotels and Restaurants
Agro-industry
Natural Resources
Rest of Economy
TOTAL
Primary Sector 9.2 0.2 0.0 40.6 0.5 1.1 1.9
Processed Food 16.1 9.8 0.2 0.0 2.7 2.1 3.7
Agroindustry 3.0 0.1 0.0 5.2 0.1 0.3 0.5Natural Resources 0.0 0.0 0.1 0.0 13.4 4.9 4.5
Hotels and Restaurants 8.8 11.9 0.3 0.0 2.9 2.6 3.7
Rest of the Economy 1.9 6.4 6.7 0.4 24.3 31.5 24.6
Intermediate Demand 39.0 28.4 7.3 46.1 43.9 42.5 39.0
Private Consumption 54.6 62.1 92.7 49.6 17.9 18.8 30.0
Government Consumption 0.0 0.0 0.0 0.0 0.0 8.6 5.8
Investment 0.3 0.3 0.0 -0.2 1.4 13.9 9.6Exports 6.1 9.3 0.0 4.5 36.8 16.2 15.6TOTAL 100.0 100.0 100.0 100.0 100.0 100.0 100.0

15The Contribution Of Agriculture To Sustainable Development In Jamaica
This suggests that forward linkages of the primary agricultural sector with/to? the rest of the economy in Jamaica are comparatively weak. The likely explanation for this low outcome in Jamaica is that a high percentage of total primary output is sold directly as fresh produce to local consumers or in export markets. Therefore, value added to local farm output has developed at a relatively slow pace. From a policy perspective, however, it would seem to be important that efforts be made to explore ways in which a larger proportion of agricultural output can flow into the creation of high value added output, for the simple reason that such output brings a higher price.
Determining agriculture’s linkages using the generation and use of income is equally important in measuring its true contribution to economic development. This study shows that intermediate procurement represents 29% of the costs incurred by the primary agricultural sector (Table 6). In other words, the sector spends 29% of its income on the purchase
USE MADE OF THE GROSS OUTPUT FOR 10 COUNTRIES IN THE AMERICAS (IN PERCENTAGES BY SECTOR)1
Sector D2 I C X G M Q
Total Agriculture and Agrifood 54.3% 2.1% 43.1% 9.3% 1.7% 10.4% 109.0%
Primary 73.8% 1.1% 19.6% 11.5% 0.5% 6.5% 100.0%
Food and Agroindustry 48.8% 0.0% 49.7% 8.7% 2.0% 11.5% 100.0%
Natural Resources 109.5% 0.1% 0.2% 25.8% 0.1% 35.8% 100.0%
Rest economy 43.1% 11.4% 37.0% 6.7% 9.5% 7.7% 100.0%
Total 45.5% 10.0% 37.4% 7.3% 8.3% 8.4% 100.0%
Source: IICA (2005). Based on data from GTAP 5.0.
1 The results are for the weighted average of the 10 countries studied (Argentina, Brazil, Canada, Chile, Colombia, Mexico, Peru, Uruguay, the United States, Venezuela). Costa Rica is not included.2 D: Intermediate Demand; I: Investment; C: Private Consumption; X: Export; G: Government Consumption; M: Imports; Q: Gross Output.
TABLE 5:

16
of intermediate goods. However, if due consideration is given to the expanded agricultural sector, the costs of intermediate procurement will increase to 34.4%. In contrast, intermediate input procurement by the food and agro-processing industries are equivalent to 40 and 35 cents for every dollar of production, respectively.
AGGREGATE SUPPLY BY USE COMPONENTS, 2000 (IN PERCENTAGES), JAMAICA
Industry Primary Sector
Processed Food
Agro-industry
Hotel and Restaurants
Natural Resources
Rest of Economy TOTAL
Intermediate Inputs 29.1 39.7 34.5 61.6 50.1 36.5 39.0
Primary Sector 9.2 11.5 15.2 9.6 0.0 0.2 2.6Processed Food 0.3 9.8 0.9 18.2 0.0 0.9 2.6Agroindustry 8.1 0.0 5.2 0.0 0.0 0.0 0.6Hotel and Restaurants 0.0 0.2 0.0 0.3 0.1 0.6 0.4
Natural Resources 0.7 2.6 0.4 4.3 13.4 3.3 4.0
Rest of the Economy 10.9 15.5 12.8 29.2 36.6 31.5 28.7
Value Added 38.2 17.2 24.4 30.2 33.4 39.6 36.1Labor 13.8 8.0 4.6 14.5 14.4 21.8 18.6Capital 24.3 8.9 19.7 15.3 18.6 17.1 16.9Net Taxes on production 0.1 0.3 0.1 0.4 0.5 0.7 0.6
Imports 5.5 20.7 6.2 0.7 8.6 27.5 21.8Imports (C.I.F.) 4.9 19.1 5.9 0.7 8.2 26.0 20.5
Import duties and other taxes on imports
0.5 1.6 0.3 0.0 0.4 1.6 1.3
Taxes 0.1 4.3 10.3 7.5 2.4 2.8 3.1Marketing Margins 27.2 18.1 24.6 0.0 5.4 -6.4 0.0
AGGREGATE SUPPLY 100.0 100.0 100.0 100.0 100.0 100.0 100.0
Source: Arias, J, based on Input-Output Tables by STATIN, year 2000.
TABLE 6:

17The Contribution Of Agriculture To Sustainable Development In Jamaica
The Processed Food, Agro-industry and the Hotels and Restaurants sectors are those with the strongest backward linkages to the primary agricultural sector.
• Every increase of one dollar in production in the Processed Food sector results in a demand for 11.5 cents worth of agricultural inputs.
• Every increase of one dollar of production in the Agro-industry sector results in a demand for 15.2 cents worth of agricultural inputs.
• Every increase of one dollar in production in the Hotel and Restau-rants sector results in a demand for 10 cents worth of agricultural inputs.
The results indicate that for every dollar earned from the production of an agricultural product, 38% is value added. The average value added for agriculture is, therefore, higher than that for the country as a whole (36%). The Processed Food sector exhibits the lowest rate (17 cents) of value added, due mainly to its high import content (the proportion of imports to total supply is on the order of 20.7%). By way of contrast, a sample of 10 countries in the Americas produced 53 cents of value added for every dollar of agricultural production, which was much higher than the estimated coefficient for Jamaica (IICA, 2005). This significant difference could be a result of low agricultural profitability, which, in turn, implies low productivity in the sector.
Finally, the study provides a measure of import dependency. Jamaica, as a whole, imports goods equivalent to 21.8% of the total output of the national economy. In contrast, primary agricultural imports are equivalent to 5.5% of primary agricultural output. The sectors most dependent on imports are the Processed Food sector (20.7%) and the Industry and Services sectors (27.5%). The relatively low level of import dependency of the agricultural sector would appear to be a strong argument for policy initiatives directed at ensuring that the sector plays a more central role in overall economic development. At the same time, the relatively high import to supply ratio in other sectors of the economy, especially in the processed food sector, means a domestic market opportunity for the agricultural sector.

18
Linkages with the Tourism Sector
The importance of creating linkages between tourism and agriculture is receiving growing recognition among tourism scholars and interest groups. Tourist demand for local foods may hold great potential for creating and strengthening linkages between agriculture and tourism. This is especially true in a country like Jamaica, where inbound tourism expenditure was 43.4% of total exports in 2007 (2.14 million US dollars), up 8.1 percentage points from 1995 (World Bank, 2009).
Intermediate use of inputs in the Hotel and Restaurants sector represents 61.6% of the sector’s total output. If more of these inputs were produced locally, the linkages with the domestic economy could be further developed and strengthened. There are already important backward linkages between the Hotels and Restaurants sector and the Primary Agriculture and the Processed Food sectors. Of total tourism output, 18.2% is intermediate inputs from the Agro-food Sector, and 9.6% is intermediate inputs from the Primary Sector. A second level of linkages arises from the fact that inputs from the Primary Agricultural sector represent 11.5% of total output in the Processed Food sector, which is then demanded as inputs by the Hotels and Restaurants sector.
Similarly, the forward linkages of Primary Agriculture and the Processed Food industry are important to the Hotels and Restaurants sector. Hotels and Restaurants absorb an estimated 8.8% and 11.9% of the total output from Primary Agriculture and the Processed Food sector, respectively. At the same time, for every one dollar of Primary Agriculture production, 16 cents is sold to the Processed Food sector, which, in turn, supplies 12 cents of its total output to hotels and restaurants.
A recent study commissioned by the Food and Agriculture Organization (FAO 2008) estimated that total food purchases (including both imported and local) by hotels is approximately US$177 million, or 16 billion Jamaican dollars ($J), of which $J4.8 billion represents local purchases. These numbers do not include the sale of meats to the hotel industry, which is also quite significant.
The production of tropical fruits and vegetables offers significant potential for establishing direct linkages between local agriculture and tourism in Jamaica. However, a major challenge affecting such linkages is the lack of a formal structure governing the relationship between both industries.

19The Contribution Of Agriculture To Sustainable Development In Jamaica
Dynamic forward and backward multipliers
This study provides a different understanding of the relationship between agriculture and the rest of the economy over time and in so doing adds a different dimension to traditional, static, analyses. By incorporating time series analyses, it reveals the effects that are spread out over time. This is important since the impact of any sectoral change in economic activity is not instantly manifested in economic growth or decline. Changes are revealed in a never-ending sequence of events interacting over time.
For approximately three decades leading up to 1996, long-run growth in Primary Agriculture mirrored the performance of the economy as a whole (Table 7). During these three decades, agriculture grew at an average rate of 1.25%, very close to the average growth of the total national output (1.37%). In 1996, agriculture started a downward trend, one that has generally continued to the current period. In reviewing the last 10 years (1997 to 2007), it was noted that GDP grew by 1.62% (led by the Services Sector) while agricultural value added contracted, on average, by -2.05%.
It is important to mention that agriculture experienced a great deal of instability in the decade (1997 - 2007), showing positive and negative growth in cycles of two to three years. Such instability is associated largely with extreme weather conditions and other external factors linked to changes in international trade policy and, as observed above, low productivity levels in the sector.
Long and medium term GDP growth rates1 by sectors, 1966-2007
1966-1996 1997-2007Gross Domestic Product (GDP) 1.37% 1.62%Agriculture Value Added (AVA) 1.25% -2.05%Industry Value Added (IVA) -0.12% 0.85%Services Value Added (SVA) 1.98% 1.92%
Source: Arias, J. based on the World Bank World Development Indicators, 2009.
1 Ordinary Least Squared exponential growth rate.
TABLE 7:

20
Statistical tests provide evidence of dynamic backward and forward linkages between agriculture and the other sectors of the economy6. These, however, show significant differences over the last decade compared with the pre-1996 period. During 1966-1996 period, the forward elasticity of agriculture with the rest of the economy was found to be statistically significant and equal to 1.06% (Table 8). In other words, a 1% increase in the value added of agriculture would have a positive long-run effect of 1.06% on the rest of the economy. This long-run elasticity becomes negative, but not statistically significant, when calculated for the period of 1966-2007. This opposite result is likely to be associated with the relatively poor performance of agriculture during this last decade. The result, while not statistically significant, demands close attention since it is suggesting that in the long run an increase in agricultural value added is not necessarily creating a positive impact on overall domestic activity.
These results indicate that Primary Agriculture has moved from a high degree of integration with and linkages to the rest of the economy, to one characterized by a high degree of independence (or weak integration and linkages) in the last decade (1997-2007) (Figure 1). This is not a good sign when linkages among the different sectors are a necessary condition for the general development of the economy and, particularly, for growth and development in agriculture. The ‘independent’ or isolated nature of the behavior of the agricultural sector during the last decade of analysis also signifies that agriculture value added is driven more by shocks within the agricultural sectorf, and less by chain integration and market-led development initiatives.
Long-run elasticities between the Value Added of Agriculture and the rest of the economy, 1966-2007
Direction 1966-2007 1966-1996Forward Elasticity -0.32 1.06**Backward Elasticity -3.08** 0.95**
Source: Arias, J., based on the World Bank Development Indicators, 2009.
** Statistically Significant at least at the 5 percent level
TABLE 8:
6 For more details on the method used see Arias (2009).
21The Contribution Of Agriculture To Sustainable Development In Jamaica
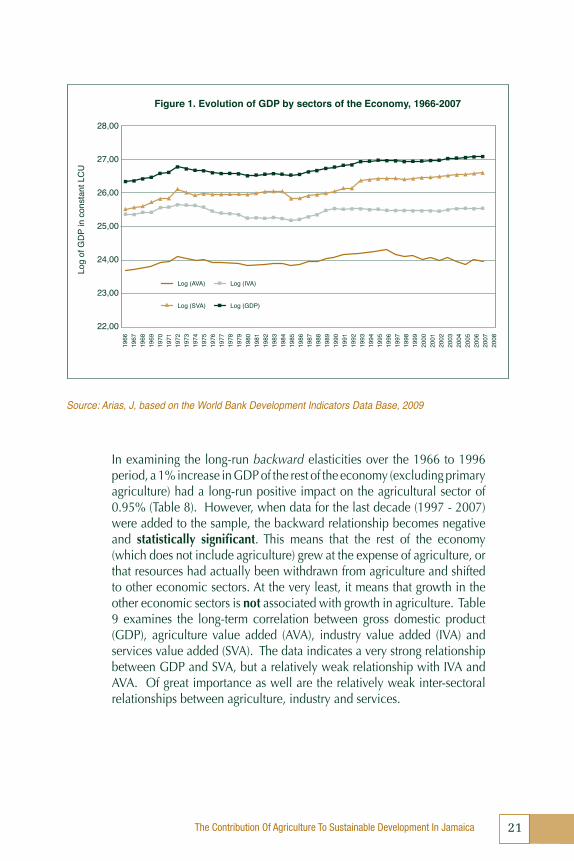
In examining the long-run backward elasticities over the 1966 to 1996 period, a 1% increase in GDP of the rest of the economy (excluding primary agriculture) had a long-run positive impact on the agricultural sector of 0.95% (Table 8). However, when data for the last decade (1997 - 2007) were added to the sample, the backward relationship becomes negative and statistically significant. This means that the rest of the economy (which does not include agriculture) grew at the expense of agriculture, or that resources had actually been withdrawn from agriculture and shifted to other economic sectors. At the very least, it means that growth in the other economic sectors is not associated with growth in agriculture. Table 9 examines the long-term correlation between gross domestic product (GDP), agriculture value added (AVA), industry value added (IVA) and services value added (SVA). The data indicates a very strong relationship between GDP and SVA, but a relatively weak relationship with IVA and AVA. Of great importance as well are the relatively weak inter-sectoral relationships between agriculture, industry and services.
Figure 1. Evolution of GDP by sectors of the Economy, 1966-2007
28,00
27,00
26,00
25,00
24,00
23,00
22,00
1966
1967
1968
1969
1970
1971
1972
1973
1974
1975
1976
1977
1978
1979
1980
1981
1982
1983
1984
1985
1986
1987
1988
1989
1990
1991
1992
1993
1994
1995
1996
1997
1998
1999
2000
2001
2002
2003
2004
2005
2006
2007
2008
Log (AVA) Log (IVA)
Log (SVA) Log (GDP)
Log
of G
DP
in c
onst
ant L
CU
Source: Arias, J, based on the World Bank Development Indicators Data Base, 2009

22
Agricultural Productivity
The sector faces an enormous challenge: to increase productivity in a sustainable manner. A good indication of the level of competitiveness or productivity in a sector is the value added per worker at constant prices. According to the World Bank, each agricultural worker in developed countries produces as much as 35,000 US dollars worth of value added per year, on average. In Latin America, annual value added is more than 5,000 US dollars in several countries. However, in Jamaica the index is not only low, but has deteriorated over time. Using the last data available (2005), this productivity index was 2,005 US dollars (at year 2000 price levels), down from 2,865 US dollars of agricultural value added per worker in 1996.
To clearly illustrate the levels of low productivity in Jamaican agriculture, we calculated a productivity index (2003 base year and weighted by area reaped) for the vegetables, cereals, roots and condiments sub-sector. The results showed that, in 2008, gross receipts at farm gate prices for 61 products increased, on average, by 84% relative to the base year. However, this increase was due solely to changes in farm gate prices, which increased 117%. In contrast, yields decreased in 2008 by 3% relative to the base year, linked to a 10% reduction in total harvested area (Figure 2).
Linear correlation between the agricultural value added (AVA), the industry valued added (IVA), the services value added (SVA) and GDP
(1966-2007)
Sector AVA IVA SVA GDP
Agriculture Value Added (AVA) 1.00 0.52 0.59 0.68Industry Value Added (IVA) 1.00 0.37 0.53Services Value Added (SVA) 1.00 0.97
Gross Domestic Product (GDP) 1.00
Source: Arias, J., based on the World Development Indicators Data Base of the World Bank (2009).
TABLE 9:

23The Contribution Of Agriculture To Sustainable Development In Jamaica
In other words, the current value of agricultural output is being driven up by rising prices. On the other hand, yields are decreasing and agricultural acreages are decreasing. These problems are aggravated by the fact that farmers suffer from what economists call “high gross income variability”. Their income can fluctuate wildly as a result of unpredictable weather conditions and significant increases in the cost of farm inputs. This has been the case during the last two years.
On the positive side, it is well worth noting that in 2008 the output of certain vegetables increased by more than 10%, compared to the 2003 base year. This included:
• Gungo peas (14.8%), • Peanuts (14.1%), • Irish potatoes (10.5%), • Onions (10.3%) and • Eggplants (8.3%).
Figure 2. Composite Index of yields, area reaped, prices and gross income for vegetables products (2003 = 1)
2,30
2,10
1,90
1,70
1,50
1,30
1,10
0,90
0,70
0,50
Inde
x 20
03 -1
19990,991,210,770,92
20000,950,990,950,91
20010,991,030,940,99
20020,960,911,040,93
20031,001,001,001,00
20040,970,871,301,10
20050,960,891,691,43
20061,000,991,481,45
20070,970,931,631,47
20080,970,902,171,84
Yields
Area
PricesGrossIncome
Note: Composed index of 61 vegetable products, using as weights the share of area reaped in each year.
Source: Author, based on data from Ministry of Agriculture.

24
However, while 17 out of 61 products showed moderate increases in productivity, the majority of products experienced declining yields.
Revealed Trade Comparative Advantage
Productivity levels are normally reflected in the country’s trade performance. Revealed comparative advantage indexes were calculated for the agro-food trade sector during the 2004-2008 period. When compared with the rest of the world, these indexes reveal trade patterns, relative factor costs and prices, and relative resource endowment and productivity levels of a country.
We begin by looking first at an indicator of Jamaica’s overall agricultural trade performance. During the 2004-2008 period Jamaica imported an annual average of US $853 million of agro-food products, while it exported US $319 million. In 2008, imports into Jamaica accounted for 3.14 dollars for every dollar of exports, revealing Jamaica’s high level of dependence on imports of agro-food products. This dependency has increased rapidly compared to the situation in 2004, when 2.12 dollars were spent on imports for each dollar exported. As of 2008, the share of agro-foods in total merchandise imports was 13%.
In relation to exports, the revealed comparative advantage analysis indicated that most of Jamaica’s agro-food exports, 79.19%, could be classified under the heading of ‘positive revealed comparative advantage’, but with a negative trend. This means that other competitors are gaining share in the international market at the expense of Jamaican exports. This should be seen as a ‘wake-up-call’ for Jamaican policy makers. Only 17.43% of total agro-food exports could be placed in the most desirable category of ‘positive and growing international competitiveness’.

25The Contribution Of Agriculture To Sustainable Development In Jamaica
TABLE 10:
Ranking and growth (r) of revealed export advantage (RXA) of agrofood products, 2004-20081
(I) RXA>0, r<0 79.19% of total exports2 (II) RXA>0, r>0 17.43% of total exports0714.90 Arrowroot, salep & similar tubers 0807.20 Papaws (papayas), fresh2208.40 Rum and tafia 0910.50 Curry0714.20 Sweet potatoes, fresh or dried 0910.40 Thyme and bay leaves2005.10 Homogenized vegetables prep, not frozen
0306.19 Crustaceans not specified, frozen, in shell or not
1701.11 Raw sugar, cane2008.99 Fruits & other edible pts of plants not specified, prep(III) RXA<0, r<0 1.87% of total exports (IV) RXA<0, r>0 1.52% of total exports
0305.51 Cod dried, whether or not salted but not smoked 0811.90 Fruits & edible nuts uncooked
1005.90 Maize (corn) not specified 0808.10 Apples, fresh2402.20 Cigarettes containing tobacco0402.10 Milk powder not exceeding 1.5% fat0409.00 Honey, natural0805.50 Lemons and limes2008.70 Peaches nes, or/w prep o preserved whether or not sugared
Source: Arias, J. with COMTRADE data. The method is explained in Arias and Segura (2004).1 Table shows ten products with the highest RXA (from a total of 71) and the ten with the lowest RXA (from a total of 355). However, percentages were calculated for the entire set of products.2 Percentage of average agrofood exports of agrofood products for the 2004-2008 period.
On the import side, Jamaica also appears to be at a disadvantage. Approximately 93% of imports show comparative import advantage, of which 23% fall in the positive growth category and 70% in the category of negative growth. This means that imported products have a significant comparative advantage against domestically produced goods. Out of a total of 874 tariff lines, only 199 tariff lines show comparative import advantage. On the other hand, a mere 7% of total imports show comparative disadvantage in the domestic market - the equivalent of 530 tariff lines. These products could represent an opportunity for domestic production.

26
Regarding export diversification and valued adding, during the 2004-2008 period, only 48.7% of total tariff lines in the Agro-food Ssctor (from a total of 874 lines) were exported, of which just 16.7% (or 71 products) showed positive revealed export advantage. In contrast, 83.3% (or 355 products) revealed export disadvantage. Most products exported are primary with little value added, which substantiates the conclusion above of limited development in value adding to primary agriculture output.
TABLE 9:
Ranking and growth (r) of revealed import advantage (RMA) of agrofood products, 2004-20081
(I) RMA>0, r<0 69.75% of total imports2 (II) RMA>0, r>0 23.12% of total imports
2302.50 Bran, sharps and other res. of le-gumes plants, pelleted or not
0305.59 Fish not specified, dried, whether or not salted but not smoked
0204.41 Sheep carcasses and half carcasses, frozen 1508.10 Ground-nut oil, crude
1604.15 Mackerel, prep or preserved, whole or in pieces, not minced 0713.32 Beans, small red (Adzuki) dried, shelled
1106.30 Flour, meal & powder of edible fruits 1006.20 Rice, husked (brown)0305.42 Herrings smoked, including fillets2009.41 Of a Brix value not exceeding 20
(III) RMA<0, r<0 0.93% of total imports (IV) RMA<0, r>0 6.% of total imports1001.90 Wheat nes and meslin0409.00 Honey, natural0201.20 Bovine cuts bone in, fresh or chilled0511.99 Animal prods not specified & dead ani-mals of ChptrI1702.50 Fructose, chemically pure1214.90 Swedes, mangold, fodder root, hay, clover, sainfoin, etc0302.12 Salmon Pacific, Atlantic & Danube,fr or chd excl hd No 03.040303.80 Livers and roes, frozen0810.90 Fruits, fresh not specified0714.90 Arrowroot, salep etc fr or drid whether or not slicd
Source: Arias, J. with COMTRADE data. See note on the method used in Appendix II.1 Table shows ten products with the highest RMA (from a total of 199 products) and the ten with the lowest RMA (from a total of 530). However, percentages were calculated for the entire set of products.2 Percentage of average agrofood imports of agrofood products for the period 2004-2008.

27The Contribution Of Agriculture To Sustainable Development In Jamaica
Beyond input-output linkages
Traditional methods of calculating agriculture’s contribution to GDP have been challenged because they ignore the role of agriculture in rural development, in the maintenance of the environment and bio-diversity, in poverty reduction and in food security. Agriculture plays a crucial role in the local economy to the extent that money is transferred from urban to rural areas for the provision of food, products, and in some instances, employment. Additionally, the global financial crisis, coupled with the current food crisis and the evolving fuel crisis, have led countries once again to pay close attention to agriculture’s potential to provide some degree of social and economic stability in periods of economic stress.
Agriculture has a particularly important role to play in income growth and poverty reduction. For example, it has been reported that improvements in agricultural productivity have the potential to increase per capita GDP by a factor of 1.5 to 2.6 higher than the same increase in productivity of the manufacturing sector (Houck). Research has shown that growth in agriculture alone can have significant positive effects on reducing the levels of poverty through both direct and indirect impacts (Mellor; Valdez and William). Agriculture can provide formal and informal employment for those with both adequate and limited education, and in other developing countries agriculture has proved to be a sustainable avenue for poverty stricken households to generate an income. This potential role of agriculture in reducing poverty is particularly important when the incidence of poverty in rural areas of Jamaica (where 71.1% of the poor are located) is 15.3%, 1.55 times higher than the national average.
The role of the agricultural sector is also fundamental for food security, because food is second in importance only to potable water for the survival of human kind. In rural areas, agriculture is an important activity, which assures access to both food and a source of income. A recent report by the World Bank (2009) indicated that food imports in Jamaica were equivalent to, on average, 7.3% of household consumption between 2005 and 2007. This places the country in the 8th position worldwide in terms of dependency on food imports. In Jamaica, while the average national income appears to be sufficiently high to avert situations of food insecurity in times of crises, income distribution is very unequal, implying that a substantial proportion of the population lives in poverty

28
and is highly vulnerable to escalating food inflation. One of the biggest challenges that Jamaica must face is the huge discrepancy between rich and poor, and this would appear to be an area to which agriculture can make a positive contribution.
A recent report by the United States Department of Agriculture (USDA, 2010) on food insecure populations revealed that in 2008 Jamaica (and other countries such as Ecuador, the Dominican Republic, Honduras, Nicaragua, among others) experienced declines in food consumption that resulted in increased numbers of food-insecure people. The study also projected increases in the number of food-insecure people in countries that are highly dependent on export earnings or remittances to help finance their food imports, which is the situation of Jamaica.
A critical element of food insecurity is the issue of managing risk, and agriculture has a major role to play in mitigating such risks by assuring increased food availability in an efficient manner and by providing jobs and income earning opportunities which, in turn, enhance economic access to food. There are some emerging signs that suggest an increase in the consumption of locally grown foods. These signs, when viewed in the context of trade data, show a US$60 million decline in food imports in 2009, when compared to 2008 (Statin, 2010). When viewed in the context of domestic production data, there are indications of an increase in local supplies of several food crops, such as: hot pepper, Irish potato, horse plantain, onion, and ginger, among others (Table 12). These developments auger well for food security and agriculture in Jamaica and policy should be directed at promoting these and similar outcomes. Among the other signs that are equally positive is the heightened interest among urban dwellers in various aspects of backyard/home gardening.

29The Contribution Of Agriculture To Sustainable Development In Jamaica
Finally, there is growing recognition of intangible, and yet to be estimated, benefits of agriculture. This refers to the positive contributions that it can make to conserving natural resources, the environment, and biodiversity, adjusting and responding to certain problems of a global nature such as climate change, and desertification, developing social capital, preserving community life and maintaining ecosystems.
TABLE 12: Production of Selected crops 2008 – 2009 (tonnes)
Source: Data Bank (Ministry of Agriculture)
Ranking Product 2009 2008 % change
1 Hot Pepper 10565.4 5338.0 97.92 Other Lettuce 1200.3 646.7 85.63 Irish Potato 8708.3 4928.6 76.74 Horse Plantain 18791.7 11345.0 65.65 Onion 720.9 455.0 58.46 Other Plantain 5829.4 3689.9 58.07 Ginger 458.7 297.5 54.28 Red Pea 767.8 506.2 51.79 Paw-Paw 10670.6 7156.2 49.1
10 Negro Yam 15289.0 11075.4 38.011 Sweet Pepper 10803.6 7869.4 37.312 Carrot 25436.6 18924.8 34.413 Pak Choi 9100.9 6803.2 33.814 Sweet Potato 34229.0 25796.7 32.715 Dasheen 14305.3 11416.3 25.316 Yellow Yam 80531.1 64374.0 25.1


31The Contribution Of Agriculture To Sustainable Development In Jamaica
Conclusion
In conclusion, it should be clear that the agricultural sector is central to the national growth and development process. Furthermore, growth in the agricultural sector cannot be left solely to ‘market forces’. Some government measures, in the form of policies and strategies that enable and support private initiative, must be put in place. Additionally, regulatory mechanisms should be established to ensure that these policies and strategies are equitable, competitive and sustainable.
Notwithstanding the full recognition of the critical importance and increasing role of agriculture in economic development, public sector budgetary allocations and actual expenditures in the agricultural sector continue to be low and woefully inadequate. In Jamaica, an estimated 1.35% of the total public expenditure is allocated to the agricultural sector. In contrast, other developing countries typically allocate, on average, between 6% and 8% of the total public budget, while in the developed/industrialized countries, the comparative allocation is between 3% and 5%. A positive indicator is the efforts to re-direct public spending towards increased investment in public goods, which most likely would accelerate growth in agriculture and growth of the Jamaican economy. Research has shown that investment in public goods such as agricultural research and extension, rural roads and irrigation typically produces returns that are two to six times greater than those produced by providing input subsidies.
Both IICA and the Ministry of Agriculture and Fisheries (MOA) are advocating the adoption of a new development model “that recognizes the integral role that multidimensional agriculture and the rural economy play in the development process owing to their contribution to food security, energy security, water supply, employment, environmental conservation, social stability and freedom from social unrest”. In this context, appropriate and adequate national policies that support a

32
multidimensional, multi-sectoral approach towards agriculture and rural life, and new strategies to increase investment in agricultural research, innovation, and technology transfer, are imperatives.
IICA and the MOA stand firm in their belief that such as a new model for development, centered on agriculture and food security, will lead to sustainable and comprehensive development of both urban and rural areas. This is essential in:
• ensuring social and political stability;
• promoting the competitiveness of agriculture and rural economic activities; and
• creating rural agricultural and non-agricultural employment that sup-ports an acceptable level of livelihood in rural areas.

33The Contribution Of Agriculture To Sustainable Development In Jamaica
References
Arias, J. Contributión of agriculture to sustainable development in Jamaica. Working Paper. IICA: Jamaica. 2009.
Arias, J. and Oswaldo Segura. Índice de ventaja comparativa revelada: un indicador del desempeño y de la competitividad productivo-comercial de un país. Intercambio. IV. 2004. IICA: San José, Costa Rica.
Houck, J. P. Foreign Agricultural Assistance: Ally or Adversary, Staff Paper P86-50, Department of Agricultural and Applied Economics, University of Minnesota, 1986
IICA. More than food in the table: Agriculture’s true contribution to the economy. Rafael Trejos, Joaquín Arias, Osvaldo Segura, Eliécer Vargas. -- San José, C.R. : IICA. Directorate of Strategic Planning and Institutional Modernization; Area of Trade and Agribusiness, 2004. 116 p. ; 27 cm.
Mellor,J. “Faster More Equitable Growth: The Relation between Growth in Agriculture and Poverty Reduction”, CAER II Discussion Paper No. 70, Harvard Institute for International Development, Cambridge, MA, EE.UU., mayo de 2000.
USDA. Food Security Assessment 2008 – 09. ERS. Available in: www.ers.usda.gov
Valdés, A. and William Foster “Más allá de la producción: Externalidades de la Agricultura chilena”. Availabe in www.rcia.puc.cl/Espanol/pdf/33-2/10.2%20Libro2.pdf.
World Bank. World Development Indicators data files, 2009.


35The Contribution Of Agriculture To Sustainable Development In Jamaica
Appendices
PRIMARY AND EXPANDED AGRICULTURAL VALUE ADDED AS PERCENTAGE OF GDP (CONSTANT PRICES, 1999 - 2008), JAMAICA
SECTOR 1999-2003 2004-2008 2008AGRICULTURE, FORESTRY & FISHING 6.14% 5.07% 4.83%Traditional Export Agriculture 1.28% 0.86% 0.82%Sugar Cane 0.37% 0.28% 0.27%
Other Traditional Exports 0.91% 0.57% 0.56%
Other Agricultural Crops 3.46% 2.82% 2.64%Root Crops 1.49% 1.08% 0.96%Other Domestic Crops 1.97% 1.75% 1.67%Animal Farming 0.79% 0.81% 0.80%Post Harvest Crop Activities & Agricultural Services 0.19% 0.14% 0.13%
Forestry & Logging 0.06% 0.06% 0.06%Fishing 0.37% 0.38% 0.38%
MANUFACTURE LINKED TO AGRICULTURE1 5.18% 5.15% 4.69%
Food Products ( excl. Sugar) 2.93% 3.00% 2.99%
Sugar & Molasses 0.30% 0.22% 0.20%Alcoholic Beverages and Tobacco Products 1.70% 1.31% 1.16%Non-Alcoholic Beverages 0.26% 0.30% 0.33%
EXPANDED AGRICULTURE GDP SHARE 11.34% 9.90% 9.52%EXPANDED/PRIMARY AGRICULTURAL SHARE 1.85 1.95 1.97
APPENDIX 1:
Source: Arias, J, based on data from the National Income and Product 2008 report by STATIN.1 It does not include Manufacture of Wood and Products of Wood and Cork for lack of disaggregation in the available national accounts reports; neither does it include the value added generated from water industry.
