the consequences of an industrial food ... - lehigh...
TRANSCRIPT
THE CONSEQUENCES OF AN INDUSTRIAL FOOD SYSTEM:
A CROSS-NATIONAL EXAMINATION OF THE ROLE OF MECHANIZATION IN THE RISING OBESITY EPIDEMIC
ABIGAIL GENDLER Environmental Studies Honors Thesis
Lehigh University
ADVISORS: KELLY AUSTIN and BREENA HOLLAND
Abstract: Research suggests that physical inactivity, trends toward increasing urbanization, and changes in the agriculture employment sector, can strongly inform us about the causes of obesity in modern society. However, they fail to link the rise of obesity in today’s society to changes in the modern processes of food production, and particularly, to the broader trend toward mechanized agriculture that characterizes the current food production system, across both poorer and affluent nations. This paper employs structural equation modeling to test both the direct and indirect effects of causal factors to the increasing prevalence of obesity across nations. Findings indicate that the mechanization of agriculture is an important underlying factor in explaining cross-national trends in overweight males and females. It directly contributes to declines in employment in the agriculture sector, which leads to increased urbanization and physical inactivity, which are interrelated and acting as driving forces in the growing obesity epidemic. Integrative models provide a holistic view of the world’s food system and the potential implications for how factors of globalization spur obesity in populations worldwide.
2
Introduction
The prevalence of obesity and overweight in humans is a problem that spans
across the entire globe. The extent of this problem has reached such high percentages that
it is considered by many to be an epidemic (Popkin & Doak 1998; Loureiro & Nayga
2005; WHO 2014). In 2008, over 1.8 billion adults over the age of 20 were overweight.
Of these, over 200 million men and almost 300 million women were obese (WHO 2014).
The common health consequences of overweight and obesity include cardiovascular
diseases such as heart disease and stroke, which were the leading cause of death in 2008,
and diabetes (WHO 2014).
The World Health Organization defines overweight and obesity as abnormal or
excessive fat accumulation that may impair health (WHO 2014). A person who has a
body mass index (BMI) of 25 or higher is considered overweight, while a person with a
BMI of 30 or higher is considered obese (WHO 2014). Being obese is closely related to
being overweight; for the purpose of this paper I will use the single term of obesity when
discussing the causes of the obesity epidemic, unless I am referring to data or research
where the difference between obesity and being overweight is relevant.
Obesity is caused by energy imbalances between calories consumed and calories
spent (WHO 2014). In general, women tend to have more stored body fat than males and
are therefore more likely to be obese (Sobal 2001). Literature points to shifts in diet as
one of the major causes for the rising obesity epidemic. These shifts characterize a move
toward high calorie intake and are accompanied by less physical activity among people in
both the developed and under-developed world. Studies have shown that under any
condition, the energy imbalance that causes obesity is determined by the interaction
3
between diet and physical activity, never one or the other in isolation (Hill & Peters 1998;
French, Story & Jeffery 2001; Loureiro & Nayga 2005).
Obesity affects both developed and developing nations. In fact, in some lower-
income and developing countries, levels of obesity are as high or higher than levels
reported for developed nations (Popkin & Doak 1998; WHO 2013). On a global scale, we
are experiencing a general shift toward obesity, not only centered in a few high-income
countries. There have been rapid increases in obesity in lower- and middle-income
developing countries (WHO 2013). This rate of change in obesity rates is higher than in
higher-income countries (Popkin & Larsen 2004). It has been reported that from 1998 to
2008 the prevalence of obesity has risen from 2.3 percent to 19.3 percent in several
developing countries (Misra & Khurana 2008). It is expected that between 1990 and
2020, mortality from cardiovascular disease in developing countries will increase by 120
percent for women and 137 percent for men. This is substantially greater than from
developed countries: 29 and 48 percent respectively (Misra & Khurana 2008). Literature
suggests that the major causes of the increasing scope and prevalence of obesity
including changes in diet and physical activity, are often influenced by urbanization, the
adoption of a Western diet, education, and income level (Popkin & Larsen 2004;
Loureiro & Nayga 2005; Ball & Crawford 2004).
While these patterns in physical inactivity, diet, and urbanization are important, I
contend that they are facilitated by larger trends and changes in the structure of
agricultural production worldwide. The mechanization of agriculture has affected not
only the farm itself, but also the surrounding community (Harper 2001). For instance,
mechanization has decreased the need for hard labor and lessened the need for sharing of

4
labor (Harper 2001). Such changes emerge from trends that are global in nature, and
heavily promoted by the industrialization of agriculture (McMichael 2012). World
powers have encouraged developing and less developed nations to industrialize
agriculture by adopting mechanized processes that spur increased production. Such
processes become increasingly important to developed nations as they import agricultural
products from other countries, or move their production facilities to nations where labor
costs are lower and environmental standards are much weaker (McMichael 2012; Roberts
and Thanos 2003). While trade and relocation may improve the economies of developing
countries, some evidence suggest that it also corresponds to increases in the prevalence of
obesity among children and adults (Misra & Khurana 2010).
Thus, the global pressures that spur adoption of commercialized agricultural
practices worldwide may contribute to the direct and indirect causes of global obesity
prevalence. I am interested in exploring the problem of obesity in the broader context of
these changes in food production processes, specifically, by looking at the role of
mechanized agriculture. Industrialization of the world’s food systems undoubtedly causes
significant social and economic changes that can be seen through shifts in agricultural
sector employment, migration from rural to urban areas, and ensuing changes in diet and
exercise.
This paper will argue that mechanized agriculture plays an important underlying
role in the obesity epidemic due to its impact on agricultural employment, urbanization,
and levels of physical activity. Although changes in employment, increasing
urbanization, and a decline in physical activity have all been identified as causes of the
contemporary obesity epidemic, the interrelationships between these variables and the
5
underlying factor of the mechanization of agriculture have not been empirically assessed.
I aim to analyze the complex association between the mechanization of agriculture,
employment in the agricultural sector, urbanization, and physical inactivity by exploring
the degree in which the independent variables influence each other, and ultimately,
obesity prevalence.
Background
Physical Activity and the Rise of Obesity
The relationship between physical activity and obesity is directly correlated.
Because obesity is caused by energy imbalances between calories consumed and calories
spent, we can attribute some of these imbalances to decreases in physical activity, as
physical activity is the way in which humans expend calories. Because a person’s weight
is the result of calories spent subtracted from caloric intake, a decline in physical activity
without a commensurate decline in calorie intake can directly increase a person’s weight
(WHO 2014; CDC 2012).
Many studies attribute the decline in levels of physical activity to the worldwide
shift toward much less physically demanding occupations (WHO 2014). This trend is
reflected in the employment decline in the agriculture sector, the increase in employment
in industry and services, and also in the specific type of work within most forms of
occupational employment (Popkin & Doak 1998). Some research shows that countries
with high agricultural productivity, measured by the value of output per worker in the
agricultural sector, are less likely to suffer from obesity (Loureiro & Nayga 2005). The
shift in activity is also represented by the increasing use of transportation to get to work
or school, technology in homes, and rising passive leisure time (Popkin & Doak 1998).
6
Urban environments tend to discourage physical activity as residents may rely heavily on
public transportation and are likely to take employment opportunities that are much more
sedentary in nature. This may be due to advancement in technology and transportation
that decrease the need for physical activity in daily life, or to the heightened use of
computers, televisions, and electronic games that increase the time adults and children
spend sitting (Hill and Peters 1998; Owen & Sparling 2010). Residents commuting to
urban centers may be more likely to own a motorized vehicle, increasing their chances of
being obese if they spend many hours traveling to work each week. In China, the odds of
being obese are 80 percent higher for those who own a motorized vehicle compared to
those who do not (Bell & Popkin 2002).
Some shifts in physical activity can be attributed to the modernization of societies
across the globe. Modernization involves shifts in modes of economic production for
whole societies, which have substantial impacts on how human populations expend
energy (Ehrhardt-Martinez 1998). There are three sectors that describe the economic
production process: primary, secondary, and tertiary. Primary production extracts raw
materials from the environment in agriculture, hunting and fishing, gathering, timbering,
etc., and traditionally relies on the use of muscles of humans and animals to extract and
harvest resources (Sobal 2001). Secondary production converts raw materials into
manufactured products, and typically draws energy from fossil fuels and concentrates
people in cities (Sobal 2001). Tertiary production provides services to consumers, where
people offer attention, advice, and experience, and is not as dependent on physical energy
sources as primary and secondary production (Sobal 2001). As whole societies shift from
reliance on primary to secondary to tertiary modes of economic production through the
7
modernization process, the energy expended by most people in the population decreases
dramatically (Sobal 2001).
Amidst these trends moving from primary to tertiary production, some jobs within
the primary sector are also trending towards less physical activity, where workers are
similarly engaged in minimal physical activity for long periods of time. In the agricultural
sector, employment changes due to mechanization explain why some specific
occupations have workers who become increasingly inactive (Harper 2001). The
mechanization of agriculture directly contributes to declines in physical activity because
the use of more capital-intensive technologies, such as tractors, decreases the need for
human labor on farms, pushing these people toward other modes of employment or
unemployment (Harper 2001; McMichael 2012). Even for the farmers who remain
working on the farm, tractors take away the need for as much manual labor as well as
labor sharing. As the agricultural landscape changes to more per capita, intensified food
production, more farmers move off of their farms and often into urban areas.
Diet’s Contribution to Obesity
The increased intake of energy-dense foods that are high in fat has been
contributing to rising obesity rates worldwide (WHO 2014). This informs the other half
of the energy balance model: a high fat diet often results in more calories consumed then
expended. High caloric diets are becoming even more common amongst less-developed
and developing countries, ironically experiencing the double burden of both under-
nutrition and obesity (McMichael 2012; WHO 2014). Children may be especially at risk
as they are vulnerable to inadequate nutrition while simultaneously exposed to high-fat
energy-dense foods that often cost less than nutritious, fresh foods (WHO 2014). In
8
developing countries, diet-related problems are associated with the rapid adoption of a
Western-style diet where economically possible (Fairweather-Tait 2003). A diet consists
of high-fat, high-sugar, high-salt, energy-dense foods that may be highly packaged, of
large proportions, and more convenient than whole foods prepared in the home (Ulijascek
& Lofink 2006; WHO 2014; Fairweather-Tait 2003). The U.S. can be used as an example
of the dietary dynamics of high-income countries, where the food landscape consists of
increased daily caloric intake, foods that are energy-dense and nutrient poor such as fast
food, salty snacks, more meals consumed outside the home and of large proportions, and
fruit and vegetable consumption below recommended levels (Popkin & Larsen 2004).
The adoption of a Western-style diet in recent decades in other nations has been
associated with lifestyle changes that make consumers increasingly reliant on processed
foods and fast food outlets (Fairweather-Tait 2003).
Major dietary shifts across the globe are often encompassed by and referred to as
the “nutrition transition.” As suggested, this nutrition transition relates globalization,
urbanization, and Westernization to changing food environments across the globe. The
globalization of food brings wealthy consumers greater access to more diverse and
healthy foods, and at the same time delivers more refined food durables to the poor (Weis
2007). Globalization also fosters a dietary convergence between the wealthy and the poor
in the form of junk food: soft drinks, packaged snacks and ‘convenience foods’ that are
high in fat, sweeteners, artificial flavors and coloring (Weis 2007). The adoption of a
Western diet in conjunction with this dietary convergence represents an overall shift in
diet toward increased consumption of energy-dense food as well as declines in physical
activity (Ulijaszek & Lofink 2006). It may also lead to an increased consumption of
9
animal fat. Since the agricultural revolution, the animal protein content of the diet has
increased dramatically in industrialized countries (Fairweather-Tait 2003). Animal food
intake per capita per day tends to be higher among residents of urban areas than those of
rural areas (Popkin & Larsen 2004). Increased animal protein intake often leads to
increased total energy intake. Many studies show that total energy intake was higher in
subjects who consumed diets high in fat than in subjects who consumed lower fat diets
(Hill & Peters 1998). Body fat storage also occurs at a greater rate when excess energy
comes from fat than when it comes from carbohydrates or protein (Hill & Peters 1998).
The consumption of caloric sweeteners, such as sugar, high-fructose corn syrup,
dextrose, and fructose has increased largely in recent decades. In 2000, 306 kilocalories
were consumed per person per day, which was a third higher than in 1962 (Popkin &
Larsen 2004). Studies show that all measures of caloric sweetener increase significantly
as gross national product per capita of the country and urbanization increase (Popkin &
Larsen 2004). In less urbanized areas, the proportion of energy consumed from
sweeteners increases largely as income increases. In more urbanized areas, this
proportion is much higher at lower income levels and decreases as income rises (Popkin
& Larsen 2004).
Many environmental factors drive consumer behavior and dietary choice such as
food cost, advertisements, availability, satiability, and preference. Consumers may be
more likely to experience the nutrition transition and adopt a Western-style diet if they
relocate to an urban area (Popkin & Doak 1998).
10
Urbanization
Some of the most important factors responsible for urban dietary patterns are
improved transportation and food distribution systems, greater penetration of commercial
food sector marketing practices, increased heterogeneity of diet, employment patterns
less compatible with home food production and consumption, changes in household
composition and structure, and differences in disease patterns and health care availability
(Popkin 1993). Movement from rural to urban areas and international migration largely
affect dietary changes, although the causes and details of these dietary changes are poorly
understood (Popkin 1993). Urban residents may have less time to prepare meals at home,
they may be living by themselves, and they are likely to have many more options of
convenience food readily available.
Exponential growth in urban populations affects diet based on trends including
increased consumption of: processed foods high in fat and sugar, animal products, and
food prepared outside the home. This environment fosters obesity prevalence by
providing convenient, inexpensive, highly palatable, and energy-dense foods in
combination with a more sedentary lifestyle (Hill & Peters 1998). To explain this
technically: this environment promotes high energy intake and low energy expenditure
(Hill & Peters 1998). Literature suggests that as per capita incomes rise, consumers tend
to diversify their diets; meaning that they demand higher-value livestock products, fruit
and vegetables, and relatively fewer food staples (Hazell & Wood 2008). Urbanization
heightens these patterns while placing a high premium on market access, especially for
perishable products (Hazell & Wood 2008).
11
The simple fact that more people are moving to the city exacerbates the problem:
today, over 50 percent of the world population is living in cities. However, this does not
mean that rural areas are immune to obesity: increased mechanization of farm activity
leads to reduced physical activity at the same time that more food, but not necessarily a
better variety of foods, becomes available.
Mechanized agriculture has allowed for food production to become increasingly
efficient. Increased capital has enabled countries across the globe to adopt industrial
practices of food production, enabling them to currently produce more food than the
recommended daily amount per person. According to the Food and Agriculture
Organization, global food production reached 2,600 kilocalories per capita and is
expected to reach 3,000 kilocalories per capita by 2030 (Caballero 2007).
Changes in Agriculture Sector Employment
Previous research has shown that the mechanization of agriculture has led to a
decline in agricultural sector employment (Harper 2001). The efficiency spurred by the
industrialization of food production made human labor more expensive relative to land
and capital, which decreased the amount of people needed in the agriculture sector.
Because of this, employment in agriculture declines, the value in agriculture declines, and
agriculture as a percentage of the economy declines, yet we are producing more food than
ever before. Historically, agriculture has declined in importance compared to commercial
and industrial activities, and commercial agriculture has replaced subsistence agriculture
(McMichael 2008). Changes in agriculture sector employment have led to the
increasingly sedentary nature of alternative employment opportunities, which leads to a
decline in physical activity worldwide (WHO 2014). In the agricultural sector, as
12
societies adopted capital-intensive machinery such as tractors, people were employed to
drive the tractors rather than plow or weed the land by hand (Harper 2001). This resulted
in declines in the amount of human labor needed on farms as well as the physical activity
required of farmers, contributing to the increasingly sedentary lifestyle for workers,
whether they remained in the agriculture sector or were employed elsewhere. For men,
this often means moving into urban areas, where they are even more likely to adopt a less
physically active lifestyle (McMichael 2012). Women may remain in the rural area in
order to care for the children, while the men migrate toward the city in order to find more
lucrative business opportunities (McMichael 2012).
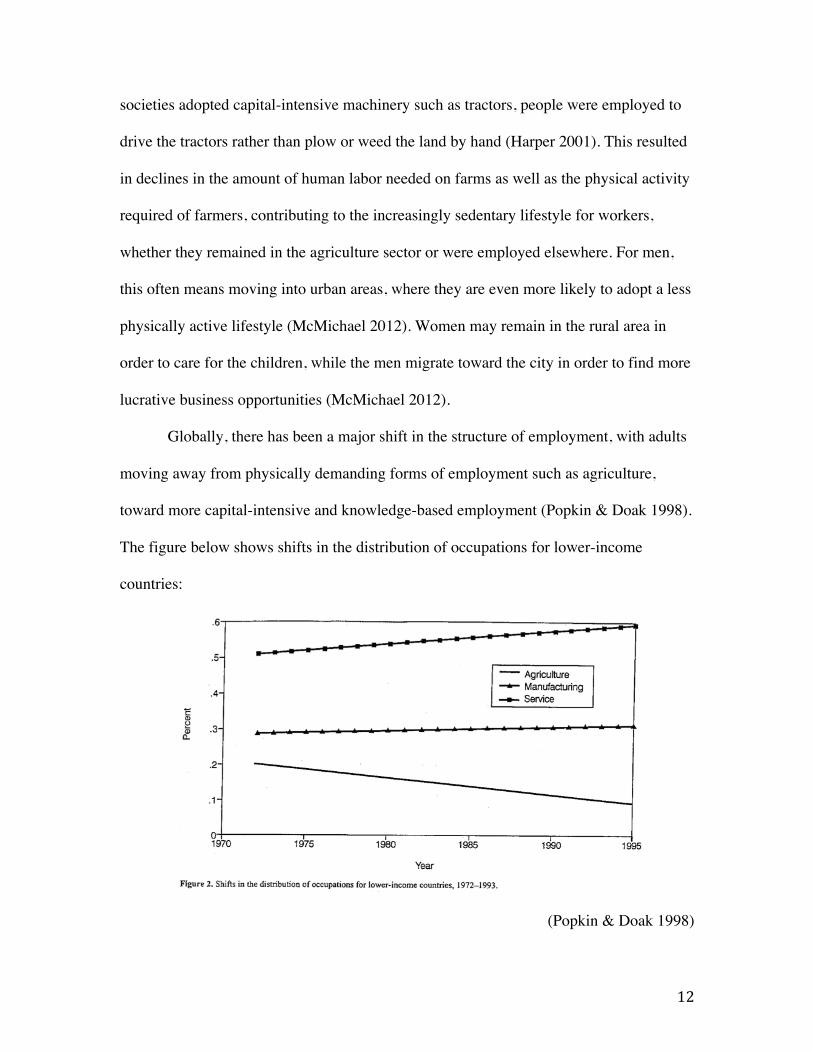
Globally, there has been a major shift in the structure of employment, with adults
moving away from physically demanding forms of employment such as agriculture,
toward more capital-intensive and knowledge-based employment (Popkin & Doak 1998).
The figure below shows shifts in the distribution of occupations for lower-income
countries:
(Popkin & Doak 1998)
13
Early colonialism spurred the fragmentation of agriculture, as land in less-
developed countries was confiscated by colonial powers and men migrated to work on
European estates (McMichael 2008). Small farms in the global south were seen as
“underutilized,” and were said to be better employed by conversion to commercial
agriculture (McMichael 2008). Even today, small farms often lose their ability to
compete and get overtaken by larger, more industrialized farms. This spurs an exodus of
agriculture sector works, and the adoption of more capital-intensive technologies, such as
tractors. What results is a system of food production consisting of farms that are larger,
more commercial, and more specialized in higher-value products (Hazell & Wood 2008).
Small farms disappear, or adapt toward specializing in a high-value product.
Simultaneously, opportunities for farmers to leave the agriculture sector or diversify their
incomes increase with economic growth and development (Hazell & Wood 2008).
Economic growth and development in core nations has redistributed jobs to lower-wage
regions where transnational corporations enhance profitability and Northern consumers
gain access to low-cost products produced overseas (McMichael 2008). These economic
and geopolitical factors directly explain why farmers worldwide have increasingly moved
away from employment in agriculture, the majority gaining opportunities in less
physically demanding jobs and moving from rural to urban areas. The changing nature of
the employment sector, whether the increasingly sedentary nature of work, the adoption
of an urban lifestyle, or both, that have led to declines in physical activity among adults
worldwide.
14
Predictions
Current literature suggests that the relationships between obesity and physical
inactivity, changes in the agriculture employment sector, and trends toward increasing
urbanization can strongly inform us about the causes of obesity in modern society.
However, they fail to link the rise of obesity across nations to changes in the modern
processes of food production, and particularly, to the broader trend toward mechanized
agriculture, involving the use of capital intensive equipment. This is an important gap in
the existing literature because each of these causes of obesity has strong theoretical
connections to the rise of mechanized agriculture.
I seek to demonstrate that the use of tractors across nations can be an important
determinant for obesity, as tractors likely have indirect effects on other factors known to
influence comparative trends in obesity, such as employment changes, urbanization, and
physical inactivity. Specifically, I predict that the increased use of tractors across nations
will lead to a decline in employment in the agriculture sector, which will then lead to
increased urbanization. I predict that for males in particular, urbanization will lead to an
increase in physical inactivity (as males are more likely to seek alternative employment
in cities than females). This in turn will lead to increased obesity rates. I will also control
for other important direct and underlying factors such as diet, schooling, and GDP per
capita.
15
Methods
Sample
The sample includes 188 countries. This represents all countries for which data on
overweight males and females was provided. For a complete list of nations included in
the sample, see Table 1.
Countries that were included in the analyses may yield missing data points for
certain variables. However, the level of missing data on remaining cases is relatively low
and there does not appear to be a pattern to the missing values that would cause bias in
the results. Utilizing the strengths of the structural equation modeling (SEM) technique, I
use full maximum likelihood missing value routine. This is not an imputation procedure,
but rather, the likelihood for the entire sample is found by summing the likelihoods for
each case using whatever information each case has available. Therefore, each country in
the sample contributes the maximum amount of information possible to the estimation.
These estimates are consistent and efficient under the condition that missing data is
missing at random. In SEM, each path or relationship between two variables represents
one regression. A country may not be included in one path if data is missing, but it may
be used in the calculation of a different path between two other variables.

16
Table 1: Nations Included in the Sample (N = 188)
Afghanistan Djibouti Lebanon San Marino Albania Dominica Lesotho Sao Tome and Principe Algeria Dominican Republic Liberia Saudi Arabia Andorra Ecuador Libya Senegal Angola Egypt, Arab Rep. Lithuania Seychelles Antigua and Barbuda El Salvador Luxembourg Sierra Leone Argentina Equatorial Guinea Macedonia, FYR Singapore Armenia Eritrea Madagascar Slovak Republic Australia Estonia Malawi Slovenia Austria Ethiopia Malaysia Solomon Islands Azerbaijan Fiji Maldives Somalia Bahamas, The Finland Mali South Africa Bahrain France Malta Spain Bangladesh Gabon Marshall Islands Sri Lanka Barbados Gambia, The Mauritania St. Kitts and Nevis Belarus Georgia Mauritius St. Lucia Belgium Germany Mexico St. Vincent and the Grenadines Belize Ghana Micronesia, Fed. Sts. Sudan Benin Greece Moldova Suriname Bhutan Grenada Monaco Swaziland Bolivia Guatemala Mongolia Sweden Bosnia and Herzegovina Guinea Morocco Switzerland Botswana Guinea-Bissau Mozambique Syrian Arab Republic Brazil Guyana Myanmar Tajikistan Brunei Darussalam Haiti Namibia Tanzania Bulgaria Honduras Nepal Thailand Burkina Faso Hungary Netherlands Timor-Leste Burundi Iceland New Zealand Togo Cambodia India Nicaragua Tonga Cameroon Indonesia Niger Trinidad and Tobago Canada Iran, Islamic Rep. Nigeria Tunisia Cape Verde Iraq Norway Turkey Central African Republic Ireland Oman Turkmenistan Chad Israel Pakistan Tuvalu Chile Italy Palau Uganda China Jamaica Panama Ukraine Colombia Japan Papua New Guinea United Arab Emirates Comoros Jordan Paraguay United Kingdom Congo, Dem. Rep. Kazakhstan Peru United States Congo, Rep. Kenya Philippines Uruguay Costa Rica Kiribati Poland Uzbekistan Cote d'Ivoire Korea, Dem. Rep. Portugal Vanuatu Croatia Korea, Rep. Qatar Venezuela, RB Cuba Kuwait Romania Vietnam Cyprus Kyrgyz Republic Russian Federation Yemen, Rep. Czech Republic Lao PDR Rwanda Zambia
17
Analytic Strategy
I employ structural equation modeling (SEM) using the statistical software
package AMOS. This allows for the measurement of both direct and indirect effects
between the chosen variables in order to more accurately test my complex hypotheses. A
traditional regression model would not have been able to account for the complex causal
chain that links tractors to obesity rates. The SEM technique allows me to test for indirect
and mediating effects and thus represents the best statistical approach for this line of
research. My research design employs time ordering to help adhere to conditions of
causality, where the dependent variable is measured in time after the independent
variables. The key dependent variables (overweight rates) are measured in the year 2010,
and the predictors are measured in the year 2008.
Dependent Variable
The key dependent variables in my analysis are percent overweight males and
percent overweight females, measured for the year 2010. The overweight prevalence
variable was constructed using data of confirmed overweight percentages and total
population level from the World Bank. The prevalence of overweight is measured by the
percentage of adults over the age of 15 whose weight for height is more than two
standard deviations above the median for the international reference population of the
corresponding age as established by the WHO’s standards (World Bank 2014). This
variable is gender-specific.
Independent Variables
In order to explore the relationship between the mechanization of agriculture and
obesity, I include six interconnected variables that help determine increasing prevalence
18
of overweight males and females. I employ the variable tractors in order to represent the
mechanization of agriculture. This variable refers to the number of wheel and crawler
tractors (excluding garden tractors) in use in agriculture per 100 square kilometers of
arable land at the end of the calendar year 2008, or during the first quarter of 2009.
Arable land includes land defined by the FAO as land under temporary crops, temporary
meadows for mowing or pasture, land under market or kitchen gardens, and land
temporarily fallow (World Bank 2014). I chose to include this variable to capture the
mechanization of agriculture across the countries. The implementation and use of tractors
directly contributes to the decline of employment in the agriculture sector as well as
obesity prevalence. Relevant literature attributes the drastic worldwide shift in the
industrialization of the agricultural production system to the implementation of tractors. I
preformed a log-transformation on this variable to reduce the influence of extreme
outliers.
Another key independent variable employed in the model is employment in
agriculture, measured in 2008. Employees are people who work for a public or private
employer and receive remuneration in wages, salary, commission, tips, piece rates, or pay
in kind. Agriculture corresponds to agriculture, hunting, forestry, and fishing. I chose to
include this variable because I would expect employment in the agriculture sector to
decrease with the increased use of tractors.
I also include percent urban, which refers to people living in urban areas as
defined by national statistical offices, is calculated using World Bank population
estimates and urban ratios from the United Nations World Urbanization Prospects. I
included this variable in my model because changes in employment may facilitate
19
increased urbanization, and current literature largely attributes urban population growth
to shifts in diet and inactivity, leading to the growing obesity epidemic.
Thus another key indicator is, physical inactivity, defined as the percentage of the
population attaining less than 30 minutes of moderate activity five times per week, or less
than 20 minutes of vigorous activity three times per week, or the equivalent (World
Health Organization 2014). This variable was estimated based on self-reported physical
activity as captured by the Global Physical Activity Questionnaire, the International
Physical Activity Questionnaire, or a similar questionnaire containing activity at work/in
the household, for transport, and during leisure time. Physical inactivity, or insufficient
levels of physical activity are determinants of rising obesity prevalence because weight
gain is caused by an imbalance of energy intake. As people become increasingly inactive,
they are expending less energy and therefore gaining weight, thus I control for it in my
analysis. This variable is gender specific and measured in the year 2008.
I have chosen to include animal fat supply in my model to account for dietary
changes that are often pointed to as a causal factor to the obesity epidemic. This variable
reflects the amount of animal fat in food, expressed in grams per day, available for each
individual in the given population during the year 2008. It represents the average supply
available for the population as a whole and does not necessarily indicate what is actually
consumed by individuals. It is impossible due to data limitations to estimate the exact
consumption levels. The animal fat supply variable gives us an idea of the amount of
animal fat consumed by a given population, which can be used as another way to look at
shifts in dietary changes worldwide. I performed a log-transformation on this variable to
account for the influence of extreme outliers.
20
I have also controlled for both GDP per capita and secondary school enrollment
in my model to account for the influence of economic development and modernization. I
measure GDP per capita using Purchasing Power Parity (PPP) rates. GDP is the sum of
gross value added by all resident producers in the economy plus any product taxes and
minus any subsidies not included in the value of the products (World Bank 2014). Data
are in current international dollars. I performed a log-transformation on this variable to
account for the influence of extreme outliers. The total secondary school enrollment rate
represents the ratio of children in the official secondary school age who are enrolled in
secondary school to the population of the official secondary school age children. These
two variables are often used as key determinants of economic development in cross-
national studies.
Results
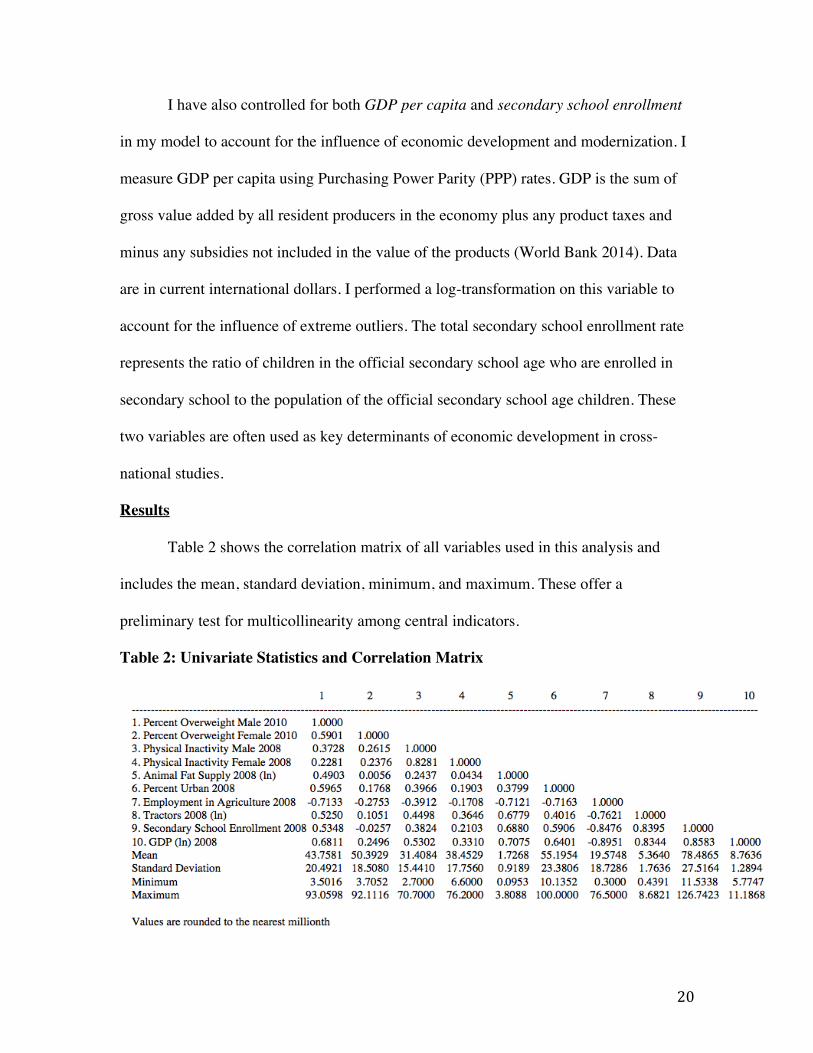
Table 2 shows the correlation matrix of all variables used in this analysis and
includes the mean, standard deviation, minimum, and maximum. These offer a
preliminary test for multicollinearity among central indicators.
Table 2: Univariate Statistics and Correlation Matrix
21
The high magnitude of the relationships among variables demonstrates that many of the
predictor variables are highly correlated. Although this cannot confirm the existence of
multicollinearity solely based on correlations among variables, the strength of the
relationships suggests a high probability that multicollinearity is an issue for the data.
For example, animal fat supply and percent overweight male (0.4903) have a strong,
positive relationship, based on the idea that a relationship of 1.000 indicates a perfectly
correlated relationship between variables. This evidence of highly correlated variables
further warrants the use of SEM analytical method given its ability to provide more
flexible assumptions and create mediating relationships that allow for the unbiased
interpretation of coefficient estimates for models with interconnected independent
variables.
The correlation between key variables tractors and percent overweight male
(0.5250) starts to provide some evidence that there is a causal relationship between my
key independent variable and the dependent variable. The mean value for percent
overweight female is higher than the mean value for percent overweight male at 50.3929.
This may be due to the genetic differences among males and females and the fact that
females have inherently more body fat than males. Higher levels of physical inactivity
among females may also contribute to their elevated overweight percent.
Figures 2 and 3 provide the graphical representation of my SEM results for the
obesity for males and females, respectively. When using SEM, it is important to confirm
that the model fit is appropriate before interpreting the pathway coefficients between
indicators. The fit for the model as a whole is confirmed by the chi-square test, which for
Model 1 for male overweight yields a significance level of .126. When using SEM, we
22
want this value to be non-significant because the null hypothesis predicts that the model
is a good fit for the data. In this case, we do not want to reject the null hypothesis. Here,
the chi-square test is non-significant and we can fail to reject the null hypothesis with a
chi-square statistic of 22.543 and degrees of freedom at 16. Further model fit statistics
also suggest that this is a good fitting model. For example, the Root Mean Squared Error
of Approximation (RMSEA) is less than .05 at .047. The incremental fit index (IFI),
Tucker-Louis index (TLI), and comparative fit index (CFI) are generally required to be to
be as close to 1 as possible, and in my model the estimates for these measures
respectively are: .993, .983, and .992.
The fit for Model 2 for females as a whole is confirmed by the chi-square test,
which yields a significance level of .247. This value is non-significant; therefore we do
not reject the null hypothesis. The chi-square test is non-significant and we can fail to
reject the null hypothesis with a chi-square statistic of 19.420 and degrees of freedom at
16. Further model fit statistics suggest that this is also a good fitting model. For example,
the Root Mean Squared Error of Approximation (RMSEA) is less than .05 at .034. The
incremental fit index (IFI), Tucker-Louis index (TLI), and comparative fit index (CFI)
are generally required to be to be as close to 1 as possible, and in my model the estimates
for these measures respectively are: .996, .990, and .996. It is clear that both the male and
female models are good fits for the data, which allows me to further interpret the findings
and pathways shown in the graphs.
23
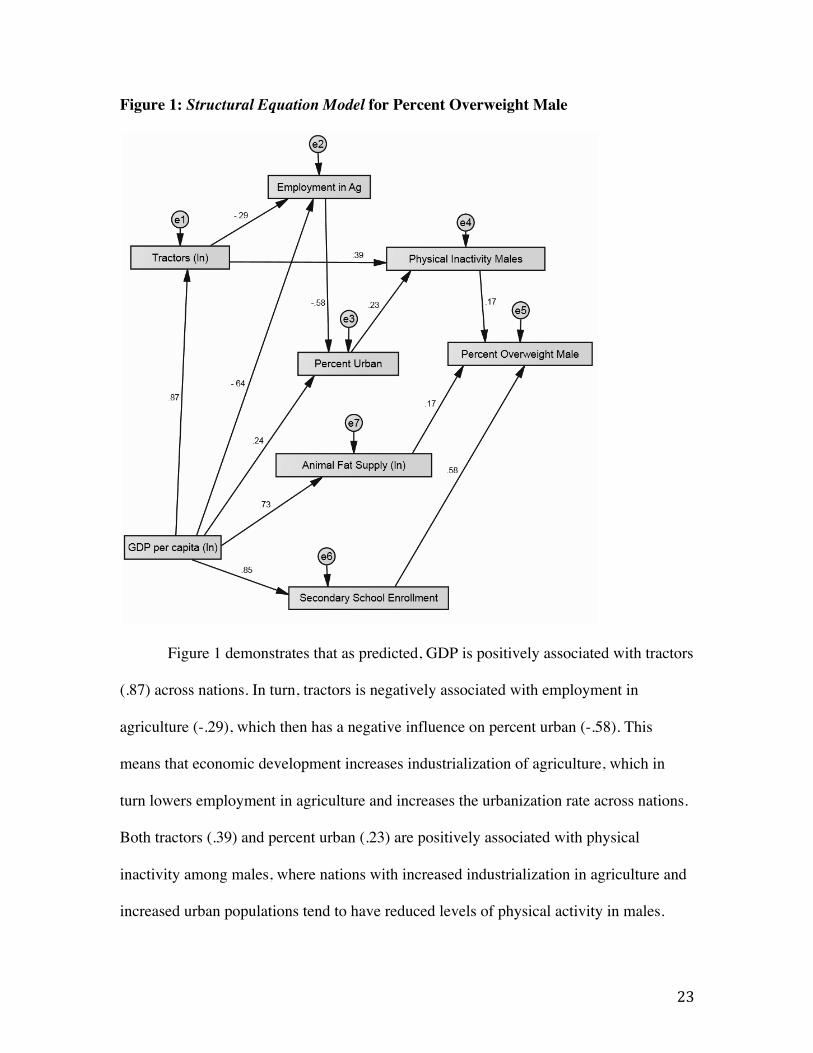
Figure 1: Structural Equation Model for Percent Overweight Male
Figure 1 demonstrates that as predicted, GDP is positively associated with tractors
(.87) across nations. In turn, tractors is negatively associated with employment in
agriculture (-.29), which then has a negative influence on percent urban (-.58). This
means that economic development increases industrialization of agriculture, which in
turn lowers employment in agriculture and increases the urbanization rate across nations.
Both tractors (.39) and percent urban (.23) are positively associated with physical
inactivity among males, where nations with increased industrialization in agriculture and
increased urban populations tend to have reduced levels of physical activity in males.
24
Physical inactivity in males then leads to increased rates of obesity (.30). This set of
findings confirms my key hypothesis.
I also find that GDP per capita, or level of economic development, plays an
important indirect role in a number of additional relevant factors. For example, I find that
GDP per capita is strongly associated (.73) with animal fat supply, which is then
positively associated with percent overweight male (.17). GDP per capita is also strongly
associated with secondary school enrollment (.85), which is positively associated with
percent overweight male (.58). Increases in economic development also increase rates of
urbanization (.24) and lower employment in agriculture (-.64), independent of the effect
of tractors.
25
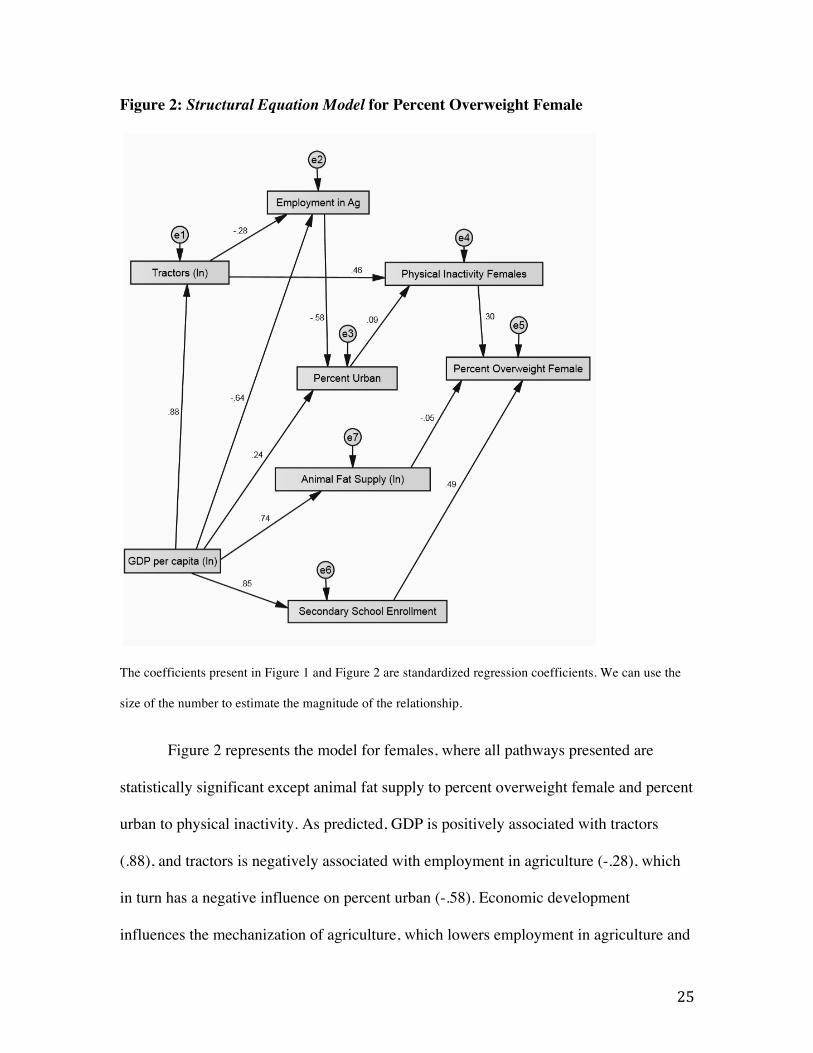
Figure 2: Structural Equation Model for Percent Overweight Female
The coefficients present in Figure 1 and Figure 2 are standardized regression coefficients. We can use the
size of the number to estimate the magnitude of the relationship.
Figure 2 represents the model for females, where all pathways presented are
statistically significant except animal fat supply to percent overweight female and percent
urban to physical inactivity. As predicted, GDP is positively associated with tractors
(.88), and tractors is negatively associated with employment in agriculture (-.28), which
in turn has a negative influence on percent urban (-.58). Economic development
influences the mechanization of agriculture, which lowers employment in agriculture and
26
increases the rate of urbanization. Although percent urban does not have a significant
relationship with physical inactivity among females, physical inactivity is still positively
associated with percent overweight female (.30). This may be because few females are
migrating to urban areas, but physical inactivity still influences percent overweight
female as the mechanization of agriculture may foster a more sedentary lifestyle among
females as well as males, even if they are not the ones migrating to cities. This confirms
my hypothesis that urbanization may be a key determinant of physical inactivity in males
more so than females.
I also find that GDP per capita, or level of economic development, plays an
important role in a number of factors in this model, as it did in the model predicting
overweight males. For example, GDP per capita is strongly associated with animal fat
supply (.74), although animal fat supply is not significantly associated with overweight
females (-.05). This may because animal fat may be more likely to be consumed by the
males in the household who have more social and economic power, especially in less-
developed countries (e.g. McMichael 2012). As in the previous model, GDP per capita is
also strongly associated with secondary school enrollment (.85), which is positively
associated with percent overweight female (.49). Increases in economic development also
increase percent urban (.24) and lower employment in agriculture (-.64), autonomous of
the effect of tractors.
While there is consistency in the overall relevance of tractors and the structure of
many relationships across the models, there are also important differences between the
male and female models. Tractors and physical inactivity seem to have a slighter stronger
association for females rather than males, while the association between tractors and
27
changes in employment in agriculture is very similar in both models. This may be
because in less-developed countries, women are more greatly affected by changes in the
agricultural sector as they traditionally are the ones responsible for growing food in less-
developed nations (e.g. McMichael 2012; Roberts and Thanos 2003). This suggests that
if women stay behind to take care of their family, they may still be less physically active
because they are no longer doing manual labor every day working in agricultural.
Animal fat supply does not seem to have a strong significance in the female
model, which may be because if there is animal fat available in households in less-
developed countries, it often goes to the men and not the women due to patriarchal social
norms. In developed countries, it may be more common for men to consume more animal
fat than women due to cultural norms about eating meat which imply than men should eat
more meat-based diets. Percent urban is not strongly associated with physical inactivity
among women, most likely because women are not the ones moving to urban areas in
less-developed nations because of these changes in the agricultural sector. They may stay
behind to take care of the family while men move to the cities to find work, once
employment opportunities in agriculture decline. As both males and females become less
physically active, possibilities for becoming overweight increase.
Discussion
When looking at both the male and the female model for percent overweight, it
becomes clear that the mechanization of agriculture—as measured by the variable
tractors—is an important underlying factor in explaining cross-national trends in
overweight males and females. The relationship between tractors and obesity is mediated
by many different causal factors identified in prior research. However, the model that I
28
have developed reveals a new and more overarching relationship of the effects of the
industrialization of the food system as a whole on the rising obesity epidemic. The
mechanization of agriculture has greatly transformed our food system, as well as other
aspects of society; the combination of which causes increased cases of overweight adults
across both affluent and developing nations.
Tractors have lessened the need for human labor in the agricultural sector and
they have made it much easier to produce more food at lower costs. As employment in
the agriculture sector declines, previous employees search for work elsewhere, often by
moving to urban areas, and often become less physically active. This especially affects
men, who are moving to urban areas more so than women (McMichael 2012). The
adoption of a more urban lifestyle promotes decreases in physical activity, which tends to
affect males more than females. Urban employment opportunities tend to be much more
sedentary, and transportation to these jobs includes trains, buses, and cars.
Conclusion
The increasing global obesity epidemic poses substantial threats to the health of
the global population, as well as threats to economic growth and development. The U.S.
economy is already experiencing the effects of obesity in increasing costs to the health
care system, which are expected to rise drastically in the coming decades. The medical
care costs attributed to obesity totaled $147 billion in 2008 in the United States alone
(CDC 2012). Undoubtedly, similar trends of rising obesity across less-developed nations
will put significant strain on their economies and health care systems which are already
ill-equipped to deal with costly and chronic conditions that result from obesity.
29
Some progress has been made to alleviate this growing epidemic; yet developing
and less-developed countries appear to be only increasing in the prevalence of obesity as
globalization continues to modernize the food system, as well as introduce more Western,
high-fat diets. The technological advancements in agriculture have ensured food security
for many nations by producing increasing amounts of kilocalories per acre of land. This
increase in food production may be contributing to the problem of obesity even as it
alleviates food insecurity, however, as much of the food produced by capital-intensive
farms is used in processed and convenience foods, as well as for raising meat (Roberts
and Thanos 2003). Transnational agencies have long encouraged the industrialization of
agriculture as a means to develop, arguing that poor nations can increase economic
growth by exporting more primary sector products to core markets (Roberts and Thanos
2003). However, the mechanization of agriculture is clearly having unintended
consequences that could impair health and stifle development over the long term.
Additionally, as affluence increases and populations grow in developing nations, more
and more people will be demanding foods that reflect a more Western diet (McMichael
2012). Both changes in diet and increased industrialization in agriculture stem from
larger patterns in globalization.
We need to address the food system as a whole in order to better address the
threat of rising obesity worldwide. The mechanization of agriculture has allowed for
increased production of food, yet it has also destroyed humans’ relationship with the food
that they consume, transformed labor relations, and facilitated lifestyles that are more
sedentary. Proximate causes of obesity include physical inactivity, dietary changes, and
30
urbanization, but there is a greater force driving these causal indicators, and this force is
mechanization of agriculture.
The goal of this paper was to explore not only this larger context, but also the
interconnections between the factors contributing to obesity. The complex
interrelationships evidenced demonstrate that there is no single cause of increased
obesity, but rather this demographic shift results from the system of food production and
consumption as a whole. An area that can be altered is the food production industry itself.
If industries were made more aware of the impacts of their practices, or took steps to
ensure the healthfulness of their food, consumers would be less able to suffer from the
consequences of unhealthy food. Promoting smaller-scale, organic farms may connect
more people with the food production practices and help combat some of the harmful
impacts of the industrialized food system. This re-localization of agriculture may be
successful in helping to combat increasing rates of obesity.
It is important to acknowledge the limitations of this research. My research was
limited in some instances by the availability and scope of the data. For example, the
variable animal fat supply, is not an ideal measure, in this case providing only a crude
operationalization of changes in diet. Also, urbanization rates do not necessarily reflect
rural-to-urban migrants. Thus, while some measures are not ideal, it is important to
acknowledge in the context of comparative research that while there at times may be
sacrifices in terms of the refinement of certain measures, it is still important to draw on
what data is available to be able to assess large-scale changes in a macro-comparative
context.
31
This research also points to other needed areas of inquiry. Future studies could
focus more on these patterns specifically in developing countries. Reviewed literature
points to China as extremely burdened by changes in the agricultural sector and the
effects of adopting a more Western diet. It would be interesting to explore the cultural
impacts that adopting this diet has on a society and the health of their citizens, especially
as more developing countries develop. It would also be interesting to explore the more
direct effects of global development policies that promote industrialization in agriculture
on the rising obesity epidemic, in order to put this work into even broader context.
Observing trends over time or making distinctions across different types of regions may
be another avenue of further study.
The rising percentage of obesity across the globe has been explored more in
recent literature. Because this is still a relatively new area of study, it warrants more
research and the use of different and more integrative approaches. My goal was to draw
attention to the mechanization of the food system as an overarching driving force in the
increasing obesity epidemic. While the industrialization of agriculture has allowed more
food to be produced globally, it is also facilitating changes to the labor force with
declines in physical activity, that potentially have many negative health consequences
that go beyond obesity. Addressing issues of obesity and resulting health risks will
represent key challenges for all nations in the coming decades.
32
Works Cited
Bell, A. Colin & Barry M. Popkin. 2002. “The road to obesity or the path to prevention: motorized transportation and obesity in China.” Obes Res. 10: 277-283 Bray, George A., Samara Joy Neilsen & Barry M. Popkin. 2004. “Consumption of high-fructose corn syrup in beverages may place a role in the epidemic of obesity.” American Society for Clinical Nutrition. Caballero, Benjamin. 2007. “The Global Epidemic of Obesity.” Center for Human Nutrition, Bloomberg School of Public Health. CDC. 2014. “Overweight and Obesity.” Division of Nutrition, Physical Activity, and Obesity, National Center for Chronic Disease Prevention and Health Promotion. Ehrhardt-Martinez. 1998. “Social Determinants of Deforestation in Developing Countries: A Cross-National Study.” Oxford University Press. Fairweather-Tait, Susan. 2003. “Human Nutrition and Food Research: Opportunities and Challenges in the Post-Genomic Era.” Philosophical Transactions: Biological Sciences, Vol. 358, No. 1437, pp. 1709-1727. The Royal Society. Fitzgerald, Deborah. Reviewed by Douglas Hurt. 2003. “Every Farm a Factory; The Industrial Ideal of American Agriculture.” Yale University Press. Hazell, Peter & Stanley Wood. 2008. “Drivers of Change in Global Agriculture.” Philosophical Transactions: Biological Sciences, Vol. 363, No. 1491, Sustainable Agriculture I, pp. 495-515. The Royal Society. Hill, James O. & John C. Peters. 1998. “Environmental Contributions to the Obesity Epidemic.” Science, New Series, Vol. 280, No. 5368. American Association for the Advancement of Science Low, Serena, Mien Chew Chin & Mabel Deurenberg-Yap. 2009. “Review on Epidemic of Obesity.” Vol 38, No. 1. Annals Academy of Medicine. Magdoff, Fred, John Bellamy Foster, & Frederick H. Buttel. 2000. Hungry for Profit: The Agribusiness Threat to Farmers, Food, and the Environment. Monthly Review Press. McMichael, Philip. 2012. Development and Social Change: A Global Perspective. SAGE Publications, Inc. Misra, Anoop & Lokesh Khurana. 2008. “Obesity and the Metabolic Syndrome in Developing Countries.” The Journal of Clinical Endocrinology & Metabolism, Vol. 93, Issue 11.
33
Olmstead, Alan L. & Paul W. Rhode. 2001. “Reshaping the Landscape: The Impact and Diffusion of the Tractor in American Agriculture.” The Journal of Economic History, Vol. 61, No. 3, pp. 663-698. Cambridge University Press. Owen, Neville & Phillip B. Sparling. 2010. “Sedentary Behavior: Emerging Evidence for a New Health Risk.” Mayo Clinic Proceedings, Vol. 85, No. 12, pp. 1138-1141. Popkin, Barry. M. 1993. “Nutritional Patterns and Transitions.” Population and Development Review, Vol. 19, No. 1, pp. 138-157. Popkin, Barry M. & Colleen M. Doak. 1998. “The Obesity Epidemic Is a Worldwide Phenomenon.” Nutrition Reviews Volume 56, Issue 4, Pages 106-114. Popkin, Barry M. & P. Gordon-Larsen. 2004. “The Nutrition Transition: Worldwide Obesity Dynamics and their Determinants.” International Journal of Obesity. Roberts, J. Timmons & Nikki Demetria Thanos. 2003. Trouble in Paradise: Globalization and Environmental Crisis in Latin America. Routledge. Sobal, Jeffery. 2001. “Social and Cultural Influences on Obesity.” International Textbook of Obesity pp. 305-322. John Wiley & Sons Ltd. Ulijaszek, Stanley J. & Hayley Lofink. 2006. “Obesity in Biocultural Perspective.” Annual Review of Anthropology, Vol. 35, pp. 337-360. Weis, Tony. 2007. The Global Food Economy: The Battle for the Future of Farming. Zed Books. WHO. 2014. “Overweight and Obesity.” The World Health Organization. Web.