the classification of stellar spectra - physics …physics.bk.psu.edu/teaching/astro7.pdf · the...
TRANSCRIPT
A Manual to Accompany Software forthe Introductory Astronomy Lab Exercise
�
Document SM 6: Version 1
Department of PhysicsGettysburg College�
Gettysburg, P�
A 17325
Telephone: (717) 337-6028email: clea@gettysbur� g.edu Contemporary Laboratory
�
Experiences in Astronomy
The Classification of Stellar SpectraStudent Manual
ContentsGoals ....................................................................................................................................................3
Objectives............................................................................................................................................3
Equipment ...........................................................................................................................................4
Background: The History And Nature Of Spectral Classification...............................................4
Introduction T o The Exercise............................................................................................................5
Operating The Computer Program ..................................................................................................6Starting the program
�......................................................................................................................................................6
Part I Browse Through The Help Screens....................................................................................................................6Part II Entering Student Accounting Information.........................................................................................................7Part III Spectral Classification Of Main-Sequence Stars.............................................................................................7
Purpose...................................................................................................................................................................7Method...................................................................................................................................................................7Procedure...............................................................................................................................................................7
Data Table: Practice Spectral Classification..................................................................................13
Optional Exercise: Characteristic Absorption Lines for the Spectral Classes...........................14
Par t IV Taking Spectra Using A Simulated Telescope And Digital Spectrometer ....................15Purpose........................................................................................................................................................................15Method ........................................................................................................................................................................15Procedure.....................................................................................................................................................................15Tips And Hints For The Telescope And Spectrometer................................................................................................20
Appendix I .........................................................................................................................................21
Appendix II .......................................................................................................................................22
Appendix III ......................................................................................................................................23
Version 1.0
PAGE 3
Goals
You should be able to recognize the distinguishing characteristics of different spectral types ofmain-sequence stars. Y� ou should understand how stellar spectra are obtained. You should beable to understand the use of spectral classification in deriving the distances of stars.
Objectives
If you learn to.........
Take spectra using a simulated telescope and spectrometer.
Obtain spectra of good signal to noise levels and store them for further study.
Compare these spectra with standard spectra of known spectral type.
Recognize prominent absorption lines in both graphical and photographic displays of thespectra.
Judge the relative strengths of absorption lines from measurements and comparisons with�
standard spectra.
You should be able to........
Assign spectral classifications to main sequence stars with a precision of one or two tenths ofa spectral type.
Obtain spectra of unknown stars from a simulated field of stars.
Determine the distance of these stars by the method of spectroscopic parallax.
Useful terms you should review using your textbook�
Angstrom Absorption Lines HI Luminosi ty Distance Modulus
Blackbody Temperature Continuum Decl ination Apparent Magnitude
Emmission Lines Balmer Series Intensi ty Ionization States Right Ascension
Main Sequence Neutral Atoms Photon Radiation Laws Absolute Magnitude
Spectrometer Spectral Lines CaII Spectrum
Wavelength Wein's Law Spectral Classifi cation
Student Manual�
PAGE 4
Equipment
PC computer with Windows 3.1 (VGA graphics) and the CLEA
program Spectral Classification�
.
Background: The History And Nature Of Spectral Classification
Patterns of absorption lines were first observed in the spectrum of the sun by the German physicist Joseph von Fraunhoferearly in the 1800’� s, but it was not until late in the century that astronomers were able to routinely examine the spectra ofstars in lar ge numbers. Astronomers Angelo Secchi and E.C. Pickering were among the first to note that the stellarspectra could be divided into groups by the general appearance of their spectra. In the various classification schemes
they proposed, stars were grouped together by the prominence of certain spectral lines. In Secchi’�
s scheme, for instance,stars with very strong hydrogen lines were called type I, stars with strong lines from metallic ions like iron and calcium
were called type II, stars with wide bands of absorption that got darker toward the blue were called type III, and so on.�
Building upon this early work, astronomers at the Harvard Observatory refined the spectral types and renamed them withletters, A, B, C, etc. They also embarked on a massive project to classify spectra, carried out by a trio of astronomers,W�
illiamina Fleming, Annie Jump Cannon, and Antonia Maury. The results of that work, the Henry Draper Catalog(named after the benefactor who financed the study), was published between 1918 and 1924, and provided classifications
of 225, 300 stars. Even this study� , however, represents only a tiny fraction of the stars in the sky.
In the course of the Harvard classification study, some of the old spectral types were consolidated together, andthe types were re-arranged to reflect a steady change in the strengths of representative spectral lines. The order of the�
spectral classes became O, B, A, F , G, K, and M, and though the letter designations have no meaning other than thatimposed on them by history, the names have stuck to this day. Each spectral class is divided into tenths, so that a B0 starfollows an O9, and an A0, a B9. In this scheme the sun is designated a type G2 (see Appendix I, page 22).
The early spectral classification system was based on the appearance of the spectra, but the physical reason forthese differences in spectra were not understood until the 1930’�
s and 1940’s. Then it was realized that, while there weresome chemical dif ferences among stars, the main thing that determined the spectral type of a star was its surface tempera-ture. Stars with strong lines of ionized helium (HeII), which were called O stars in the Harvard system, were the hottest,
�
around 40,000 � o� K, because only at high temperatures would these ions be present in the atmosphere of the star in largeenough numbers to produce absorption. The M stars with dark absorption bands, which were produced by molecules,�
were the coolest, around 3000 � o� K, since molecules are broken apart (dissociated) at high temperatures. Stars with stronghydrogen lines, the A stars, had intermediate temperatures (around 10,000 o� K). The decimal divisions of spectral typesfollowed the same pattern. Thus a B5 star is cooler than a B0 star but hotter than a B9 star.
The spectral classification system used today is a refinement called the MK system, introduced in the 1940’� sand 1950’� s by W. W. Morgan and P.C. Keenan at Yerkes Observatory to take account of the fact that stars at the sametemperature can have different sizes. A star a hundred times larger than the sun, for instance, but with the same surface
�
temperature, will show subtle differences in its spectrum, and will have a much higher luminosity�
. The MK system adds aRoman numeral to the end of the spectral type to indicate the so-called luminosity class: a I indicates a supergiant, a III agiant star� , and a V a main sequence star. Our sun, a typical main-sequence star, would be designated a G2V, for instance.In this exercise, we will be confining ourselves to the classification of main sequence stars, but the software allows youto examine spectra of varying luminosity class, too, if you are curious.
�
The spectral type of a star is so fundamental that an astronomer beginning the study of any star will first try tofind out its spectral type. If it hasn’t already been catalogued (by the Harvard astronomers or the many who followed intheir footsteps), or if there is some doubt about the listed classification, then the classification must be done by taking a�
spectrum of a star and comparing it with an Atlas of well-studied spectra of bright stars. Until recently, spectra wereclassified by taking photographs of the spectra of stars, but modern spectrographs produce digital traces of intensity�
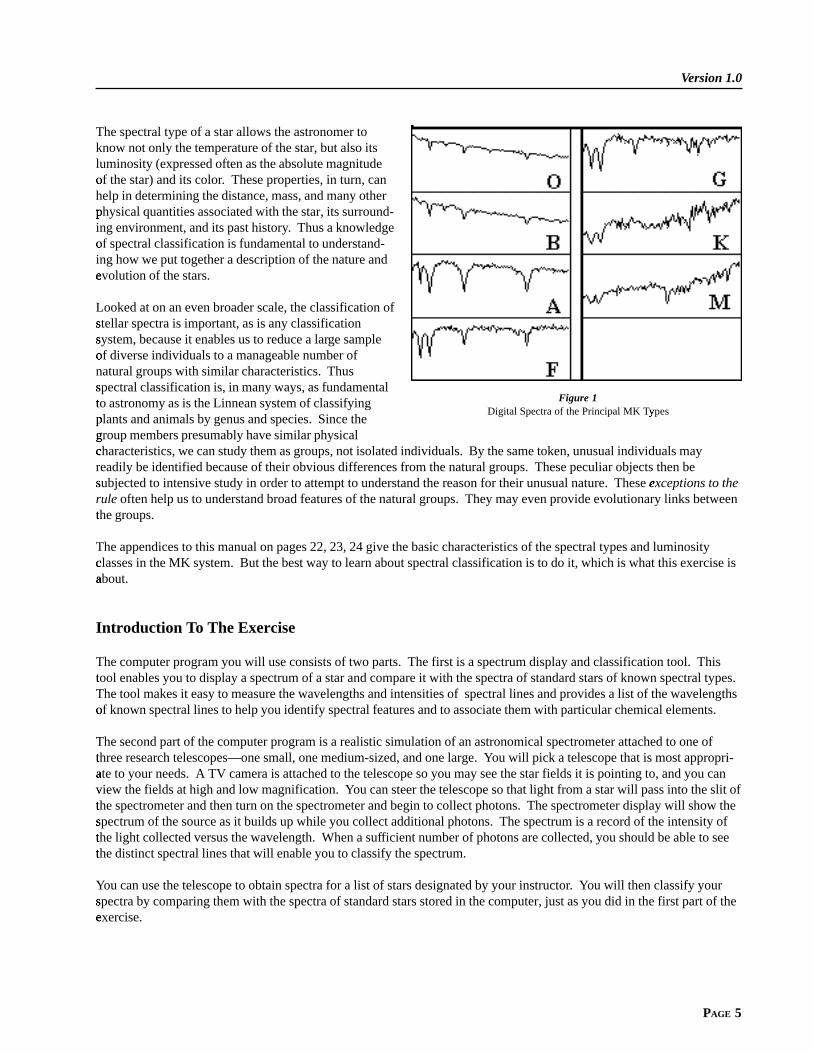
versus wavelength which are often more convenient to study� . FIGURE 1 shows some sample digital spectra from theprincipal MK spectral types; the range of wavelength (the x axis) is 3900 Å to 4500 Å. The intensity (the y axis) of each�
spectrum is normalized, which means that it has been multiplied by a constant so that the spectrum fits into the picture,�
with a value of 1.0 for the maximum intensity� , and 0 for no light at all.
Version 1.0
PAGE 5
The spectral type of a star allows the astronomer toknow not only the temperature of the star, but also itsluminosity (expressed often as the absolute magnitudeof the star) and its color� . These properties, in turn, canhelp in determining the distance, mass, and many otherphysical quantities associated with the star, its surround-�
ing environment, and its past history. Thus a knowledgeof spectral classification is fundamental to understand-�
ing how we put together a description of the nature andevolution of the stars.�
Looked at on an even broader scale, the classification ofstellar spectra is important, as is any classification
system, because it enables us to reduce a lar ge sampleof diverse individuals to a manageable number of�
natural groups with similar characteristics. Thusspectral classification is, in many ways, as fundamental
to astronomy as is the Linnean system of classifying�
plants and animals by genus and species. Since the�
group members presumably have similar physical�
characteristics, we can study them as groups, not isolated individuals. By the same token, unusual individuals may�
readily be identified because of their obvious differences from the natural groups. These peculiar objects then besubjected to intensive study in order to attempt to understand the reason for their unusual nature. These exceptions to the�
rule often help us to understand broad features of the natural groups. They may even provide evolutionary links betweenthe groups.�
The appendices to this manual on pages 22, 23, 24 give the basic characteristics of the spectral types and luminosityclasses in the MK system. But the best way to learn about spectral classification is to do it, which is what this exercise is�
about.�
Introduction T o The Exercise
The computer program you will use consists of two parts. The first is a spectrum display and classification tool. Thistool enables you to display a spectrum of a star and compare it with the spectra of standard stars of known spectral types.�
The tool makes it easy to measure the wavelengths and intensities of spectral lines and provides a list of the wavelengthsof known spectral lines to help you identify spectral features and to associate them with particular chemical elements.�
The second part of the computer program is a realistic simulation of an astronomical spectrometer attached to one ofthree research telescopes—one small, one medium-sized, and one large. Y�
ou will pick a telescope that is most appropri-ate to your needs. A TV camera is attached to the telescope so you may see the star fields it is pointing to, and you can�
view the fields at high and low magnification. Y� ou can steer the telescope so that light from a star will pass into the slit ofthe spectrometer and then turn on the spectrometer and begin to collect photons. The spectrometer display will show the�
spectrum of the source as it builds up while you collect additional photons. The spectrum is a record of the intensity of
the light collected versus the wavelength. When a suf�
ficient number of photons are collected, you should be able to seethe distinct spectral lines that will enable you to classify the spectrum.�
You can use the telescope to obtain spectra for a list of stars designated by your instructor. You will then classify yourspectra by comparing them with the spectra of standard stars stored in the computer, just as you did in the first part of the
exercise.�
Figure 1Digital Spectra of the Principal MK Types�

Student Manual�
PAGE 6
Operating The Computer Program
First, some definitions:
Starting the pr�
ogram
If it has not already been done for you, turn on the computer and start Windows. Your instructor will tell you how to findthe icon for the
�Spectral Classification
� lab. Position the mouse cursor over the icon and double click to start the pro-
gram. If the program is running properly� , you should see a logo screen appear your monitor.
You will use this program in the following order
1. Access and browse through the Help Screens.
2. Login and enter student information.
3. Become familiar with the appearance of stellar spectra by running the Classify Spectra tool and classifying a set�
of practice spectra from stars of various spectral types.�
4. Become familiar with the telescope and spectrometer controls by running the simulated telescopes to take highsignal-to-noise spectra of several stars in the field.
5. Classify the spectra you have obtained and, as a final optional exercise, use that information to determine the�
distance to the unknown stars.�
Part I Br owse Through The Help Screens
Position the cursor over the HELP choice on the menu bar at the top of the screen. If you click on this choice you will openup a window showing several choices. Click on � Topics to see a list of topics with a scrollbar that you can move up and downto see the entire list. Y�
ou can double click on any of these topics highlight a topic and then click on the OK�
button to bringup a window with on-line instructions about how to utilize a particular feature of the program. T� ry this by bringing up thehelp window on log in. You can get rid of a particular help window by clicking the close� choice on the menu bar in the helpwindow� . Try this. Browse through a few of the topics to get an idea of how things are structured.
Note:�
Additional topics are available from HELP when you are operating various parts of the program. Take a lookat the � HELP screens again when you are using the Classification Tool or the Telescopes.
press Push the left mouse button down (unless another button is specifi ed)
release Release the mouse button.
click Quickly press and release the mouse button
double click Quickly press and release the mouse button twice.
click and drag Press and hold the mouse button. Select a new location using the mouse, then release.
menu bar Strip across the top of screen; if you click and drag down a highlighted entry you canreveal a series of choices to make the program act as you wish.
scrol lbar Strip at side of screen with a slider that can be dragged up and down to scroll a windowthrough a series of entries.
Version 1.0
PAGE 7
When you have had a look at the Help function, close all the help windows and proceed to log in to the program as�
described on the following page.�
Part II Entering Student Accounting Information
Position the cursor over the LOG IN... on the menu bar at the top of the logo screen and click the mouse button once toactivate the Student Accounting screen.�
Enter your name (first and last), and those of your lab partners. Do not use punctuation marks. Press tab!
after each name isentered, or � click� in each student block to enter the next name. Enter the Laboratory Table Number or Letter you are seatedat for this experiment if it is not already filled in for you. Y� ou can change and edit your entries by clicking in the appropriatefield and making your changes. When all the information has been entered to your satisfaction, click OK
� to continue, and
click � yes" when you are asked if you are finished logging in. The opening screen of the Spectral Classification �
lab will thenappear� .
Part III Spectral Classification Of Main-Sequence Stars
Purpose
To become familiar with the appearance of the spectra of main sequence stars. To learn how to classify the spectra ofmain sequence stars by comparing a spectrum with an atlas of spectra of selected standard stars.
Method
You will examine the digital spectra of 25 unknown stars, determine the spectral type of each star, and record your resultsalong with the reason for making each classification. The spectra can be compared visually and digitally (point by point)�
with an representative atlas of 13 standard spectra, and by looking at the relative strengths of characteristic absorption�
lines, you will be able to estimate the spectral type of unknown stars to about a tenth of a spectral class, even if they liebetween spectral types of these stars given in the atlas.#
Procedure
1. Select the CLASSIFY SPECTRA
function from the RUN pull-down menu by clicking on the RUN option anddragging down to the �
CLASSIFY SPECTRA
choice (this is a procedure you will use frequently to access itemsand make menu choices). Answer � no to any questions the computer may ask at this time about stored spectra(later you may want to examine these spectra, but not now).
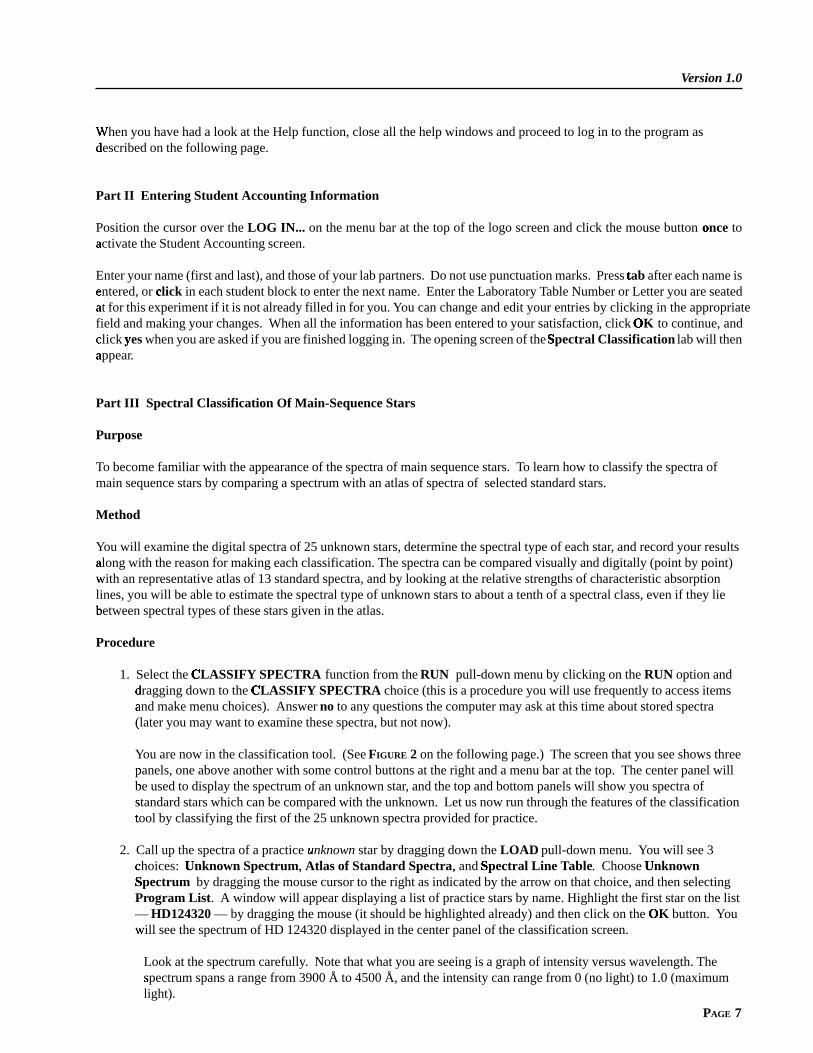
You are now in the classification tool. (See FIGURE 2 on the following page.) The screen that you see shows threepanels, one above another with some control buttons at the right and a menu bar at the top. The center panel will�
be used to display the spectrum of an unknown star#
, and the top and bottom panels will show you spectra ofstandard stars which can be compared with the unknown. Let us now run through the features of the classification
tool by classifying the first of the 25 unknown spectra provided for practice.�
2. Call up the spectra of a practice unknown$ star by dragging down the LOAD pull-down menu. You will see 3choices: � Unknown Spectrum
�, � Atlas of Standard Spectra, and � Spectral Line
� Table. Choose Unknown
�
Spectrum�
by dragging the mouse cursor to the right as indicated by the arrow on that choice, and then selectingProgram List. A window will appear displaying a list of practice stars by name. Highlight the first star on the list— HD124320 — by dragging the mouse (it should be highlighted already) and then click on the OK
� button. You
will see the spectrum of HD 124320 displayed in the center panel of the classification screen.�
Look at the spectrum carefully. Note that what you are seeing is a graph of intensity versus wavelength. Thespectrum spans a range from 3900 Å to 4500 Å, and the intensity can range from 0 (no light) to 1.0 (maximum
light).
Student Manual�
PAGE 8
The highest points in the spectrum, called the continuum� , are the overall light from the incandescent surface of�
the star�
, while the dips are absorption lines% produced by atoms and ions further out in the photosphere of the star.You can measure both the wavelength and the intensity of any point in the spectrum by pointing the cursor at itand clicking the left mouse button. The cursor changes from an arrow to a cross, making it easier to center the�
cursor on the point desired.�
a. Choose any point on the continuum of HD 124320 and record its wavelength and intensity below% .
W&
avelength _____________________Intensity ____________________
b. Measure the wavelength and intensity of the deepest point of the deepest absorption line in the spectrum of'
HD 124320.
W&
avelength _____________________Intensity ____________________
Note that the spectrum you see here, which is typical of those used for spectral classification, does not cover the entire(
range of visible wavelengths, but only a limited portion.
c. Question: If you were to look at this range of wavelengths with your eyes, what color would they appear?�
___________________________________________________
Figure 2The Classification Window
3. Now you want to find the spectral type of HD 124320 by comparing its spectrum with spectra of known type.�
Call up the comparison star atlas by dragging the �
LOAD pull down menu to the Atlas of Standard Spectraoption. A window will open up on which you will see numerous choices, but the atlas you want is the one at the�
top of the list, �
Main Sequence. Select it and click on OK�
to load the atlas.
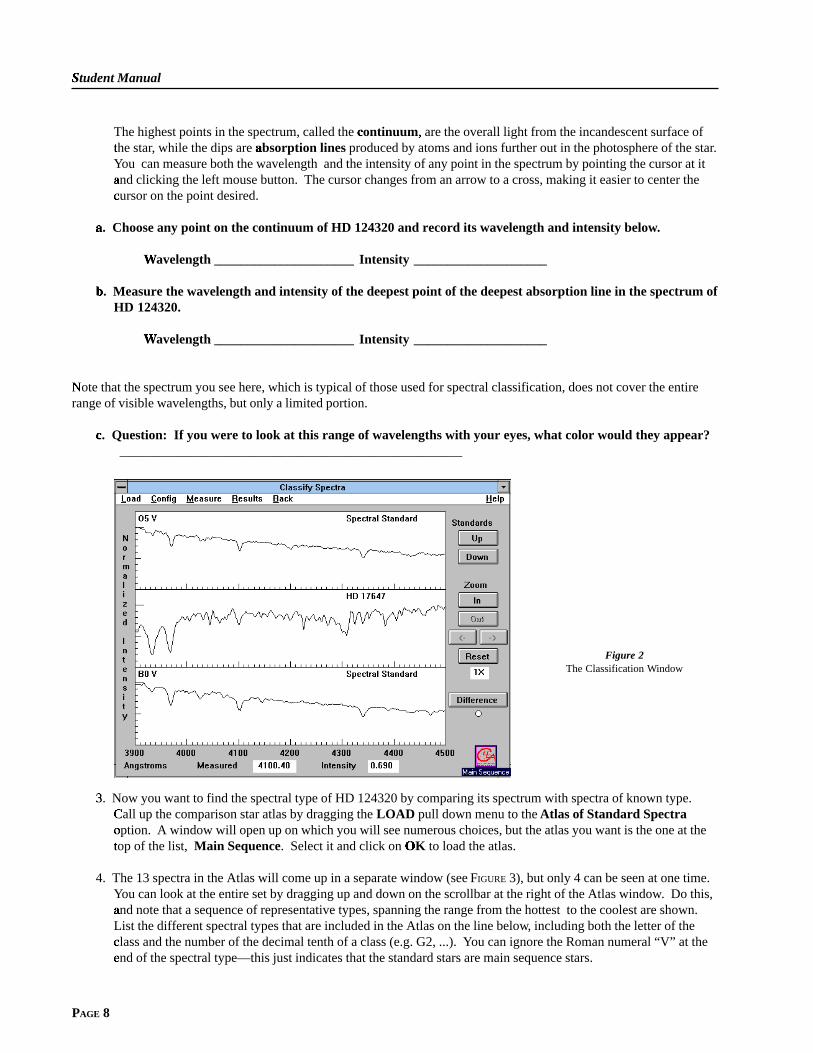
4. The 13 spectra in the Atlas will come up in a separate window (see FIGURE 3), but only 4 can be seen at one time.You can look at the entire set by dragging up and down on the scrollbar at the right of the Atlas window. Do this,and note that a sequence of representative types, spanning the range from the hottest to the coolest are shown.�
List the different spectral types that are included in the Atlas on the line below, including both the letter of theclass and the number of the decimal tenth of a class (e.g. G2, ...). Y� ou can ignore the Roman numeral “V” at theend of the spectral type—this just indicates that the standard stars are main sequence stars.�
Version 1.0
PAGE 9
Spectral types in the atlas�
________________________________________________________
________________________________________________________
_______________________________________________________.
5. Because the spectral types represent a sequence of stars of�
d�ifferent surface temperatures two things are notable: (1) The
d�ifferent spectral types show different absorption lines, and (2)
The overall shape of the continuum changes. The absorption linesare determined by the presence or absence of particular ions at�
d�ifferent temperatures. The shape of the continuum is determined
by the blackbody radiation laws. One of these laws, W#
ein’s Law,states that the wavelength of maximum intensity is shorter when
the temperature of the object is hotter�
. This is described math-ematically in the equation below:�
where� λmax = the wavelength of maximum intensity in Angstroms
(Å)
T = temperature in degrees Kelvin (°K).
a. As you look through the stars in the Atlas, can you tell from the continuum which spectral type is hottest?%
Identify the hottest spectral type? ________________________.
Explain your answer. (Remember that, on all these graphs, 3900 Å is at the left, and 4500 Å is at the right)._____________________________________________
b. At about what spectral type is the peak continuum intensity at 4200 Å ? (4200 Å is about the middle along'
the x axis).!
_______________________________________________
c. What would be the temperature of this star?�
________________________________________________.
6. Now use the comparison spectra to classify the star)
. If you look at the panels behind the Atlas window, you willsee that two of the comparison star spectra have already been placed in the two panels above and below the
spectrum of your unknown star . You can see the three panels more clearly by reducing the Atlas window to anicon (click on the little arrow button at the upper right of the Atlas window to iconize it; if you want the Atlaswindow back, you can double click on the icon again.) Y� ou should see the spectrum of an O5 star is in the toppanel, and the spectrum of the next star in the atlas, a B0, in the bottom panel.�
If neither of these looks quite like a match to your unknown star, you can move through the Atlas by clicking onthe button labeled �
down*
to the upper right of the spectrum display. Continue this until you get a pretty goodmatch. You should find that the best match is with spectral types that have very strong hydrogen lines (more abouthow to identify these later), and not many other features. The stars with the strongest hydrogen lines are aroundspectral type A1.
Figure 3The Spectral Window
λ max
72 9 10T
+
Student Manual�
PAGE 10
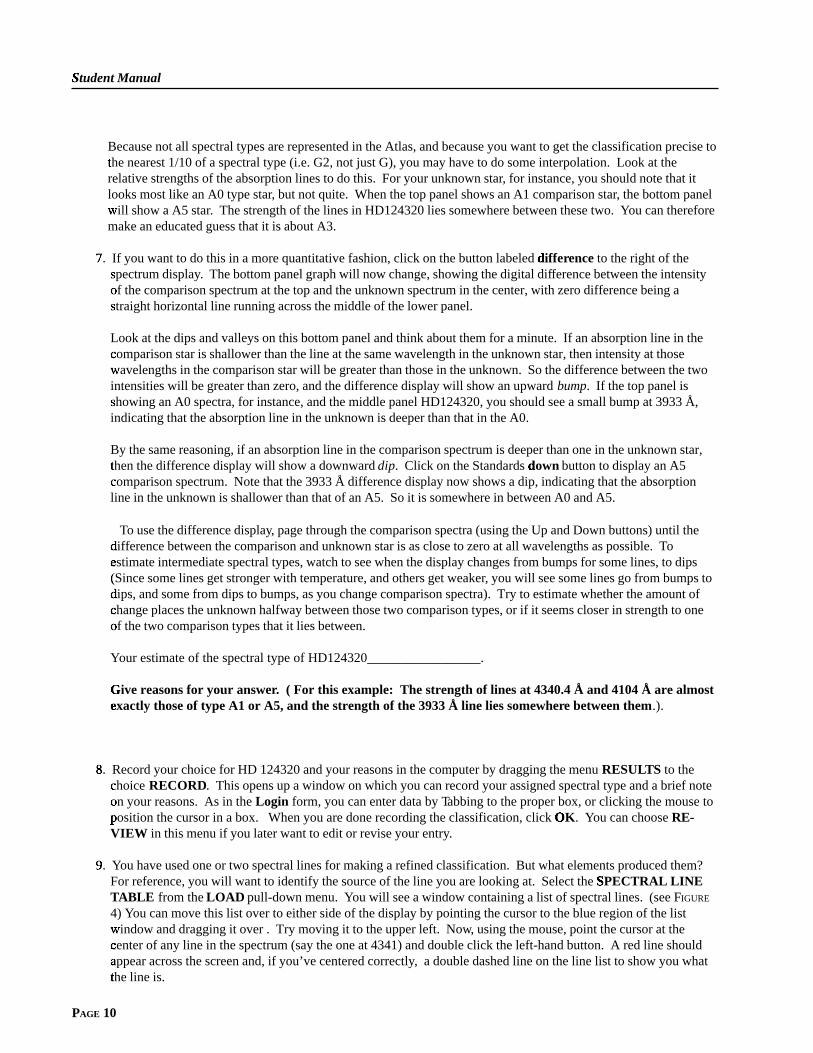
Because not all spectral types are represented in the Atlas, and because you want to get the classification precise tothe nearest 1/10 of a spectral type (i.e. G2, not just G), you may have to do some interpolation. Look at the�
relative strengths of the absorption lines to do this. For your unknown star, for instance, you should note that itlooks most like an A0 type star, but not quite. When the top panel shows an A1 comparison star, the bottom panelwill show a A5 star� . The strength of the lines in HD124320 lies somewhere between these two. You can thereforemake an educated guess that it is about A3.
7. If you want to do this in a more quantitative fashion, click on the button labeled ,
d*
iff erence to the right of thespectrum display . The bottom panel graph will now change, showing the digital difference between the intensityof the comparison spectrum at the top and the unknown spectrum in the center, with zero difference being a�
straight horizontal line running across the middle of the lower panel.
Look at the dips and valleys on this bottom panel and think about them for a minute. If an absorption line in thecomparison star is shallower than the line at the same wavelength in the unknown star, then intensity at those�
wavelengths in the comparison star will be greater than those in the unknown. So the difference between the two�
intensities will be greater than zero, and the difference display will show an upward bump. If the top panel isshowing an A0 spectra, for instance, and the middle panel HD124320, you should see a small bump at 3933 Å,
indicating that the absorption line in the unknown is deeper than that in the A0.
By the same reasoning, if an absorption line in the comparison spectrum is deeper than one in the unknown star,then the difference display will show a downward �
dip. Click on the Standards down*
button to display an A5comparison spectrum. Note that the 3933 Å difference display now shows a dip, indicating that the absorption�
line in the unknown is shallower than that of an A5. So it is somewhere in between A0 and A5.
To use the difference display, page through the comparison spectra (using the Up and Down buttons) until thedifference between the comparison and unknown star is as close to zero at all wavelengths as possible. T�
oestimate intermediate spectral types, watch to see when the display changes from bumps for some lines, to dips�
(Since some lines get stronger with temperature, and others get weaker
, you will see some lines go from bumps todips, and some from dips to bumps, as you change comparison spectra). Try to estimate whether the amount of�
change places the unknown halfway between those two comparison types, or if it seems closer in strength to one�
of the two comparison types that it lies between.�
Your estimate of the spectral type of HD124320_________________.
Give reasons for your answer-
. ( For this example: The strength of lines at 4340.4 Å and 4104 Å are almostexactly those of type A1 or A5, and the strength of the 3933 Å line lies somewher. e between them.).
8. Record your choice for HD 124320 and your reasons in the computer by dragging the menu /
RESULTS to thechoice � RECORD. This opens up a window on which you can record your assigned spectral type and a brief noteon your reasons. As in the � Login form, you can enter data by Tabbing to the proper box, or clicking the mouse toposition the cursor in a box. When you are done recording the classification, click � OK
�. You can choose RE-
VIEW in this menu if you later want to edit or revise your entry.
9. Y0
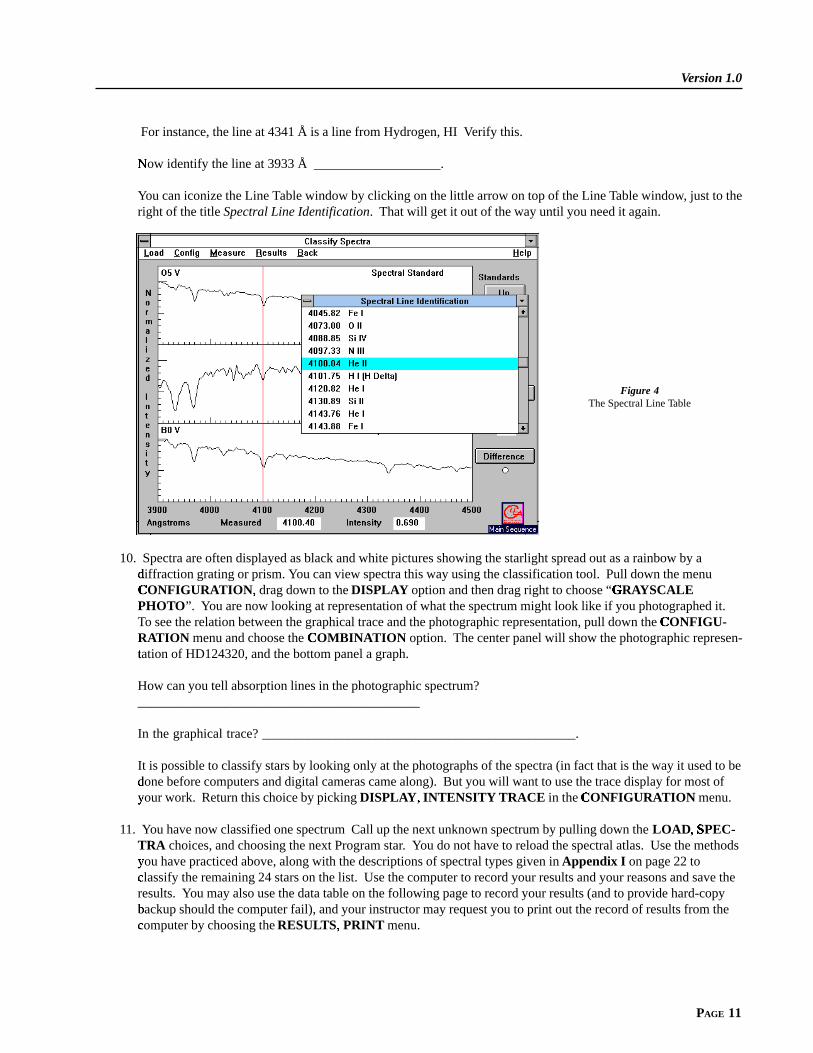
ou have used one or two spectral lines for making a refined classification. But what elements produced them?For reference, you will want to identify the source of the line you are looking at. Select the SPECTRAL LINE
�
TABLE from the LOAD pull-down menu. You will see a window containing a list of spectral lines. (see FIGURE
4) You can move this list over to either side of the display by pointing the cursor to the blue region of the listwindow and dragging it over . Try moving it to the upper left. Now� , using the mouse, point the cursor at thecenter of any line in the spectrum (say the one at 4341) and double click the left-hand button. A red line should�
appear across the screen and, if you’ve centered correctly� , a double dashed line on the line list to show you whatthe line is.�
Version 1.0
PAGE 11
For instance, the line at 4341 Å is a line from Hydrogen, HI Verify this.
Now identify the line at 3933 Å ___________________.(
You can iconize the Line Table window by clicking on the little arrow on top of the Line Table window, just to theright of the title Spectral Line Identification. That will get it out of the way until you need it again.
10. Spectra are often displayed as black and white pictures showing the starlight spread out as a rainbow by adi
�ffraction grating or prism. You can view spectra this way using the classification tool. Pull down the menu
CONFIGURA
TION , drag down to the � DISPLAY option and then drag right to choose “G-
RAYSCALEPHOTO”. You are now looking at representation of what the spectrum might look like if you photographed it.To see the relation between the graphical trace and the photographic representation, pull down the CONFIGU-
RATION menu and choose the COMBINA
TION option. The center panel will show the photographic represen-tation of HD124320, and the bottom panel a graph.
�
How can you tell absorption lines in the photographic spectrum?__________________________________________
In the graphical trace? _______________________________________________.
It is possible to classify stars by looking only at the photographs of the spectra (in fact that is the way it used to bedone before computers and digital cameras came along). But you will want to use the trace display for most of�
your work. Return this choice by picking 1 DISPLAY, � INTENSITY TRACE in the CONFIGURA
TION menu.
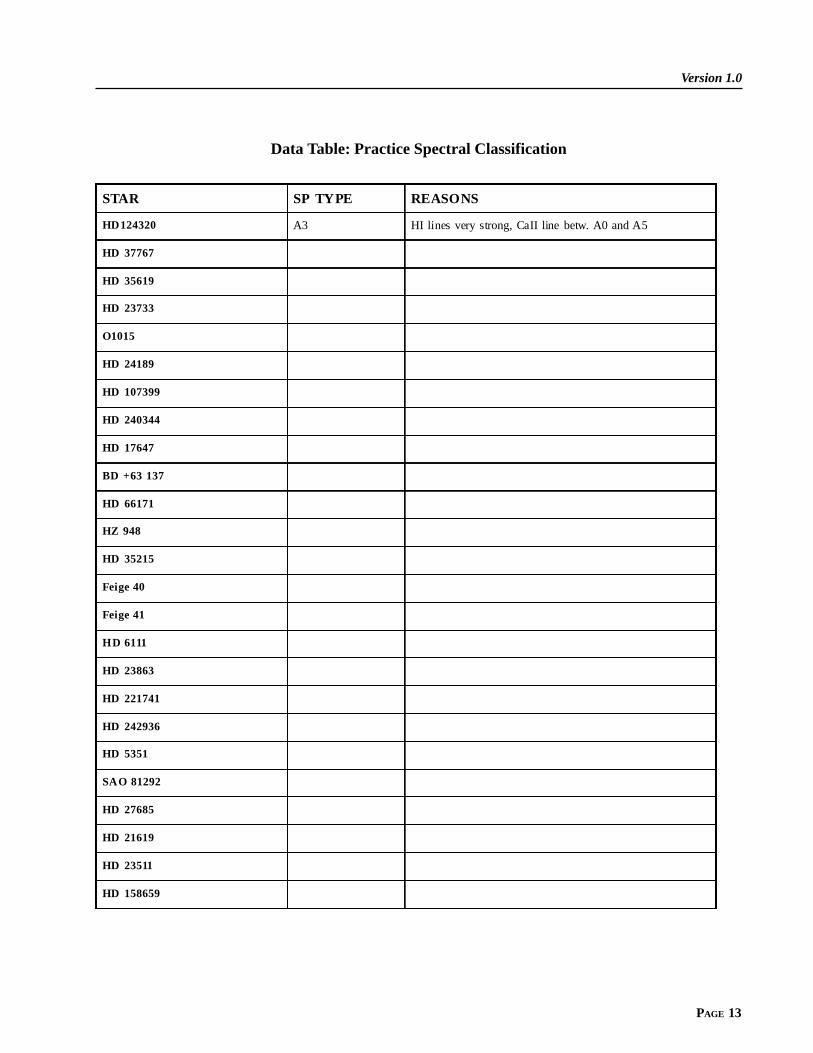
11. You have now classified one spectrum Call up the next unknown spectrum by pulling down the LOAD , � SPEC-�
TRA choices, and choosing the next Program star. You do not have to reload the spectral atlas. Use the methodsyou have practiced above, along with the descriptions of spectral types given in 1 Appendix I on page 22 toclassify the remaining 24 stars on the list. Use the computer to record your results and your reasons and save the�
results. You may also use the data table on the following page to record your results (and to provide hard-copybackup should the computer fail), and your instructor may request you to print out the record of results from the#
computer by choosing the � RESULTS, � PRINT menu.
Figure 4The Spectral Line Table

Student Manual�
PAGE 12
12. Additional Hints
One quick way to go through the spectral atlas, rather than using the 2
up3 and down*
buttons is to open up theAtlas window and double click on a graph panel of the atlas representing the spectrum you want to insert in theupper comparison panel of the Classification window� . The atlas panel selected will be tinted blue to indicatethat it is the one selected. Y
�ou can then iconize the atlas again to see the Classification window more clearly.
You can get close-up views of the spectra by clicking on the Zoom In button to the right of the Classificationwindow� . In zoom mode, the right and left arrows under the Zoom buttons can be used to pan along the spectrumto see wavelengths that are off the edges of the range of view�
. The Reset button returns to full view of thespectrum.
When the Spectral Line List is visible, you can find a particular spectral line on a spectrum by pointing the�
cursor at an entry on the list and double clicking the� left mouse button. A red line will appear on the spectrumdisplay at the wavelength of the line.�
When the Spectral Line List is visible, pointing the cursor at an entry and double clicking the �
right mouse buttonwill bring up a window with further information on the spectral line in question. In many cases several ions�
produce spectral lines at about the same wavelength, so it will not be immediately clear what ion is producing a�
particular absorption line. For instance both CaII and HI produce lines at a wavelength of about 3970 Å . But�
HI lines are strongest in A stars, while CaII lines are strongest in G and K stars. The notes provided in thespectral line information screens can thus be used to decide what ions are producing what absorption lines if you
have a rough idea of the spectral type you are looking at.
Version 1.0
PAGE 13
Data Table: Practice Spectral Classification
STAR SP TY PE REASONS
HD124320 A3 HI li nes very strong, CaII li ne betw. A0 and A5
HD 37767
HD 35619
HD 23733
O1015
HD 24189
HD 107399
HD 240344
HD 17647
BD +63 137
HD 66171
HZ 948
HD 35215
Feige 40
Feige 41
H D 6111
HD 23863
HD 221741
HD 242936
HD 5351
SAO 81292
HD 27685
HD 21619
HD 23511
HD 158659

Student Manual�
PAGE 14
Optional Exercise: Characteristic Absorption Lines for the Spectral Classes.
For each of the 13 representative comparison spectra in the classification tool you can use the cursor and the LineIdentification list to identify the most prominent spectral lines.
Fill in the table below using the information you get by inspecting each spectrum:
Spectr al Type Wavelength of Pr ominentLi nes
Ion or Atom ProducingLi ne
Version 1.0
PAGE 15
Part IV Taking Spectra Using A Simulated Telescope And Digital Spectrometer
Purpose
To learn how to take spectra of stars and to use the spectra to classify the stars. As an optional final exercise, you will usethe spectral classification of a main sequence star
�, along with its apparent magnitude, to determine its distance; this is
called the method of “Spectroscopic Parallax”.�
Method
You will use a simulated telescope equipped with a photon-counting spectrograph, to obtain spectra of an unknown star.You will save the spectrum and, using the techniques learned in Part I, determine its spectral class. Then, using a table ofthe absolute magnitudes of stars versus spectral class, and a measure of the apparent magnitude, you can calculate the
�
distance of the star in parsecs.�
Procedure
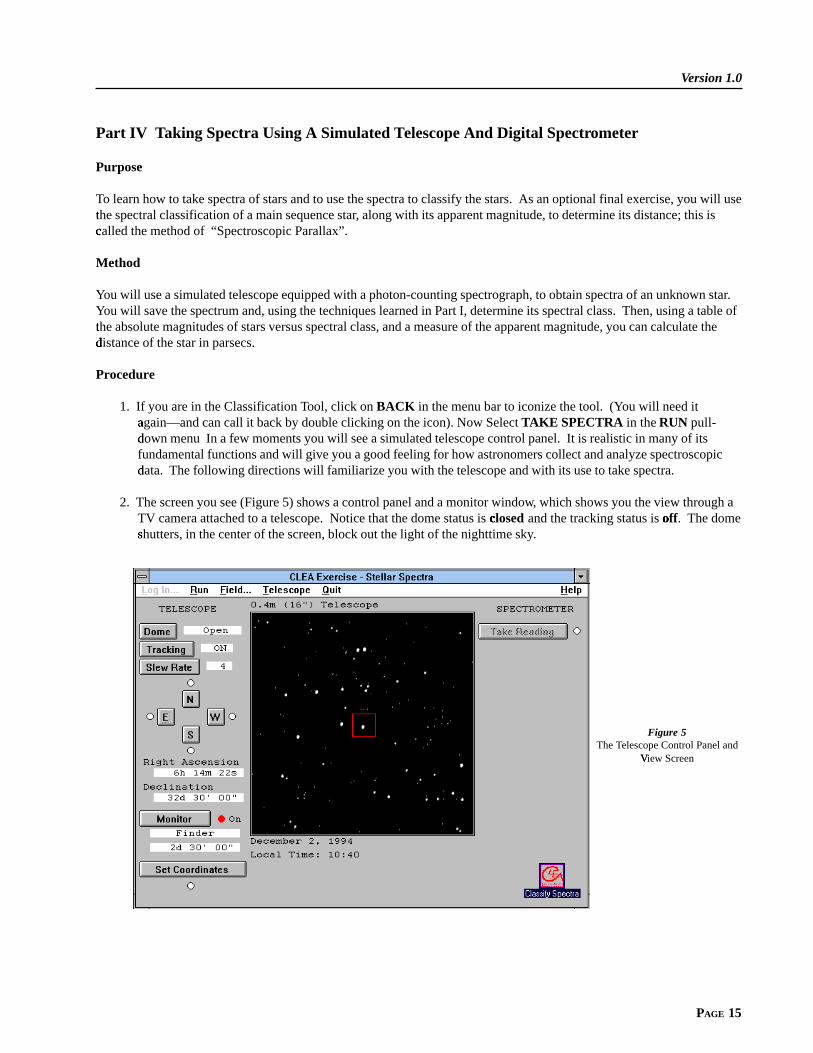
1. If you are in the Classification Tool, click on BACK in the menu bar to iconize the tool. (You will need itagain—and can call it back by double clicking on the icon). Now Select � TAKE SPECTRA in the RUN pull-down menu In a few moments you will see a simulated telescope control panel. It is realistic in many of its�
fundamental functions and will give you a good feeling for how astronomers collect and analyze spectroscopicdata. The following directions will familiarize you with the telescope and with its use to take spectra.�
2. The screen you see (Figure 5) shows a control panel and a monitor window, which shows you the view through aTV camera attached to a telescope. Notice that the dome status is closed� and the tracking status is off . The domeshutters, in the center of the screen, block out the light of the nighttime sky .
Figure 5The Telescope Control Panel and
View Screen
Student Manual�
PAGE 16
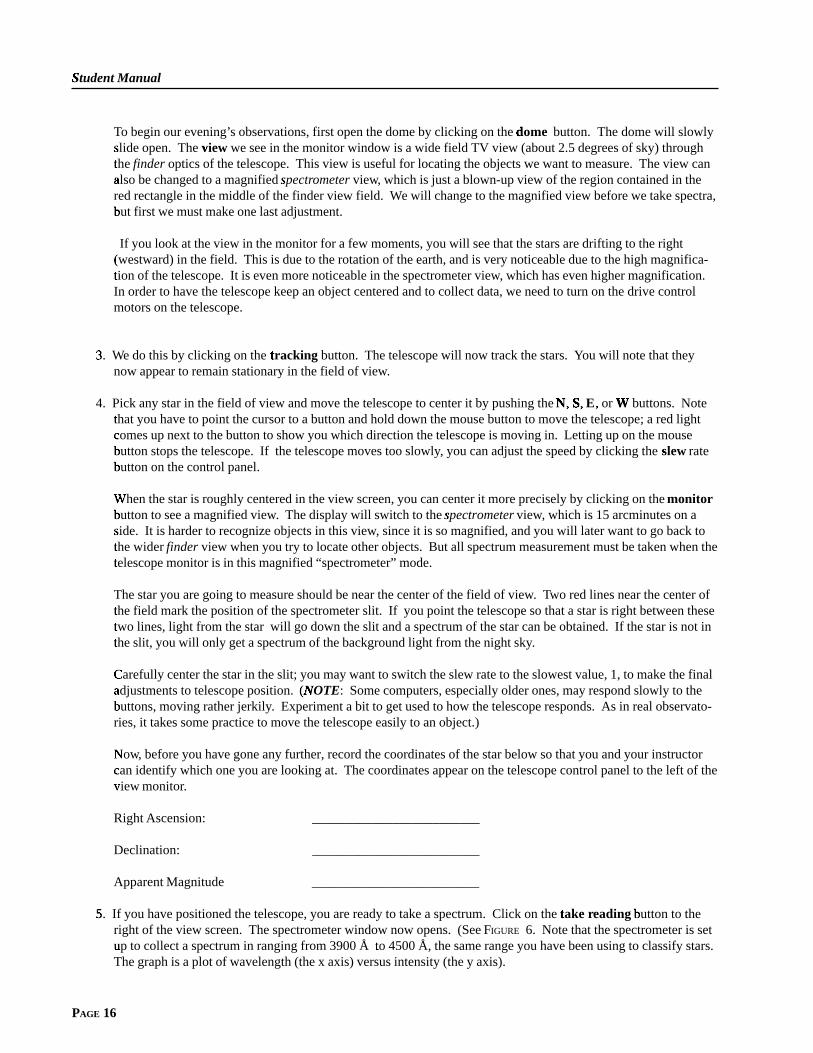
To begin our evening’s observations, first open the dome by clicking on the dome *
button. The dome will slowlyslide open. The view4 we see in the monitor window is a wide field TV view (about 2.5 degrees of sky) throughthe �
finder optics of the telescope. This view is useful for locating the objects we want to measure. The view canalso be changed to a magnified � spectr5 ometer view, which is just a blown-up view of the region contained in thered rectangle in the middle of the finder view field. We will change to the magnified view before we take spectra,but first we must make one last adjustment.
#
If you look at the view in the monitor for a few moments, you will see that the stars are drifting to the right(westward) in the field. This is due to the rotation of the earth, and is very noticeable due to the high magnifica-
tion of the telescope. It is even more noticeable in the spectrometer view�
, which has even higher magnification.In order to have the telescope keep an object centered and to collect data, we need to turn on the drive controlmotors on the telescope.
3. W�
e do this by clicking on the tracking!
button. The telescope will now track the stars. You will note that theynow appear to remain stationary in the field of view.
4. Pick any star in the field of view and move the telescope to center it by pushing the N6
, � S�
, � E, or � W&
buttons. Notethat you have to point the cursor to a button and hold down the mouse button to move the telescope; a red light�
comes up next to the button to show you which direction the telescope is moving in. Letting up on the mouse�
button stops the telescope. If the telescope moves too slowly#
, you can adjust the speed by clicking the slew7 ratebutton on the control panel.#
When the star is roughly centered in the view screen, you can center it more precisely by clicking on the �
monitorbutton to see a magnified view#
. The display will switch to the spectrometer5 view, which is 15 arcminutes on aside. It is harder to recognize objects in this view , since it is so magnified, and you will later want to go back tothe wider �
finder view when you try to locate other objects. But all spectrum measurement must be taken when thetelescope monitor is in this magnified “spectrometer” mode.�
The star you are going to measure should be near the center of the field of view. Two red lines near the center ofthe field mark the position of the spectrometer slit. If you point the telescope so that a star is right between these
�
two lines, light from the star will go down the slit and a spectrum of the star can be obtained. If the star is not in�
the slit, you will only get a spectrum of the background light from the night sky�
.
Carefully center the star in the slit; you may want to switch the slew rate to the slowest value, 1, to make the final�
adjustments to telescope position. � ( NOTE
�: Some computers, especially older ones, may respond slowly to the
buttons, moving rather jerkily#
. Experiment a bit to get used to how the telescope responds. As in real observato-ries, it takes some practice to move the telescope easily to an object.)
Now(
, before you have gone any further, record the coordinates of the star below so that you and your instructorcan identify which one you are looking at. The coordinates appear on the telescope control panel to the left of the�
view monitor� .
Right Ascension: _________________________
Declination: _________________________
Apparent Magnitude _________________________
5. If you have positioned the telescope, you are ready to take a spectrum. Click on the �
take r!
eading button to the#
right of the view screen. The spectrometer window now opens. (See FIGURE 6. Note that the spectrometer is setup to collect a spectrum in ranging from 3900 Å� to 4500 Å, the same range you have been using to classify stars.
�
The graph is a plot of wavelength (the x axis) versus intensity (the y axis).

Version 1.0
PAGE 17
To begin taking a spectrum, click the start/resume count7 choice on the menu bar. The spectrometer will begin tocollect photons from the star� , (and a few from the background sky) one by one. It is a random process, and youwill see photons coming in at all wavelengths like drops of rain spattering randomly over a pavement. For a few�
seconds the pattern may look entirely random, or noisy, especially if the star is very faint. (See Appendix III,�
page 24) But after a while the overall shape of the spectrum begins to take form. The more photons you collect,�
the less noisy and more well-defined the spectrum will appear�
. Because the computer automatically adjusts thespectrum so that the most intense points have a value of 1.0 on the graph, you won’t see the spectrum growing in
height, but you will see it get more sharply defined as more photons are collected.
To stop the data taking and check on the progress of the spectrum, click the stop7 count� button. The computerwill connect the dots representing the intensity at each wavelength to give you a trace of the spectrum.�
Student Manual�
PAGE 18
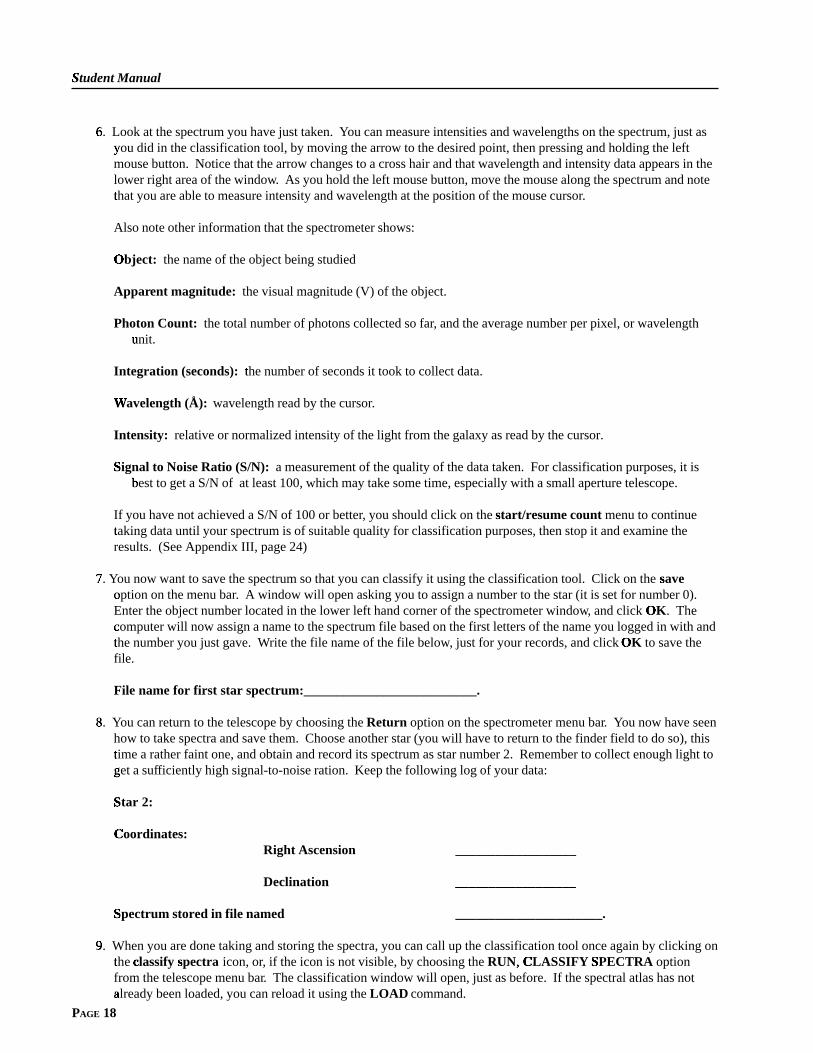
6. Look at the spectrum you have just taken. Y)
ou can measure intensities and wavelengths on the spectrum, just asyou did in the classification tool, by moving the arrow to the desired point, then pressing and holding the left1
mouse button. Notice that the arrow changes to a cross hair and that wavelength and intensity data appears in thelower right area of the window. As you hold the left mouse button, move the mouse along the spectrum and notethat you are able to measure intensity and wavelength at the position of the mouse cursor�
.
Also note other information that the spectrometer shows:
Object:�
the name of the object being studied
Apparent magnitude: the visual magnitude (V) of the object.
Photon Count: the total number of photons collected so far, and the average number per pixel, or wavelengthunit.�
Integration (seconds): the number of seconds it took to collect data.�
W&
avelength (Å): wavelength read by the cursor.
Intensity: relative or normalized intensity of the light from the galaxy as read by the cursor.
Signal to Noise Ratio (S/N):�
a measurement of the quality of the data taken. For classification purposes, it isbest to get a S/N of at least 100, which may take some time, especially with a small aperture telescope.#
If you have not achieved a S/N of 100 or better, you should click on the start/resume count7 menu to continuetaking data until your spectrum is of suitable quality for classification purposes, then stop it and examine the�
results. (See Appendix III, page 24)
7. Y,
ou now want to save the spectrum so that you can classify it using the classification tool. Click on the save7
option on the menu bar� . A window will open asking you to assign a number to the star (it is set for number 0).Enter the object number located in the lower left hand corner of the spectrometer window, and click OK
�. The
computer will now assign a name to the spectrum file based on the first letters of the name you logged in with and�
the number you just gave. W�
rite the file name of the file below, just for your records, and click OK�
to save thefile.
File name for first star spectrum:__________________________.
8. Y/
ou can return to the telescope by choosing the Return option on the spectrometer menu bar. You now have seenhow to take spectra and save them. Choose another star (you will have to return to the finder field to do so), thistime a rather faint one, and obtain and record its spectrum as star number 2. Remember to collect enough light to�
get a suf� ficiently high signal-to-noise ration. Keep the following log of your data:
Star 2:�
Coordinates:
Right Ascension __________________
Declination __________________
Spectrum stored in file named�
______________________.
9. When you are done taking and storing the spectra, you can call up the classification tool once again by clicking on0
the �
classify� spectra7 icon, or, if the icon is not visible, by choosing the RUN, � CLASSIFY
SPECTRA�
optionfrom the telescope menu bar. The classification window will open, just as before. If the spectral atlas has notalready been loaded, you can reload it using the � LOAD command.
Version 1.0
PAGE 19
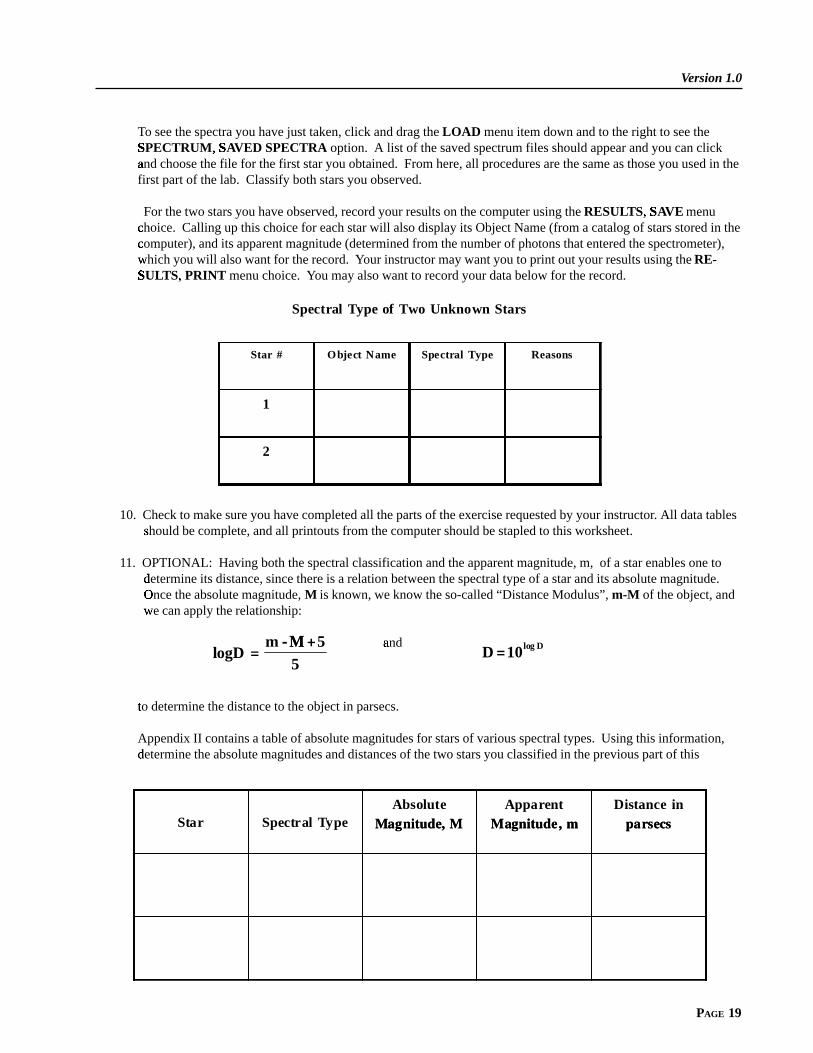
To see the spectra you have just taken, click and drag the LOAD menu item down and to the right to see theSPECTRUM�
, � S�
AVED SPECTRA option. A list of the saved spectrum files should appear and you can clickand choose the file for the first star you obtained. From here, all procedures are the same as those you used in the�
first part of the lab. Classify both stars you observed.
For the two stars you have observed, record your results on the computer using the RESULTS, � SA�
VE menuchoice. Calling up this choice for each star will also display its Object Name (from a catalog of stars stored in the�
computer), and its apparent magnitude (determined from the number of photons that entered the spectrometer),�
which you will also want for the record. Y� our instructor may want you to print out your results using the RE-SUL�
TS, � PRINT menu choice. You may also want to record your data below for the record.
Spectral Type of Two Unknown Stars
Star # Object Name Spectral Type Reasons
1
2
10. Check to make sure you have completed all the parts of the exercise requested by your instructor. All data tablesshould be complete, and all printouts from the computer should be stapled to this worksheet.
11. OPTIONAL: Having both the spectral classification and the apparent magnitude, m, of a star enables one todetermine its distance, since there is a relation between the spectral type of a star and its absolute magnitude.�
Once the absolute magnitude,2
M is known, we know the so-called “Distance Modulus”, m-M of the object, andwe can apply the relationship:�
and�
to determine the distance to the object in parsecs.�
Appendix II contains a table of absolute magnitudes for stars of various spectral types. Using this information,determine the absolute magnitudes and distances of the two stars you classified in the previous part of this�
Star Spectr al TypeAbsolute
Magnitude, MApparent
M agnitude, mDistance in
parsecs
logDm M 5
5D 10log D
Student Manual�
PAGE 20
Question: Ar8
e these stars members of the Milky Way Galaxy of which our Sun is a part? (The Diameterof the Milky W ay is about 30, 000 parsecs)_______________.
Tips And Hints For The Telescope And Spectrometer
• Note that the field of view in the monitor of the telescope is flipped from what you see on a map. North is at the top, but(
East is to the left and West is to the right. This is because, when we look at a map, we are looking at the outside of theglobe, but when we look up at the sky� , we are looking at the inside of the celestial sphere.
• Note that when you move the telescope to the east, the stars appear to move westward on the monitor screen. Think(
about why this is so.�
• For very faint stars, it may be difficult to obtain a signal-to-noise ratio of 100 or more in a reasonable length of time (10minutes, say). There are two reasons for this. First, the fainter stars just deposit photons more slowly in the spectrom-eter� . The second reason is that faint light from the background sky produces a random signal that, though negligiblecompared to bright stars, is now a significant fraction of the light coming into the spectrometer� .
• There are two ways to get a high signal-to-noise ratio for a faint star. The first is to simply observe for a much longertime. The second is to use a larger telescope, which collects more light. The telescope program allows you to access�
two larger telescopes, as you can see if you put the telescope into the finder mode and choose �
Telescope from the menuchoices. The telescope that comes up by default is an 0.4 m telescope (16 in). An 0.9 m and a 4 m telescope are�
available, but on the menu these choices are in light gray� , which means they are inactive for the present. Like all largeprofessional telescopes, you must apply to use the telescopes. There is a choice in the telescope menu that allows you�
to apply for time on a larger telescope. Y�
ou will not automatically get it, but if you do, you can use this option to cutdown the time required to observe faint stars.�
• If you are using one of the larger telescopes, you will note that stars appear brighter in the monitor. That is because thelarger telescopes collect more light, since they have larger mirrors.
Version 1.0
PAGE 21
Appendix I
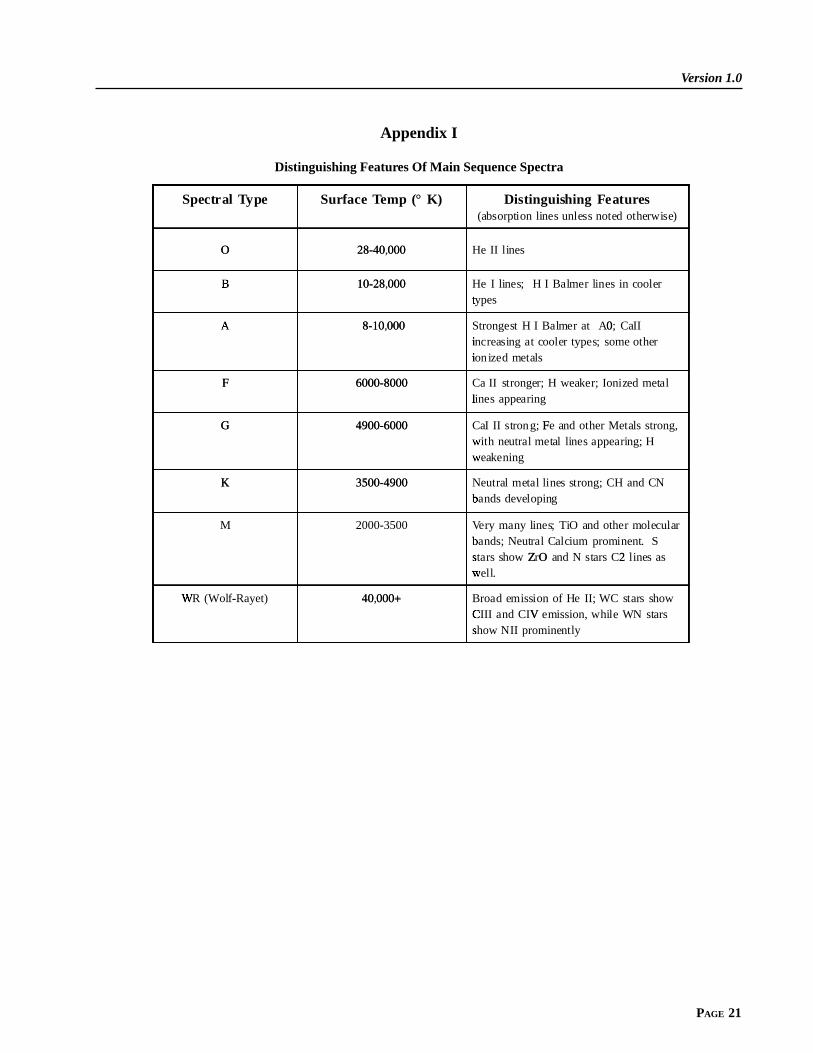
Distinguishing Features Of Main Sequence Spectra
Spectr al Type Surface Temp (° K) Distinguishing Features(absorption lines unless noted otherwise)
O 28-40,000 He II lines
B9
10-28,000 He I lines; H I Balmer lines in coolert:ypes
A;
8-10,000 Strongest H I Balmer at A0; CaIIi<ncreasing at cooler types; some otheri<onized metals
F 6000-8000 Ca II stronger; H weaker; Ionized metall=ines appearing
G 4900-6000 CaI II strong; Fe and other Metals strong,wit> h neutral metal lines appearing; Hwea> kening
K 3500-4900 Neutral metal li nes strong; CH and CNba?
nds developing
M 2000-3500 Very many lines; TiO and other molecularba?
nds; Neutral Calcium prominent. Ssta@ rs show ZrO and N stars C2 lines aswel> l.
WA
R (Wolf-Rayet) 40,000+ Broad emission of He II; WC stars showCIII aB
nd CIV emission, while WN starsshow@ NII prominently
Student Manual�
PAGE 22
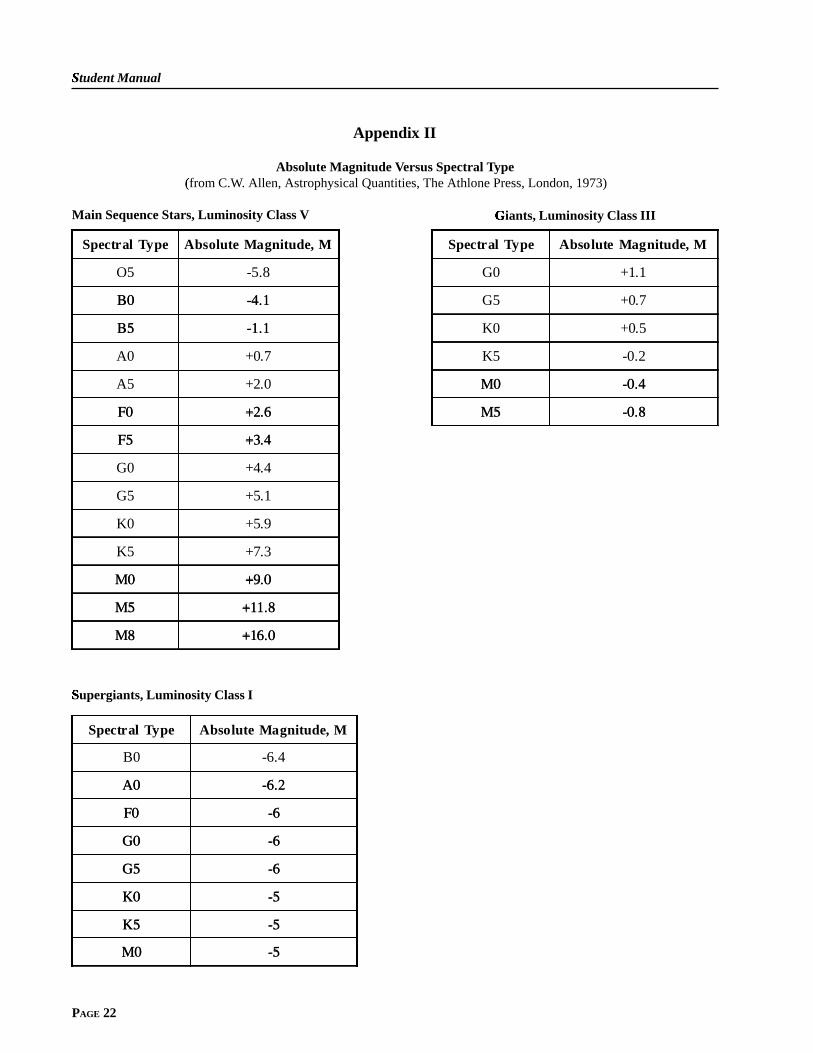
Appendix II
Absolute Magnitude Versus Spectral Type(from C.W
. Allen, Astrophysical Quantities, The Athlone Press, London, 1973)
Main Sequence Stars, Luminosity Class V
Spectr al Type Absolute Magnitude, M
O5 -5.8
B0 -4.1
B5 -1.1
A0 +0.7
A5 +2.0
F0 +2.6
F5 +3.4
G0 +4.4
G5 +5.1
K0 +5.9
K5 +7.3
M0 +9.0
M5 +11.8
M8 +16.0
Spectr al Type Absolute Magnitude, M
G0 +1.1
G5 +0.7
K0 +0.5
K5 -0.2
M0 -0.4
M5 -0.8
Spectr al Type Absolute Magnitude, M
B0 -6.4
A0 -6.2
F0 -6
G0 -6
G5 -6
K0 -5
K5 -5
M0 -5
Giants, Luminosity Class III-
Supergiants, Luminosity Class I�
Version 1.0
PAGE 23
Appendix III
What Is Signal-T&
o-Noise And Why Should I Worry About It?
When astronomers measure the spectrum of a star�
,they want to get a precise value of the intensity of the�
star ’s light at every wavelength of the spectrum. Theproblem they face in measuring a precise spectrum is�
like that of a listener tuning across a radio dial tryingto measure the strength of each station at each�
frequency. Just as it can be hard to hear a weak radiostation because it is swamped by static, so there is a
“noise” that interferes with measurements of the“signal” from the star—the spectrum—that we wantto measure with our spectrograph.�
The noise has two sources. The first is called“background” noise. It comes from light other thanstarlight that gets into our spectrograph. The main
source of this light is light from the nighttime sky
which is present even on moonless nights. The light�
is city lighting reflected from air molecules andclouds, and from the glow of atoms high in the�
atmosphere that emit light when they are bombarded�
by cosmic rays from space. The second source of#
noise, called “photon” or “quantum” noise comesfrom the spectrum of the star itself. It is due to thefact that photons arrive at the spectrograph in arandom fashion. Over long periods of time, thenumber of photons that arrive come in at a fixed rate(which depends on the brightness of the star), but in
any short period of time, the number of arriving�
photons may vary greatly� . Thus if one only collectsphotons for a short period of time, one may get an�
erroneous measure of the intensity (the number of�
photons) at a given wavelength.�
An indication of the amount of noise relative to thesignal you want to measure is called the SIGNAL TO
NOISE RA(
TIO or S/N of the spectrum. If it is high—say 100 or so—you can be sure that the spectrum you
have is pretty precise. If it is low—say 10 or so—therandom background and photon noise will be muchmore evident, and the fine features of the spectrumwill be lost in the noise. It is rather like a faint radio�
signal being so swamped by static that you can’t
make out what the announcer is saying. The way toget a high S/N in general is to collect as many�
photons from the star as possible. Y� ou can do this bytaking as long an exposure as you can, and, if�
possible, using as a telescope with as lar� ge a collect-ing area as possible. The largest telescopes can gethigh S/N spectra in the least amount of time.
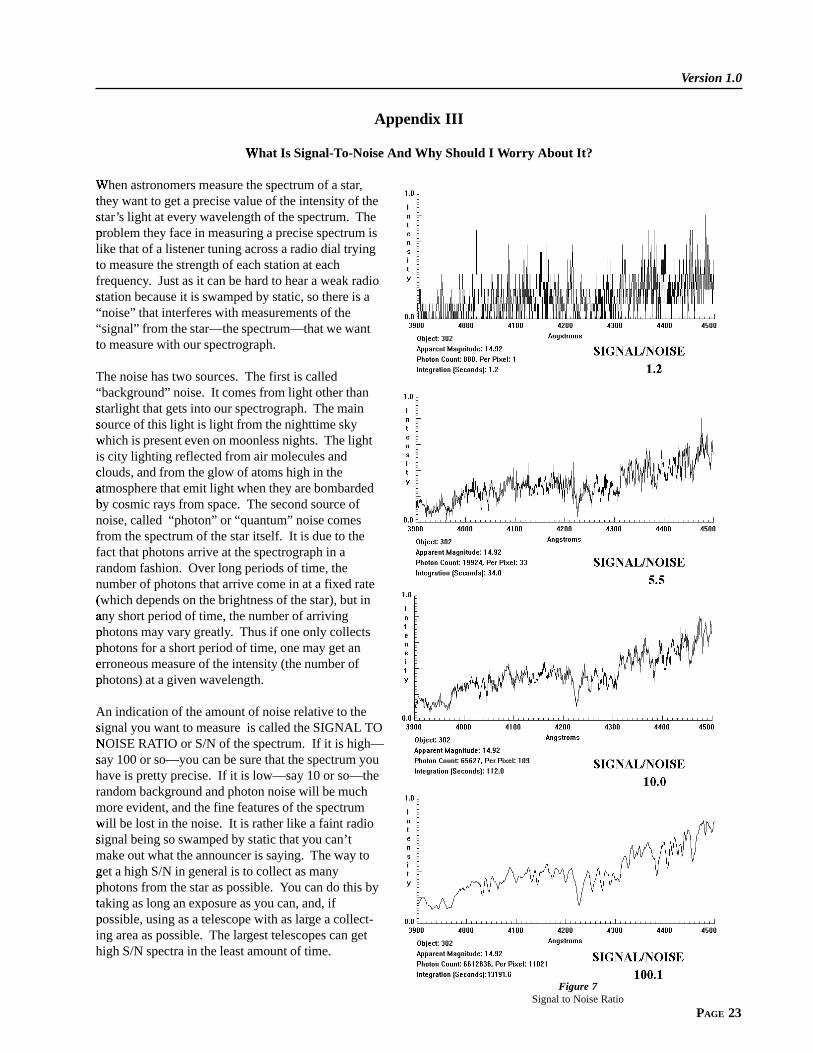
Figure 7Signal to Noise Ratio
Student Manual�
PAGE 24
The accompanying figures located on the previous page, show how important S/N is. They show the spectrum of a 14thmagnitude star taken at successively longer exposures. The shortest exposure has a S/N of 1. This S/N is so low that itis difficult to see any spectral features at all; the spectrum is mostly random noise. What look like absorption lines andemission lines are simply random fluctuations due to the small number of photons collected. On the next longest�
exposure, which has S/N of 5, the overall shape of the spectrum is beginning to appear� , but it is hard to determine whetherthe more shallow absorption lines are due to noise or the star itself. The same is true of the second longest exposure, with�
an S/N of 10. The general features of the stellar absorption lines are now fairly clear� , but the shape of fine detail is stilluncertain due to noise. Only on the longest exposure, with an S/N of 100, can we distinguish between random noise and�
fine spectral features. On a spectrum with S/N of 100 or greater, the intensity at each point is precisely known to within1% of the value shown on the trace, and one can have high confidence that even subtle dips in the spectrum are featuresof the stellar spectra and not chance artifacts of the noise.�
But note that it is not easy to get longer exposures. To increase the S/N from 10 to 100, a factor of 10, required about100 times longer exposure. (The exposure went from under two minutes to over three hours!) This is because the S/Ndue to photon noise increases as the square of the number of photons detected, so to get a factor of 10 increase in S/N,
�
you need a factor of 101 2 increase in the number of photons received. (Note that going from S/N = 5 to S/N =10, a factorof 2, requires an increase in exposure from 34 sec to 1� 12 sec, about a factor of 22 or 4. )