the cern proton synchrotron orbit display · by using various comparative methods, ... element is...
TRANSCRIPT
Particle Accelerators, 1971, Vol 2, pp. 315-324 © GORDON AND BREACH, SCIENCE PUBLISHERS LTD. Printed in Glasgow, Scotland
THE CERN PROTON SYNCHROTRON ORBIT DISPLAYJ. BOUCHERON, D. BOUSSARD, F. OLLENHAUER AND G. SCHNEIDER
CERN, Geneva, Switzerland
In'this paper, the automatic orbit display of the CERN proton synchrotron, which· is now in operational use, isdescribed. It makes use of 40 electrostatic pick-up stations which provide the fast analog signals. These signalsare processed, digitized and fed into the IBM 1800 computer which calculates the corresponding beam positions.The system is able to follow the trajectory of one particular bunch during more than one machine turn. Adescription of the electronic circuitry, including synchronization, acquisition and calibration subsystems, is given.By using various comparative methods, the results of which are presented, the accuracy of the whole system hasbeen determined.
INTRODUCTION
The first proposal for an automatic orbit acquisition and display system at the CERN ProtonSynchrotron (PS) was made by Barbalat as early as1965.(1) A detailed project was then developed andthe first trials on the machine were reported at the1967 High Energy Accelerator Conference.(2) HovVever, some difficulties were encountered during therealization of this first project and it was founddesirable to modify some items of the systenl. Thispaper presents the second generation of orbit displaywhich has been in operational use on the PS since1969.
The originality of the .system is due to thesampling technique used. In fact, the systemmeasures the trajectory of one particular bunch, following it around the machine. This technique givesroughly the same accuracy as the averaging (slower)methods(3,4) used up to now, but in addition itallows a wide variety of measurements to be made(for instance trajectories of kicked bunches). Inorder to separate the closed orbit and some possiblecoherent oscillations of the bunch, we need tomeasure the position of the beam during more thanone turn, approxinlately Q+ 1 betatron wavelengths (Q is the number of betatron wavelengthsper turn).
The systenl makes use of 40 electrostatic pick-up(PU) stations,(5) eight of which are used for secondturn measurements. The position information isobtained from voltages induced in the electrodesafter two operations: difference between voltageson two opposite electrodes and normalization withrespect to intensity. The difference operation is
performed on fast analog signals whereas thedivision operation between difference and suminformation of the same PU station is made ondigitized signals by thePS IBM 1800 computer.
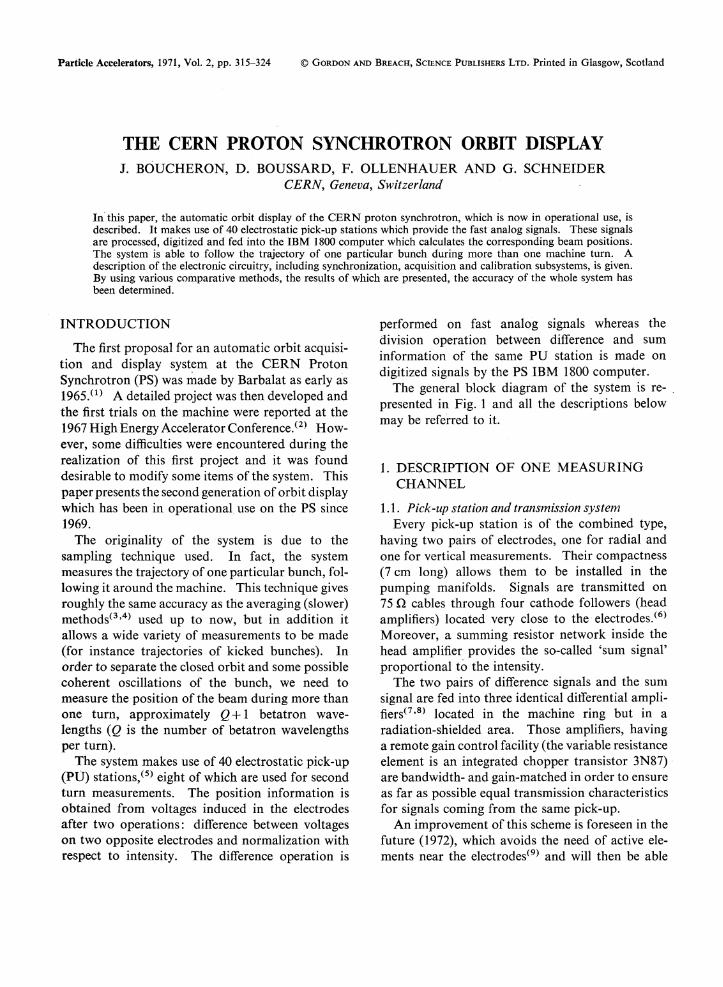
The general block diagram of the system is re- ,presented in Fig. 1 and all the descriptions belowmay be referred to it.
1. DESCRIPTION OF ONE MEASURINGCHANNEL
1.1. Pick-up station and translnission systernEvery pick-up station is of the combined type,
having two pairs of electrodes, one for radial andone for vertical measurements. Their compactness(7 cm long) allows them to be installed in thepumping manifolds. Signals are transmitted on75 Q cables through four cathode followers (headamplifiers) located very close to the electrodes. (6)
Moreover, a summing resistor network inside thehead amplifier provides the so-called 'SUln signal'proportional to the intensity.
The two pairs of difference signals and the sun1signal are fed into three identical ditferential amplifiers(7,8) located in the machine ring but in aradiation-shielded area. Those amplifiers, havinga remote gain control facility (the variable resistanceelement is an integrated chopper transistor 3N87)are bandwidth- and gain-matched in order to ensureas far as possible equal transmission characteristicsfor signals coming from the same pick-up.
An improvement of this scheme is foreseen in thefuture (1972), which avoids the need of active elements near the electrodes(9) and will then be able
RF
Ca
viti
es
Gl
01
01
~ ~w ~ 0'\
~ ......
~ t::d o C n =z= trl ~ o Z
GA
INC
on
tro
l(M
CR
orC
B)
STA
RA
cqui
siti
on
Cal
ibr.
}--0
~
Cal
ibd
.2~
NTE
NS
ITY
RA
NG
ES
ELE
CT
OR
II
II
II
,.1
_.
Ll-
,I
I
):
:48
0UtP
~~--
----
-J
TE
ST
SE
LE
CT
OR
x1,
0
Gl ~
~~'~_~~~~)
An
alo
g~
II
Ou
tpu
ts
C11
I:
II~
CO
"b",
2x
1,0
(Ma
nu
al)
SE
LEC
TO
RI
One
Me
asu
rin
gC
hann
el
r-----"V~-
~e~t~
~~~~
~~?~-
I:C
OU
NTE
R:
II
I:
115
-25
I
I$
Io
rtl
1 15
I:-"
--1c"
70:;-
II
II
I
Ml2
En
do
fa
cqu
isit
ion
(ca
libr.
trig
ge
r)
Am
pli
tud
eC
on
tro
l
MW
M3
0
CB
=C
en
tra
lB
uild
ing
MC
R=
Ma
inC
on
tro
lR
oo
m
MI 2
MW
PL
BIT
PU75~
FIG
.1.
Gen
eral
bloc
kdi
agra
mo
fth
eau
tom
atic
orbi
tac
quis
itio
nan
ddi
spla
ysy
stem
atth
eC
ER
NP
S.
CERN PS ORBIT DISPLAY 317
FIG. 2. Principle of base line restitution.
to cope with the expected increase in beam intensityand radiation level.
Signals are transnlitted through low loss cablesof equal electrical length (for synchronizationpurposes) to the centre of the ring where they aredistributed via emitter followers(10) both to thedigital display system and to the selectors for directobservation on oscilloscope.
The overall bandwidth of the transmission systemis about 40 MHz.
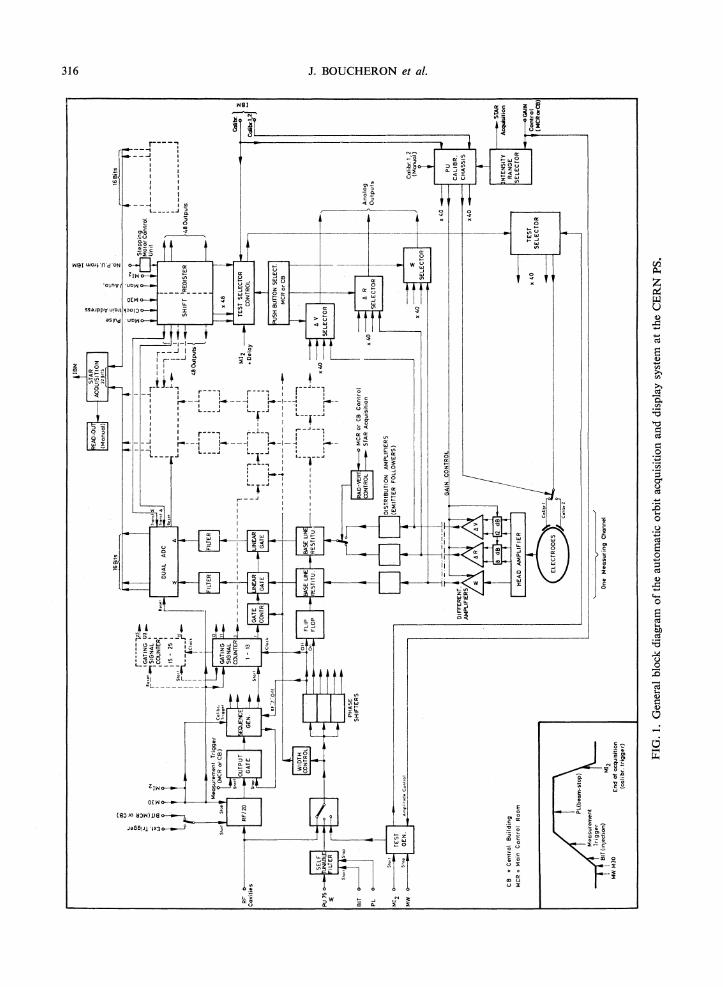
PHOTO 1. Injection
PHOTO 2. High energy
PHOTOS 1 and 2. Base line restitution. PU andclan1ping. signals.
and within each group the distance between stationsis exactly two rf wavelengths. Therefore the sametiming signal may be used for all the stations of thesame group (PU signals are in phase).
Photos 1 and 2 show typical pick-up and timingsignals whereas the· effectiveness of the clamping isdemonstrated on photos 3 and 4 (taken near injection where the base line is strongly displaced).
1.3. Linear gates and filtersIn order to select the desired bunch, two linear
gates per channel are used, one for the sum signal,the other for the difference signal (a switch in theclamping circuit allows the selection between radialand vertical difference signals). Those gatesdescribed in Ref. 12 have 2.5 nsec rise tinle andvery little pedestal and transients.
939597
. 100
Impedance matchingamplifier
AC coupledamplifier
Straight sections: 3-13-23 .5-15 .7-17 .
10-20 .
1.2. Base line restitutionAs the pick-up signals are ac-coupled, it was
found to be interesting to clamp their base line tozero in order to ease digitizing· and polarity detection problems.
By short-circuiting the switch ..') (Fig. 2) during afraction of the time interval between pulses (restitution time), one clamps the base line of the signal tozero and therefore restores the dc component ofthe signal. The following, amplifier (elnitterfollower \-vith offset compensation) simply acts asan impedance matching circuit. For the switch S,we make use of a balanced diode bridge (hot carrierdiodes) driven by a differential alnpIlfier. (11)
The accuracy of this circuit is better than ±1 percent of full signal range (± 1.5 V) for a de base lineshift. Clalnping is effective for base line variationsas fast as 80 kHz ( -- 3 dB point).
The timing signals required to open and close theswitch are provided by the synchronization circuits.The special arrangement of the PU stations in thePS strongly simplifies the synchronization problems.The pick-up -stations can be arranged into fourgroups:
318 J. BOUCHERON et al.
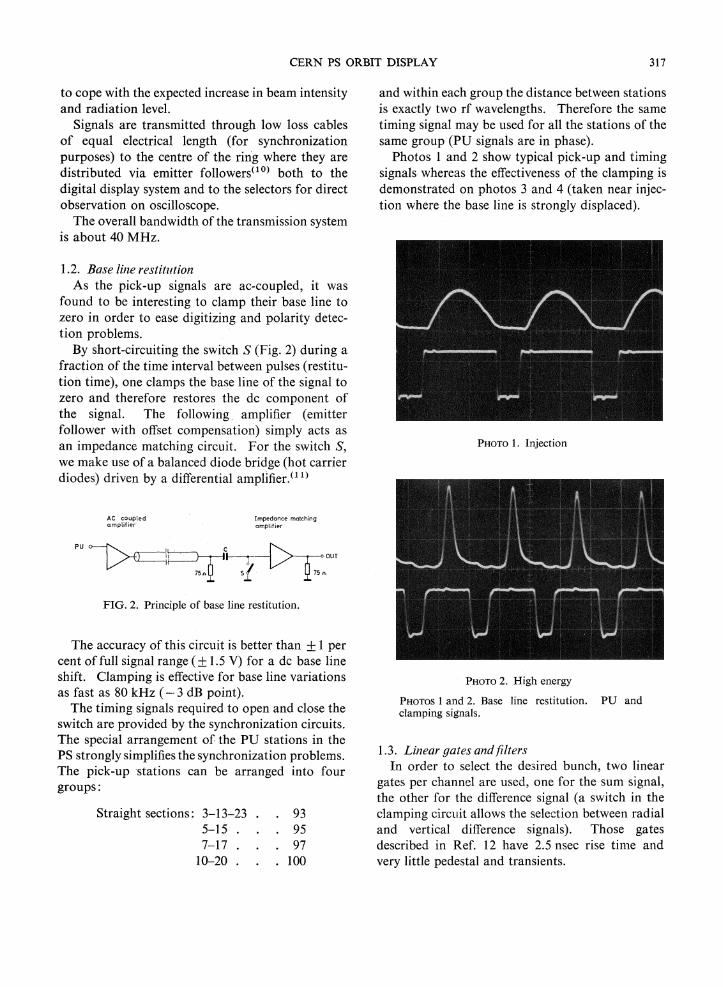
PHOTO 3. Without restitution.
These filters are of the Bessel type (3 elements)and are carefully matched by differential techniques.
Timing signals for opening the gates are providedby the synchronization circuits. A voltage controlled monostablecircuit (one per channel) determines the opening time of the gates, which variesfroill 180 nsec at injection down to 70 nsec at highenergy. The common voltage which controls allthese circuits is roughly proportional to the rfperiod and is provided by a special circuit (widthcontrol), the principle of which is described in 2.1(frequency independent phase shifter).
1.4. Analog to Digital C10nverterThis circuit, of the pulse height to time converter
type, is an improved version of the circuit describedin Refs. 2 and 13. A capacitor C (Fig. 3) is chargedup to the peak amplitude of the pulse through afeedback linearized diode. In order to handle fastpulses, the feedback amplifier requires special care(very fast transistors, compact wiring, loopcompensation techniques). A temperature compensated current source discharges the capacitorduring a time which is proportional to the pulseheight.
Feedback amplifier Co mparator
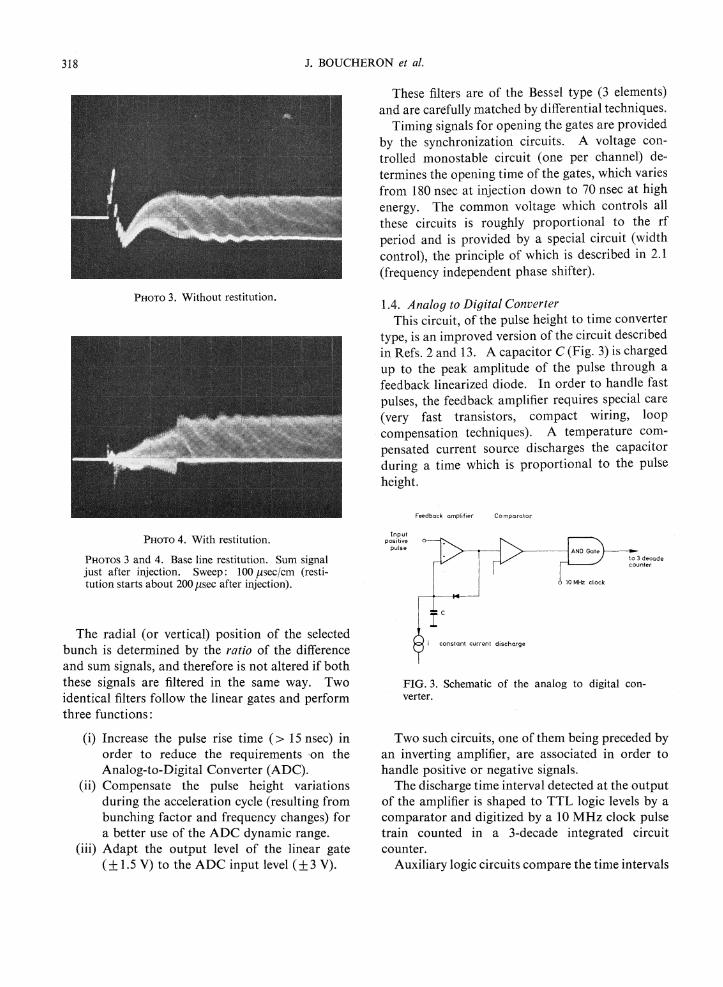
PHOTO 4. With restitution.
PHOTOS 3 and 4. Base line restitution. Sum signaljust after injection. Sweep: 100 flsec/cm (restitution starts about 200 flsec after injection).
Inputpositive
pulse
The radial (or vertical) position of the selectedbunch is determined by the ratio of the differenceand sum signals, and therefore is not altered if boththese signals are filtered in the same way. Twoidentical filters follow the linear gates and performthree functions:
(i) Increase the pulse rise time (> 15 nsec) inorder to reduce the requirements -on theAnalog-to-Digital Converter (ADC).
(ii) Compensate the pulse height variationsduring the acceleration cycle (resulting frombunching factor and frequency changes) fora better use of the ADC dynamic range.
(iii) Adapt the output level of the linear gate(± 1.5 V) to the ADC input level (±3 V).
i constant current discharge
FIG. 3. Schematic of the analog to digital converter.
Two such circuits, one of thenl being preceded byan inveliing amplifier, are associated in order tohandle positive or negative signals.
The discharge time interval detected at the outputof the anlplifier is shaped to TTL logic levels by acomparator and digitized by a 10 MHz clock pulsetrain counted in a 3-decade integrated circuitcounter.
Auxiliary logic circuits compare the tinle intervals
CERN PS ORBIT DISPLAY 319
coming from the positive and negative circuits andprovide the polarity inforn1ation as well as an errordetection (when the base line restitution fails, largepositive and negative components are both presentin'the signal). Overrange detection is also provided.
Conversion time for ±3 V pulses is 100 J.1sec andthe linearity of the circuit reaches ±1 per cent forpulses having more than 10 nsec rise tinle.
Two identical bipolar ADC's are used fordigitizing sum and difference signals.(14) The 16output bits (12 for the 3-decade number, theremaining four allocated to sign, error, overrangeand manual or IBM control data) are transferredto the IBM 1800 computer in parallel, using 'wiredor' techniques and sequential transfer.
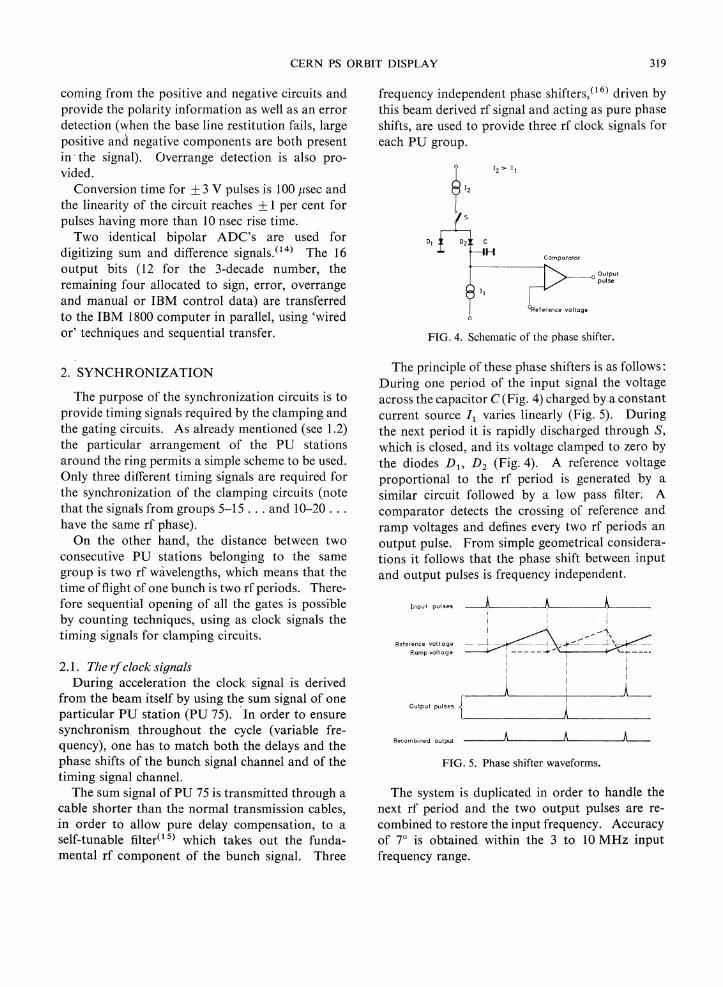
frequency independent phase shifters,(16) driven bythis beam derived rf signal and acting as pure phaseshifts, are used to provide three rf clock signals foreach PU group.
~ '2
5
Comparator
~OUIPU'
L .... pulse
Reference voltage
FIG. 4. Schen1atic of the phase shifter.
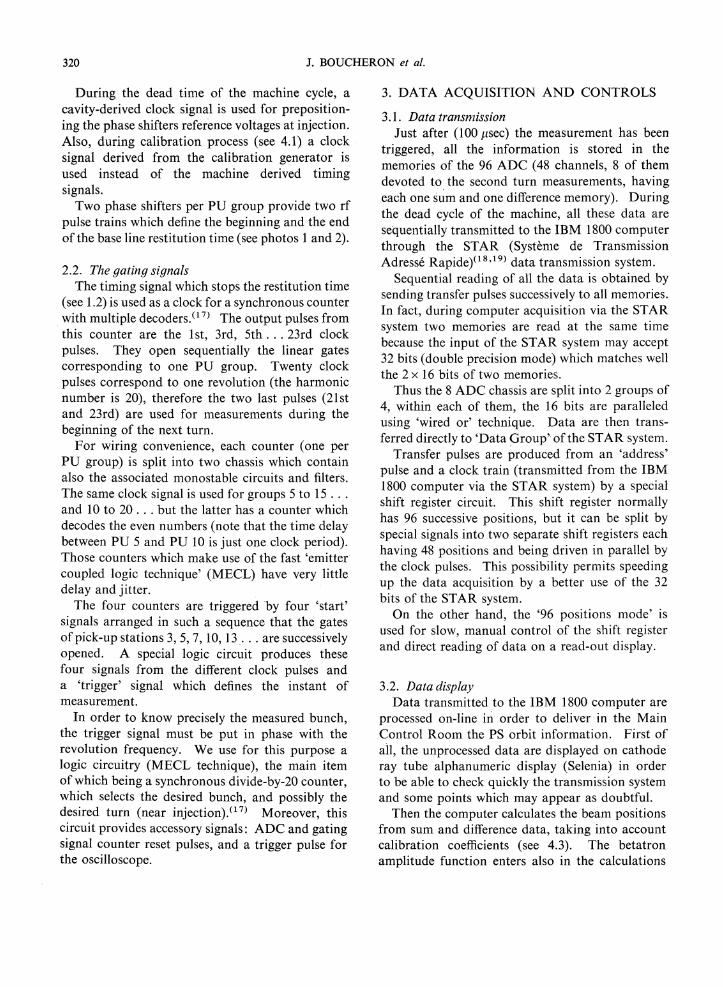
FIG. 5. Phase shifter waveforms.
Oulpu' pulses { ,'-- _
The system is duplicated in order to handle thenext rf period and the two output pulses are recombined to restore the input frequency. Accuracyof 7° is obtained within the 3 to 10 MHz inputfrequency range.
__--JL-- I'--- L-Recombined output
Input pulses
Reference voltage
Ramp voltage
The principle of these phase shifters is as follows:During one period of the input signal the voltageacross the capacitor C (Fig. 4) charged by a constantcurrent source Ii varies linearly (Fig. 5). Duringthe next period it is rapidly discharged through S,which is closed, and its voltage clamped to zero bythe diodes D 1 , D 2 (Fig. 4). A reference voltageproportional to the rf period is generated by asimilar circuit followed by a low pass filter: Acomparator detects the crossing of reference andramp voltages and defines every two rf periods anoutput pulse. From simple geometrical considerations it follows that the phase shift between inputand output pulses is frequency independent.
The purpose of the synchronization circuits is toprovide timing signals required by the clamping andthe gating circuits. As already mentioned (see 1.2)the particular arrangement of the PU stationsaround the ring permits a simple scheme to be used.Only three different timing signals are required forthe synchronization of the clamping circuits (notethat the signals from groups 5-15 ... and 10-20 ...have the same rf phase).
On the other hand, the distance between twoconsecutive PU stations belonging to the samegroup is two rf wavelengths, which means that thetime of flight of one bunch is two rfperiods. Therefore sequential opening of' all the gates is possibleby counting techniques, using as clock signals thetiming signals for clamping circuits.
2. SYNCHRONIZATION
2.1. The rfclock signalsDuring acceleration the clock signal is derived
from the beam itself by using the sum signal of oneparticular PU station (PU 75). 'In order to ensuresynchronism throughout the cycle (variable frequency), one has to match both the delays and thephase shifts of the bunch signal channel and of thetiming signal channel.
The sum signal ofPU 75 is transmitted through acable shorter than the normal transmission cables,in order to allow pure delay compensation, to aself-tunable filter(15) which takes out the fundamental rf component of the bunch signal. Three
320 J. BOUCHERON et ale
During the dead time of the machine cycle, acavity-derived clock signal is used for prepositioning the phase shifters reference voltages at injection.Also, during calibration process (see 4.1) a cloc.ksignal derived from the calibration generator IS
used instead of the machine derived timingsignals.
Two phase shifters per PU group provide two rfpulse trains which define the beginning and the endof the base line restitution time (see photos 1 and 2).
2.2. The gating signalsThe timing signal which stops the restitution time
(see 1.2) is used as a clock for a synchronous counterwith multiple decoders. (17) The output pulses fromthis counter are the 1st, 3rd, 5th ... 23rd clockpulses. They open sequentially the linear gatescorresponding to one PU group. Twenty clockpulses correspond to one revolution (the harmonicnumber is 20), therefore the two last pulses (21stand 23rd) are used for measurements during thebeginning of the next turn.
For wiring convenience, each counter (one perPU group) is split into two chassis which containalso the associated monostable circuits and filters.The same clock signal is used for groups 5 to 15 ...and 10 to 20 ... but the latter has a counter whichdecodes the even numbers (note that the time delaybetween PU 5 and PU 10 is just one clock period).Those counters which make use of the fast 'emittercoupled logic technique' (MECL) have very littledelay and jitter.
The four counters are triggered by four 'start'signals arranged in such a sequence that the gatesof pick-up stations 3, 5, 7, 10, 13 _... are successivelyopened. A special logic circuit produces thesefour signals from the different clock pulses anda 'trigger' signal which defines the instant ofmeasurement.
In order to know precisely the measured bunch,the trigger signal must be put in phase with therevolution frequency. We use for this purpose alogic circuitry (MECL technique), the main itemof which being a synchronous divide-by-20 counter,which selects the desired bunch, and possibly thedesired turn (near injection). (17) Moreover, thiscircuit provides accessory signals: ADC and gatingsignal counter reset pulses, and a trigger pulse forthe oscilloscope.
3. DATA ACQUISITION AND CONTROLS
3.1. Data transnzissionJust after (100 j1sec) the measurelnent has been
triggered, all the information is stored in thememories of the 96 ADC (48 channels, 8 of themdevoted to the second turn measurements, havingeach one sum and one difference memory). Duringthe dead ·cycle of the machine, all· these data aresequentially transmitted to the IBM 1800 computerthrough the STAR (Systenle de TranslnissionAdresse Rapide)(1S,19) data transmission system.
Sequential reading of all the data is obtained bysending transfer pulses successively to all memories.In fact, during computer acquisition via the STARsystem twomemori~s are read at the same timebecause the input of the STAR system may accept32 bits (double precision mode) which matches wellthe 2 x 16 bits of two memories.
Thus the 8 ADC chassis are split into 2 groups of4, within each of them, the 16 bits are paralleledusing 'wired or' technique. Data are then transferred directly to 'Data 9roup'· of the STAR system.
Transfer pulses are produced from an 'address'pulse and a clock train (transmitted fronl the IB~1800 computer via the STAR system) by a speclalshift register circuit. This shift register normallyhas 96 successive positions, but it can be split byspecial signals into two separate shift registers eachhaving 48 positions and being driven in parallel bythe clock pulses. This possibility permits speedingup the data acquisition by a better use of the 32bits of the STAR system.
On the other hand, the '96 positions mode' isused for slow, manual control of the shift registerand direct reading of data on a read-out display.
3.2. Data displayData transmitted to the IBM 1800 computer are
processed on-line in order to deliver in the MainControl Rooln the PS orbit information. First ofall, the unprocessed data are displayed on cathoderay tube alphanumeric display (Selenia) in orderto be able to check quickly the transmission systemand some points which may appear as doubtful.
Then the computer calculates the .beam positionsfrom sum and difference data, taking into accountcalibration coefficients (see 4.3). The betatronamplitude function enters also in the calculations
CERN PS ORBIT nISPLAY 321
in order to display normalized displacements inequivalent millimeters, and to provide the meanradial position.
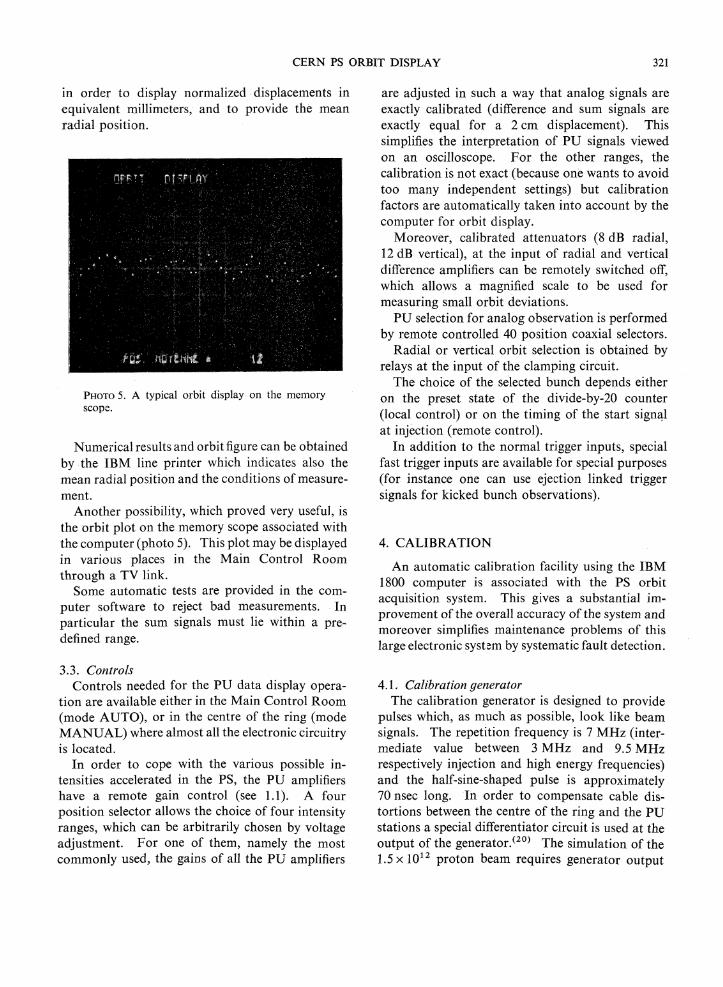
PHOTO 5. A typical orbit display on the memoryscope.
Numerical results and orbit figure can be obtainedby ,the IBM line printer which indicates also themean radial position and the conditions of measurement.
Another possibility, which proved very useful, isthe orbit plot on the menlory scope associated withthe computer (photo 5). This plot may be displayedin various places in the 'Main Control Roomthrough a TV link.
Some automatic tests are provided in the computer software to reject bad measurements. Inparticular the sum signals must lie within a predefined range.
3.3. ControlsControls needed for the PU data display opera
tion are available either in the Main Control Room(mode AUTO), or in the centre of the ring (modeMANUAL) where almost all the electronic circuitryis located.
In order to cope with the various possible intensities accelerated in the PS, the PU amplifiershave a remote gain control (see 1.1). A fourposition selector allows the choice of four intensityranges, which can be arbitrarily chosen by voltageadjustment. For one of them, namely the mostcommonly used, the gains of all the PU amplifiers
are adjusted in such a way that analog signals areexactly calibrated (difference and sum' signals areexactly equal for a 2 cm displacement). Thissimplifies the interpretation of PU signals viewedon an oscilloscope. For the other ranges, thecalibration is not exact (because one wants to avoidtoo many independent settings) but calibrationfactors are autoITlatically taken into account by thecomputer for orbit display.
Moreover, calibrated attenuators (8 dB radial,12 dB vertical), at the input of radial and verticaldifference amplifiers can be remotely switched off,which allows a magnified scale to be used formeasuring small orbit deviations.
PU selection for analog observation is performedby remote controlled 40 position coaxial selectors.
Radial or vertical orbit selection is obtained byrelays at the input of the clamping circuit.
The choice of the selected bunch depends eitheron the preset state of the 'divide-by-20 counter(local control) or on the timing of the start sign",lat injection (remote control).
In addition to the normal trigger inputs, specialfast trigger inputs are available for special purposes(for instance one can use ejection linked triggersignals for kicked bunch observations).
4. CALIBRATION
An automatic calibration facility using the IBM1800 computer is associated with the PS orbitacquisition system. This gives a substantial improvement of the overall accuracy of the system andmoreover simplifies maintenance problems of thislarge electronic system by systematic fault detection.
4.1.- ,Calibration generatorThe calibration generator is designed to provide
pulses which, as much as possible, look like beamsignals. The repetition frequency is 7 MHz (intermediate value between 3 MHz and 9.5 MHzrespectively injection and high energy frequencies)and the half-sine-shaped pulse is approximately70 nsec long. In order to compensate cable distortions between the centre of the ring and the PUstations a special differentiator circuit is used at theoutput of the generator.(20) The simulation of the1.5 x 1012 proton beam requires generator output
322 J. BOUCHERON et ale
voltages as high as 30 V and needs high-power, highfrequency output circuits. The 4 position outputattenuator is coupled to the 4 remote gain controlselector for the best use of the dynamic range of thecircuits.
The generator is triggered every machine cycle,during the dead time of the cycle. The duration ofthe calibration pulse train defined by start andstop pulses is nevertheless. limited by one shotcircuits in order to prevent overheating ofcomponents.
A synchronous timing pulse train delivered bythe generator is used for synchronization purposesduring the calibration process. Note that thefrequency of the calibration signal is constant, whichmeans that phase shift and delay a~e equivalent.Therefore we simply use the phase shifters (see 2.1)with separate reference voltages, switched on everydead time of the machine cycle, in order to putcalibration and timing signals in the correct phase.
4.2. Calibration signal selectionCalibration signals are capacitively coupled to
the electrodes through small adjustable couplingcapacitors.(5) They are adjusted in such a way asto produce an equivalent beam displacement whichis well known (3.2 cm radial-3.6 cm vertical) andcalibrated in the laboratory. Two thermal(mercury) relays, insensitive to the stray magneticfield of the main magnet, connect the calibrationsignal on one pair of electrodes (one radial, onevertical), on the other, or on both in order tosimulate positive, negative and zero displacements.The latter is used only for balancing the cathodefollowers which have a rem'?te gain control facility.The relays are switched either by manual or bycomputer control.
The output of the test generator is coupled to thePU stations vi~ a 40 position test selector whichmakes use of coaxial relays. This selector can bedriven either by push button selectors, or by theshift register (see 3.]) for automatic calibrationpurposes.
During the calibration process (dead time of thecycle) the shift register (which is in its '96 positionmode', see 3.1) is positioned on the desired channelby auxiliary clock pulses. Those pulses can beeither manually or computer generated; in this caseinformation is transmitted by the STAR system
and pulses are delivered by circuits normally usedfor driving stepping motors. Therefore the sameshift register is used both for PU data acquisitionand selection of the channel to be tested. As wewould not like to prevent the orbit acquisitionduring calibration (which is rather long), the shiftregister has to perfornl both tasks within the samemachine cycle. Th.is implies an intermediatememory between the shift register and the testselector because of the slow response of the coaxialrelays. This nlemory (test selector control) is onlyan array ·of 40 D flip flops, and its contents isrenewed each machine cycle.
4.3. AcquisitionThe zero errors of the measuring channels, which
are' mainly due to the clamping circuits, are computerized exactly like beam signals. One has justto trigger the measurement when no beam ispresent. The computer informs the operator ifsome channels have zero errors larger than a giventolerance or rejects the PU station if the erroris very large.
Positive or negative calibration factors (note thatthey may differ because the ADC's have twoseparate positive and negative circuits) are selectedby the computer at the beginning of a test process.Then the shift register is positioned (during thedead time) to the number which corresponds to thechannel to be tested. Therefore the test selectorand the data transmission system are ready foracquisition of test signals.
Ten measurements, taking ten machine cycles,are performed for every channel. The computer isthen able to average out all these data and tocalculate calibration factors from sum and difference averaged values as well as standard deviations(useful for maintenance purposes).
Out of range signals and calibration factors areautomatically eliminated, and the operator is advised of the fault. Then, the next channel is automatically testetl and the process goes on up to thelast station. Next the same process repeats for theother polarity.
Calibration factors corresponding to positive ornegative signals, to radial or vertical measurementsand to the four intensity ranges are stored in thecomputer memory and used for automatic correction of orbit .display.
CERN PS ORBIT DISPLAY 323
Other simplified routines are also available, whichpermit, for instance, the calibration of only onechannel.
5. RESULTS AND CONCLUSIONS
During the development of the system a largenumber of comparative beam measurements havebeen made using both the conventional oscilloscopet~chnique and this new automatic display. Theaim was mainly to prove that digitizing the PUsignals was possible without losing accuracy.
More severe tests are comparisons between PUdata and position information given by othermeans. Absolute position measurements usinginternal targets, although they confirm PU data, arenot very interesting because only a limited numberof pick-ups can be tested. The most interestingtechnique is to produce a well known bunchtrajectory perturbation.
Two well-located dipoles which are an integralnumber of half betatron wavelengths apart are usedto produce between thenl a sinusoidal perturbationof the closed orbit which is measured by the orbitdisplay system. Deviations from the theoreticalvalues were obtained from a large number ofperturbations (up to 40 mm peak"to peak betatronoscillation amplitude) and their root mean squarevalue is about 1 mm. This value represents roughlythe statistical measured accuracy of the wholesystem.
It is also possible to obtain the accuracy bymeasuring coherent betatron oscillations excited bya kicker .magnet normally used for ej~ction purposesand carefully calibrated. These measurements,extended over 5 Q betatron oscillations (5 turns)gave the same results.
Another method is to vary the mean radialposition of the beam (for a given magnetic field)and to compare the average beam displacementgiven by the orbit display, and the shift of therevolution frequency.. We performed these testsboth at low and high energy (+20 to - 20 mm displacements) and their results confirm the, 1 mmaccuracy figure of the system.
In conclusion, although the authors are wellaware that the system could have been designedmore simply and cheaply (some historical ,reasonsplayed a certain role here), the orbit display, which
went into operation more than one year ago, hasproved very useful for the experiments on the PSas well as for normal running of the machine.
ACKNOWLEDGEMENTS
We ~10uld like to acknowledge the support ofG. Plass, Head of the SR Group, during the construction of the system.
This instrument is the result of teamwork involving all the members of the Electronics section of theSR Group and itis a pleasure to th~nk all of them.
H. van der Beken designed all the associated software and we are grateful to him for his efficientcooperation.
REFERENCES
1. O. Barb~lat, 'Proposition d'un systeme nunlerique demesure et de representation de l'orbite du faisceau,'CERN Report MPSjInt. RF 65-7.
2. O. Barbalat, Proc. 6th Int. Con! High Energy Accelerators, Cambridge, Mass. (CEAL-2000), 363 (1967).
3. R. Frankel, Rev. Sci. Instr. 40, 255 (1969).4. M. Q. Barton, R. Frankel, and M. Month, Rev. Sci.
Instr. 40, 1386 (1969).5. G. Schneider, 'The new pick-up electrodes for the
CERN PS,' CERN Report MPSjInt. RF 65-9.6. G. Schneider, 'A head amplifier for the compact PU
stations,' CERN Report MPSjInt. RF 67-3.7. G. Schneider, 'A wide-band differential amplifier with
analogue division for the CERN PS compact PUstations,' CERN Report MPSjInt. RF 67-7.
.8.G. Schneider, 'Wide-band differential amplifier withgain control (analog division) for the CERN PScompact· PU stations,' CERN Report MPSjInt.SR 68-8.
9. G. Schneider, 'Proposed beam observation signal transmission for increased PS beam intensity (withoutcathode followers),' CERN Report MPS/SR/Note70-5.
10. G. Schneider, 'A distribution amplifier for the CERNPS PU signals,' CERN Report MPSjInt. RF 67-10.
11. D. Boussard, 'Restitution de la ligne de base des signauxdes stations d'observation du faisceau,' CERN ReportMPSjInt. SR 69-5.
12. B. Smith, Nucl. Instr. Methods 55, 138 (1967).13. J. Boucheron and F. Ollenhauer, 'Convertisseur ana
logique digital d'impulsions bipolaires,' CERNReport MPSjInt. RF 67-20.
14. Drawings MPSjSR 2852 EL 11-2 and EL 12-2, Bipolarpulse height to digital converter.
15. U. Bigliani, 'Tunable filter,' (to be published).16. J. Boucheron, 'Dephaseur independant de la frequence,'
CERN Report MPSjSRjNote 70-2.17. J. Boucheron, D. Boussard, and F. Ollenhauer, 'La
synchronisation du systeme d'observation du faisceau(CODD),' CERN Report MPSjInt. SR 69-7.

324 J. BOUCHERON et ale
18. E. Asseo, 'Controle de processus via Ie STAR,' CERN'Report MPSjInt. CO 68-11.
19. E. Asseo, S. Battisti, H. van der Beken, J. Bosser, andK. Kohler, 'Contrale automatique du synchrotron itprotons du CERN par ordinateur IBM 1800,' Communication presentee au Colloque international sur
la Tel6informatique, Paris, 24-28 mars 1969. T 2,1172-1180.
20. G. Schneider, 'Pick-up signal simulator,' CERN ReportMPSjInt. SR 69-6.
Received 14 May 1971