the centre for international governance innovation ... international governance challenges working...
TRANSCRIPT

Addressing International Governance Challenges
WORKING PAPEREmerging Economies
The Centre for International Governance Innovation
Manmohan Agarwal, Yao Li, John Whalley
Working Paper No. 47
May 2010
An electronic version of this paper is available for download at:
www.cigionline.org
Approaches to Fostering Productivity Growth in Brazil,
China and India

To send commenTs To The auThors, please conTacT:
Manmohan Agarwal CIGI Senior Visiting Fellow [email protected]
Yao Li PhD Candidate, University of Western Ontario [email protected]
John Whalley CIGI Distinguished Fellow [email protected]
If you would like to be added to our mailing list or have questions about our Working Paper Series please contact: [email protected]
The CIGI Working Paper series publications are available for download on our website at: www.cigionline.org/publications/workingpapers
CIGI Publications Team: Senior Director for Publications: Max BremPublications Coordinator: Jessica HansonPublications Assistant: Matthew BunchMedia Designer: Steve Cross
ISSN 1917-0238 (Print)ISSN 1917-0246 (Online)
CIGI gratefully acknowledges the Government of Ontario’s contribution to this project.
The opinions expressed in this paper are solely those of the author(s) and do not necessarily reflect the views of any affiliated institution including The Centre for International Governance Innovation or its Board of Directors and /or Board of Governors, or the Government of Ontario.
Copyright © 2010 The Centre for International Governance Innovation (CIGI), Waterloo, Ontario, Canada (www.cigionline.org). This work is licensed under a Creative Commons Attribution — Noncommercial — No Derivatives License. To view this license, visit (www.creativecommons.org/licenses/by-nc-nd/3.0/). For re-use or distribution, please include this copyright notice.

CIGI WORKING PAPEREmerging Economies
Approaches to Fostering Productivity Growth in Brazil, China and India
Manmohan Agarwal, Yao Li, John Whalley
Working Paper No. 47
May 2010
4 | Manmohan Agarwal, Yao Li, John Whalley Approaches to Fostering Productivity Growth in Brazil, China and India | 5
About the Authors
Manmohan Agarwal is a visiting senior fellow at CIGI and a former dean of the School of International Studies, Jawaharlal Nehru University, New Delhi, India. He has published extensively in international economics and development economics, and has worked in the area of environmental economics. He is editor of India’s Economic Future: Education, Technology, Energy and Environment (Social Sciences Press); Globalisation and the Millenium Development Goals: Considerations for Policy-Making (Social Sciences Press); Development and Environmental Issues in Indian Reform (Haranand) and Indian Economy in Transition: An Indian Perspective (Haranand). He has edited special issues of the Journal of International Trade and Economic Development and Pacific Economic Review. He has worked at the International Monetary Fund and the World Bank. He studied at the Delhi School of Economics and the Massachusetts Institute of Technology.
Yao Li has worked on several CIGI research projects since May 2007. Currently a PhD candidate in the Department of Economics at the University of Western Ontario, her major fields of study are international trade, international macroeconomics and applied econometrics. Between 2003 and 2005 she worked as a research fellow in the Planning Research Institute of China’s Ministry of Industry and Information Technology. She holds BA (2001) and MA (2003) degrees in Economics from Peking University.
John Whalley is a CIGI Distinguished Fellow and a Fellow of the Royal Society of Canada. The author or coauthor of dozens of scholarly articles, he is one of Canada’s preeminent experts in the field of global economics. His current academic positions include William G. Davies Professor of International Trade and Co-Director of the Centre for the Study of International Economic Relations, Department of Economics, University

4 | Manmohan Agarwal, Yao Li, John Whalley Approaches to Fostering Productivity Growth in Brazil, China and India | 5
of Western Ontario; Research Associate, National Bureau of Economic Research in Cambridge, MA; and Coordinator, Global Economy Group, CESifo, University of Munich. Dr. Whalley is a former Visiting Fellow at the Peter G. Peterson Institute for International Economics, Washington, D.C. He holds a BA in Economics from Essex University (1968), and an MA (1970), M.Phil (1971) and a PhD (1973) from Yale University.
Abstract
Productivity growth is a significant contributor to GDP growth, particularly to increases in per capita income. However, there is considerable ambiguity regarding how to measure the concept of technical progress, and consequently on policies that would foster productivity growth. Brazil, China and India, three important emerging economies, are seeking to foster productivity growth through encouraging innovation and technology transfers from the more developed economies. But given the ambiguities about how to encourage innovation and technology transfers, governments in these countries adopted a plethora of policies in the hope that the combination will be effective. This ambiguity can also be seen in the much slower growth of productivity in Brazil than China, even though Brazil has scored higher on the World Bank’s Knowledge Assessment Methodology.
A common trend is to foster closer links between universities and research institutes and commercial enterprises. Chinese policy has been most forward in this respect. While such a link was behind the government’s thinking in India, until recently the link was weak and new policies have been adopted by the government since the 1991 economic reforms to strengthen the relationship. In Brazil the link had been very weak until a few years back when the government instituted new policies to encourage the commercialization of new technologies.

6 | Manmohan Agarwal, Yao Li, John Whalley Approaches to Fostering Productivity Growth in Brazil, China and India | 7
1. Introduction
An intense debate is under way about policies on innovation and technology transfer (ITT) in the large emerging economies of Brazil, China and India. Such policies play a central role in the transformation and growth of economies and in their drive to become successful manufacturers and exporters. In this paper, we look at the policy instruments these countries use to improve innovation and technology transfer in their manufacturing sectors.
Despite the belief that innovations play a major role in generating productivity growth, it is difficult to define an “innovation.”1 The image most people likely have is of some new scientific discovery or the production of a new product — indeed, most analyses of the spread of innovations conceive of them along these lines. But innovation can also be changes in management practices, an area that so far seems to have escaped analysis.21 Further, innovations have both a technical aspect and an economic aspect: the technical difficulty of an innovation might be greater than the value of its technical potential or economic benefit, and no innovation will be produced unless there is adequate demand for it. Another difficulty with assessing the importance of productivity growth is that it is not always possible to correlate it tightly with innovation: as Solow (1987) remarked in the mid-1990s, “I see computers everywhere but in the productivity statistics.” Indeed, experience with earlier, so-called general purpose technologies such as electricity shows that the benefits are considerably lagged.3
1 For a discussion of ambiguities in the concept of “productivity growth,” see Annex A to this paper, pp. 44.
2 In early discussions among economists about how to define innovations, newer methods of organizing work were excluded (see Kuznets, 1962).
3 Major innovations often require major changes in factory layouts and

6 | Manmohan Agarwal, Yao Li, John Whalley Approaches to Fostering Productivity Growth in Brazil, China and India | 7
Important issues in devising policies to encourage innovation include: the relative roles of the private and public sectors, whether innovation should be encouraged in the universities or in special research institutes, and what should be the involvement of private industry with universities or research institutes. There is a trend towards convergence in innovation policies in the three countries under study, with greater attention being paid to encourage innovation with a commercial potential.
One can look at innovations as either outputs or inputs. From the output side, we are interested in new combinations of existing knowledge to produce new products and devices for use in production. Very often in analysis, innovations are measured by patents, associated royalties and licence fees and so on, but many innovations are not patented. Furthermore, all patents are not equal. Even more important, although patents might describe innovative activity in the developed countries, they do not describe the process of productivity growth in developing countries, which is based more on learning to operate technologies already used in developed countries.
From the input side, the usual practice is to look at either expenditures on research and development (R&D), or the number of people engaged in research or the number of skilled workers.4 But much of what is described as R&D expenditures in company reports and accounts is actually adjusted to make the product more suitable for the market and is driven more by tax rules. In addition, such expenditures are relevant only for large
procedures before the full benefits can be read, and there might be a considerable lag before the need for change is recognized and implemented.
4 Usually, employees are separated into skilled and unskilled, the latter including all administrative workers. Such a classification, however, might overstate the number of skilled workers engaged in production. But it does mean that, in practice, organizational efforts are taken into consideration.

8 | Manmohan Agarwal, Yao Li, John Whalley Approaches to Fostering Productivity Growth in Brazil, China and India | 9
research establishments, not for individual innovators, despite their considerable importance. Also, it is difficult to differentiate people who are actively engaged in research from other skilled workers or innovative activity from basic research. There is also the question of how to account for the employment hours of non-technical people who provide necessary services to the technical people. In short, the connection between R&D expenditures or the number of people engaged in research, on the one hand, and innovation, on the other, is quite loose.
There are also considerable analytical difficulties with the concept of “technology transfer.” The literature distinguishes between the explicit transfer of technology — such as the physical transfer of templates and design plans for new processes — and the implicit transfer of technology and know-how embodied in workers as they acquire knowledge and technique (particularly in enterprises that receive foreign direct investment, FDI) and eventually relocate to domestic firms. The vagueness of these terms creates difficulties in defining what the policy challenges are, as we discuss below.
In fact, we argue that innovation and technology transfer have become de facto policy catchalls for a wide range of measures that include: extensive use of R&D tax credits for investment policies aimed at innovation-related activities; prioritization in credit rationing and financial allocation to firms deemed to be involved in innovative activities; large increases in tertiary education expenses related to the sciences (particularly in China); the use of geographical zones for various kinds of preferential measures such as trade policy and financial regulation; and financial innovation as a mechanism to internalize the spillover effects from externalities particularly associated with inward FDI. Governments have also implemented megaprojects deemed central to innovation activities.
8 | Manmohan Agarwal, Yao Li, John Whalley Approaches to Fostering Productivity Growth in Brazil, China and India | 9
We find in our study of the three countries extensive and large-scale government intervention in policies aimed at generating productivity growth, with the resources allocated largely through central direction in the name of ITT policy. This policy nexus is extremely important in terms of overall resource allocation; in the case of China, it tends to run counter to a policy of growth through a decentralized, market-based process focused on the emergence of small, rapidly growing firms.
2. Outline of the Argument
We begin by summarizing the evolution of ITT policies and the central elements of relevant policy instruments in Brazil, China and India. The policies of China and India currently have more features in common with each other than with those of Brazil, but all three countries are trending toward similar policies. China and India have attempted to build comprehensive national innovation systems, and have initiated megaprojects, employed financial policies (such as R&D tax credits, FDI preferential policies, and loans), and built on education policy to foster innovation. Both countries also implemented science and technological parks or development zones. All three countries have emphasized the role of universities and research institutions, but since the 1990s China and India have been harnessing the private sector as well. Overall, Brazil’s policies lag those of the other two in effectiveness, although it recently has undertaken several initiatives that follow successful examples in China and India, such as science parks and business incubators.5
Next, by examining the direct and indirect indicators of innovation outputs and inputs, we evaluate the performance of ITT policies in these three countries. To describe their relative
5 Business incubators are very flexible science and technology enterprises. They often package services to venture firms including production and communications facilities as well as policy, financial and legal advice.

10 | Manmohan Agarwal, Yao Li, John Whalley Approaches to Fostering Productivity Growth in Brazil, China and India | 11
positions in the global knowledge economy, we use the “basic scorecard” from the Knowledge Assessment Methodology (KAM), developed by the World Bank (2008). We again find similarities between China and India, while Brazil is obviously different from the other two. If we compare the three countries’ innovation using certain aggregate variables (unweighted by population), we find that, in terms of total royalty payments and receipts, scientific and technical journal articles and patents granted by the United States Patent and Trademark Office (USPTO), China far exceeds India and Brazil: in 2006, its total royalty payments and receipts of around US$5.5 billion were more than 12 times India’s. On some population-sensitive variables, however, such as gross secondary and tertiary enrolment rates, computers per thousand people and Internet users per thousand people, Brazil performs much better than China and India, due to its much smaller population. With only a few exceptions — for example, on regulatory quality and the rule of law — China outperforms India. Then, in examining other indicators on the output and input sides of innovation activities, we find that Brazil started at a higher level than China and India in the output indicators (royalties and licence fees, patents, and so on), but is now exceeded by China.
This country-specific profile of innovation and technology usage is consistent with our policy judgment that ITT policies have had a greater effect on direct innovation outcomes in China than in the other two countries. At the same time, China is also investing more than the other two — indeed, it is converging with developed countries in terms of R&D expenditures on the input side and innovation outcomes on the output side, as measured by patents and payments associated with technology transfers (such as royalties and licence fees). China employs aggressive policies to spur its innovation competitiveness, while India is more conservative, which hinders, somewhat, its nonetheless rapid growth.
10 | Manmohan Agarwal, Yao Li, John Whalley Approaches to Fostering Productivity Growth in Brazil, China and India | 11
We also analyze the contribution of ITT policies to overall growth. The literature contains different estimates of the contribution of increased productivity to growth in emerging markets. Several studies argue that China is experiencing a significant deceleration of total factor productivity (TFP) growth (see, for example, Kwan 2006; Zheng and Hu, 2006), but we expect that the contribution of TFP to growth in these countries should be higher in future because of the stress they have placed on ITT policies over the past two decades. This assessment is consistent with, for example, Bosworth and Collins (2007), who find that the contribution of TFP to growth in output per worker in China and India strongly accelerated after 1993. China is more successful in the manufacturing sectors, while India is doing better in the services sectors. Growth over the past two decades has also been accompanied by a huge increase in exports, which ITT policies clearly support, especially in the Chinese case. This, in turn, is reflected in the upgrading of the quality of exports that has occurred in the three countries. In comparing them, we again find that China and India are doing better than Brazil in the global market.
We conclude that the overall effect of ITT policies in Brazil, China and India is a key factor in explaining the three countries’ relative positions in the global economy. The underlying rationale for and evaluation of such policies, however, is complicated by vagueness of terminology and the ambiguity of much of the debate. The effectiveness and contribution of ITT policies to overall income growth remains an open question requiring further research.
3. ITT Policies in Brazil, China and India
Over the past several decades, facing the challenge of competition in the global market, Brazil, China and India have

12 | Manmohan Agarwal, Yao Li, John Whalley Approaches to Fostering Productivity Growth in Brazil, China and India | 13
transformed mere science and technology (S&T) policies into overall national innovation systems. China’s and India’s policies tend to be similar in education and research, setting up of special zones such as science and technological parks and in seeking to promote innovation in the private sector. Brazil, in contrast, has focused more on promoting basic research in the universities.
Education Policy
Education policy — in particular, higher education policy, sometimes called human resource policy — is a central element in the ITT policy mix. Here, India has lagged behind the other two countries at all levels. Primary education in Brazil and China is universal, but not in India. Gross tertiary enrolment rates in Brazil, China and India are 25.48, 21.58 and 11.85, respectively.6 In 2007, the literacy rate among those ages 15 and above was 90.51, 93.31 and 66.02 percent, respectively, in Brazil, China and India. The World Bank’s KAM project (2008), using an education index as a population-weighted aggregate indicator, assigns marks of 5.84, 4.11 and 2.26, respectively, to Brazil, China and India.
Brazil
Brazil has put significant resources into developing its higher education system over the past three decades. As a result, a system has evolved in which some institutions have achieved recognizable excellence in teaching and research, while the majority of institutions have struggled to provide relevant, quality education at reasonable cost.
6 The gross tertiary enrolment rate refers to the ratio of total enrolment, regardless of age, to the population of the age group that officially corresponds to the level of education shown.
12 | Manmohan Agarwal, Yao Li, John Whalley Approaches to Fostering Productivity Growth in Brazil, China and India | 13
Until recently federal policy toward higher education did not attempt to control costs or correlate funding and productivity. Other legislation and regulations, outside the control or influence of the education ministry (Ministério da Educação e do Esporto – MEC), created built-in cost increases that did not improve access to, or the quality or relevance of, higher education. Brazilian universities traditionally have concerned themselves more with obtaining resources from the federal government than with managing resources effectively within their institutions.
The federal government has a three-pronged strategy for improving higher education: (i) change the sector’s legal framework; (ii) change to a performance-based funding system that supports MEC’s policy goals of improved access, quality and efficiency; and (iii) improve the capacity to evaluate quality of instruction and performance of institutions. To date, substantial progress has been made in (i) and (iii), and planning for (ii) is under way.
(i) On the legal framework, prior to 1994 higher education institutions were not allowed to define curricula or personnel policies. They could not hire or fire academic, technical or administrative staff, set salaries, open new courses of study, decide the number of places they would offer or transfer budget resources among expenditure categories. The 1996 National Education Law created a new category of institutions, “university centres,” which enjoy most of the same legal privileges as universities, have greater autonomy over curricula and enrolment, and have a mandate to concentrate on undergraduate teaching instead of research. The law also allowed universities to define personnel policies, to hire and fire staff directly and to manage budgets according to the needs of the institution rather than centralized bureaucratic mandates. The law created the framework for a national evaluation system through which the federal government can monitor and guarantee

14 | Manmohan Agarwal, Yao Li, John Whalley Approaches to Fostering Productivity Growth in Brazil, China and India | 15
the quality of higher education. Other legislative changes allowed the creation of new, shorter courses, similar in some respects to US community college degree programs, as well as two-year professional master’s degrees for areas of high demand such as business administration and economics. Also, institutions now have much greater autonomy to determine the type and amount of education they offer. Instead of a restrictive “minimum curriculum” for each course or career, institutions are now required only to follow broad curriculum guidelines. Slowing the implementation of these legislative changes, however, is resistance to autonomy and inertia within universities themselves.
(ii) As to the second prong of the strategy, changes to the funding system, the federal government, in granting higher education institutions greater autonomy, also requires that institutions be accountable. For federal institutions, it would provide block grants on the basis of performance contracts. Each institution’s allocation would be derived using a simple, transparent formula that rewards “behavioural changes” and improved productivity that advance MEC’s policy goals of greater access, quality and efficiency. For the private system, the government would provide loans for students who could not otherwise afford to pay tuition. Students would be able to use their loans only at private institutions that demonstrate their ability to produce proficient students.
(iii) Finally, MEC seeks to transform itself from being primarily a funder of inputs to that of a guarantor of a minimal standard of quality output. A main mechanism for achieving this goal is to be an evaluation and accreditation system. The well-established and successful system for evaluating and accrediting graduate courses was recently revised to increase the relevance and quality of its criteria and the system is being extended to cover undergraduate programs.

14 | Manmohan Agarwal, Yao Li, John Whalley Approaches to Fostering Productivity Growth in Brazil, China and India | 15
Brazil is making efforts to improve its tertiary education attainment level. World Bank data shows that Brazil allocates about six times more resources per student to tertiary education than to primary education; by comparison, the countries of the Organisation for Economic Co-operation and Development (OECD) allocate, on average, 29 percent more to tertiary education (without considering R&D activities) than to primary education. Yet it is still insufficient: from 1995 to 2005, Brazilian expenditures on tertiary-level educational institutions increased by 51 percent, but the number of students increased by about 80 percent. Today, 8 percent of Brazilians ages 25 to 34 and 9 percent of those ages 35 to 54 have tertiary education, compared with 4 percent of those ages 55 to 64; 13 percent of graduates are in science-related fields.
China
China has made great efforts, particularly since the 1980s, to enhance the educational level of its abundant human resources in order to upgrade technology and improve productivity. The average number of years of schooling of the population ages 15–64 increased from 4.10 in 1980 to 5.96 in 2000 (Cohen and Soto, 2007). Over the same period, the proportion of the population finishing junior secondary education increased from 15 percent to 34 percent, those with senior secondary education increased from 6 percent to 11 percent and those with tertiary education increased from 1 percent to 4 percent (Hu, 2003). These policies have increased the number of highly skilled workers in China substantially (see Li et al., 2008).
Despite China’s success in building a skilled labour force, there are shortages in several segments of the labour market for various levels of S&T-related skills, which create human resource bottlenecks in the innovation system and challenge the responsiveness of the education system. For instance,

16 | Manmohan Agarwal, Yao Li, John Whalley Approaches to Fostering Productivity Growth in Brazil, China and India | 17
there is a shortage of innovation managers in many areas, with domestic firms having difficulty competing with foreign firms in recruiting competent managers or highly qualified researchers in industry-relevant fields. Also, the supply-driven tertiary education expansion has led to an abundance of highly educated labour while technicians and technical workers seem to be in short supply in many industries due to insufficient business investment in training, particularly vocational training.
The government realizes that China is now a key player in the global competition for the available supply of talent (OECD, 2007), and has sought to transform the previous “brain drain” into a “brain circulation” that would help to achieve national goals. One element in the strategy is to loosen restrictions in order to make returning to China more attractive. For example, it now grants special permits to enter and leave the country so that returnees can continue to work both abroad and in China; they are also allowed to remit their after-tax earnings, a right otherwise reserved for foreigners working in China.7 A second element involves development parks and incubators. In 2003, 45 incubators dedicated to returned overseas scholars hosted about 3,000 enterprises employing more than 40,000 people. Tax incentives and project funding are provided, and there is some interregional competition, especially among Beijing, Shanghai, Shenzhen and Guangzhou, to attract returnees through tax reductions or exemptions, favourable import regulations and/or financial support to start-ups. A third element of the strategy is national programs to attract high-level scientists, with the ministry of education cooperating with other organizations
7 For its part, the Indian government’s attempts to attract Indians living abroad to return have been less successful, although those with expertise in the IT and biotechnology areas are returning in larger numbers, perhaps attracted by the government’s now allowing Indians to own certain types of assets abroad.
16 | Manmohan Agarwal, Yao Li, John Whalley Approaches to Fostering Productivity Growth in Brazil, China and India | 17
to develop funding programs to recruit Chinese research talent around the world to work in China, including through awards to leading researchers, which elevates research levels in some key subject areas. The results of these initiatives are mixed, and it is questionable whether the recent increase in the number of returnees can be attributed to government incentives. In any case, the number still falls short of that required to reduce significantly current and prospective shortages of certain types of skills. In the foreseeable future, the main determinants of inflows and outflows of highly qualified Chinese labour will continue to be international differences in wages, working and living conditions and entrepreneurial opportunities.
India
India considers the creation of a scientific base as a prerequisite for developing its domestic R&D on the premise that “technology grows out of the study of science and its application” (Aggarwal, 2001:274). To develop a skilled labour force and achieve self-sufficiency in the generation of new technology, the government expanded school enrolment in the 1950s and 1960s and set up specialized institutions. The landmark event was the establishment in the 1950s of the Indian Institutes of Technology (IITs), modelled on the Massachusetts Institute of Technology (MIT). The government also established a number of public research institutions and laboratories to develop technology for use by Indian industry. Imports of technology were severely restricted to encourage entrepreneurs to adopt technology developed by domestic institutions. In subsequent decades, however, school enrolment grew very slowly, and growth of institutions providing tertiary education, mainly in engineering and medicine, was almost exclusively in the private sector. The high fees that these institutions charged limited access.

18 | Manmohan Agarwal, Yao Li, John Whalley Approaches to Fostering Productivity Growth in Brazil, China and India | 19
In the past two decades, the Indian government has made an intense effort to expand primary education. Recently, though, attention has shifted to secondary and tertiary education, in order to absorb the massive number of students graduating from primary schools and to meet increased labour market demand for qualified workers. With the increasing integration of the Indian economy with the rest of the world and knowledge now a vital factor in economic growth, the government is also focusing on tertiary education, with plans to start many new IITs and public universities. In its 11th five-year plan (2007-2012), the government emphasizes the need to expand tertiary education in these terms:
“India has a well-developed and comprehensive higher education system which has served well thus far, but is now inadequate. The extent of access it provides is limited. Only about 10% of the relevant age group goes to universities whereas in many developing countries, the figure is between 20 and 25%. There is an overwhelming need to undertake major expansion to increase access to higher education” (Azam and Blom, 2008: 49)
In urban India, the returns to tertiary education are increasing: a tertiary-educated regular worker was paid wages that were 82 percent higher than those of a below-primary-educated regular worker in 1993 and 101 percent higher in 2004 (Azam, 2008b). But growth in the supply of tertiary-educated workers slowed between 1993 and 1999 and was virtually stagnant between 1999 and 2004 (Azam, 2008a).
In the 2006-07 academic year, there were 369 universities with 1.43 million students and 18,064 colleges with 9.6 million students (India, 2007). As well, in 2004, there were 1,265 engineering and technology colleges, 320 pharmaceutical colleges, 107 architecture schools and 40 hotel management
18 | Manmohan Agarwal, Yao Li, John Whalley Approaches to Fostering Productivity Growth in Brazil, China and India | 19
institutes. The aggregate supply of skilled science and engineering graduates is steadily rising, but they are still only a tiny fraction of India’s huge population.
Most Indian universities are public institutions. The central government provides one-quarter of the funding for higher education, with much of the rest made up by the states. In 1995, the central government introduced a bill to regulate the establishment of private universities. The bill did not pass, however, because of protests from the private sector over its onerous financial and academic requirements and its provisions for continued government regulation. Meanwhile, several states have passed their own legislation on the establishment of private universities. Despite the proliferation of sub-standard private colleges, top private colleges such as Aptech are beginning to meet the demand for technical and managerial expertise in India’s rapidly developing economy.
Research Policy
In most countries, ITT policies tend to focus on the public sector, but Brazil, China and India have started to foster innovation and technology transfer in the private sector. We discuss ITT policy in both sectors and some other special policies.
Brazil
Changes in Public Sector and General Sectoral Policies
Until the mid-1950s, during a period of import substitution, Brazilian governments built a network of institutions involved in scientific, technological and industrial projects. Among others, it is worth mentioning the Aerospace Research Center, founded in 1947, which played an important role in the development of the Brazilian aircraft industry; the National Council for Scientific

20 | Manmohan Agarwal, Yao Li, John Whalley Approaches to Fostering Productivity Growth in Brazil, China and India | 21
and Technological Research, established in 1951 and originally focused on atomic technology but still an important institution for financing public research, especially in the federal universities; and the Brazilian Development Bank, created in 1953 with funds generated by workers’ forced savings and still the most important institution for financing long-term investment in Brazil.
During the period of military governments from 1964 to 1985, and following the end of the stagnation of the Brazilian economy that began in the early 1960s, large investment projects were implemented that had the merit of loosening bottlenecks in the infrastructure and basic industries, especially in the production of intermediate goods (see Castro and Souza, 1985). Scientific and technological development was a preoccupation of most of the military governments, and in 1964 two funds were created to finance, directly or indirectly, the introduction of new technologies: one to train personnel involved in basic research in the universities, and the other to aid the acquisition of machinery and industrial equipment. In 1965, the Brazilian government established the Agency for Financing Studies and Projects, which is still an important public enterprise for financing innovative activities.
Throughout the 1970s successive scientific and technological plans appeared, to increase the financial resources for S&T, for example, and to fund R&D of new technologies, new sources of energy, microelectronics and the aerospace industry. Institutional modernization reached its peak in 1972 with the creation of the Secretary of Industrial Technology, which coordinates S&T programs, promotes technological development in both private and public firms, manages Brazil’s system of intellectual property rights (patents and trademarks) and regulates the transfer of technology through the National Institute of Industrial Property Rights (Dahlman and Frischtak, 1993).
20 | Manmohan Agarwal, Yao Li, John Whalley Approaches to Fostering Productivity Growth in Brazil, China and India | 21
Notwithstanding the high annual average growth rates of Brazilian real GDP between 1950 and 1980 (7.5 percent) and the consolidation of a large and diversified industrial base, Brazil did not show strong results on indicators of technological effort, especially those related to R&D. By the mid-1980s R&D expenditures were still relatively low (around 0.63 percent of GDP) compared with those in industrialized countries or even some later industrializing Asian countries such as South Korea. Moreover, the state was responsible for most (62.6 percent) of the R&D expenditures, which were highly concentrated in a narrow group of firms (Dahlman and Frischtak, 1993).
Important institutional developments have also taken place. They include the creation in 1975 of the National System of Scientific and Technological Development, which organized under a nationwide system entities that used government funds to conduct scientific and technological research, and in 1985 the establishment of the Ministry of Science and Technology as the central body in the federal S&T system. In turn, a National Council for Science and Technology, chaired by the Brazilian president, is responsible for harmonizing the policies of the various ministries that also work in these areas.
Recent Initiatives in the Private Sector
Compared with China and India, Brazil’s innovation system is far from market-oriented, but the government has started to change this and help in the commercialization of innovation. In 2006, for example, it passed an Innovation Law to provide major transmission networks of knowledge from basic research – especially by public institutions and federal universities – to the applied technologies of firms.
22 | Manmohan Agarwal, Yao Li, John Whalley Approaches to Fostering Productivity Growth in Brazil, China and India | 23
China
The Policy Evolution
China’s ITT policies have evolved substantially over time, in roughly four stages. The first stage (1956–77) was the Cold War technological policy, under which China set up its basic industrial capability, especially in precision instruments, large machines and large engineering projects. The second stage (1978–91), begun after the initial “open-door policy,” was mainly a civil technology policy period. The Chinese government focused on adjusting the economic and social structure, transferring scientific and technological innovations to the economic field and moving S&T activities from a planning to a market orientation. The third stage (1992–2000) started after a sharp “open-up” policy change following Deng Xiaoping’s Southern Tour in 1992. During this period, China built up a base for its high-tech industry and realized significant achievements in that field. It was also at this stage that innovation policy dominated pure science and technology policy, and China began to use its scientific and technological resources to set up a national innovation system (NIS). In the fourth stage (2001–present), the maturing of the NIS has accelerated through continued opening to international markets — as evidenced by China’s accession to the World Trade Organization (WTO) in 2001— and ongoing national ITT policies such as high-tech parks and new R&D policies. This stage can also be seen as one of a large-scale transformation of R&D institutions (Huang et al., 2004).
China’s ITT policies clearly demonstrate the role of government-funded, project-based programs, but they have always had a strong private sector and enterprise component — FDI was expected to bring in new technologies that would be diffused to domestic enterprises. Recently, however, China

22 | Manmohan Agarwal, Yao Li, John Whalley Approaches to Fostering Productivity Growth in Brazil, China and India | 23
has shifted its focus to encouraging innovative firms and institutions to achieve more commercialization.
Major Government Programs and Reforms of Public R&D Institutions
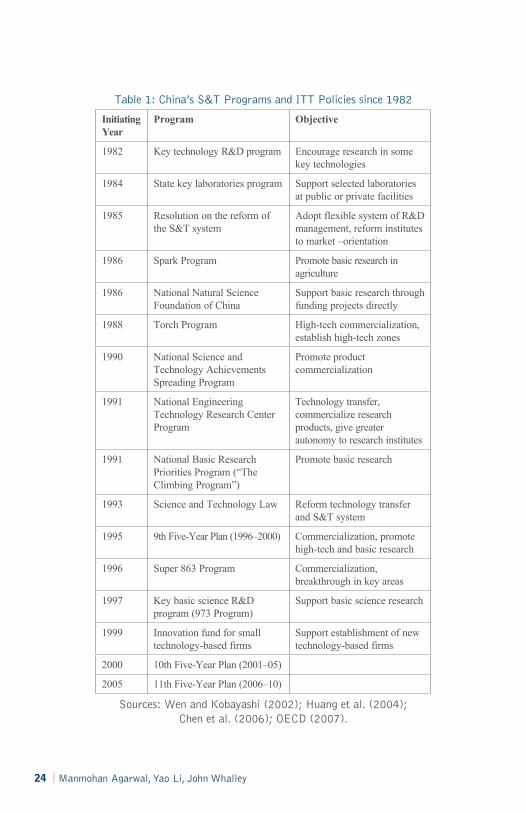
A key element in China’s post-1980 ITT policies is major government-oriented programs and megaprojects (see Table 1, p.24). The government has promoted policies to strengthen national technological innovation capability through a series of programs acting as mechanisms for funding S&T activities. Additional programs have addressed the priorities in each Five-Year Plan. Over the 2000–2005 period, funds allocated from the central government to the main programs were as much as 17 percent of total public S&T expenditure.
24 | Manmohan Agarwal, Yao Li, John Whalley Approaches to Fostering Productivity Growth in Brazil, China and India | 25
Table 1: China’s S&T Programs and ITT Policies since 1982
Initiating Year
Program Objective
1982 Key technology R&D program Encourage research in some key technologies
1984 State key laboratories program Support selected laboratories at public or private facilities
1985 Resolution on the reform of the S&T system
Adopt flexible system of R&D management, reform institutes to market –orientation
1986 Spark Program Promote basic research in agriculture
1986 National Natural Science Foundation of China
Support basic research through funding projects directly
1988 Torch Program High-tech commercialization, establish high-tech zones
1990 National Science and Technology Achievements Spreading Program
Promote product commercialization
1991 National Engineering Technology Research Center Program
Technology transfer, commercialize research products, give greater autonomy to research institutes
1991 National Basic Research Priorities Program (“The Climbing Program”)
Promote basic research
1993 Science and Technology Law Reform technology transfer and S&T system
1995 9th Five-Year Plan (1996–2000) Commercialization, promote high-tech and basic research
1996 Super 863 Program Commercialization, breakthrough in key areas
1997 Key basic science R&D program (973 Program)
Support basic science research
1999 Innovation fund for small technology-based firms
Support establishment of new technology-based firms
2000 10th Five-Year Plan (2001–05)
2005 11th Five-Year Plan (2006–10)
Sources: Wen and Kobayashi (2002); Huang et al. (2004); Chen et al. (2006); OECD (2007).

24 | Manmohan Agarwal, Yao Li, John Whalley Approaches to Fostering Productivity Growth in Brazil, China and India | 25
In the early 1980s, China implemented a “national technological revise plan,” a “national key technology development projects plan,” and a “national long-term S&T plan.” It added an “S&T breakthrough plan” in 1983 to support large, important national S&T projects and a “key technology R&D program” in 1984 to concentrate resources on key and common technologies that would be needed for industrial upgrading and socially sustainable development (Huang et al., 2004). In the 1990s, came a “national science and technology long-term plan,” focused on developing Chinese research and production capabilities in atomic energy, electronics, semiconductors, automation, computer technology and rocket technology (Kondo, 1997).
“The national middle-and-long-term S&T program,” issued by the State Science and Technology Committee of China in 1992, declared that China should aim at reaching the technology levels of industrialized countries in the 1970s and 1980s by 2000 and those at the beginning of the 21st century by 2020 (see Kondo, 1997; Wen and Kobayashi, 2002). Accordingly, the high-tech policy establishment became a key element in public policy making.
To boost these and other major R&D programs, China has adopted a financial policy that the OECD (2007) has called that country’s “single most important policy instrument.” Funds allocated under the program have been significant, 17 percent of public S&T expenditures, and directed to national priorities.8 One element of this approach is to attract financial input from local governments and enterprises through, for example, the so-called Torch Program, which mainly concerns projects in high-tech
8 Of course, as mentioned earlier, it is an open question how effective funds are in generating innovations.

26 | Manmohan Agarwal, Yao Li, John Whalley Approaches to Fostering Productivity Growth in Brazil, China and India | 27
fields, and the Spark Program,9 which aims to revitalize the rural economy by focusing on farming techniques and processing technologies. The main objective of such programs is to promote the diffusion of applied technologies, rather than to conduct basic scientific research, and unlike publicly funded basic research programs, they receive funding mainly from bank loans and enterprises’ own capital.
Recently, new energy, resources and environmental technologies have received more emphasis, with one program now focusing on promoting technical upgrading and restructuring of industries to promote sustainable social development. Another, the “973 Program,” encourages cutting-edge scientific research and work on other important issues in S&T fields.
Progress in the Private Sector
China’s major R&D programs are not completely funded by the government; the private sector also plays an important role in fostering business innovation and commercialization. The government’s share of the funding of the three core programs varies from nearly 90 percent for basic research to around 50 percent for applied research and to just 20 percent for technology innovation. Programs such as “Torch” and “Spark” that support the commercialization of research receive no more than 2 to 5 percent of their total funding from the central government, while local governments and enterprises typically provide larger shares of funding for programs related to innovation and the dissemination of technologies. Table 2 compares funding sources of applied research and core programs.
9 The Spark Program was named for a Chinese proverb, “A single spark can start a prairie fire.” It was launched in 1985 to “implement a batch of scientific and technological projects of quick benefit to promote rejuvenation of the regional economy.” (OECD, 2007: 53.).

26 | Manmohan Agarwal, Yao Li, John Whalley Approaches to Fostering Productivity Growth in Brazil, China and India | 27
Table 2: Funding Sources for Applied and Core Programs, China, 2004 (RMB millions)
Core Programs
Key Technologies Program
863 Program
973 Program
Total funds raised (RMB millions) 14,985 9,293 1,031
Government funds (RMB millions) 3,003 4,231 903
As % of total 20 46 88
Applied Programs
Torch Spark Total
Total funds raised (RMB millions) 71,313 20,573 91,886
From:
government (%) 2 5 3
enterprises (%) 72 60 70
bank loans (%) 23 21 30
overseas (%) 0.3 0.8 0.3
other (%) 4 4 4
Source: OECD (2007: table 3.1).
Table 3 shows that in 2006, 69.1 percent of the funds for China’s gross domestic expenditure on R&D (GERD) came from business enterprises, 24.7 percent came from central and local governments, and 6.2 percent came from abroad and other sources (China, 2007). Meanwhile, Figure 1 shows that government funding of S&T is increasing steadily, its share of total government expenditure rising from 3.7 percent in 2001 to 4.2 percent in 2006.

28 | Manmohan Agarwal, Yao Li, John Whalley Approaches to Fostering Productivity Growth in Brazil, China and India | 29
Table 3: China’s GERD by Source of Funds and Performance Sector, 2006 (RMB 100 million)
Source of Funds
Performance Sector
Research Institutions
Business Enterprises
Higher Education Institutions Others Total
(RMB 100 million)
Government 481.2 96.8 151.5 12.6 742.1
Enterprises 17.3 1946.0 101.2 9.2 2073.7
Abroad 2.6 41.8 3.8 0.2 48.4
Others 66.1 50.0 20.3 2.5 138.9
Total 567.3 2134.5 276.8 24.5 3003.1
Source: China (2007).
Figure 1: Government S&T Appropriation, China, 1996–2006 (RMB 100 million)
Central Government Local Government Total
200619960
200400600800
10001200140016001800
1998 2000 20042002106 134 149 188 226 259
305 336 403527
679
1010
808692
609511444
350356290243 275349 409 439
544 576703 816
9451095
1335
1689
Source: China (2007).
It is widely believed that these programs have played a significant role in advancing S&T in post-reform China by introducing new funding mechanisms to move to a market basis, by directing funding and human resources to national priorities and by providing economic development with S&T inputs, thus closing the technological gap between China and the global leaders.

28 | Manmohan Agarwal, Yao Li, John Whalley Approaches to Fostering Productivity Growth in Brazil, China and India | 29
In the late 1990s, the central government began to provide technological innovation funding for mid-size and small scientific enterprises. Such enterprises have now become the main source of innovation, development, investment and risk taking. At the same time, hundreds of large-scale government-owned R&D institutions were transformed into enterprises, non-profit organizations and intermediary organizations or merged into universities (Huang et al, 2004). This transformation improved the economic performance of public R&D institutions, with their 2001 profits 2.6 times those of 1999 and their tax contribution 1.9 times higher. Patent applications, employee average salary, revenue and other economic performance indicators all went up during this period. Several R&D institutions even went public in the stock market.
Among China’s goals is the establishment of a venture capital system to support technology-based small and medium-sized enterprises. Currently, no specific law exists to regulate venture capital development. Instead, the legislative framework consists only of company law, and is under the joint regulation of seven ministries. Legislative proposals for venture capital law have been made at the national level, and some municipal governments have enacted regulations to protect and promote venture capital development in their areas. Additionally, the Chinese stock market lists a number of domestic high-tech companies, although debate continues on the creation of a “Chinese NASDAQ.”
Other Special Policies
China’s strong economic performance and increased national innovation capability since 1978 can be attributed partly to FDI (see Buckley et al., 2002; Liu and Wang, 2003). China has welcomed foreign investors in ever-increasing numbers,
30 | Manmohan Agarwal, Yao Li, John Whalley Approaches to Fostering Productivity Growth in Brazil, China and India | 31
attracting them with physical and institutional infrastructure and fiscal incentives. Under this policy, FDI inflows accelerated rapidly in the 1990s, and by 2002 China had become the world’s largest recipient of FDI, receiving nearly US$53 billion (OECD, 2003). The central government has also shifted the focus of preferential fiscal policy from low-tech, labour-intensive industries to high-tech manufactures and the services sectors.
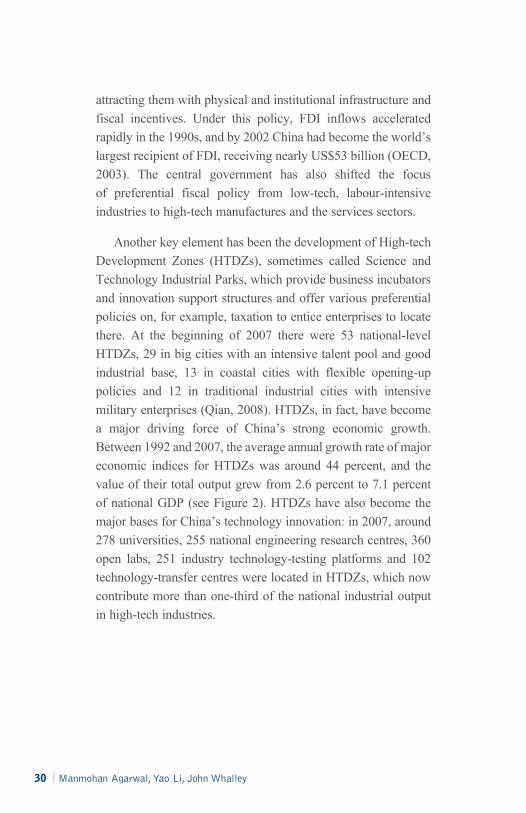
Another key element has been the development of High-tech Development Zones (HTDZs), sometimes called Science and Technology Industrial Parks, which provide business incubators and innovation support structures and offer various preferential policies on, for example, taxation to entice enterprises to locate there. At the beginning of 2007 there were 53 national-level HTDZs, 29 in big cities with an intensive talent pool and good industrial base, 13 in coastal cities with flexible opening-up policies and 12 in traditional industrial cities with intensive military enterprises (Qian, 2008). HTDZs, in fact, have become a major driving force of China’s strong economic growth. Between 1992 and 2007, the average annual growth rate of major economic indices for HTDZs was around 44 percent, and the value of their total output grew from 2.6 percent to 7.1 percent of national GDP (see Figure 2). HTDZs have also become the major bases for China’s technology innovation: in 2007, around 278 universities, 255 national engineering research centres, 360 open labs, 251 industry technology-testing platforms and 102 technology-transfer centres were located in HTDZs, which now contribute more than one-third of the national industrial output in high-tech industries.

30 | Manmohan Agarwal, Yao Li, John Whalley Approaches to Fostering Productivity Growth in Brazil, China and India | 31
Figure 2: Contribution of National High-tech Development Zones, China, 2001–2007 (percent of GDP)
20010%
1%
2%
3%
4%
5%
6%
7%
8%
2002 2003 2004 2005 2006 2007
7.1%
5.8%5.0%
4.5%4.0%
3.2%2.6%
Source: Qian (2008).
Another feature of China’s business innovation support policy is its encouragement of science and technology business incubators (STBIs), numbering more than 500 by 2004, which aim to create a favourable environment for technology transfer and innovation and to nurture “technopreneurs” and professionals. They mainly focus on commercialization of R&D outputs, the incubation of high-tech enterprises and providing linkages among universities, research institutes, high-tech small and medium-sized enterprises and markets.
India
Changes in Public Sector and General Sectoral Policies
Upon independence, the Indian government set itself the task of the socio-economic transformation of the country through a process of central planning. Its significance in national development recognized, science was given considerable importance in development planning. In its first S&T policy document, the government stated that the most important
32 | Manmohan Agarwal, Yao Li, John Whalley Approaches to Fostering Productivity Growth in Brazil, China and India | 33
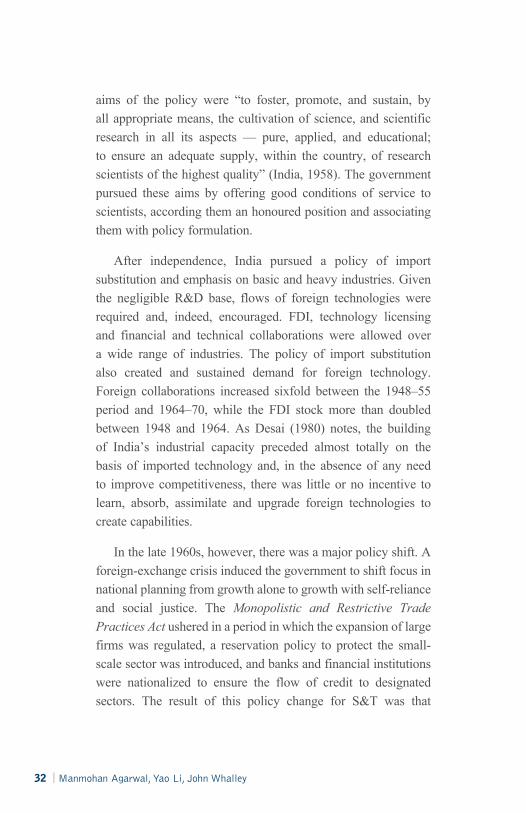
aims of the policy were “to foster, promote, and sustain, by all appropriate means, the cultivation of science, and scientific research in all its aspects — pure, applied, and educational; to ensure an adequate supply, within the country, of research scientists of the highest quality” (India, 1958). The government pursued these aims by offering good conditions of service to scientists, according them an honoured position and associating them with policy formulation.
After independence, India pursued a policy of import substitution and emphasis on basic and heavy industries. Given the negligible R&D base, flows of foreign technologies were required and, indeed, encouraged. FDI, technology licensing and financial and technical collaborations were allowed over a wide range of industries. The policy of import substitution also created and sustained demand for foreign technology. Foreign collaborations increased sixfold between the 1948–55 period and 1964–70, while the FDI stock more than doubled between 1948 and 1964. As Desai (1980) notes, the building of India’s industrial capacity preceded almost totally on the basis of imported technology and, in the absence of any need to improve competitiveness, there was little or no incentive to learn, absorb, assimilate and upgrade foreign technologies to create capabilities.
In the late 1960s, however, there was a major policy shift. A foreign-exchange crisis induced the government to shift focus in national planning from growth alone to growth with self-reliance and social justice. The Monopolistic and Restrictive Trade Practices Act ushered in a period in which the expansion of large firms was regulated, a reservation policy to protect the small-scale sector was introduced, and banks and financial institutions were nationalized to ensure the flow of credit to designated sectors. The result of this policy change for S&T was that
32 | Manmohan Agarwal, Yao Li, John Whalley Approaches to Fostering Productivity Growth in Brazil, China and India | 33
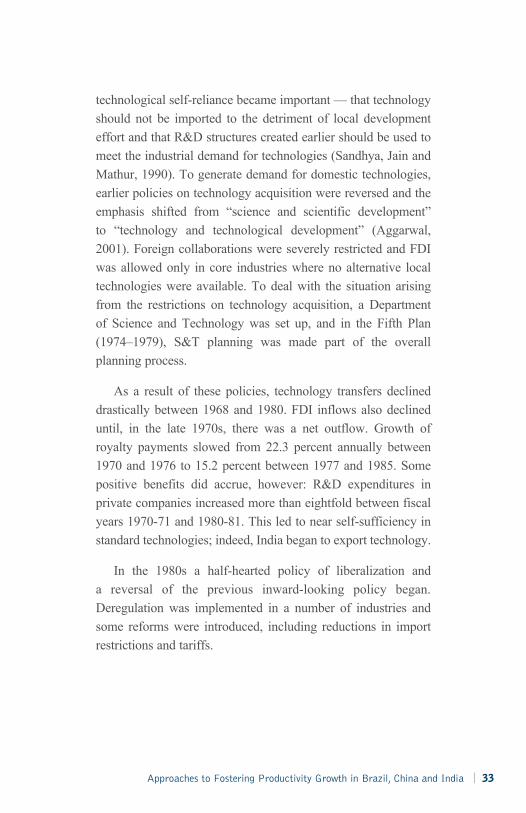
technological self-reliance became important — that technology should not be imported to the detriment of local development effort and that R&D structures created earlier should be used to meet the industrial demand for technologies (Sandhya, Jain and Mathur, 1990). To generate demand for domestic technologies, earlier policies on technology acquisition were reversed and the emphasis shifted from “science and scientific development” to “technology and technological development” (Aggarwal, 2001). Foreign collaborations were severely restricted and FDI was allowed only in core industries where no alternative local technologies were available. To deal with the situation arising from the restrictions on technology acquisition, a Department of Science and Technology was set up, and in the Fifth Plan (1974–1979), S&T planning was made part of the overall planning process.
As a result of these policies, technology transfers declined drastically between 1968 and 1980. FDI inflows also declined until, in the late 1970s, there was a net outflow. Growth of royalty payments slowed from 22.3 percent annually between 1970 and 1976 to 15.2 percent between 1977 and 1985. Some positive benefits did accrue, however: R&D expenditures in private companies increased more than eightfold between fiscal years 1970-71 and 1980-81. This led to near self-sufficiency in standard technologies; indeed, India began to export technology.
In the 1980s a half-hearted policy of liberalization and a reversal of the previous inward-looking policy began. Deregulation was implemented in a number of industries and some reforms were introduced, including reductions in import restrictions and tariffs.

34 | Manmohan Agarwal, Yao Li, John Whalley Approaches to Fostering Productivity Growth in Brazil, China and India | 35
Policy Changes in the Private Sector
With shifts in the priority of industrial policy since the 1980s, technology acquired a stronger focus. Restrictions on technology imports and foreign equity participation were relaxed. Up to 51 percent foreign equity was permitted in many sectors, except those reserved for the public sector. In areas of sophisticated technology and/or export-oriented ventures, up to 100 percent equity was allowed. The Technology Policy statement of 1983, for the first time, recognized the need to establish linkages among scientific, technological and financial institutions to promote the effective transfer of technology from institutions to industry. In 1985 a fully fledged Ministry of Science and Technology was created, and in 1986 a high-level post of scientific adviser and a science advisory council to the Prime Minister were set up. Also introduced were schemes to strengthen and provide quality assurance of in-house R&D and to grant recognition to scientific and industrial research organizations in the private sector.
The Indian government also began to provide soft loans and help raise venture capital funds to foster its National Innovation System through project-based programs. For example, the Home Grown Technology Program supports commercialization of technologies developed by indigenous research and development by providing soft loans (generally not exceeding 50 percent of the project cost) for technology development, repayable in user-friendly instalments after the completion of the project. India’s traditional financial institutions have also stepped up, with initiatives such as the Industrial Credit and Investment Corporation of India (ICICI) Bank’s Technology Support and Services Program.10
10 The ICICI was set up in 1954 to provide capital for investment by private enterprises. In 1994 it was transformed into a regular bank.

34 | Manmohan Agarwal, Yao Li, John Whalley Approaches to Fostering Productivity Growth in Brazil, China and India | 35
In addition, in order to correct the lack of direct financial support for R&D in the private sector, the Indian government has created a multitude of schemes to support the absorption of imported technologies by industry and to develop, implement and commercialize indigenous innovations (see Krishnan, 2003:7). India now offers many fiscal incentives for R&D, such as exemption from income tax for ten years for businesses whose main aim is R&D.
Towards a National Innovation System
In 1991, India undertook sweeping reforms to open the country to foreign investment and competition and to deregulate most industry to foster domestic competition. The tempo of liberalization has continued: every budget since that of 1991 has included further reform of the financial, infrastructure, information technology, telecommunications and foreign trade and investment sectors.
In this progressive environment, the promotion of R&D has re-established its importance, not only for exploiting inward technology but also for improving the efficiency of technology transfer. A new draft of the Technology Policy, enacted in 1993, emphasized strengthening linkages among industry, R&D institutions and financial institutions to encourage commercial exploitation of technologies developed in laboratories. It recommended a consortium approach to R&D and technology development involving academic institutions and national research laboratories for goal-oriented programs and new product development.
Among the initiatives emerging from this new focus have been the restructuring of public institutions and the strengthening of India’s role in international organizations. In particular, India now plays an active role in the work of the WTO, including the thorny issue of trade-related intellectual property rights.

36 | Manmohan Agarwal, Yao Li, John Whalley Approaches to Fostering Productivity Growth in Brazil, China and India | 37
In short, the Indian experience post-1991 has focused on liberalization strategies on the one hand, and active industrial and technology policies on the other, as mutually supportive. The government realizes there is an urgent need to revitalize the country’s scientific enterprise and raise the standards of S&T in Indian institutions to meet the challenges of an increasingly technological world. In effect, India plans to integrate science and technology into all spheres of national activity and to gear the generation of S&T developments to poverty alleviation and the improvement of the quality of life. That philosophy is reflected in its Science and Technology Policy 2003, which emphasizes the importance of adapting the national innovation system to the rapidly changing world order. One concrete, declared objective is
“to promote international science and technology cooperation towards achieving the goals of national development and security, and make it a key element of our international relations.” (Government of India, 2003)
4. Evaluation of ITT Policies in the Three Countries
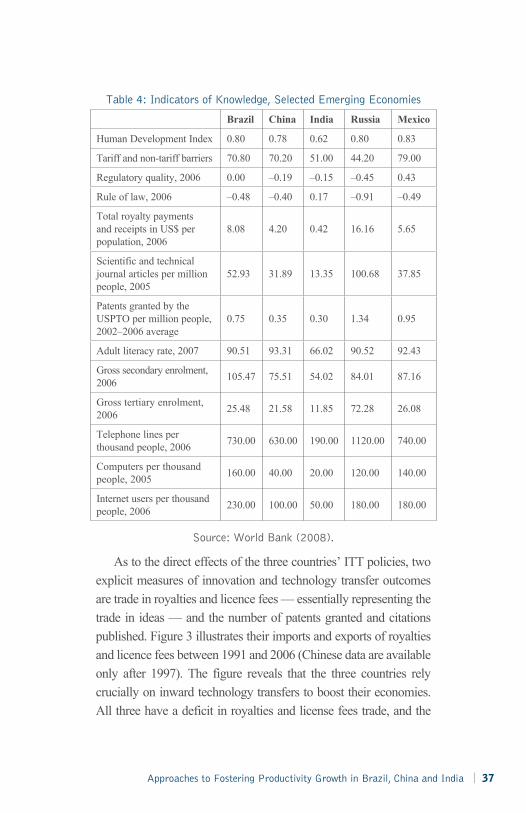
What effects, both direct and indirect, have ITT policies had on the positions of Brazil, China and India in the knowledge economy relative to, say, Russia and Mexico? To answer this question, we used the “basic scorecard” indicators from the Knowledge Assessment Methodology (KAM), developed by the World Bank (2008). As Table 4 shows, Brazil does best on all indicators except “rule of law” and “adult literacy,” while India does worst except on “rule of law” and “regulatory quality.” It is interesting to see, though, that productivity growth in Brazil nevertheless has been slower than in China and India, perhaps reflecting Brazil’s lingering separation of research and industry.
36 | Manmohan Agarwal, Yao Li, John Whalley Approaches to Fostering Productivity Growth in Brazil, China and India | 37
Table 4: Indicators of Knowledge, Selected Emerging Economies
Brazil China India Russia Mexico
Human Development Index 0.80 0.78 0.62 0.80 0.83
Tariff and non-tariff barriers 70.80 70.20 51.00 44.20 79.00
Regulatory quality, 2006 0.00 –0.19 –0.15 –0.45 0.43
Rule of law, 2006 –0.48 –0.40 0.17 –0.91 –0.49
Total royalty payments and receipts in US$ per population, 2006
8.08 4.20 0.42 16.16 5.65
Scientific and technical journal articles per million people, 2005
52.93 31.89 13.35 100.68 37.85
Patents granted by the USPTO per million people, 2002–2006 average
0.75 0.35 0.30 1.34 0.95
Adult literacy rate, 2007 90.51 93.31 66.02 90.52 92.43
Gross secondary enrolment, 2006 105.47 75.51 54.02 84.01 87.16
Gross tertiary enrolment, 2006 25.48 21.58 11.85 72.28 26.08
Telephone lines per thousand people, 2006 730.00 630.00 190.00 1120.00 740.00
Computers per thousand people, 2005 160.00 40.00 20.00 120.00 140.00
Internet users per thousand people, 2006 230.00 100.00 50.00 180.00 180.00
Source: World Bank (2008).
As to the direct effects of the three countries’ ITT policies, two explicit measures of innovation and technology transfer outcomes are trade in royalties and licence fees — essentially representing the trade in ideas — and the number of patents granted and citations published. Figure 3 illustrates their imports and exports of royalties and licence fees between 1991 and 2006 (Chinese data are available only after 1997). The figure reveals that the three countries rely crucially on inward technology transfers to boost their economies. All three have a deficit in royalties and license fees trade, and the

38 | Manmohan Agarwal, Yao Li, John Whalley Approaches to Fostering Productivity Growth in Brazil, China and India | 39
deficit is increasing over time. China’s imports, easily the highest of the three, grew at an average annual rate of 32.1 percent between 1997 and 2006, passing Brazil’s in 2000, suggesting that China’s ITT policies have been more successful than Brazil’s.
Figure 3: Trade in Royalties and Licence Fees, China, India and Brazil, 1991–2006 (US$ millions)
1990
020
0040
0060
00
1995Year
Roy
altie
s an
d Li
cens
e Fe
es (M
illio
n U
S$)
2000 2005
Imports (Solid LIne); Exports (Dashed LIne)
BRA CHN INDBRA CHN IND
Source: UNCTAD (2008).
We also used the number of patents and citations as an indicator of the effects of ITT policies. Patent-related indicators are often used in such analysis to measure innovations, but innovations are not always patented, and all patents are not equal in terms of importance or value. That is why we also looked at citations. An inventor who applies for a patent to protect the invention has a legal obligation to cite the previous relevant patent correctly; these “patent citations” leave a paper trail to track the technology transfer from existing ideas to new ideas.
As Figure 4 shows, both China and India have seen rapid growth in patents granted by the US Patent and Trademark Office (USPTO) since the early 1990s. For China, the number of so-called triadic

38 | Manmohan Agarwal, Yao Li, John Whalley Approaches to Fostering Productivity Growth in Brazil, China and India | 39
patents — those applied to and granted by the European Patent Office, the USPTO and the Japanese Patent Office, an expensive process generally limited to inventions that promise a high economic return — rose at an average annual rate of 33 percent between 1995 and 2003, the highest in the world (European Commission, 2007: 53). China has recently joined the top ten countries (mainly high- or upper-middle-income economies) that file international patents, according to the World Intellectual Property Organization, although its patents remain modest in number compared with those of the US, the European Union and Japan.
Figure 4: Patents Granted to China, India and Brazil by the USPTO, 1990–2003
Brazil China India
Num
ber o
f Pat
ents
0300
Grant Year1990 2005
200
100
1995 2000
Source: Author’s calculations based on data from Hall et al. (2006).
To measure the outward transfer of technology from Brazil, China and India, we also looked at citations received (Figure 5) as an indicator of how many current ideas are used by the world to produce new ideas; and to determine the inward transfer of technology, we looked at citations made (Figure 6) as a representation of how many existing ideas are used to produce new ideas. The figures show that all three countries

40 | Manmohan Agarwal, Yao Li, John Whalley Approaches to Fostering Productivity Growth in Brazil, China and India | 41
have recorded strong growth in citations received and made since the mid-1990s, with China coming from behind to surpass India in 1991 and Brazil in 2001. Brazil’s rate of growth of citations made has slowed considerably in recent years, however, suggesting that China and India both put more effort into using existing technology to produce new ideas, eventually reflected in their better performance than Brazil’s on the patents indicators.
Figure 5: Citations Received, China, India and Brazil, 1980–2004
200
600
400
800
1980
0
1985 1990Grant Year
Num
ber o
f Cita
tions
Rec
eive
d
1995 2000
Brazil China India
Source: Author’s calculations based on data from Hall et al. (2006).
Figure 5: Citations Made, China, India and Brazil, 1980–2004
Num
ber o
f Cita
tions
Mad
e0
500
1000
1500
2000
Grant Year1980 1985 1990 1995 2000
Brazil China India
Source: Author’s calculations based on data from Hall et al. (2006).
40 | Manmohan Agarwal, Yao Li, John Whalley Approaches to Fostering Productivity Growth in Brazil, China and India | 41
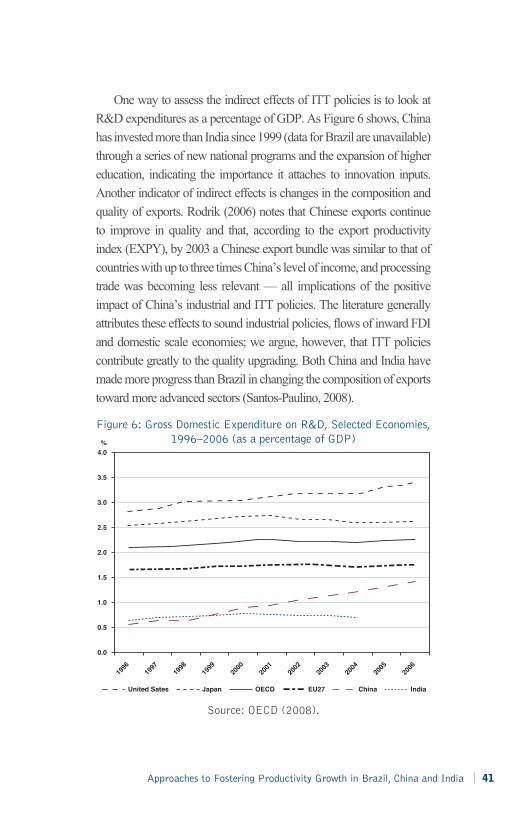
One way to assess the indirect effects of ITT policies is to look at R&D expenditures as a percentage of GDP. As Figure 6 shows, China has invested more than India since 1999 (data for Brazil are unavailable) through a series of new national programs and the expansion of higher education, indicating the importance it attaches to innovation inputs. Another indicator of indirect effects is changes in the composition and quality of exports. Rodrik (2006) notes that Chinese exports continue to improve in quality and that, according to the export productivity index (EXPY), by 2003 a Chinese export bundle was similar to that of countries with up to three times China’s level of income, and processing trade was becoming less relevant — all implications of the positive impact of China’s industrial and ITT policies. The literature generally attributes these effects to sound industrial policies, flows of inward FDI and domestic scale economies; we argue, however, that ITT policies contribute greatly to the quality upgrading. Both China and India have made more progress than Brazil in changing the composition of exports toward more advanced sectors (Santos-Paulino, 2008).
Figure 6: Gross Domestic Expenditure on R&D, Selected Economies, 1996–2006 (as a percentage of GDP)
United Sates Japan OECD EU27 China India
1996
1997
1998
1999
2000
2001
2002
2003
2004
2005
2006
0.0
0.5
1.0
1.5
2.0
2.5
3.0
3.5
4.0%
Source: OECD (2008).

42 | Manmohan Agarwal, Yao Li, John Whalley Approaches to Fostering Productivity Growth in Brazil, China and India | 43
5. Issues for ITT Policies
The foregoing discussion raises important issues about the design of ITT policies in the three countries. One issue is the size of the budget commitments to these policies and the nature of the interventions, including R&D expenditures and education. In China, for example, are the large resources devoted to growth of tertiary education sustainable or even justified?
Another issue is the form of ITT policies and whether they should be devised with a view to their possible application in developing countries. The general presumption in the literature on trade and related policies is to favour lack of discrimination and policy neutrality. However, if the externalities at stake in these situations are regionally or country focused in some way, or stronger in certain product areas than in others, it does suggest some form of discriminatory bias in the design of policies. The diffusion of innovations, namely the rate of their adoption by other firms, follows an S-shaped curve. The pace of adoption is slow until a threshold size of the product market is reached. Since developing country markets are smaller than rich country markets, some degree of subsidization may be needed to encourage diffusion of new technologies. ITT policies can also have strong links to the environment. If as part of the commitments Brazil, China and India seek in global negotiations on the environment involve innovation and technology transfer, then some degree of incorporation of environmental elements into their own overall ITT policies would make sense.
In summary, ITT policies are of growing importance in Brazil, China and India; however, their underlying rationale and coherence are, at times, elusive. As distinct from earlier periods when governments in the three countries focused on different aspects of the innovation cycle, there is nowadays more convergence as the

42 | Manmohan Agarwal, Yao Li, John Whalley Approaches to Fostering Productivity Growth in Brazil, China and India | 43
three governments adopt a variety of policies to boost innovation. Greater stress is being laid on encouraging innovations that have a commercial pay-off instead of encouraging more basic science, which was the vogue earlier in Brazil and India. In line with this greater interest in commercialization, private industry is more involved even when research is conducted in universities and special institutes. Policies towards education are being strengthened, with China stressing post- secondary education and India addressing the issue at all three levels of the education system. Brazil and India in particular are encouraging import of technology and more collaborative research between domestic and foreign sources. Given the commitment to economic growth in these countries and the significant role that innovation and technology transfer policies play, issues related to their design will remain critical. We expect that governments in the three countries will continue to experiment to discover the most effective ways to generate innovations.

44 | Manmohan Agarwal, Yao Li, John Whalley Approaches to Fostering Productivity Growth in Brazil, China and India | 45
Annex A: Ambiguities in the Concept of “Productivity Growth”
Ever since the pioneering work of Solow (1957), economists have recognized that factor accumulation accounts for only a very small part of the growth in income — Solow found it accounted for about one-quarter of income growth in the United States. The rest is an unexplained residual that economists have called “technical progress” or “productivity growth.” To call the residual “productivity growth” points to the problems of defining some of the key terms in this area.
This Annex highlights the vagueness of the concept of productivity growth. This vagueness leads to productivity growth being measured as a residual which sometimes leads to surprising results. The vagueness also means that governments keen to boost productivity and growth adopt a variety of policies in an attempt to influence innovation. Policies are sometimes evaluated in terms of inputs, for example as R&D expenditures, numbers of scientists, and so forth, or in terms of outputs, such as patents and scientific papers. Among the three countries studied for this paper, Brazil scores best on the basis of the knowledge indicator developed by the World Bank, based on its knowledge assessment methodology (World Bank, 2008) , but China has performed better in terms of productivity growth. India lags the other two in terms of education outcomes. China has made tremendous progress in post- secondary education and leads developing countries in terms of patents and scientific articles. In particular, China has sought to attract research talent and channel it into areas considered important for the national interest.
The vagueness of the concept of innovation influences the policies that governments adopt to accelerate productivity growth. The use of the residual as a measure of productivity growth creates many problems, as productivity growth then depends on the specification of the production function, particularly the treatment of capital.
44 | Manmohan Agarwal, Yao Li, John Whalley Approaches to Fostering Productivity Growth in Brazil, China and India | 45
For example, if one assumes it refers to vintage capital, rather than homogeneous capital, the contribution of the capital factor increases from about 12 percent to 19 percent and that of productivity growth declines (Solow, 1959).1 In Japan, the contribution of productivity growth to income growth seems to be about 50 percent if homogeneous capital is assumed and 47 percent if vintage capital is assumed, while in Taiwan the corresponding amounts are 43 percent and 31 percent (Singh and Trieu, 1999). In South Korea, estimates of the contribution of productivity growth to income growth range from about 25 percent (Dahlman and Andersson, 2000) to as high as 54.4 percent (Kim and Han, 2001, referring to the period between 1980 and 1994). In China productivity growth’s contribution to income growth traditionally has been very low, but since 1993 it has accounted for about 28 percent (Ozyurt, 2007). In India, productivity growth’s contribution was about 20 percent between 1950 and 1979 but increased to about 40 percent between 1980 and 2003 (Virmani, 2004).
Because the usual method of calculating total factor productivity (TFP) growth assumes neutral technical progress, it can result in sometimes surprising results. For instance, Abramovitz and David (1973, cited in Wright, 2006) find there was very little TFP growth in the late 19th century despite the large number of world-class innovations of the period. They attribute this phenomenon to biased technical change, which persistently raised the rate of profit and ensured high rates of investment.
1 Investments in different years buy capital goods built in different years. One can assume that capital goods built in 2008 are the same as those built in 2007 and the same as those built in 2006, and so forth. This assumes that capital goods are homogeneous; the investments in different years can be added to get the total capital stock. However, capital goods built in different years may not be the same. For instance, they might require different amounts of labour or produce different quantities of output. They are then considered heterogeneous and one cannot get the capital stock by simply adding investments in different years. Different techniques of estimation have to be used.
46 | Manmohan Agarwal, Yao Li, John Whalley Approaches to Fostering Productivity Growth in Brazil, China and India | 47
Works Cited
Abramovitz, Moses and Paul A. David (1973). “Reinterpreting Economic Growth: Parables and Realities,” American Economic Review. Vol. 63, No.2 (May). 428-439.
Aggarwal, A (2001). “Technology Policies and Acquisition of Technological Capabilities in the Industrial Sector: A Comparative Analysis of Indian and Korean Experiences,” Science, Technology and Society. Vol. 6, No. 2: 255-304.
Azam, M. (2009a). “Changes in Wage Structure in Urban India 1983-2004: A Quantile Regression Decomposition,” IZA Discussion Papers 3963. Institute for the Study of Labor (IZA).
——— (2009b). “India’s Increasing Skill Premium: Role of Demand and Supply,” IZA Discussion Papers 3968. Institute for the Study of Labor (IZA).
Azam, Mehtabul and Andreas Blom (2008). “Progress in Participation in Tertiary Education in India from 1983 to 2004,” Policy Research Working Paper Series 4793. The World Bank.
Bosworth, Barry, and Susan M. Collins (2007). “Accounting for Growth: Comparing China and India,” NBER Working Paper no. 12943. February.
Branstetter, Lee and Nicholas Lardy (2006). “China’s Embrace of Globalization,” NBER Working Papers 12373. National Bureau of Economic Research.
Buckley, P.J., Jeremy Clegg and Chengqi Wang (2002). “The Impact of Inward FDI on the Performance of Chinese Manufacturing Firms,” Journal of International Business Studies. Vol. 33, No. 4: 637-655.
46 | Manmohan Agarwal, Yao Li, John Whalley Approaches to Fostering Productivity Growth in Brazil, China and India | 47
Castro, AB and Souza FEP (1985). A Economia Brasileira em Marcha Forçada. Paz e Terra, Rio de Janeiro.
Chen, Jin, Dake Xu, Bei Wu, and Chang Bing Jiang (2006). “An Empirical Analysis of Technological Innovation Policy in China,” Management of Innovation and Technology, 2006. IEEE International Conference. Vol. 1: 202-206.
Chun, Hyunbae, Hak K. Pyo and Keun Hee Rhee (2008). “Total Factor Productivity in Korea and International Comparison - Data Structure and Productivity Estimates of Korea Industrial productivity Database”. Unpublished.
Cohen, Daniel and Marcelo Soto (2007). “Growth and human capital: good data, good results,” Journal of Economic Growth. Vol. 12, No.1 (March). Pp. 51-76.
Dalhman, Carl J. and Frischtak CR (1993). “National systems supporting technical advance in industry: the Brazilian experience” in Nelson, RR, ed. National Innovation Systems: A Comparative Analysis. New York and Oxford: Oxford University Press.
Dalhman, Carl J. and Thomas Andersson (2000). Korea and the Knowledge-Based Economy Making the Transition. The World Bank Institute.
Desai, A V (1980). “The Origin and Direction of R&D in India,” Research Policy. Vol. 9, No.1: 74-96
Gupta, Ashwani, and P.K. Dutta (2005). “Indian Innovation System - Perspective and Challenges,” Technology Exports. April-June.

48 | Manmohan Agarwal, Yao Li, John Whalley Approaches to Fostering Productivity Growth in Brazil, China and India | 49
Hu, A. (2003). “Promoting Economic Growth with Equity, Sharing Achievement of Reform and Development,” (in Chinese), China Country Economic Memorandum: Promoting Growth with Equity (Chinese Edition). Beijing: Tsinghua University Press.
Huang, Can, Celeste Amorim, Mark Spinoglio, Borges Gouveia, and Augusto Medina (2004). “Organization, programme and structure: an analysis of the Chinese innovation policy framework.” R&D Managemen . Vol. 34, No. 4: 367-387.
Kim, S. and G. Han (2001). “A decomposition of Total Factor productivity Growth in Korean Manufacturing Industries: A Stochastic frontier Approach,” Journal of Productivity Analysis. Vol. 16 (November): 269-281.
Kondo, M. (1997). “China: technology policy in a transitional economy-engineering research centers to bridge research units and enterprises,” The Japan Society for Science Policy and Research Management. Vol. 12, No. 3/4: 169-192.
Krishnan, RT (2003). ”The evolution of a developing country innovation system during economic liberalization: the case of India.” Paper presented at The First Globelics Conference, Rio de Janeiro. Available at: http://www.globelics.org.
Kwan, C.H. (2006). “Improving Investment Efficiency in China through Privatization and Financial Reform,” Nomura Capital Market Review. Vol. 9, No. 2: 33-43.
Li, Yao, John Whalley, Shunming Zhang, and Xiliang Zhao (2008). “The Higher Educational Transformation of China and Its Global Implications,” NBER Working Papers 13849. National Bureau of Economic Research.
48 | Manmohan Agarwal, Yao Li, John Whalley Approaches to Fostering Productivity Growth in Brazil, China and India | 49
Liu, X. and Chenggang Wang (2003), “Does Foreign Direct Investment Facilitate Technological Progress? Evidence from Chinese Industries,” Research Policy. Vol. 32: 945-953.
Ministry of Education of the People’s Republic of China (2003). “Chang Jiang Scholar Program, Beijing.” Available at: http://www.cksp.edu.cn
Ministry of Science and Technology of China (MOST) (2007). China Science and Technology Statistics Data Book. Beijing.
Organisation for Economic Co-operation and Development (OECD) (2007). OECD Reviews of Innovation Policy – China Synthesis Report. Paris.
——— (2003). Investment Policy Review of China: Progress and Reform Challenges. Paris.
Ozyurt, Selin (2007). “Total Factor Productivity Growth in Chinese Industry: 1952-2005,” Working Papers 07-13. LAMETA, University of Montpellier.
Qian, Jinqiu (2008). “National High-tech Industry Development Zones.” EU S&T Counsellors Meeting, Beijing.
Rodrik, Dani (2006). “What’s So Special about China’s Exports?” China & World Economy. Vol. 14, No. 5. Institute of World Economics and Politics, Chinese Academy of Social Sciences. Pp. 1-19.
Sandhya, G.D., A.Jain and P. Mathur (1990). “S&T Planning, Policy Direction and CSIR,” Economic and Political Weekly. Vol. 25, No. 51: 2800-2805.
Santos-Paulino, Amelia U. (2008). “Export Productivity and Specialization in China, Brazil, India and South Africa,” Working Papers RP2008/28. World Institute for Development Economic Research (UNU-WIDER).
50 | Manmohan Agarwal, Yao Li, John Whalley Approaches to Fostering Productivity Growth in Brazil, China and India | 51
Singh, Nirvikar and Hung Trieu (1999). “Total Factor Productivity Growth in Japan, South Korea and Taiwan,” Indian Economic Review. Vol. 34, no. 2. Department of Economics, Delhi School of Economics. Pp. 93-112.
Solow, R.M. (1959). ”Investment and Technical Progress,” in Arrow, K., Karbin, S. and P. Suppes (eds.), Mathematical Methods in the Social Sciences. Stanford: Stanford University Press.
Solow, R.M. (1957). “Technical Change and the Aggregate Production Function,” Review of Economics and Statistics. Vol. 39: 312-320.
Vaidya, K., Bennett, D. and Liu, X. (2007). “Is China’s Manufacturing Sector Becoming More High-Tech? Evidence on Shifts in Comparative Advantage, 1987-2005,” Journal of Manufacturing Technology Management. Vol. 18, No. 8: 1000-1021.
Virmani, Arvind (2004). “Sources of India’s Economic Growth: Trends in Total Factor Productivity,” ICRIER WP No. 131. May. New Delhi, India.
Wen, Jiang, and Shinichi Kobayashi (2002). “Impacts of government high-tech policy: a case study of CAD technology in China,” Journal of Engineering and Technology Management. Vol. 19: 321-342.
World Bank (2008). Measuring Knowledge in the World’s Economies - Knowledge Assessment Methodology and Knowledge Economy Index. The World Bank Institute.
Wright, Gavin (2006). “Productivity Growth and the American Labor Market,” in Rhode and Toniolo (eds.) The Global Economy in the 1990s: A Long Run Perspective. Cambridge University Press.
50 | Manmohan Agarwal, Yao Li, John Whalley Approaches to Fostering Productivity Growth in Brazil, China and India | 51
Pei, X. (2004). “Science and Technology Business Incubators, One of the Pillars of China Torch Program”. Torch High Technology Industry Development Center, MOST, China. Available at: www.redetec.org.br/reinc/nbia/sci_tech_china.pdf
Zheng, J. and A. Hu (2006). “An empirical analysis of provincial productivity in China (1979–2001),” Journal of Chinese Economic and Business Studies. Vol.4, No. 3: 221–239.
52 | Manmohan Agarwal, Yao Li, John Whalley Approaches to Fostering Productivity Growth in Brazil, China and India | 53
CIGI Working Paper Series(for a full listing please visit: www.cigionline.org)
47 Manmohan Agarwal, Yao Li, John Whalley, “Approaches to Fostering Productivity Growth in Brazil, China and India.” May 2010.
46 Daniel P. Erikson, “The Obama Administration and Latin America: Towards a New Partnership?” April 2010.
45 Jennifer Clapp,Steven Bernstein and Matthew Hoffmann, “Reframing Global Environmental Governance: Results of a CIGI/CIS Collaboration.” December 2009.
44 Richard L. Bernal, “Participation of Small Developing Economies in the Governance of the Multilateral Trading System.” December 2009.
43 Ramin Jahanbegloo, “The Obama Administration and Iran: Towards a Constructive Dialogue.” June 2009.
42 Jocelyne Bourgon, “Reform and Modernization of the OECD.” May 2009.
41 Min Gong and Wenpu Li, “China’s Role as a Trade Bridge for Expanding Regional and World Trade.” October 2008.
40 Hany Besada, “The Implications of China’s Ascendancy for Africa.” October 2008.
39 Manmohan Agarwal, “The BRICSAM Countries and Changing World Economic Power: Scenarios to 2050.” October 2008.
38 Hany Besada and Nicky Moyo, “Zimbabwe in Crisis: Mugabe’s Policies and Failures.” October 2008.
52 | Manmohan Agarwal, Yao Li, John Whalley Approaches to Fostering Productivity Growth in Brazil, China and India | 53
37 Peter K. Yu, “Building Intellectual Property Coalitions for Development.” September 2008.
36 Gurpreet Mahajan, “Higher Education Reservations and India’s Economic Growth: An Examination.” September 2008.
35 Heidi Ullrich, ““Global Health Governance and Multi-Level Coherence: Can the G8 Provide a Cure?” July 2008.
34 Frédéric Grare, “Anatomy of a Fallacy: The Senlis Council and Narcotics in Afghanistan.” February 2008.
33 Hany Besada and Usman Hannan, “Dimensions of State Fragility: A Review of the Social Science Literature.” November 2007.
32 Carin Holroyd, “Science and Technology Policies, National Competitiveness, and the Innovation Divide.” October 2007.
31 Agata Antkiewicz and Bessma Momani, “Pursuing Geopolitical Stability through Interregional Trade: The EU’s Motives for Negotiating with the Gulf Cooperation Council.” September 2007.
30 Robert Wolfe, “Can the Trading System be Governed? Institutional Implications of the WTO’s Suspended Animation.” September 2007.
29 Andrew F. Cooper, “Celebrity Diplomacy and the G8: Bono and Bob as Legitimate International Actors.” September 2007.
28 Hany Besada, “Egypt’s Constitutional Test: Averting the March toward Islamic Fundamentalism.” August 2007.

54 | Manmohan Agarwal, Yao Li, John Whalley Approaches to Fostering Productivity Growth in Brazil, China and India | 55
27 Hany Besada, “Fragile Stability: Post-Apartheid South Africa.” August 2007.
26 Agata Antkiewicz and Bessma Momani, “Canada’s Economic Interests in the Middle East.” July 2007.
25 Rajiv Kumar, Amitendu Palit, and Karan Singh, “Sustainability of Economic Growth in India.” May 2007.
24 John Whalley and OG Darayanta-Banda, “After the MFA, the CCAs (China Containment Agreements).” May 2007.
23 Simon Evenett, “EU Commercial Policy in a Multipolar Trading System.” April 2007.
22 John Whalley and OG Darayanta-Banda, “Regional Monetary Arrangements in ASEAN+3 as Insurance through Reserve Accumulation and Swaps.” April 2007.
21 John Whalley and Weimin Zhou, “Technology Upgrading and China’s Growth Strategy to 2020.” March 2007.
20 Peter Hajnal, “Summitry from G5 to L20: A Review of Reform Initiatives.” March 2007.
19 Tony Porter, “Beyond the International Monetary Fund: The Broader Institutional Arrangements in Global Financial Governance.” February 2007.
18 Ramesh C. Kumar, “Poverty Reduction and the Poverty Reduction Facility at the IMF: Carving a New Path or Losing Its Way?” February 2007.
17 Ngaire Woods and Domenico Lombardi, “The Political Economy of IMF Surveillance.” February 2007.

54 | Manmohan Agarwal, Yao Li, John Whalley Approaches to Fostering Productivity Growth in Brazil, China and India | 55
16 Bessma Momani and Eric Helleiner, “Slipping into Obscurity? Crisis and Reform at the IMF.” February 2007.
15 Carol Wise, “Great Expectations: Mexico’s Short-Lived Convergence under NAFTA.” January 2007.
14 Nicola Phillips, “Consequences of an Emerging China: Is Development Space Disappearing for Latin American and the Caribbean?” January 2007.
13 Stephen Y.L. Cheung, and Hasung Jang, “Scorecard on Corporate Governance in East Asia.” December 2006.
12 Agata Antkiewicz, Andrew F. Cooper, and Timothy Shaw, “Economic Size Trumps All Else? Lessons from BRICSAM.” December 2006.
11 Jorge Heine, “On the Manner of Practising the New Diplomacy.” October 2006.
10 Annette Hester, “A Fresh Approach to US Energy Security and Alternative Fuels: The Western Hemisphere and the Ethanol Option.” October 2006.
9 John Whalley, “Recent Regional Agreements: Why so many, so fast, so different and where are they headed?” September 2006.
8 John Whalley, “The Asian Economic Revolution and Canadian Trade Policy.” August 2006.
7 Ramesh Thakur, “Fast Forward to the Past? The Line in the Sand from Iraq to Iran.” August 2006.
6 Jennifer Clapp, “Developing Countries and the WTO Agriculture Negotiations.” March 2006.

56 | Manmohan Agarwal, Yao Li, John Whalley
5 Daniel Drache, “Trade, Development and the Doha Round: A Sure Bet or a Train Wreck?” March 2006.
4 Andrew F. Cooper, “Adding 3Ns to the 3Ds: Lessons from the 1996 Zaire Mission for Humanitarian Interventions.” December 2005.
3 Agata Antkiewicz and John Whalley, “BRICSAM and the Non-WTO.” October 2005.
2 John Whalley, “China in the World Trading System.” October 2005.
1 Andrew F. Cooper, “Stretching the Model of “Coalitions of the Willing.” October 2005.

56 | Manmohan Agarwal, Yao Li, John Whalley

The Centre for International Governance Innovation is an independent,
nonpartisan think tank that addresses international governance challenges. Led
by a group of experienced practitioners and distinguished academics, CIGI
supports research, forms networks, advances policy debate, builds capacity,
and generates ideas for multilateral governance improvements. Conducting an
active agenda of research, events, and publications, CIGI’s interdisciplinary
work includes collaboration with policy, business and academic communities
around the world.
CIGI conducts in-depth research and engages experts and partners worldwide
from its extensive networks to craft policy proposals and recommendations that
promote change in international public policy. Current research interests focus
on international economic and financial governance both for the long-term and
in the wake of the 2008-2009 financial crisis; the role of the G20 and the newly
emerging powers in the evolution of global diplomacy; Africa and climate
change, and other issues related to food and human security.
CIGI was founded in 2002 by Jim Balsillie, co-CEO of RIM (Research
In Motion) and collaborates with and gratefully acknowledges support from a
number of strategic partners, in particular the Government of Canada and the
Government of Ontario.
Le CIGI a été fondé en 2002 par Jim Balsillie, co-chef de la direction
de RIM (Research In Motion). Il collabore avec de nombreux partenaires
stratégiques et leur exprime toute sa reconnaissance pour leur soutien. Il
remercie tout particulièrement le gouvernement du Canada, de même que le
gouvernement de l’Ontario.
To learn more about CIGI please visit www.cigionline.org
Addressing International Governance Challenges


57 Erb Street WestWaterloo, Ontario, Canada N2L 6C2
tel +1.519.885.2444 fax +1.519.885.5450
www.cigionline.org