the cellular immune response to mycobacterium tuberculosis ... · mycobacterium tuberculosis...
TRANSCRIPT
of September 6, 2018.This information is current as
Guinea Pig Infection in theMycobacterium tuberculosis
The Cellular Immune Response to
Orme and Randall J. BasarabaHenao-Tamayo, Erin E. Smith, Crystal Shanley, Ian M. Diane Ordway, Gopinath Palanisamy, Marcela
http://www.jimmunol.org/content/179/4/2532doi: 10.4049/jimmunol.179.4.2532
2007; 179:2532-2541; ;J Immunol
Referenceshttp://www.jimmunol.org/content/179/4/2532.full#ref-list-1
, 12 of which you can access for free at: cites 42 articlesThis article
average*
4 weeks from acceptance to publicationFast Publication! •
Every submission reviewed by practicing scientistsNo Triage! •
from submission to initial decisionRapid Reviews! 30 days* •
Submit online. ?The JIWhy
Subscriptionhttp://jimmunol.org/subscription
is online at: The Journal of ImmunologyInformation about subscribing to
Permissionshttp://www.aai.org/About/Publications/JI/copyright.htmlSubmit copyright permission requests at:
Email Alertshttp://jimmunol.org/alertsReceive free email-alerts when new articles cite this article. Sign up at:
Print ISSN: 0022-1767 Online ISSN: 1550-6606. Immunologists All rights reserved.Copyright © 2007 by The American Association of1451 Rockville Pike, Suite 650, Rockville, MD 20852The American Association of Immunologists, Inc.,
is published twice each month byThe Journal of Immunology
by guest on September 6, 2018
http://ww
w.jim
munol.org/
Dow
nloaded from
by guest on September 6, 2018
http://ww
w.jim
munol.org/
Dow
nloaded from
The Cellular Immune Response to Mycobacterium tuberculosisInfection in the Guinea Pig1
Diane Ordway,2 Gopinath Palanisamy, Marcela Henao-Tamayo, Erin E. Smith,Crystal Shanley, Ian M. Orme, and Randall J. Basaraba
Pulmonary tuberculosis in guinea pigs is an extremely useful model for drug and vaccine testing due to the fact that its pathologicaldisease process is similar to that present in humans. Progress in this field has been hindered because the tools necessary toundertake a complete immunological analysis of the guinea pig cellular immune response against Mycobacterium tuberculosis havebeen lacking. In this study, we combined a new flow cytometric gating strategy with immunohistochemistry to track T cells, B cells,and the MIL4 Ab, which detects both guinea pig heterophils (neutrophils) and eosinophils, to provide the first documentation ofthe kinetics of influx and positioning of these cell populations. The results show that the responding T cells are mostly CD4 cellsand that after day 30 of the infection numbers of these cells in the lungs drops dramatically. These appear to be replaced by asteady increase in B cells and granulocytes which was associated with worsening lung pathology. These data reveal new infor-mation about the cellular phenotypes which mediate protective immunity or host immunopathogenesis during M. tuberculosisinfection in this key animal model. The Journal of Immunology, 2007, 179: 2532–2541.
A pproximately 2 million people die each year from tuber-culosis (1, 2). Moreover, it has been estimated that asmuch as one-third of the world’s population harbors the
bacillus in some form of latent or dormant infection (2, 3) and, ofthese, 5 to 10% will progress to active disease. At present, the onlyavailable vaccine against tuberculosis is the attenuated strain ofMycobacterium bovis bacillus Calmette-Guerin, but it now is gen-erally agreed that this vaccine is ineffective in adults (4–6). Inaddition, new drug development has been slow (7). This has leadto an urgent need for development of new vaccines and drugs fortreatment of this disease.
A wide variety of animal models have been used to test newvaccines and drugs (8–11). Low-dose aerosol infection of theguinea pig with Mycobacterium tuberculosis produces a well-char-acterized disease that shares important morphologic and clinicalfeatures with human tuberculosis (10, 12, 13). However, mice arethe most widely used small animal model because of the broaderavailability of immunological reagents, and of inbred and geneti-cally engineered strains with well-defined genotypes (8, 12, 13).The one notable disadvantage of the mouse model is that the pul-monary and extrapulmonary pathology following aerosol chal-lenge lack important morphologic features that are commonly seenin guinea pigs and humans. The ability to more precisely charac-terize the clinical disease in conjunction with the immune andinflammatory response to M. tuberculosis in the guinea pig wouldgreatly improve the usefulness of this animal model for the testingand evaluation of urgently needed vaccines and antituberculosisdrugs.
In the past, the primary drawback of the guinea pig model wasa relative lack of specific immunological reagents with which tomonitor the emerging acquired immune response in infected ani-mals. However, this situation is gradually improving with theavailability of a few Abs to T cell markers and the development ofPCR-based techniques to measure key cytokines and chemokines(10, 14–19). In this study, we have taken advantage of these avail-able Abs to monitor immunity by flow cytometry. Although thishas been attempted before (10), a variety of technical difficultieshave been evident, ranging from the processing of lung tissues tothe initial cell-gating parameters. Traditionally, this is based onforward/side scatter (FSC/SSC)3 flow cytometric gating, the use ofwhich has proven difficult to adequately and consistently identifythe distinct fractions of guinea pig cells. Recently however, a tech-nical solution to this has been demonstrated (18, 20) that usesgating based on SSC and a specific Ab (MIL4), which we haveused here. The population of MIL4� cells is composed of bothguinea pig heterophils (neutrophils) and eosinophils. This has al-lowed us to track the kinetics of influx of CD4 and CD8 T cells,B cells, and MIL4� granulocytes into the infected lung.
The disease that develops in the guinea pig following aerosolexposure to M. tuberculosis can be divided into acute, subacute,and chronic stages of infection based on the pattern of bacterialgrowth and dissemination, as well as patterns of pulmonary andextrapulmonary pathology (12, 14, 15). During acute infection,there is an initial 3-day lag in bacterial growth, followed by an�2-wk period of rapid proliferation in the lung and draining lymphnodes. This stage is also characterized by progression of granulo-matous inflammation and necrosis in the primary lesion complexof the lung and draining mediastinal lymph nodes. The subacute orbacillemic phase from 2 to 4 wk is characterized by the emergenceof a stationary phase of bacterial replication in the lung and lymphnodes. During this phase, the most severe inflammation within theprimary lesion begins to subside but not before it has replaced asignificant proportion of the normal tissue, particularly in the
Mycobacteria Research Laboratories, Department of Microbiology, Immunology andPathology, Colorado State University, Fort Collins, CO 80523
Received for publication March 5, 2007. Accepted for publication May 30, 2007.
The costs of publication of this article were defrayed in part by the payment of pagecharges. This article must therefore be hereby marked advertisement in accordancewith 18 U.S.C. Section 1734 solely to indicate this fact.1 This work was supported by National Institutes of Health Grant AI-054697.2 Address correspondence and reprint requests to Dr. Diane Ordway, Department ofMicrobiology, Immunology and Pathology, Colorado State University, Fort Collins,CO 80523-1682. E-mail address: [email protected]
3 Abbreviations used in this paper: FSC, forward scatter; SSC, side scatter.
Copyright © 2007 by The American Association of Immunologists, Inc. 0022-1767/07/$2.00
The Journal of Immunology
www.jimmunol.org
by guest on September 6, 2018
http://ww
w.jim
munol.org/
Dow
nloaded from
draining lymph nodes (12, 15). Moreover, in this subacute stage,infection is established in multiple extrapulmonary sites such asthe spleen and liver by hematogenous dissemination of bacilli.Concurrent with bacillemia and exponential bacterial growth inextrapulmonary sites, there is reinfection of the lung by the hemo-genous route. Finally, the chronic stage is characterized by con-tinued bacterial replication in extrapulmonary tissues but with ei-ther stationary or a gradual increase in bacterial numbers in thelung and lymph nodes. Therefore, the morbidity and mortality ofguinea pigs at this stage is due to the combined effect of progres-sive pulmonary and extrapulmonary pathology.
The results of this study show that during the acute and subacutestages of infection the immune response involves the recruitmentof more CD4 T cells, including cells expressing the activationmarker CD45, with only an apparently minimal involvement byCD8 T cells. However, after the first month, at a time where thelung and lymph node pathology progressively worsens, the num-bers of CD4 T cells in the lungs drops precipitously, and is re-placed by B cells and MIL4� granulocytes during the chronic dis-ease state. These data are discussed in the context of diseaseprogression, immunopathology, and M. tuberculosis proliferationand dissemination.
Materials and MethodsGuinea pigs
Female outbred Hartley guinea pigs (�500 g in weight) were purchasedfrom Charles River Laboratories and held under barrier conditions in abiosafety level III animal laboratory. The specific pathogen-free nature ofthe guinea pig colonies was demonstrated by testing sentinel animals. Allexperimental protocols were approved by the Animal Care and UsageCommittee of Colorado State University.
Experimental infections in guinea pigs
Guinea pigs were challenged using a Madison chamber aerosol generationdevice, by delivering M. tuberculosis H37Rv at a low-dose aerosol of 20bacilli. Animals were then assayed for lung, lymph node, spleen bacterialloads, histology, and cell homogenates for flow cytometric analysis on days5, 15, 20, 30, 60, and 90 of the infection. Bacterial counts in the organs ofguinea pigs (n � 4) at each time point of the study were determined byplating serial dilutions of homogenates of lungs on nutrient 7H11 agar andcounting CFU after 3 wk of incubation at 37°C.
Histological analysis in guinea pigs
The lung lobes, spleen, and lymph nodes from each guinea pig were fixedwith 4% paraformaldehyde in PBS. Sections from these tissues werestained using H&E and the Ziehl-Neelsen stain for acid-fast bacilli as pre-viously reported (14). In guinea pigs, the concurrent progression of lung andlymph node lesions was evaluated using a histological grading system. Themethod for grading granulomatous lesions was based on inflammatory cellnumbers and their infiltrative distribution pattern in the organs was assayed(14). Scoring of lung and lymph node lesions was based on randomly selectedsections in a representative experiment from five infected guinea pigs and threenoninfected guinea pigs at indicated times after infection.
Immunohistochemistry
Once removed from the pulmonary cavity, the cranial lobe of the lungswere embedded in OCT, frozen in liquid nitrogen, then stored at �80°C.Serial sections, 8- to 10-�m thick, from each lung were cut on a cryostat(CM 1850; Leica) using the Instrumedics tape transfer system, fixed in coldacetone, and air dried. The sections were washed, and nonspecific Ab bind-ing was blocked with a 3% BSA-PBS solution. Thereafter, the sectionswere incubated overnight at 4°C with one of the following purified primaryAbs listed in Table I (Serotec). All sections were washed three times in
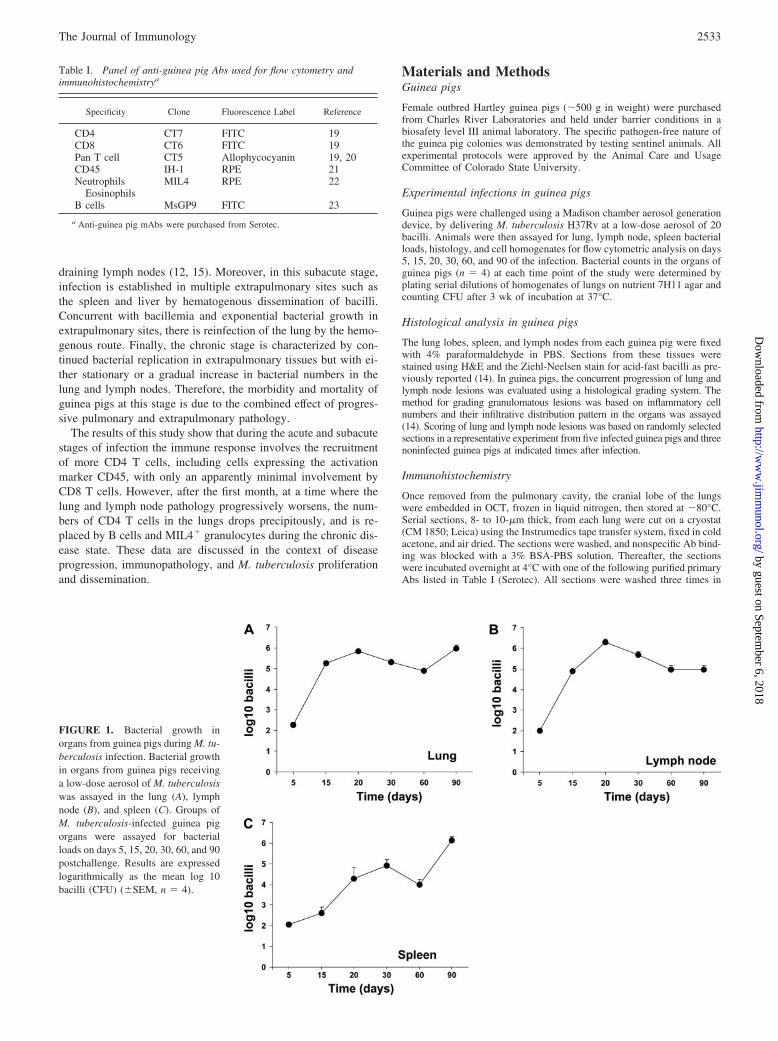
FIGURE 1. Bacterial growth inorgans from guinea pigs during M. tu-berculosis infection. Bacterial growthin organs from guinea pigs receivinga low-dose aerosol of M. tuberculosiswas assayed in the lung (A), lymphnode (B), and spleen (C). Groups ofM. tuberculosis-infected guinea pigorgans were assayed for bacterialloads on days 5, 15, 20, 30, 60, and 90postchallenge. Results are expressedlogarithmically as the mean log 10bacilli (CFU) (�SEM, n � 4).
Table I. Panel of anti-guinea pig Abs used for flow cytometry andimmunohistochemistrya
Specificity Clone Fluorescence Label Reference
CD4 CT7 FITC 19CD8 CT6 FITC 19Pan T cell CT5 Allophycocyanin 19, 20CD45 IH-1 RPE 21Neutrophils
EosinophilsMIL4 RPE 22
B cells MsGP9 FITC 23
a Anti-guinea pig mAbs were purchased from Serotec.
2533The Journal of Immunology
by guest on September 6, 2018
http://ww
w.jim
munol.org/
Dow
nloaded from
PBS and incubated with the secondary detection Ab F(ab�)2 rabbit anti-mouse conjugated to HRP (Serotec). Finally, the reaction was developedusing aminoethylcarbazole (BioGenex) as substrate. The sections werecounterstained with Meyer’s hematoxylin and thereafter mounted withcrystal/mount (BioGenex). Our experiments used different lung lobes ofthe guinea pig for immunohistochemistry and flow cytometry because wehave shown the lesions are randomly scattered throughout the guinea pigsinfected lung by evaluating the histopathology and magnetic resonanceimaging of pulmonary lesions in guinea pigs (16).
Organ cell digestion
To prepare single-cell suspensions the lungs, lymph nodes, and spleenswere perfused with 20.0 ml of a solution containing PBS and heparin (50U/ml; Sigma-Aldrich) through the pulmonary artery and the caudal lobeaseptically removed from the pulmonary cavity, placed in medium, anddissected. The dissected lung tissue was incubated with complete DMEMcontaining collagenase XI (0.7 mg/ml; Sigma-Aldrich) and type IV bovinepancreatic DNase (30 �g/ml; Sigma-Aldrich) for 30 min at 37°C. Thedigested lungs were further disrupted by gently pushing the tissue twicethrough a cell strainer (BD Biosciences). RBC were lysed with ACKbuffer, washed, and resuspended in complete DMEM. Total cell numbersper lung were determined using a hemocytometer.
Flow cytometric analysis of cell surface markers
Single-cell suspensions from the of the lungs and one-third portions of thewhole spleens and lymph nodes were prepared as described before (17, 18).In addition, leukocytes were separated from 10 ml of guinea pig blood asdescribed before (18). Cell suspensions from each individual guinea pigwere incubated first with the CD4 (19), CD8 (19), pan T cell (19, 20),CD45 (21), MIL4 (22), and B cell (23) Abs listed in Table I at 4°C for 30
min in the dark and after washing the cells with PBS containing 0.1%sodium azide (Sigma-Aldrich). Data acquisition and analysis were doneusing a FACSCalibur (BD Biosciences) and CellQuest software (BD Bio-sciences). Compensation of the spectral overlap for each fluorochrome wasdone using CD4 or MIL4 or CD3 Ags from cells gated in the FSClow vsSSClow; FSCmid/high vs SSCmid/high; SSClow vs MIL4�; SSChigh vs MIL4neg
and SSChigh vs MIL4� region, respectively. Analyses were performed withan acquisition of at least T cells (100,000 total events).
Statistical analysis in guinea pigs
Data are representative of two experiments and presented using the meanvalues from individual guinea pigs within each group (n � 4) and � SEM.ANOVA was completed.
ResultsBacterial growth in guinea pigs infected with M. tuberculosis
Guinea pigs exposed to �20 bacilli of M. tuberculosis were eval-uated for bacterial loads in the lung, spleen, and lymph node atindicated time points (Fig. 1). Infected guinea pigs showed anincrease of �3.5 logs over the first 20 days of infection (Fig.1A), followed by a chronic phase of disease. A similar rise innumbers to those seen in the lungs was observed in the draininglymph nodes (mediastinal lymph node cluster) (Fig. 1B). Bac-teria could be detected disseminating to the spleens of the an-imals by day 5, although bacterial numbers then increased at aslower rate (Fig. 1C).
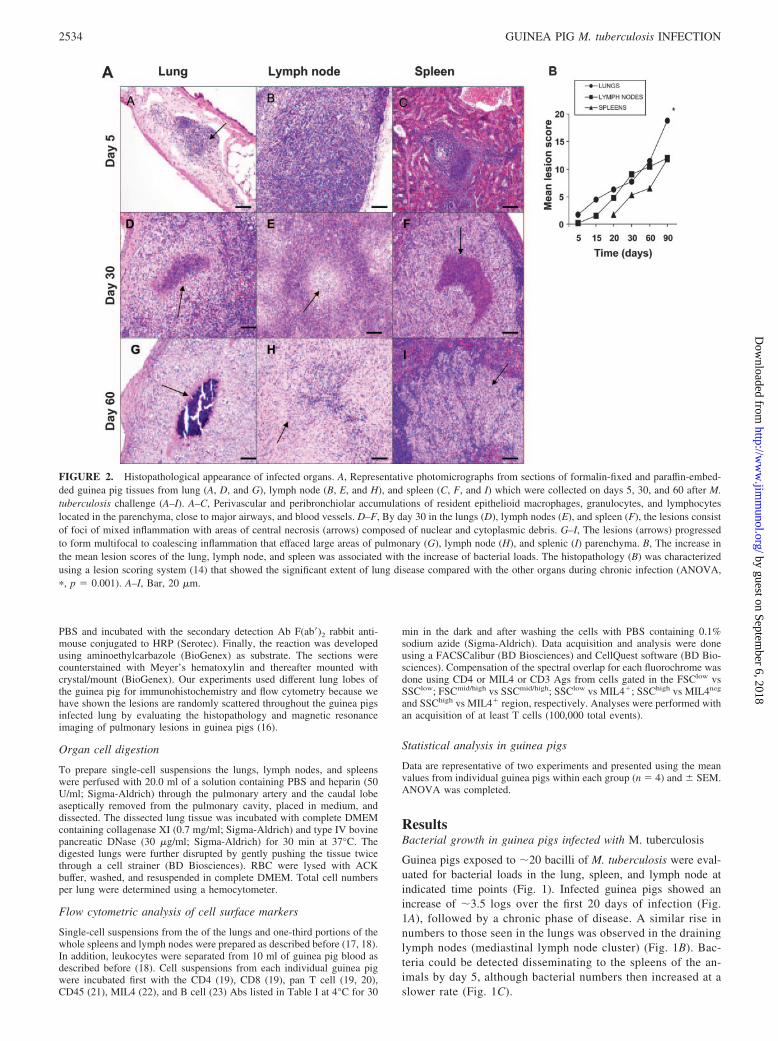
FIGURE 2. Histopathological appearance of infected organs. A, Representative photomicrographs from sections of formalin-fixed and paraffin-embed-ded guinea pig tissues from lung (A, D, and G), lymph node (B, E, and H), and spleen (C, F, and I) which were collected on days 5, 30, and 60 after M.tuberculosis challenge (A–I). A–C, Perivascular and peribronchiolar accumulations of resident epithelioid macrophages, granulocytes, and lymphocyteslocated in the parenchyma, close to major airways, and blood vessels. D–F, By day 30 in the lungs (D), lymph nodes (E), and spleen (F), the lesions consistof foci of mixed inflammation with areas of central necrosis (arrows) composed of nuclear and cytoplasmic debris. G–I, The lesions (arrows) progressedto form multifocal to coalescing inflammation that effaced large areas of pulmonary (G), lymph node (H), and splenic (I) parenchyma. B, The increase inthe mean lesion scores of the lung, lymph node, and spleen was associated with the increase of bacterial loads. The histopathology (B) was characterizedusing a lesion scoring system (14) that showed the significant extent of lung disease compared with the other organs during chronic infection (ANOVA,�, p � 0.001). A–I, Bar, 20 �m.
2534 GUINEA PIG M. tuberculosis INFECTION
by guest on September 6, 2018
http://ww
w.jim
munol.org/
Dow
nloaded from
Evaluation of infected tissue pathology
As previously described (12, 15), by day 5 of the infection the lunglesions consisted of small aggregations of resident cells close tomajor airways and blood vessels (Fig. 2A). As the granulomatousresponse increased in intensity, by day 30, lesions in all three or-gans consisted of foci of mixed inflammation with areas of centralnecrosis composed of nuclear and cytoplasmic debris (Fig. 2, AD–AF). The foci of necrosis were surrounded by predominately epi-thelioid macrophages and lymphocytes. At the interface with morenormal parenchyma, increased numbers of lymphocytes within in-creased fibrous connective tissue was observed. The lesions con-tinued to progress to form multifocal coalescing inflammation thateffaced large areas of pulmonary (Fig. 2AG), lymph node (Fig.2AH), and splenic (Fig. 2AI) parenchyma by day 60 of the infec-tion. By this time, debris within the necrotic centers of the lesionshad become mineralized (Fig. 2AG) and was surrounded by epi-thelioid macrophages. Fig. 2B shows an overall pathology scorefor each organ; it was noted that in the lungs, pathology worsenedat a gradual rate over the first 30 days, but thereafter this rate wassignificantly accelerated compared with the other organs.
Assessment of CD4 and CD8 T cell influx using flow cytometry
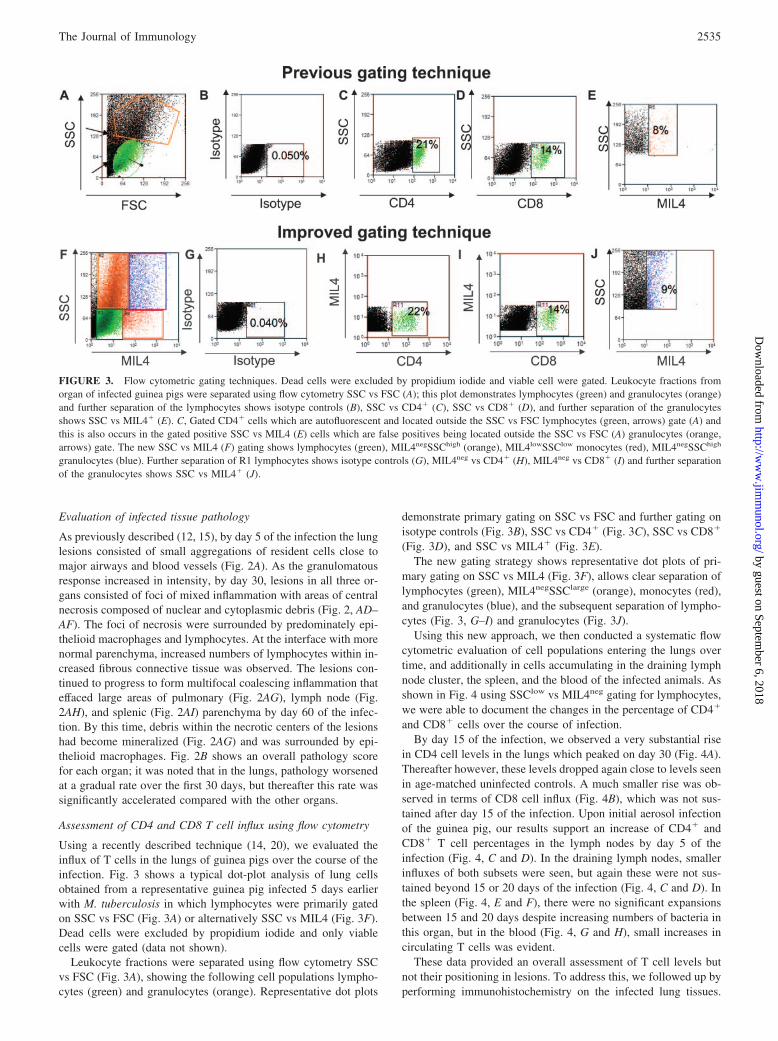
Using a recently described technique (14, 20), we evaluated theinflux of T cells in the lungs of guinea pigs over the course of theinfection. Fig. 3 shows a typical dot-plot analysis of lung cellsobtained from a representative guinea pig infected 5 days earlierwith M. tuberculosis in which lymphocytes were primarily gatedon SSC vs FSC (Fig. 3A) or alternatively SSC vs MIL4 (Fig. 3F).Dead cells were excluded by propidium iodide and only viablecells were gated (data not shown).
Leukocyte fractions were separated using flow cytometry SSCvs FSC (Fig. 3A), showing the following cell populations lympho-cytes (green) and granulocytes (orange). Representative dot plots
demonstrate primary gating on SSC vs FSC and further gating onisotype controls (Fig. 3B), SSC vs CD4� (Fig. 3C), SSC vs CD8�
(Fig. 3D), and SSC vs MIL4� (Fig. 3E).The new gating strategy shows representative dot plots of pri-
mary gating on SSC vs MIL4 (Fig. 3F), allows clear separation oflymphocytes (green), MIL4negSSClarge (orange), monocytes (red),and granulocytes (blue), and the subsequent separation of lympho-cytes (Fig. 3, G–I) and granulocytes (Fig. 3J).
Using this new approach, we then conducted a systematic flowcytometric evaluation of cell populations entering the lungs overtime, and additionally in cells accumulating in the draining lymphnode cluster, the spleen, and the blood of the infected animals. Asshown in Fig. 4 using SSClow vs MIL4neg gating for lymphocytes,we were able to document the changes in the percentage of CD4�
and CD8� cells over the course of infection.By day 15 of the infection, we observed a very substantial rise
in CD4 cell levels in the lungs which peaked on day 30 (Fig. 4A).Thereafter however, these levels dropped again close to levels seenin age-matched uninfected controls. A much smaller rise was ob-served in terms of CD8 cell influx (Fig. 4B), which was not sus-tained after day 15 of the infection. Upon initial aerosol infectionof the guinea pig, our results support an increase of CD4� andCD8� T cell percentages in the lymph nodes by day 5 of theinfection (Fig. 4, C and D). In the draining lymph nodes, smallerinfluxes of both subsets were seen, but again these were not sus-tained beyond 15 or 20 days of the infection (Fig. 4, C and D). Inthe spleen (Fig. 4, E and F), there were no significant expansionsbetween 15 and 20 days despite increasing numbers of bacteria inthis organ, but in the blood (Fig. 4, G and H), small increases incirculating T cells was evident.
These data provided an overall assessment of T cell levels butnot their positioning in lesions. To address this, we followed up byperforming immunohistochemistry on the infected lung tissues.
FIGURE 3. Flow cytometric gating techniques. Dead cells were excluded by propidium iodide and viable cell were gated. Leukocyte fractions fromorgan of infected guinea pigs were separated using flow cytometry SSC vs FSC (A); this plot demonstrates lymphocytes (green) and granulocytes (orange)and further separation of the lymphocytes shows isotype controls (B), SSC vs CD4� (C), SSC vs CD8� (D), and further separation of the granulocytesshows SSC vs MIL4� (E). C, Gated CD4� cells which are autofluorescent and located outside the SSC vs FSC lymphocytes (green, arrows) gate (A) andthis is also occurs in the gated positive SSC vs MIL4 (E) cells which are false positives being located outside the SSC vs FSC (A) granulocytes (orange,arrows) gate. The new SSC vs MIL4 (F) gating shows lymphocytes (green), MIL4negSSChigh (orange), MIL4lowSSClow monocytes (red), MIL4negSSChigh
granulocytes (blue). Further separation of R1 lymphocytes shows isotype controls (G), MIL4neg vs CD4� (H), MIL4neg vs CD8� (I) and further separationof the granulocytes shows SSC vs MIL4� (J).
2535The Journal of Immunology
by guest on September 6, 2018
http://ww
w.jim
munol.org/
Dow
nloaded from
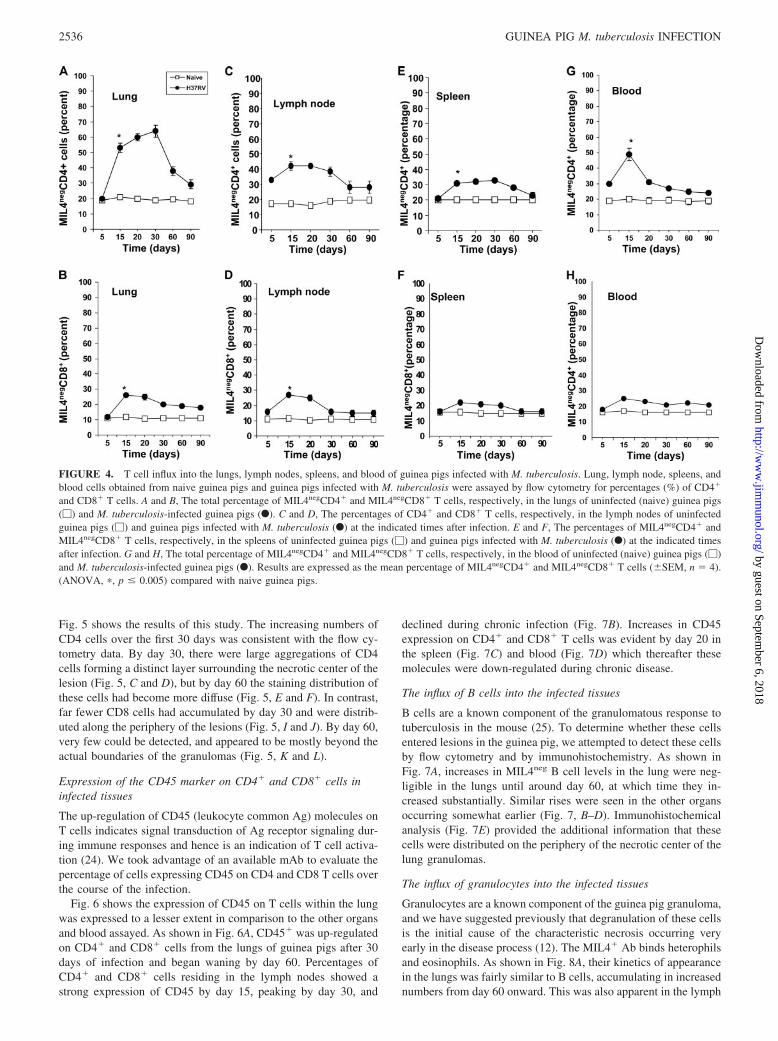
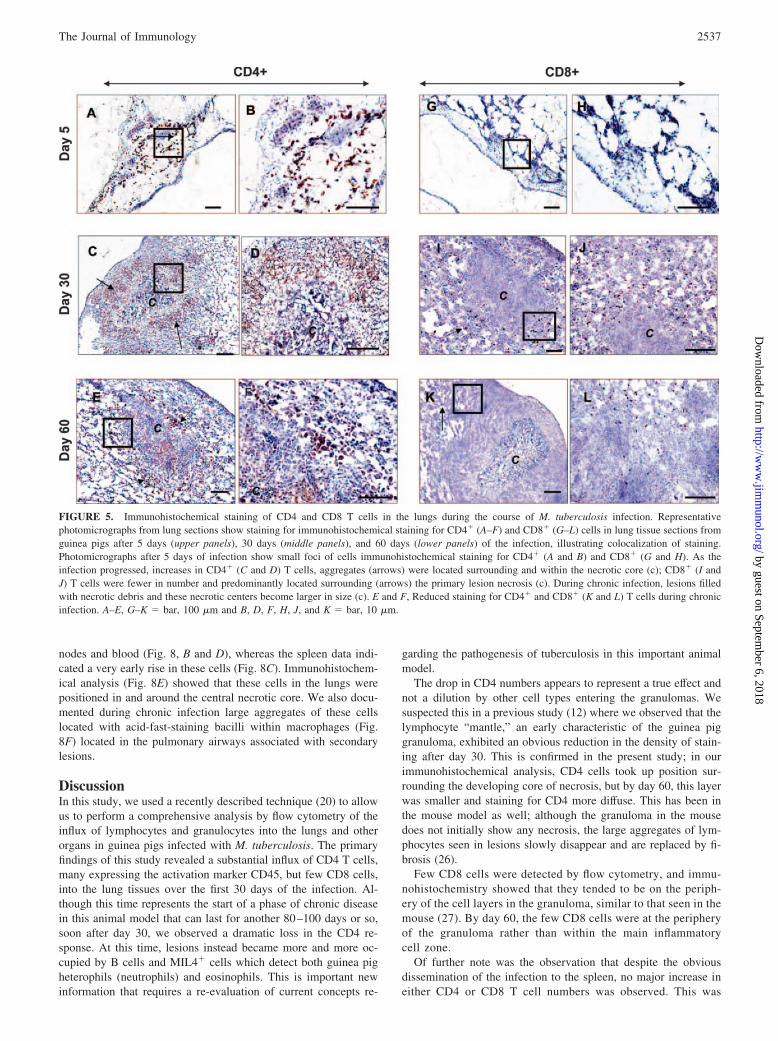
Fig. 5 shows the results of this study. The increasing numbers ofCD4 cells over the first 30 days was consistent with the flow cy-tometry data. By day 30, there were large aggregations of CD4cells forming a distinct layer surrounding the necrotic center of thelesion (Fig. 5, C and D), but by day 60 the staining distribution ofthese cells had become more diffuse (Fig. 5, E and F). In contrast,far fewer CD8 cells had accumulated by day 30 and were distrib-uted along the periphery of the lesions (Fig. 5, I and J). By day 60,very few could be detected, and appeared to be mostly beyond theactual boundaries of the granulomas (Fig. 5, K and L).
Expression of the CD45 marker on CD4� and CD8� cells ininfected tissues
The up-regulation of CD45 (leukocyte common Ag) molecules onT cells indicates signal transduction of Ag receptor signaling dur-ing immune responses and hence is an indication of T cell activa-tion (24). We took advantage of an available mAb to evaluate thepercentage of cells expressing CD45 on CD4 and CD8 T cells overthe course of the infection.
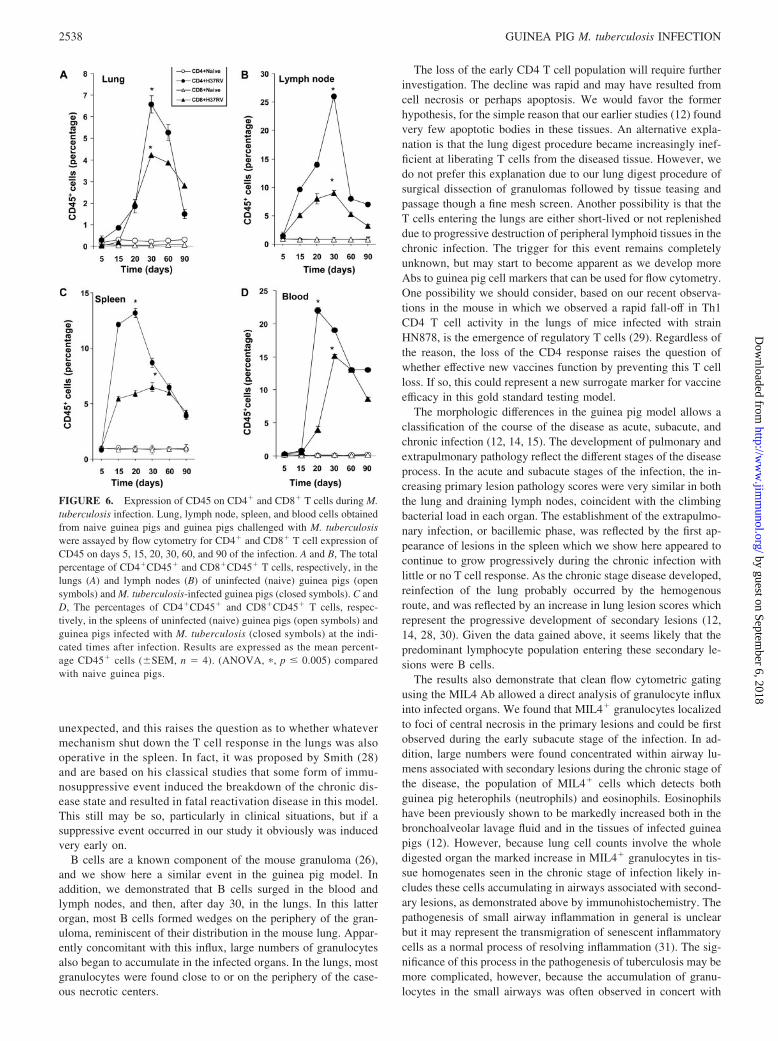
Fig. 6 shows the expression of CD45 on T cells within the lungwas expressed to a lesser extent in comparison to the other organsand blood assayed. As shown in Fig. 6A, CD45� was up-regulatedon CD4� and CD8� cells from the lungs of guinea pigs after 30days of infection and began waning by day 60. Percentages ofCD4� and CD8� cells residing in the lymph nodes showed astrong expression of CD45 by day 15, peaking by day 30, and
declined during chronic infection (Fig. 7B). Increases in CD45expression on CD4� and CD8� T cells was evident by day 20 inthe spleen (Fig. 7C) and blood (Fig. 7D) which thereafter thesemolecules were down-regulated during chronic disease.
The influx of B cells into the infected tissues
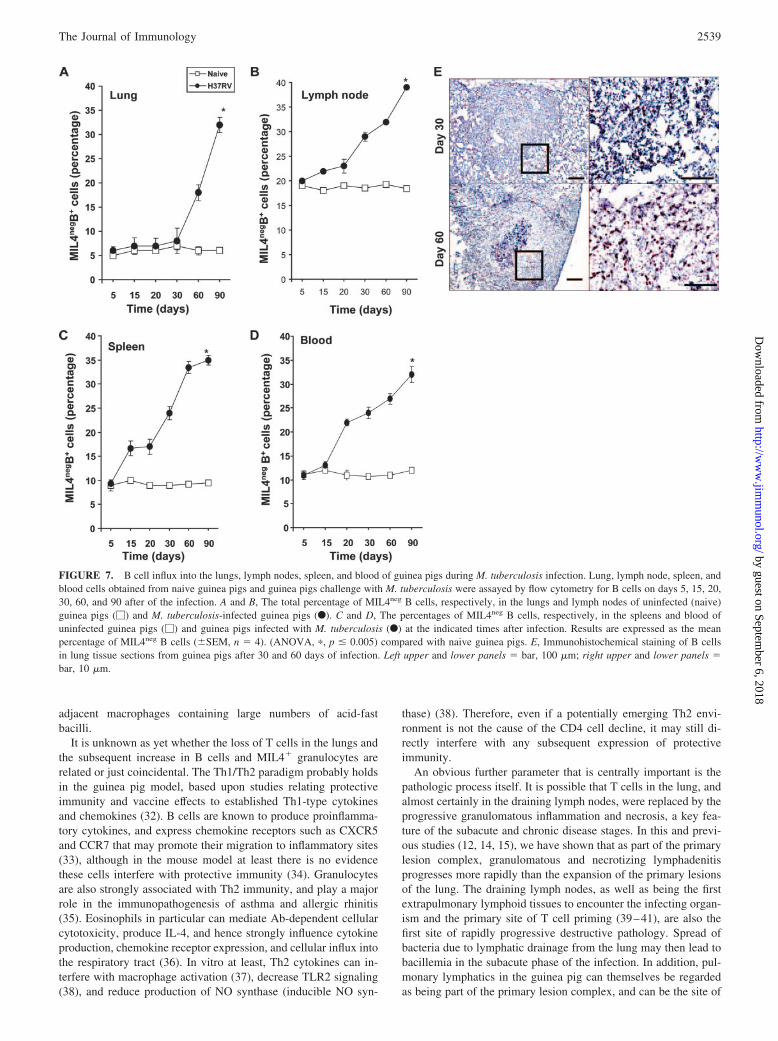
B cells are a known component of the granulomatous response totuberculosis in the mouse (25). To determine whether these cellsentered lesions in the guinea pig, we attempted to detect these cellsby flow cytometry and by immunohistochemistry. As shown inFig. 7A, increases in MIL4neg B cell levels in the lung were neg-ligible in the lungs until around day 60, at which time they in-creased substantially. Similar rises were seen in the other organsoccurring somewhat earlier (Fig. 7, B–D). Immunohistochemicalanalysis (Fig. 7E) provided the additional information that thesecells were distributed on the periphery of the necrotic center of thelung granulomas.
The influx of granulocytes into the infected tissues
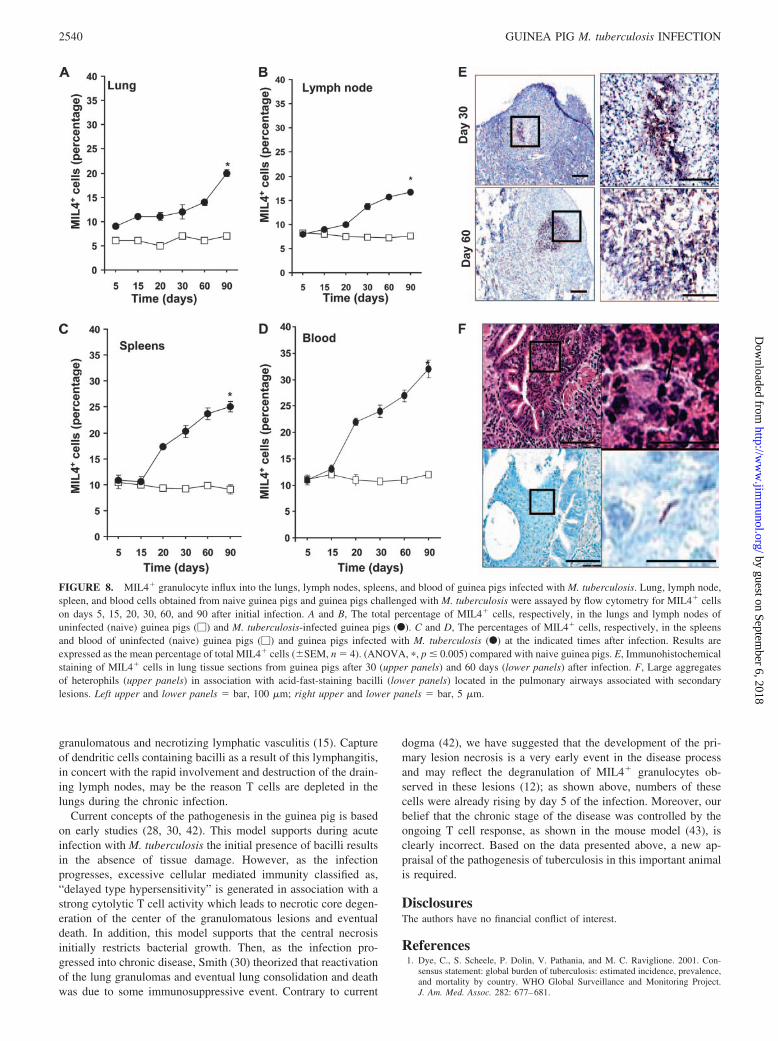
Granulocytes are a known component of the guinea pig granuloma,and we have suggested previously that degranulation of these cellsis the initial cause of the characteristic necrosis occurring veryearly in the disease process (12). The MIL4� Ab binds heterophilsand eosinophils. As shown in Fig. 8A, their kinetics of appearancein the lungs was fairly similar to B cells, accumulating in increasednumbers from day 60 onward. This was also apparent in the lymph
FIGURE 4. T cell influx into the lungs, lymph nodes, spleens, and blood of guinea pigs infected with M. tuberculosis. Lung, lymph node, spleens, andblood cells obtained from naive guinea pigs and guinea pigs infected with M. tuberculosis were assayed by flow cytometry for percentages (%) of CD4�
and CD8� T cells. A and B, The total percentage of MIL4negCD4� and MIL4negCD8� T cells, respectively, in the lungs of uninfected (naive) guinea pigs(�) and M. tuberculosis-infected guinea pigs (F). C and D, The percentages of CD4� and CD8� T cells, respectively, in the lymph nodes of uninfectedguinea pigs (�) and guinea pigs infected with M. tuberculosis (F) at the indicated times after infection. E and F, The percentages of MIL4negCD4� andMIL4negCD8� T cells, respectively, in the spleens of uninfected guinea pigs (�) and guinea pigs infected with M. tuberculosis (F) at the indicated timesafter infection. G and H, The total percentage of MIL4negCD4� and MIL4negCD8� T cells, respectively, in the blood of uninfected (naive) guinea pigs (�)and M. tuberculosis-infected guinea pigs (F). Results are expressed as the mean percentage of MIL4negCD4� and MIL4negCD8� T cells (�SEM, n � 4).(ANOVA, �, p � 0.005) compared with naive guinea pigs.
2536 GUINEA PIG M. tuberculosis INFECTION
by guest on September 6, 2018
http://ww
w.jim
munol.org/
Dow
nloaded from
nodes and blood (Fig. 8, B and D), whereas the spleen data indi-cated a very early rise in these cells (Fig. 8C). Immunohistochem-ical analysis (Fig. 8E) showed that these cells in the lungs werepositioned in and around the central necrotic core. We also docu-mented during chronic infection large aggregates of these cellslocated with acid-fast-staining bacilli within macrophages (Fig.8F) located in the pulmonary airways associated with secondarylesions.
DiscussionIn this study, we used a recently described technique (20) to allowus to perform a comprehensive analysis by flow cytometry of theinflux of lymphocytes and granulocytes into the lungs and otherorgans in guinea pigs infected with M. tuberculosis. The primaryfindings of this study revealed a substantial influx of CD4 T cells,many expressing the activation marker CD45, but few CD8 cells,into the lung tissues over the first 30 days of the infection. Al-though this time represents the start of a phase of chronic diseasein this animal model that can last for another 80–100 days or so,soon after day 30, we observed a dramatic loss in the CD4 re-sponse. At this time, lesions instead became more and more oc-cupied by B cells and MIL4� cells which detect both guinea pigheterophils (neutrophils) and eosinophils. This is important newinformation that requires a re-evaluation of current concepts re-
garding the pathogenesis of tuberculosis in this important animalmodel.
The drop in CD4 numbers appears to represent a true effect andnot a dilution by other cell types entering the granulomas. Wesuspected this in a previous study (12) where we observed that thelymphocyte “mantle,” an early characteristic of the guinea piggranuloma, exhibited an obvious reduction in the density of stain-ing after day 30. This is confirmed in the present study; in ourimmunohistochemical analysis, CD4 cells took up position sur-rounding the developing core of necrosis, but by day 60, this layerwas smaller and staining for CD4 more diffuse. This has been inthe mouse model as well; although the granuloma in the mousedoes not initially show any necrosis, the large aggregates of lym-phocytes seen in lesions slowly disappear and are replaced by fi-brosis (26).
Few CD8 cells were detected by flow cytometry, and immu-nohistochemistry showed that they tended to be on the periph-ery of the cell layers in the granuloma, similar to that seen in themouse (27). By day 60, the few CD8 cells were at the peripheryof the granuloma rather than within the main inflammatorycell zone.
Of further note was the observation that despite the obviousdissemination of the infection to the spleen, no major increase ineither CD4 or CD8 T cell numbers was observed. This was
FIGURE 5. Immunohistochemical staining of CD4 and CD8 T cells in the lungs during the course of M. tuberculosis infection. Representativephotomicrographs from lung sections show staining for immunohistochemical staining for CD4� (A–F) and CD8� (G–L) cells in lung tissue sections fromguinea pigs after 5 days (upper panels), 30 days (middle panels), and 60 days (lower panels) of the infection, illustrating colocalization of staining.Photomicrographs after 5 days of infection show small foci of cells immunohistochemical staining for CD4� (A and B) and CD8� (G and H). As theinfection progressed, increases in CD4� (C and D) T cells, aggregates (arrows) were located surrounding and within the necrotic core (c); CD8� (I andJ) T cells were fewer in number and predominantly located surrounding (arrows) the primary lesion necrosis (c). During chronic infection, lesions filledwith necrotic debris and these necrotic centers become larger in size (c). E and F, Reduced staining for CD4� and CD8� (K and L) T cells during chronicinfection. A–E, G–K � bar, 100 �m and B, D, F, H, J, and K � bar, 10 �m.
2537The Journal of Immunology
by guest on September 6, 2018
http://ww
w.jim
munol.org/
Dow
nloaded from
unexpected, and this raises the question as to whether whatevermechanism shut down the T cell response in the lungs was alsooperative in the spleen. In fact, it was proposed by Smith (28)and are based on his classical studies that some form of immu-nosuppressive event induced the breakdown of the chronic dis-ease state and resulted in fatal reactivation disease in this model.This still may be so, particularly in clinical situations, but if asuppressive event occurred in our study it obviously was inducedvery early on.
B cells are a known component of the mouse granuloma (26),and we show here a similar event in the guinea pig model. Inaddition, we demonstrated that B cells surged in the blood andlymph nodes, and then, after day 30, in the lungs. In this latterorgan, most B cells formed wedges on the periphery of the gran-uloma, reminiscent of their distribution in the mouse lung. Appar-ently concomitant with this influx, large numbers of granulocytesalso began to accumulate in the infected organs. In the lungs, mostgranulocytes were found close to or on the periphery of the case-ous necrotic centers.
The loss of the early CD4 T cell population will require furtherinvestigation. The decline was rapid and may have resulted fromcell necrosis or perhaps apoptosis. We would favor the formerhypothesis, for the simple reason that our earlier studies (12) foundvery few apoptotic bodies in these tissues. An alternative expla-nation is that the lung digest procedure became increasingly inef-ficient at liberating T cells from the diseased tissue. However, wedo not prefer this explanation due to our lung digest procedure ofsurgical dissection of granulomas followed by tissue teasing andpassage though a fine mesh screen. Another possibility is that theT cells entering the lungs are either short-lived or not replenisheddue to progressive destruction of peripheral lymphoid tissues in thechronic infection. The trigger for this event remains completelyunknown, but may start to become apparent as we develop moreAbs to guinea pig cell markers that can be used for flow cytometry.One possibility we should consider, based on our recent observa-tions in the mouse in which we observed a rapid fall-off in Th1CD4 T cell activity in the lungs of mice infected with strainHN878, is the emergence of regulatory T cells (29). Regardless ofthe reason, the loss of the CD4 response raises the question ofwhether effective new vaccines function by preventing this T cellloss. If so, this could represent a new surrogate marker for vaccineefficacy in this gold standard testing model.
The morphologic differences in the guinea pig model allows aclassification of the course of the disease as acute, subacute, andchronic infection (12, 14, 15). The development of pulmonary andextrapulmonary pathology reflect the different stages of the diseaseprocess. In the acute and subacute stages of the infection, the in-creasing primary lesion pathology scores were very similar in boththe lung and draining lymph nodes, coincident with the climbingbacterial load in each organ. The establishment of the extrapulmo-nary infection, or bacillemic phase, was reflected by the first ap-pearance of lesions in the spleen which we show here appeared tocontinue to grow progressively during the chronic infection withlittle or no T cell response. As the chronic stage disease developed,reinfection of the lung probably occurred by the hemogenousroute, and was reflected by an increase in lung lesion scores whichrepresent the progressive development of secondary lesions (12,14, 28, 30). Given the data gained above, it seems likely that thepredominant lymphocyte population entering these secondary le-sions were B cells.
The results also demonstrate that clean flow cytometric gatingusing the MIL4 Ab allowed a direct analysis of granulocyte influxinto infected organs. We found that MIL4� granulocytes localizedto foci of central necrosis in the primary lesions and could be firstobserved during the early subacute stage of the infection. In ad-dition, large numbers were found concentrated within airway lu-mens associated with secondary lesions during the chronic stage ofthe disease, the population of MIL4� cells which detects bothguinea pig heterophils (neutrophils) and eosinophils. Eosinophilshave been previously shown to be markedly increased both in thebronchoalveolar lavage fluid and in the tissues of infected guineapigs (12). However, because lung cell counts involve the wholedigested organ the marked increase in MIL4� granulocytes in tis-sue homogenates seen in the chronic stage of infection likely in-cludes these cells accumulating in airways associated with second-ary lesions, as demonstrated above by immunohistochemistry. Thepathogenesis of small airway inflammation in general is unclearbut it may represent the transmigration of senescent inflammatorycells as a normal process of resolving inflammation (31). The sig-nificance of this process in the pathogenesis of tuberculosis may bemore complicated, however, because the accumulation of granu-locytes in the small airways was often observed in concert with
FIGURE 6. Expression of CD45 on CD4� and CD8� T cells during M.tuberculosis infection. Lung, lymph node, spleen, and blood cells obtainedfrom naive guinea pigs and guinea pigs challenged with M. tuberculosiswere assayed by flow cytometry for CD4� and CD8� T cell expression ofCD45 on days 5, 15, 20, 30, 60, and 90 of the infection. A and B, The totalpercentage of CD4�CD45� and CD8�CD45� T cells, respectively, in thelungs (A) and lymph nodes (B) of uninfected (naive) guinea pigs (opensymbols) and M. tuberculosis-infected guinea pigs (closed symbols). C andD, The percentages of CD4�CD45� and CD8�CD45� T cells, respec-tively, in the spleens of uninfected (naive) guinea pigs (open symbols) andguinea pigs infected with M. tuberculosis (closed symbols) at the indi-cated times after infection. Results are expressed as the mean percent-age CD45� cells (�SEM, n � 4). (ANOVA, �, p � 0.005) comparedwith naive guinea pigs.
2538 GUINEA PIG M. tuberculosis INFECTION
by guest on September 6, 2018
http://ww
w.jim
munol.org/
Dow
nloaded from
adjacent macrophages containing large numbers of acid-fastbacilli.
It is unknown as yet whether the loss of T cells in the lungs andthe subsequent increase in B cells and MIL4� granulocytes arerelated or just coincidental. The Th1/Th2 paradigm probably holdsin the guinea pig model, based upon studies relating protectiveimmunity and vaccine effects to established Th1-type cytokinesand chemokines (32). B cells are known to produce proinflamma-tory cytokines, and express chemokine receptors such as CXCR5and CCR7 that may promote their migration to inflammatory sites(33), although in the mouse model at least there is no evidencethese cells interfere with protective immunity (34). Granulocytesare also strongly associated with Th2 immunity, and play a majorrole in the immunopathogenesis of asthma and allergic rhinitis(35). Eosinophils in particular can mediate Ab-dependent cellularcytotoxicity, produce IL-4, and hence strongly influence cytokineproduction, chemokine receptor expression, and cellular influx intothe respiratory tract (36). In vitro at least, Th2 cytokines can in-terfere with macrophage activation (37), decrease TLR2 signaling(38), and reduce production of NO synthase (inducible NO syn-
thase) (38). Therefore, even if a potentially emerging Th2 envi-ronment is not the cause of the CD4 cell decline, it may still di-rectly interfere with any subsequent expression of protectiveimmunity.
An obvious further parameter that is centrally important is thepathologic process itself. It is possible that T cells in the lung, andalmost certainly in the draining lymph nodes, were replaced by theprogressive granulomatous inflammation and necrosis, a key fea-ture of the subacute and chronic disease stages. In this and previ-ous studies (12, 14, 15), we have shown that as part of the primarylesion complex, granulomatous and necrotizing lymphadenitisprogresses more rapidly than the expansion of the primary lesionsof the lung. The draining lymph nodes, as well as being the firstextrapulmonary lymphoid tissues to encounter the infecting organ-ism and the primary site of T cell priming (39–41), are also thefirst site of rapidly progressive destructive pathology. Spread ofbacteria due to lymphatic drainage from the lung may then lead tobacillemia in the subacute phase of the infection. In addition, pul-monary lymphatics in the guinea pig can themselves be regardedas being part of the primary lesion complex, and can be the site of
FIGURE 7. B cell influx into the lungs, lymph nodes, spleen, and blood of guinea pigs during M. tuberculosis infection. Lung, lymph node, spleen, andblood cells obtained from naive guinea pigs and guinea pigs challenge with M. tuberculosis were assayed by flow cytometry for B cells on days 5, 15, 20,30, 60, and 90 after of the infection. A and B, The total percentage of MIL4neg B cells, respectively, in the lungs and lymph nodes of uninfected (naive)guinea pigs (�) and M. tuberculosis-infected guinea pigs (F). C and D, The percentages of MIL4neg B cells, respectively, in the spleens and blood ofuninfected guinea pigs (�) and guinea pigs infected with M. tuberculosis (F) at the indicated times after infection. Results are expressed as the meanpercentage of MIL4neg B cells (�SEM, n � 4). (ANOVA, �, p � 0.005) compared with naive guinea pigs. E, Immunohistochemical staining of B cellsin lung tissue sections from guinea pigs after 30 and 60 days of infection. Left upper and lower panels � bar, 100 �m; right upper and lower panels �bar, 10 �m.
2539The Journal of Immunology
by guest on September 6, 2018
http://ww
w.jim
munol.org/
Dow
nloaded from
granulomatous and necrotizing lymphatic vasculitis (15). Captureof dendritic cells containing bacilli as a result of this lymphangitis,in concert with the rapid involvement and destruction of the drain-ing lymph nodes, may be the reason T cells are depleted in thelungs during the chronic infection.
Current concepts of the pathogenesis in the guinea pig is basedon early studies (28, 30, 42). This model supports during acuteinfection with M. tuberculosis the initial presence of bacilli resultsin the absence of tissue damage. However, as the infectionprogresses, excessive cellular mediated immunity classified as,“delayed type hypersensitivity” is generated in association with astrong cytolytic T cell activity which leads to necrotic core degen-eration of the center of the granulomatous lesions and eventualdeath. In addition, this model supports that the central necrosisinitially restricts bacterial growth. Then, as the infection pro-gressed into chronic disease, Smith (30) theorized that reactivationof the lung granulomas and eventual lung consolidation and deathwas due to some immunosuppressive event. Contrary to current
dogma (42), we have suggested that the development of the pri-mary lesion necrosis is a very early event in the disease processand may reflect the degranulation of MIL4� granulocytes ob-served in these lesions (12); as shown above, numbers of thesecells were already rising by day 5 of the infection. Moreover, ourbelief that the chronic stage of the disease was controlled by theongoing T cell response, as shown in the mouse model (43), isclearly incorrect. Based on the data presented above, a new ap-praisal of the pathogenesis of tuberculosis in this important animalis required.
DisclosuresThe authors have no financial conflict of interest.
References1. Dye, C., S. Scheele, P. Dolin, V. Pathania, and M. C. Raviglione. 2001. Con-
sensus statement: global burden of tuberculosis: estimated incidence, prevalence,and mortality by country. WHO Global Surveillance and Monitoring Project.J. Am. Med. Assoc. 282: 677–681.
FIGURE 8. MIL4� granulocyte influx into the lungs, lymph nodes, spleens, and blood of guinea pigs infected with M. tuberculosis. Lung, lymph node,spleen, and blood cells obtained from naive guinea pigs and guinea pigs challenged with M. tuberculosis were assayed by flow cytometry for MIL4� cellson days 5, 15, 20, 30, 60, and 90 after initial infection. A and B, The total percentage of MIL4� cells, respectively, in the lungs and lymph nodes ofuninfected (naive) guinea pigs (�) and M. tuberculosis-infected guinea pigs (F). C and D, The percentages of MIL4� cells, respectively, in the spleensand blood of uninfected (naive) guinea pigs (�) and guinea pigs infected with M. tuberculosis (F) at the indicated times after infection. Results areexpressed as the mean percentage of total MIL4� cells (�SEM, n � 4). (ANOVA, �, p � 0.005) compared with naive guinea pigs. E, Immunohistochemicalstaining of MIL4� cells in lung tissue sections from guinea pigs after 30 (upper panels) and 60 days (lower panels) after infection. F, Large aggregatesof heterophils (upper panels) in association with acid-fast-staining bacilli (lower panels) located in the pulmonary airways associated with secondarylesions. Left upper and lower panels � bar, 100 �m; right upper and lower panels � bar, 5 �m.
2540 GUINEA PIG M. tuberculosis INFECTION
by guest on September 6, 2018
http://ww
w.jim
munol.org/
Dow
nloaded from
2. Corbett, E., C. J. Watt, N. Walker, D. Maher, B. G. Williams, M. C. Raviglione,and C. Dye. 2003. The growing burden of tuberculosis: global trends and inter-actions with the HIV epidemic. Arch. Intern. Med. 163: 1009–1021.
3. Kochi, A. 2001. The global tuberculosis situation and the new control strategy ofthe World Health Organization. 1991. Bull. World Health Organ. 79: 71–75.
4. Black, G. F., R. E. Weir, S. D. Chaguluka, D. Warndorff, A. C. Crampin,L. Mwaungulu, L. Sichali, S. Floyd, L. Bliss, E. Jarman, et al. 2003. � Interferonresponses induced by a panel of recombinant and purified mycobacterial antigensin healthy, non-Mycobacterium bovis BCG-vaccinated Malawian young adults.Clin. Diagn. Lab. Immunol. 10: 602–611.
5. Fine, P. E. M., and E. Vynnycky. 1998. The effect of heterologous immunityupon the apparent efficacy of (e.g. BCG) vaccines. Vaccine 16: 1923–1928.
6. Fine, P. 2005. Stopping routine vaccination for tuberculosis in schools. Br.Med. J. 331: 647–648.
7. Duncan, K. 2003. Progress in TB drug development and what is still needed.Tuberculosis 83: 201–207.
8. Orme, I. M. 2005. Mouse and guinea pig models for testing new tuberculosisvaccines. Tuberculosis 85: 13–17.
9. Orme, I. M. 2006. Safety issues regarding new vaccines for tuberculosis, with anemphasis on post-exposure vaccination. Tuberculosis 86: 68–73.
10. McMurray, D. N., S. S. Allen, A. Jeevan, T. Lasco, H. Cho, T. Skwor,T. Yamamoto, C. McFarland, and T. Yoshimura. 2005. Vaccine-induced cyto-kine responses in a guinea pig model of pulmonary tuberculosis. Tuberculosis 85:295–301.
11. Johnson, C. M., R. Pandey, S. Sharma, G. K. Khuller, R. J. Basaraba, I. M. Orme,and A. J. Lenaerts. 2005. Oral therapy using nanoparticle-encapsulated antitu-berculosis drugs in guinea pigs infected with Mycobacterium tuberculosis. 2005.Antimicrob. Agents Chemother. 49: 4335–4338.
12. Turner, O. C., R. J. Basaraba, and I. M. Orme. 2003. Immunopathogenesis ofpulmonary granulomas in the guinea pig after infection with Mycobacteriumtuberculosis. Infect. Immun. 71: 864–871.
13. Flynn, J. L. 2006. Lessons from experimental Mycobacterium tuberculosis in-fections. Microbes Infect. 8: 1179–1188.
14. Basaraba, R. J., A. A. Izzo, L. Brandt, and I. M. Orme. 2006. Decreased survivalof guinea pigs infected with Mycobacterium tuberculosis after multiple BCGvaccinations. Vaccine 24: 280–286.
15. Basaraba, R. J., D. D. Dailey, C. T. McFarland, C. A. Shanley, E. E. Smith,D. N. McMurray, and I. M. Orme. 2006. Lymphadenitis as a major element ofdisease in the guinea pig model of tuberculosis. Infect. Immun. 74: 5397–53401.
16. Kraft, S. L., D. Dailey, M. Kovach, K. L. Stasiak, J. Bennett, C. T. McFarland,D. N. McMurray, A. A. Izzo, I. M. Orme, and R. J. Basaraba. 2004. Magneticresonance imaging of pulmonary lesions in guinea pigs infected with Mycobac-terium tuberculosis. Infect. Immun. 72: 5963–5971.
17. Tan, B. T., F. Ekelaar, J. Luirink, G. Rimmelzwaan, A. J. De Jonge, andR. J. Scheper. 1985. Production of monoclonal antibodies defining guinea pigT-cell surface markers and a strain 13 ia-like antigen: the value of immunohis-tological screening. Hybridoma 4: 115–1124.
18. Takizawa, M., J. Chiba, S. Haga, T. Asano, T. Yamazaki, N. Yamamoto, andM. Honda. 2006. Novel two-parameter flow cytometry (MIL4/SSC followed byMIL4/CT7) allows for identification of five fractions of guinea pig leukocytes inperipheral blood and lymphoid organs. J. Immunol. Methods 311: 47–56.
19. Kraal, G., A. Twisk, B. Tan, and R. Scheper. 1986. A surface molecule on guineapig lymphocytes involved in adhesion and homing. Eur. J. Immunol. 16:1515–1519.
20. Takizawa, M., J. Chiba, S. Haga, T. Asano, N. Yamamoto, and M. Honda. 2004.The normalization of guinea pig leukocyte fractions and lymphocyte subsets inblood and lymphoid tissues using a flow cytometric procedure. Exp. Anim. 53:321–329.
21. Hart, I. J. S. H., R. J. Scheper, and G. T. Stevenson. 1992. Subpopulations ofguinea-pig T lymphocytes defined by isoforms of the leucocyte common antigen.Immunology 77: 377–384.
22. Haverson, K., M. B., V. R. Higgins, P. W. Bland, and C. R. Stokes. 1994. Char-acterization of monoclonal antibodies specific for monocytes, macrophages and
granulocytes from porcine peripheral blood and mucosal tissues. J. Immunol.Methods 25: 233–245.
23. Hiromatsu, K., C. C. Dascher, M. Sugita, C. Gingrich-Baker, S. M. Behar,K. P. LeClair, M. B. Brenner, and S. A. Porcelli. 2002. Characterization of guin-ea-pig group 1 CD1 proteins. Immunology 106: 159–172.
24. Burger, R., K. Reske, U. Mauer, D. von Steldern, and M. Husmann. 1983. Iden-tification and characterization of GP TFA-1, a guinea pig T cell surface antigenassociated with T cell function. J. Immunol. 131: 1350–1355.
25. Kahnert, A., U. E. Hopken, M. Stein, S. Bandermann, M. Lipp, andS. H. E. Kaufmann. 2007. Mycobacterium tuberculosis triggers formation oflymphoid structure in murine lungs. J. Infect. Dis. 195: 46–54.
26. Rhoades, E. R., A. A. Frank, and I. M. Orme. 1997. Progression of chronicpulmonary tuberculosis in mice aerogenically infected with virulent Mycobacte-rium tuberculosis. Tuber. Lung Dis. 78: 57–66.
27. Gonzalez-Juarrero, M., O. C. Turner, J. Turner, P. Marietta, J. V. Brooks, andI. M. Orme. 2001. Temporal and spatial arrangement of lymphocytes within lunggranulomas induced by aerosol infection with Mycobacterium tuberculosis. In-fect. Immun. 69: 1722–1728.
28. Smith, D. W., and E. H. Wiegeshaus. 1989. What animal models can teach usabout the pathogenesis of tuberculosis in humans. Rev. Infect. Dis. 11:S385–S393.
29. Ordway, D., M. Henao-Tamayo, M. Harton, G. Palanisamy, J. Troudt,C. Shanley, R. J. Basaraba, and I. M. Orme. 2007. The hypervirulent Mycobac-terium tuberculosis strain HN878 induces a potent TH1 response followed byrapid down-regulation. J. Immunol. 179: 522–531.
30. Smith, D. W., and G. E. Harding. 1977. Animal model of human disease: pul-monary tuberculosis: animal model: experimental airborne tuberculosis in theguinea pig. Am. J. Pathol. 89: 273–276.
31. Ahlstrom-Emanuelsson, C. A., L. Greiff, M. Andersson, C. G. A. Persson, andJ. S. Erjefalt. 2004. Eosinophil degranulation status in allergic rhinitis: observa-tions before and during seasonal allergen exposure. Eur. Respir. J. 24: 750–757.
32. McMurray, D. N., S. S. Allen, A. Jeevan, T. Lasco, H. Cho, T. Skwor,T. Yamamoto, C. McFarland, and T. Yoshimura. 2005. Vaccine-induced cyto-kine responses in a guinea pig model of pulmonary tuberculosis. Tuberculosis 85:295–301.
33. Kahnert, A., U. E. Hopken, M. Stein, S. Bandermann, M. Lipp, andS. H. Kaufmann. 2007. Mycobacterium tuberculosis triggers formation of lym-phoid structure in murine lungs. J. Infect. Dis. 195: 46–54.
34. Johnson, C. M., A. M. Cooper, A. A. Frank, C. B. Bonorino, L. J. Wysoki, andI. M. Orme. 1997. Mycobacterium tuberculosis aerogenic rechallenge infectionsin B cell-deficient mice. Tuber. Lung Dis. 78: 257–261.
35. Wardlaw, A. J., R. Moqbel, and A. B. Kay. 1995. Eosinophils: biology and rolein disease. Adv. Immunol. 60: 151–266.
36. MacKenzie, J. R., J. Mattes, L. A. Dent, and P. S. Foster. 2001. Eosinophilspromote allergic disease of the lung by regulating CD4� Th2 lymphocyte func-tion. J. Immunol. 167: 3146–3155.
37. Gordon, S. 2003. Alternative activation of macrophages. Nat. Rev. Immunol. 3:23–35.
38. Rook, G. A., and R. Hernandez-Pando. 1996. The pathogenesis of tuberculosis.Annu. Rev. Microbiol. 50: 259–284.
39. Flynn, J. L., and J. Chan. 2001. Immunology of tuberculosis. Annu. Rev. Immu-nol. 19: 93–129.
40. Ordway, D., M. Harton, M. Henao-Tamayo, R. Montoya, I. M. Orme, andM. Gonzalez-Juarrero. 2006. Enhanced macrophage activity in granulomatouslesions of immune mice challenged with Mycobacterium tuberculosis. J. Immu-nol. 176: 4931–4939.
41. Orme, I. M. 1998. The immunopathogenesis of tuberculosis: a new workinghypothesis. Trends Microbiol. 6: 94–97.
42. Dannenberg, A. M. 2006. Pathogenesis of human pulmonary tuberculosis: in-sights from the rabbit model. ASM Press, Washington, D.C.
43. Junqueira-Kipnis, A. P., J. Turner, M. Gonzalez-Juarrero, O. C. Turner, andI. M. Orme. 2004. Stable T-cell population expressing an effector cell surfacephenotype in the lungs of mice chronically infected with Mycobacterium tuber-culosis. Infect. Immun. 72: 570–575.
2541The Journal of Immunology
by guest on September 6, 2018
http://ww
w.jim
munol.org/
Dow
nloaded from