the carbon sequestration potential of tree crop plantations
TRANSCRIPT
ORIGINAL ARTICLE
The carbon sequestration potential of tree crop plantations
Rico Kongsager & Jonas Napier & Ole Mertz
Received: 28 March 2012 /Accepted: 29 August 2012# Springer Science+Business Media B.V. 2012
Abstract Carbon (C) conservation and sequestration in many developing countries needs tobe accompanied by socio-economic improvements. Tree crop plantations can be a potentialpath for coupling climate change mitigation and economic development by providing Csequestration and supplying wood and non-wood products to meet domestic and interna-tional market requirements at the same time. Financial compensation for such plantationscould potentially be covered by the Clean Development Mechanism under the UnitedNations Framework Convention on Climate Change (FCCC) Kyoto Protocol, but its suit-ability has also been suggested for integration into REDD+(reducing emissions fromdeforestation, forest degradation and enhancement of forest C stocks) currently beingnegotiated under the United Nations FCCC. We assess the aboveground C sequestrationpotential of four major plantation crops – cocoa (Theobroma cacao), oil palm (Elaeisguineensis), rubber (Hevea brasiliensis), and orange (Citrus sinesis) – cultivated in thetropics. Measurements were conducted in Ghana and allometric equations were applied toestimate biomass. The largest C potential was found in the rubber plantations (214 tC/ha).Cocoa (65 tC/ha) and orange (76 tC/ha) plantations have a much lower C content, and oilpalm (45 tC/ha) has the lowest C potential, assuming that the yield is not used as biofuel.There is considerable C sequestration potential in plantations if they are established on landwith modest C content such as degraded forest or agricultural land, and not on land with old-growth forest. We also show that simple C assessment methods can give reliable results,which makes it easier for developing countries to partake in REDD+ or other paymentschemes.
Keywords Aboveground biomass . Allometric equations . Carbon estimations . Carbonsequestration . Ghana . Kade . Land-use change . Tree crop plantation
Mitig Adapt Strateg Glob ChangeDOI 10.1007/s11027-012-9417-z
R. Kongsager (*)UNEP Risoe Centre on Energy, Environment and Sustainable Development, Technical University ofDenmark, Risoe Campus, Frederiksborgvej 399, Bldg. 142, P.O. Box 49, 4000 Roskilde, Denmarke-mail: [email protected]
J. Napier : O. MertzDepartment of Geography & Geology, University of Copenhagen, Øster Voldgade 10, Copenhagen 1350,Denmark
1 Introduction
Increasing greenhouse gas (GHG) concentrations, mainly carbon (C), in the atmo-sphere is one of the most pressing global environmental problems, as it will result ina change in the energy balance and consequently the climate. Most emissions comefrom fossil fuels, but tropical ecosystems store 340 billion tons of C (Gibbs et al.2007), corresponding to more than forty times total annual anthropogenic emissionsfrom fossil fuels (Canadell et al. 2007). A large part of this C is released when forestsand grasslands are cleared, burned and converted to agricultural systems (IPCC 2006).Land-use and land-cover change has contributed about 33 % of global C emissionsover the past 150 years, and although the current relative contribution has declined to10-13 % annually (Houghton et al. 2012), tropical deforestation is still estimated torelease about 2.9 billion tons of C each year. Tropical deforestation is largely drivenby agricultural expansion, which is already releasing ~1.5 billion tons of C each year(IPCC 2007).
This has led to a growing interest in lowering the emissions rate of GHG fromdifferent types of land-use, and it has been argued that an increased focus on forestryand agroforestry systems as C sinks will be necessary to achieve a significant long-term reduction in atmospheric GHG levels (C and methane), particularly from tropicalareas (Soto-Pinto et al. 2010; Verchot et al. 2007). Compared to normal tropicalagricultural crops, tree crop plantations have a significantly larger sequestrationpotential and are able to sequester C for longer periods with smaller annual fluctua-tions. Many annual crops such as maize can fix more C than forestry systems in anygiven year, but their biomass usually decomposes rapidly, and the rate and return ofsequestered C to the atmosphere are very fast (Liguori et al. 2009). This knowledge isimportant as tree crop plantations could be a more feasible mitigation solution inmany parts of developing countries compared to pure afforestation and reforestationprojects, since tree crop plantations also provide work, income and food, especiallywhen established in smallholder systems where local people have control over pro-duction. As such, plantations may also be an important element in increasing adaptivecapacity in the sense of adapting to climate change and other pressures that localcommunities in developing countries are facing. Large-scale plantations operated bylarger companies may also provide economic development, but they are often associ-ated with major environmental and social problems, especially those related to non-compliance with environmental management regulations and de facto land alienation,when plantations obtain long-term leases on community lands (Fitzherbert et al. 2008;Fox et al. 2009; Koh and Wilcove 2008; Ngidang 2002; Sheil et al. 2009). To usetree crop plantation to sequester C and at the same time increase sustainable devel-opment would link climate change mitigation and adaptation, and an enhancement ofthis link has been called for by several authors (Ayers and Huq 2009; Halsnæs andVerhagen 2007; Klein et al. 2007; Klein et al. 2005; Tol 2005; Verchot et al. 2007)
Information on C sequestration in forest plantations, agroforestry and natural forests isplentiful. Conversely, information on tree-crop plantation monoculture systems is incom-plete. Some studies have been conducted, mainly in Southeast and East Asia, on the Ccontent of oil palm (e.g. Chase and Henson 2010; Foong-Kheong et al. 2010; Germer andSauerborn 2008; Khalid et al. 1999) and rubber plantations (e.g. Cheng et al. 2007; Song andZhang 2010; Yang et al. 2005). With regard to Africa, only a very few studies have beenconducted on tree-crop plantation monoculture systems, for example, Wauters et al. (2008)on rubber and Duguma et al. (2001) on cocoa in an agroforestry system.
Mitig Adapt Strateg Glob Change
The present study differs from these studies by using a much simplified method-ology which can be useful in less developed countries with more limited resources. Italso differs by measuring a much older rubber plantation (compared to Wauters et al.2008), and by doing so in West Africa and not in Central Africa (compared toDuguma et al. 2001), where growing conditions are different, especially with regardto precipitation. It has also not been possible to locate any articles on the C contentof oil palm and orange plantations in Africa. Moreover, our study focuses on Ghana,which is currently experiencing a change from a period in which where deforestationwas the main source of C emissions to one in which emissions from the degradationof forests and agroforests will be the main source of GHG emissions. Most of theforest has been converted to plantations, mainly for the production of cocoa (Sandkeret al. 2010). Therefore, the window of opportunity for avoided deforestation projectsin Ghana is closing quickly, and the focus now has to be directed to afforestation andreforestation projects. However, another way to enhance C sequestration in Ghanacould be high-accumulation plantation crops that, besides sequestration, provide Gha-naians with products and work opportunities, which can raise living standards ingeneral. This is reflected in the Nationally Appropriate Mitigation Action Plan sub-mitted by Ghana (UNFCCC 2010), in which commercial plantations on degraded landare identified as a mitigation action for the country.
The main objective of this study is therefore to estimate the C sequestrationpotential of mature tree-crop plantations in the tropics, specifically in Ghana. Sevenplantations of four different plantation crops – cocoa (Theobroma cacao), oil palm(Elaeis guineensis), rubber (Hevea brasiliensis), and orange (Citrus sinesis) – atdifferent ages were selected to investigate C sequestration in the aboveground livingbiomass after establishment. The measurements were non-destructive, and tree biomasswas computed using allometric equations. The objective was also to compare theresults of simple methods to the results of more in-depth studies using more costlyand time-consuming methods that may not be affordable for researchers in developingcountries with limited resources.
2 Methods and study area
2.1 Study site
This study was carried out in 2011 at the Agricultural Research Centre in Kade (ARC-Kade),which is located 123 km NWof Accra, near Kade in the Kwaebibirem District of the EasternRegion of Ghana (Fig. 1). ARC-Kade and its surroundings were chosen as the study areabecause of their proximity to plantations of several types and ages, which makes themcomparable as they are being grown under similar environmental conditions and with thesame methods of cultivation. ARC-Kade is located in the high forest zone, and the area isdescribed as an ecotone between the moist semi-deciduous and the moist evergreen forest(Nye 1961).
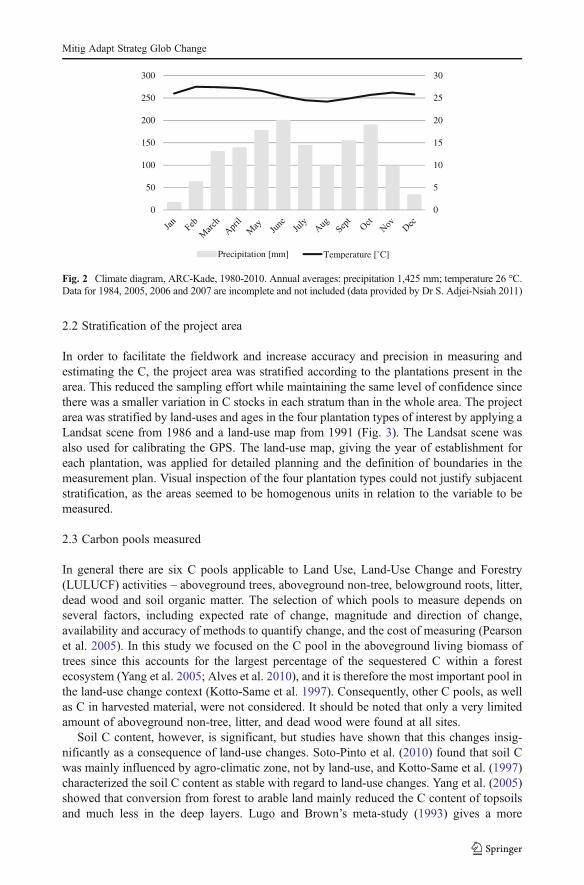
The elevation is 114 m above sea level, the terrain is relatively flat, and thelatitude is 6o09’N and longitude 0o55’W. The mean annual temperature is 26oC,and only minor seasonal variations occur (Fig. 2). Precipitation, which averages1,425 mm per year, is a bimodal regime with the major rainy season being concen-trated from March to July and a further minor season occurring from September toDecember (Fig. 2). The main economic activity in the area is agriculture based on oil
Mitig Adapt Strateg Glob Change
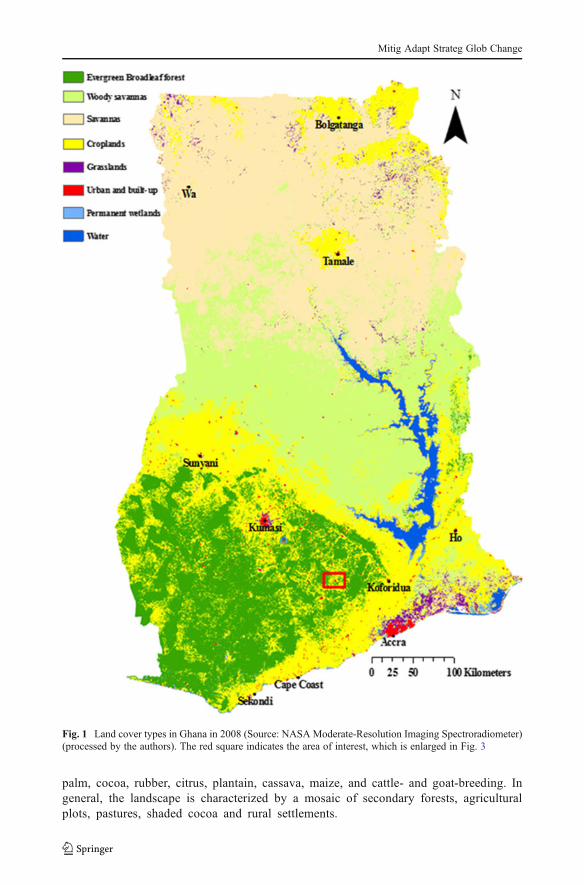
palm, cocoa, rubber, citrus, plantain, cassava, maize, and cattle- and goat-breeding. Ingeneral, the landscape is characterized by a mosaic of secondary forests, agriculturalplots, pastures, shaded cocoa and rural settlements.
Fig. 1 Land cover types in Ghana in 2008 (Source: NASA Moderate-Resolution Imaging Spectroradiometer)(processed by the authors). The red square indicates the area of interest, which is enlarged in Fig. 3
Mitig Adapt Strateg Glob Change
2.2 Stratification of the project area
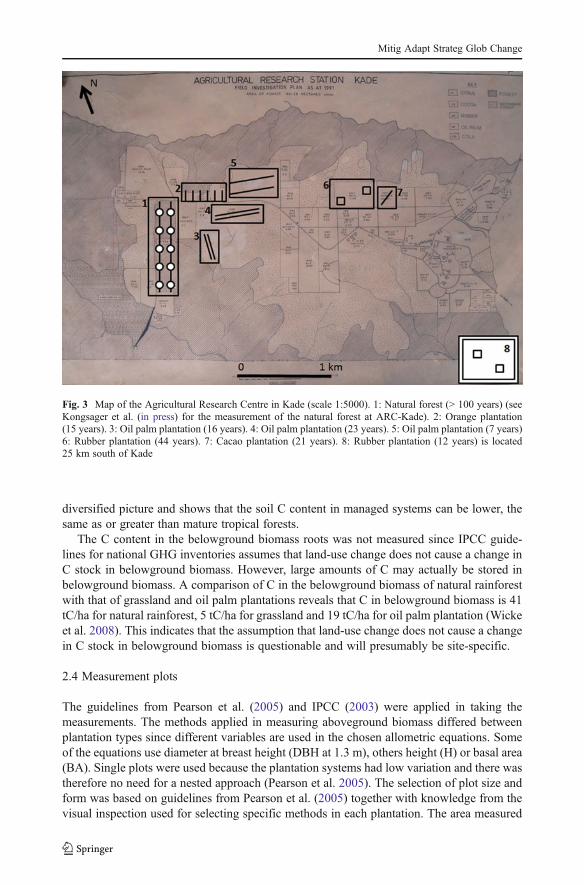
In order to facilitate the fieldwork and increase accuracy and precision in measuring andestimating the C, the project area was stratified according to the plantations present in thearea. This reduced the sampling effort while maintaining the same level of confidence sincethere was a smaller variation in C stocks in each stratum than in the whole area. The projectarea was stratified by land-uses and ages in the four plantation types of interest by applying aLandsat scene from 1986 and a land-use map from 1991 (Fig. 3). The Landsat scene wasalso used for calibrating the GPS. The land-use map, giving the year of establishment foreach plantation, was applied for detailed planning and the definition of boundaries in themeasurement plan. Visual inspection of the four plantation types could not justify subjacentstratification, as the areas seemed to be homogenous units in relation to the variable to bemeasured.
2.3 Carbon pools measured
In general there are six C pools applicable to Land Use, Land-Use Change and Forestry(LULUCF) activities – aboveground trees, aboveground non-tree, belowground roots, litter,dead wood and soil organic matter. The selection of which pools to measure depends onseveral factors, including expected rate of change, magnitude and direction of change,availability and accuracy of methods to quantify change, and the cost of measuring (Pearsonet al. 2005). In this study we focused on the C pool in the aboveground living biomass oftrees since this accounts for the largest percentage of the sequestered C within a forestecosystem (Yang et al. 2005; Alves et al. 2010), and it is therefore the most important pool inthe land-use change context (Kotto-Same et al. 1997). Consequently, other C pools, as wellas C in harvested material, were not considered. It should be noted that only a very limitedamount of aboveground non-tree, litter, and dead wood were found at all sites.
Soil C content, however, is significant, but studies have shown that this changes insig-nificantly as a consequence of land-use changes. Soto-Pinto et al. (2010) found that soil Cwas mainly influenced by agro-climatic zone, not by land-use, and Kotto-Same et al. (1997)characterized the soil C content as stable with regard to land-use changes. Yang et al. (2005)showed that conversion from forest to arable land mainly reduced the C content of topsoilsand much less in the deep layers. Lugo and Brown’s meta-study (1993) gives a more
0
5
10
15
20
25
30
0
50
100
150
200
250
300
Precipitation [mm] Temperature [˚C]
Fig. 2 Climate diagram, ARC-Kade, 1980-2010. Annual averages: precipitation 1,425 mm; temperature 26 °C.Data for 1984, 2005, 2006 and 2007 are incomplete and not included (data provided by Dr S. Adjei-Nsiah 2011)
Mitig Adapt Strateg Glob Change
diversified picture and shows that the soil C content in managed systems can be lower, thesame as or greater than mature tropical forests.
The C content in the belowground biomass roots was not measured since IPCC guide-lines for national GHG inventories assumes that land-use change does not cause a change inC stock in belowground biomass. However, large amounts of C may actually be stored inbelowground biomass. A comparison of C in the belowground biomass of natural rainforestwith that of grassland and oil palm plantations reveals that C in belowground biomass is 41tC/ha for natural rainforest, 5 tC/ha for grassland and 19 tC/ha for oil palm plantation (Wickeet al. 2008). This indicates that the assumption that land-use change does not cause a changein C stock in belowground biomass is questionable and will presumably be site-specific.
2.4 Measurement plots
The guidelines from Pearson et al. (2005) and IPCC (2003) were applied in taking themeasurements. The methods applied in measuring aboveground biomass differed betweenplantation types since different variables are used in the chosen allometric equations. Someof the equations use diameter at breast height (DBH at 1.3 m), others height (H) or basal area(BA). Single plots were used because the plantation systems had low variation and there wastherefore no need for a nested approach (Pearson et al. 2005). The selection of plot size andform was based on guidelines from Pearson et al. (2005) together with knowledge from thevisual inspection used for selecting specific methods in each plantation. The area measured
Fig. 3 Map of the Agricultural Research Centre in Kade (scale 1:5000). 1: Natural forest (> 100 years) (seeKongsager et al. (in press) for the measurement of the natural forest at ARC-Kade). 2: Orange plantation(15 years). 3: Oil palm plantation (16 years). 4: Oil palm plantation (23 years). 5: Oil palm plantation (7 years)6: Rubber plantation (44 years). 7: Cacao plantation (21 years). 8: Rubber plantation (12 years) is located25 km south of Kade
Mitig Adapt Strateg Glob Change
in each plantation was based on the assumption that approximately 5 % of a very uniformarea is a sufficient sample area, as these plantations have very low variation. The number ofplots was low as only small variations were present in each plantation. In total sevenplantations were measured, specifically: cocoa (1), orange (1), rubber (2), and oil palm (3).
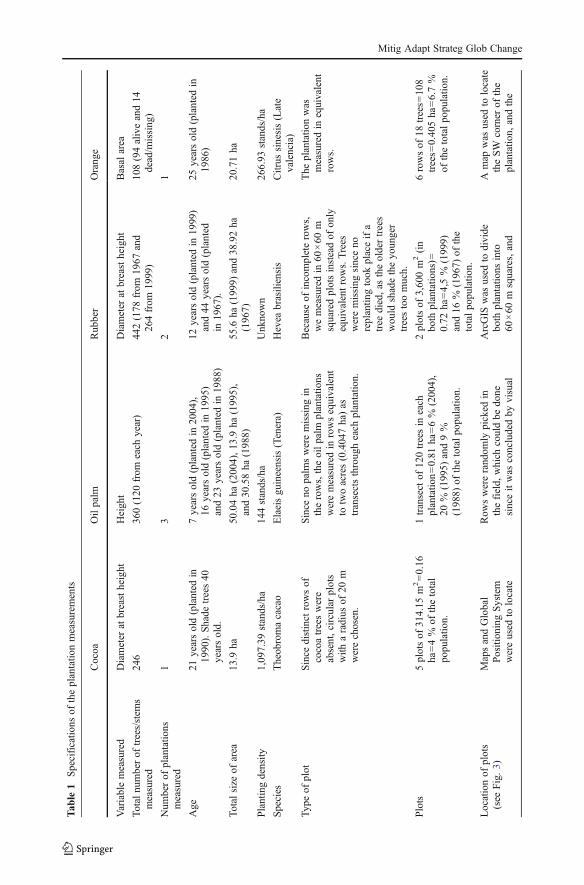
The trees and therefore the C content were small in the cocoa and orange plantations,even though they were 21 and 25 years old. Younger cocoa and orange plantations (e.g.10 years old) could have been measured, but the C content was deemed to be insignificant.In addition, older plantations could have been studied, but the cocoa and orange plantationsmeasured seemed to have reached their maximum, and for these reasons it was decided onlyto measure one of each. Two rubber and three oil palm plantations were measured in order toexamine the development in C content. Specifications regarding the measurements areshown in Table 1, and notes regarding the actual field measurements are described below.
Cocoa DBH of trees/stems with a DBH≥5 cm were measured. Species-specific equationsusing BA do exist (Beer et al. 1990), but we did not harvest these data due to the intricatenature of the cocoa tree bases. The plantation had mango shade trees with approximately20 m between each tree, and these were used as the centre of plots, as was also done by Isaacet al. (2007). DBH of the shade tree was also recorded. Every second mango shade tree wasused as a centre in a systematic approach to cover a wider part of the plantation.
Oil palm Only the height was recorded since biomass in palms is more closely related toheight than to diameter (Pearson et al. 2005). Height was measured with a stick divided intointervals: 10 cm intervals for the 7-year-old plantation, 25 cm intervals for the 16-year-oldplantation and 50 cm intervals for the 23-year-old plantation. Only the height of the stemwas measured from the base up to the spot where the stem was no longer visible. No zerovalues occur in the dataset, as dead palms are replanted with new palms.
Orange Diameter at the base was measured, converted to BA and then used in the biomassequations for orange trees. Missing/dead trees were set to zero. To cover a wide part of theplantation a systematic approach was applied: in every third row every second tree in the rowwas measured.
3 Analysis
The following sections describe how the input parameters were processed and then how theC content was calculated and scaled up.
3.1 Cocoa
Isaac et al. (2007) noted that no species-specific biomass regression based on DBH could befound in the literature, so they used a general biomass equation from Brown (1997) for thetropical biome, and the same approach was applied in this study (Eq. 1). This equation wasused by Pearson et al. (2005) and updated from Brown (1997). It applies to the tropicalregion, with only DBH as an input parameter.
AGB ¼ exp �2:289þ 2:649 ln DBHð Þ � 0:021 DBHð Þ2� �
ð1Þ
where AGB is aboveground biomass [kg] and DBH is diameter at breast height [cm].
Mitig Adapt Strateg Glob Change
Tab
le1
Specificatio
nsof
theplantatio
nmeasurements
Cocoa
Oilpalm
Rubber
Orang
e
Variablemeasured
Diameter
atbreastheight
Heigh
tDiameter
atbreastheight
Basal
area
Totalnumberof
trees/stem
smeasured
246
360(120
from
each
year)
442(178
from
1967
and
264from
1999)
108(94aliveand14
dead/m
issing)
Num
berof
plantatio
nsmeasured
13
21
Age
21yearsold(planted
in19
90).Shade
trees40
yearsold.
7yearsold(planted
in20
04),
16yearsold(planted
in1995)
and23
yearsold(planted
in1988)
12yearsold(planted
in1999)
and44
yearsold(planted
in19
67).
25yearsold(planted
in19
86)
Totalsize
ofarea
13.9
ha50
.04ha
(200
4),13
.9ha
(1995),
and30
.58ha
(198
8)55
.6ha
(199
9)and38
.92ha
(196
7)20
.71ha
Plantingdensity
1,09
7.39
stands/ha
144stands/ha
Unk
nown
266.93
stands/ha
Species
Theobromacacao
Elaeisgu
ineensis(Tenera)
Hevea
brasiliensis
Citrus
sinesis(Late
valencia)
Type
ofplot
Since
distinct
rowsof
cocoatreeswere
absent,circular
plots
with
aradius
of20
mwerechosen.
Since
nopalm
sweremissing
intherows,theoilpalm
plantatio
nsweremeasuredin
rowsequivalent
totwoacres(0.404
7ha)as
transectsthrougheach
plantatio
n.
Because
ofincompleterows,
wemeasuredin
60×60
msquaredplotsinsteadof
only
equivalent
rows.Trees
weremissing
sinceno
replantin
gtook
placeifa
tree
died,as
theoldertrees
wou
ldshadetheyo
unger
treestoomuch.
The
plantatio
nwas
measuredin
equivalent
rows.
Plots
5plotsof
314.15
m200.16
ha04%
ofthetotal
populatio
n.
1transect
of12
0treesin
each
plantatio
n00.81
ha06%
(2004),
20%
(199
5)and9%
(1988)
ofthetotalpo
pulatio
n.
2plotsof
3,600m
2(in
both
plantatio
ns)0
0.72
ha04,5%
(199
9)and16
%(196
7)of
the
totalpopulatio
n.
6rowsof
18trees0
108
trees0
0.405ha
06.7%
ofthetotalpopulatio
n.
Locationof
plots
(see
Fig.3)
MapsandGlobal
PositioningSystem
wereused
tolocate
Row
swererandom
lypicked
inthefield,
which
couldbe
done
sinceitwas
concludedby
visual
ArcGIS
was
used
todivide
both
plantatio
nsinto
60×60
msquares,and
Amap
was
used
tolocate
theSW
corner
ofthe
plantatio
n,andthe
Mitig Adapt Strateg Glob Change
Tab
le1
(con
tinued)
Cocoa
Oilpalm
Rubber
Orang
e
startin
gpo
intin
the
SW
corner
ofthe
plantatio
n,andarow
was
rand
omly
picked
inthefield.
inspectio
nthat
alltherowswere
high
lyidentical.
each
square
was
givenan
identificationnumber.Tw
oof
thesenu
mbers
were
rand
omly
picked
bya
compu
terprogram.Maps
andGlobalPosition
ing
System
wereused
tolocate
thecentresof
theplots.
second
row
inthe
northern
directionwas
used
asthefirstrow.
*DBH
Diameter
atbreastheight,H
Height,BA
Basal
area
Mitig Adapt Strateg Glob Change
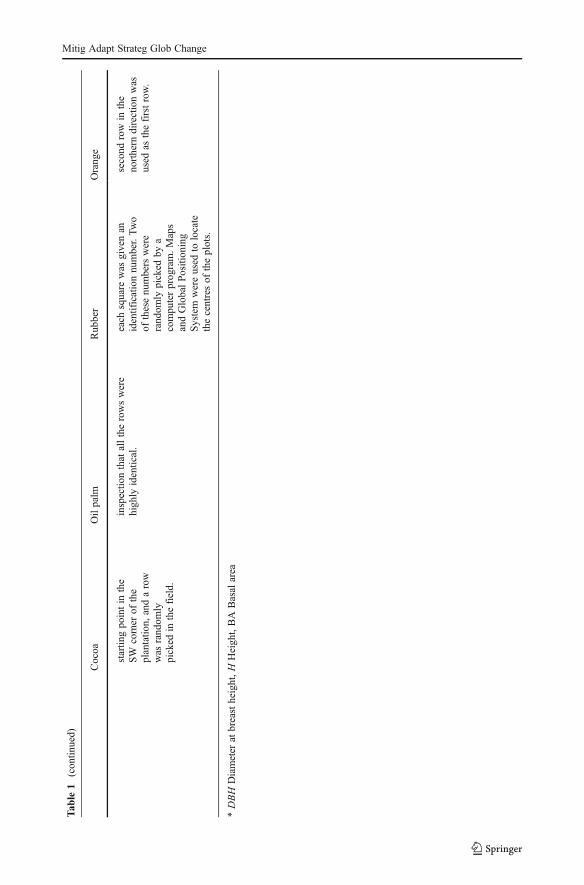
First, the AGB of each tree was calculated using Eq. 1, and these figures were summa-rized to obtain a total AGB for each plot. Subsequently, the C content of the five plots wascalculated by multiplying with the biomass to C conversion factor of 0.5 as recommended byIPCC (2003). Finally, the average C content of the five plots was scaled up to a per hectarebasis using an expansion factor of 31.8 (0 10.000 m2 / 314.15 m2) for each plot. Using thesame factor for the shade trees would have resulted in an overestimate of the total C contentsince the shade trees were only present for every 20 m. There were thus 25 shade trees perhectare, i.e. the shade trees were scaled up by a factor of 25. As the shade trees were 40 yearsold, we used a rough down-scaling to the age of the cocoa trees by dividing by 2.
3.2 Oil palm
The biomass equation from Khalid et al. (1999) (Eq. 2) was used for estimating the Ccontent of the oil palms.
W ¼ 725þ 197H ð2Þwhere W is the total fresh weight [kg] and H is the height [m]. First, W of each palm wascalculated using Eq. 2, and these figures were summarized for each plantation. Subsequent-ly, the dry weight was calculated by applying a dry to fresh weight ratio of 0.27, which wascalculated from the data provided in Khalid et al. (1999). Finally, the results were multipliedusing a biomass C conversion factor of 0.5, as recommended by IPCC (2003), and scaled upto a per hectare basis.
3.3 Rubber
First, AGB of each tree was calculated using Eq. 1, and subsequently converted to C with afactor of 0.487, since this is the value observed and featured in the allometric equation ofWauters et al. (2008). Finally, the results were converted to a per hectare basis.
3.4 Orange
The aboveground C content in the orange plantation was estimated by Eq. 3 from Schroth etal. (2002).
Biomass ¼ �6:64þ 0:279BAþ 0:000514BA2 ð3Þ
where BA is basal area [cm2].First, biomass was calculated using Eq. 7. The results were converted to C with the 0.5
conversion factor, and finally scaled up to a per hectare basis.
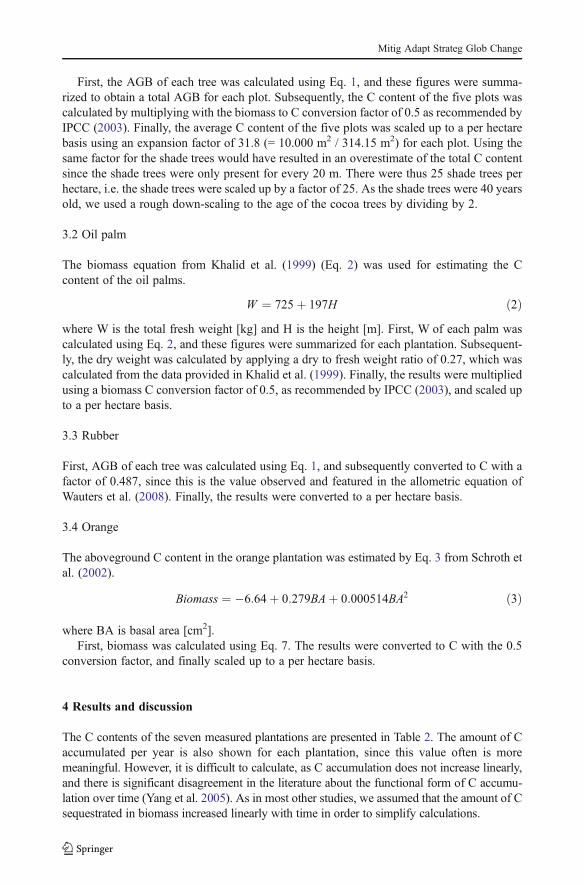
4 Results and discussion
The C contents of the seven measured plantations are presented in Table 2. The amount of Caccumulated per year is also shown for each plantation, since this value often is moremeaningful. However, it is difficult to calculate, as C accumulation does not increase linearly,and there is significant disagreement in the literature about the functional form of C accumu-lation over time (Yang et al. 2005). As in most other studies, we assumed that the amount of Csequestrated in biomass increased linearly with time in order to simplify calculations.
Mitig Adapt Strateg Glob Change
4.1 Cocoa
Isaac et al. (2007) found 20 tC/ha for 8-year-old cocoa under shade trees in a cocoaplantation in Western Ghana (172 km due west of ARC-Kade), and Beer et al. (1990)found 18 tC/ha and 14 tC/ha for 10-year-old cocoa trees under two different types ofshade trees in Costa Rica. These studies correspond well with our results of 41 tC/hafor cocoa trees that are around or more than twice as old. Conversely Gockowski andSonwa (2011) calculated a C stock equilibrium value of 88.7 tC/ha in a 40-year-oldshaded cocoa plantation in Cameroon. The large difference can probably be explainedby the higher precipitation in Cameroon and the high density of shade trees: 120 perha versus 25 in our study site.
The substantial contribution of biomass from the shade trees is a result of the largeaverage of DBHs from trees that were originally part of a mango tree plantation andare therefore quite old and large. Thus, while the total C content of the cocoa treeplantation at ARC-Kade is quite considerable, the actual contribution from the cocoatrees is more modest and at an expected level. Consequently, this must be taken intoaccount when considering using cocoa plantations for C sequestration, as varieties ofcocoa trees that do not need shade will reduce the C content in a cocoa plantationconsiderably.
4.2 Oil palm
Published values on oil palm aboveground C in biomass range from 25 tC/ha to over 50 tC/ha towards the end of the plantation’s economical life span after 25 years (Germer andSauerborn 2008). Our result of 45.3 tC/ha (accumulation: 1.98 tC/ha/year.) for a 23-year-oldplantation corresponds well with this. The measurements in the study by Khalid et al.(1999), from which the applied equation originates, were made on palms with heightsranging from 6 to 9 m which raises the question of whether our results will be valid whenusing heights below this range. We have nonetheless chosen to utilize the equation due tolack of other alternatives and the fact that the most important figures we derived were basedon data within the empirical range.
Khalid et al. (1999) found 85.3 t biomass per ha based on scaling up the average dryweight in plantations to 136 palms per ha. In Kade there were 144 palms per ha, and whenadjusting our results for the 23-year-old oil palm plantation to a level of 136 stands per ha weget an average dry-weight biomass of 85.6 t/ha. For the 23-year-old plantation we found theaverage weight of biomass per palm to be 543 kg, while Khalid et al. (1999) observed
Table 2 Carbon content in plantations
Type Age [years] Aboveground [tC/ha] Accumulation [tC/ha/year]
Cocoa 21 65.0 3.1
Oil Palm 7 21.7 3.1
Oil palm 16 28.0 1.8
Oil Palm 23 45.3 2.0
Rubber 12 61.5 5.1
Rubber 44 213.6 4.9
Orange 25 76.3 3.1
Mitig Adapt Strateg Glob Change
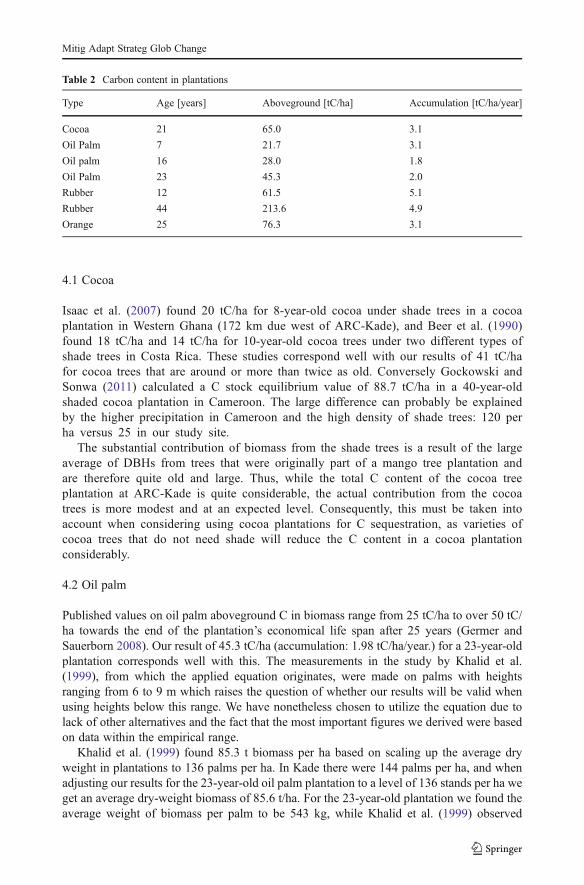
627 kg and Corley et al. (1971) estimated an average of 556 kg for 27½-year-old oil palms.Given the differences in age and mean height, the similarities lead us to believe that ourfigures were in a reasonable range, and thus we consider our estimates to be acceptable forthe 23-year-old oil palms. In addition, Corley et al. (1971) found the mean palm biomassweight to be 252 kg and 493 kg for oil palms at the ages of 7½ and 16 years respectively.Our results showed 261 and 343 kg for the 7-year-old and 16-year-old oil palms respectively.While this is consistent with the 7-year-old oil palms, the 16-year-old palms seem a bitskewed until one looks at the linear regression calculated from the data of Corley et al.(1971) (Fig. 4), which makes 343 kg/palm at the age of 16 more likely.
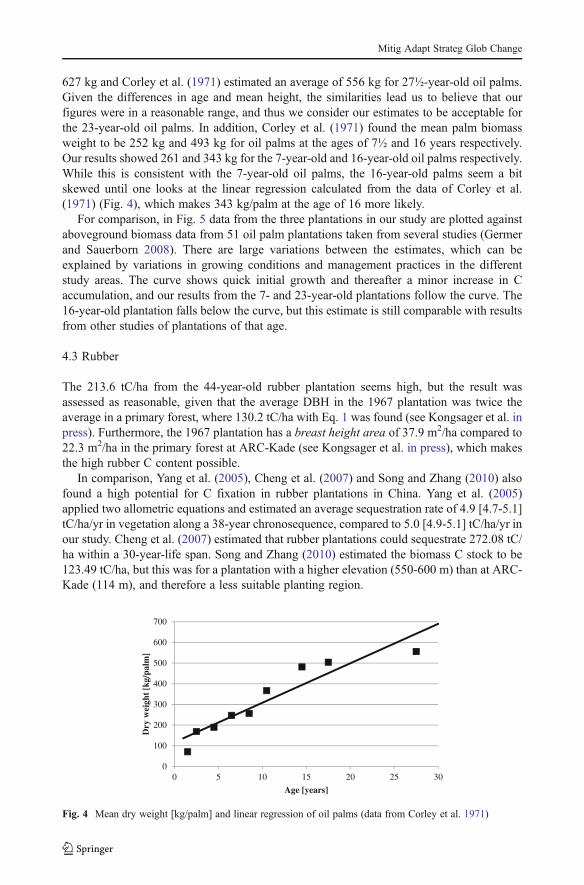
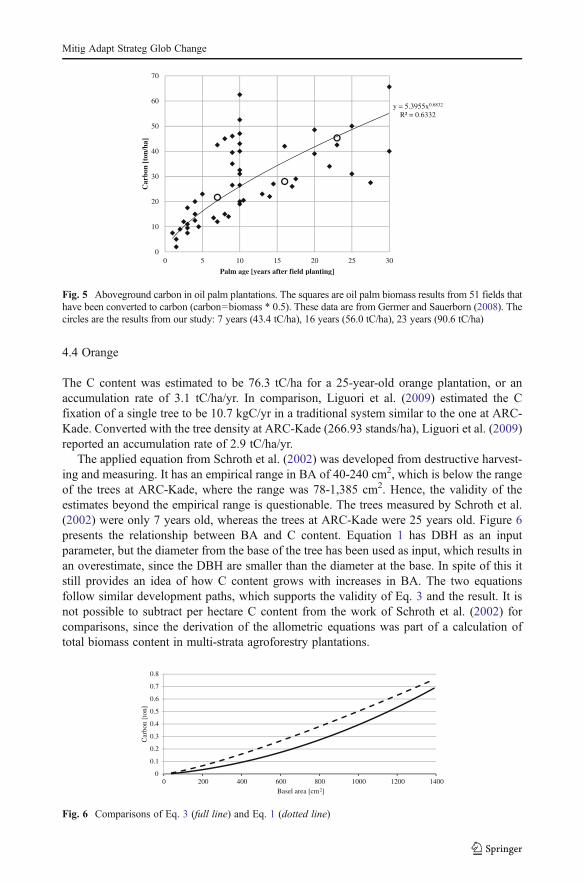
For comparison, in Fig. 5 data from the three plantations in our study are plotted againstaboveground biomass data from 51 oil palm plantations taken from several studies (Germerand Sauerborn 2008). There are large variations between the estimates, which can beexplained by variations in growing conditions and management practices in the differentstudy areas. The curve shows quick initial growth and thereafter a minor increase in Caccumulation, and our results from the 7- and 23-year-old plantations follow the curve. The16-year-old plantation falls below the curve, but this estimate is still comparable with resultsfrom other studies of plantations of that age.
4.3 Rubber
The 213.6 tC/ha from the 44-year-old rubber plantation seems high, but the result wasassessed as reasonable, given that the average DBH in the 1967 plantation was twice theaverage in a primary forest, where 130.2 tC/ha with Eq. 1 was found (see Kongsager et al. inpress). Furthermore, the 1967 plantation has a breast height area of 37.9 m2/ha compared to22.3 m2/ha in the primary forest at ARC-Kade (see Kongsager et al. in press), which makesthe high rubber C content possible.
In comparison, Yang et al. (2005), Cheng et al. (2007) and Song and Zhang (2010) alsofound a high potential for C fixation in rubber plantations in China. Yang et al. (2005)applied two allometric equations and estimated an average sequestration rate of 4.9 [4.7-5.1]tC/ha/yr in vegetation along a 38-year chronosequence, compared to 5.0 [4.9-5.1] tC/ha/yr inour study. Cheng et al. (2007) estimated that rubber plantations could sequestrate 272.08 tC/ha within a 30-year-life span. Song and Zhang (2010) estimated the biomass C stock to be123.49 tC/ha, but this was for a plantation with a higher elevation (550-600 m) than at ARC-Kade (114 m), and therefore a less suitable planting region.
0
100
200
300
400
500
600
700
0 5 10 15 20 25 30
Dry
wei
ght
[kg/
palm
]
Age [years]
Fig. 4 Mean dry weight [kg/palm] and linear regression of oil palms (data from Corley et al. 1971)
Mitig Adapt Strateg Glob Change
4.4 Orange
The C content was estimated to be 76.3 tC/ha for a 25-year-old orange plantation, or anaccumulation rate of 3.1 tC/ha/yr. In comparison, Liguori et al. (2009) estimated the Cfixation of a single tree to be 10.7 kgC/yr in a traditional system similar to the one at ARC-Kade. Converted with the tree density at ARC-Kade (266.93 stands/ha), Liguori et al. (2009)reported an accumulation rate of 2.9 tC/ha/yr.
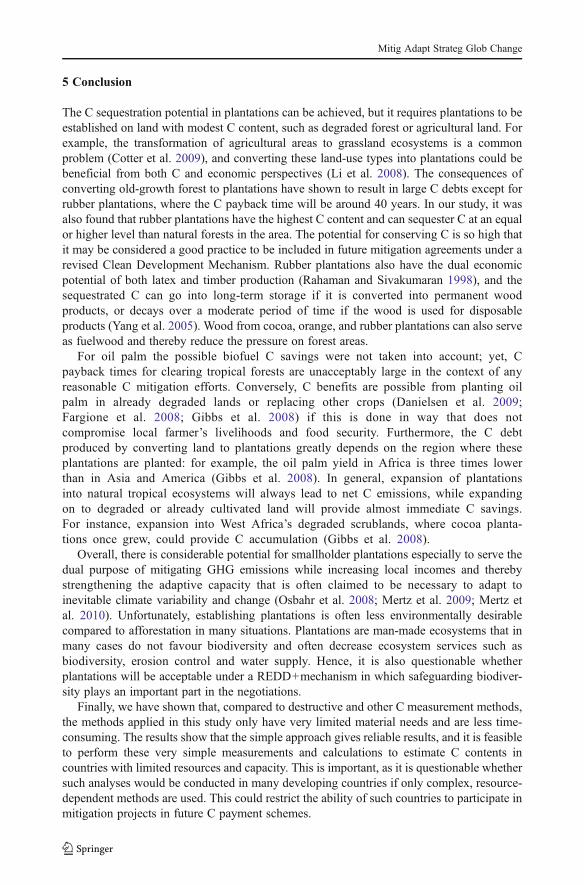
The applied equation from Schroth et al. (2002) was developed from destructive harvest-ing and measuring. It has an empirical range in BA of 40-240 cm2, which is below the rangeof the trees at ARC-Kade, where the range was 78-1,385 cm2. Hence, the validity of theestimates beyond the empirical range is questionable. The trees measured by Schroth et al.(2002) were only 7 years old, whereas the trees at ARC-Kade were 25 years old. Figure 6presents the relationship between BA and C content. Equation 1 has DBH as an inputparameter, but the diameter from the base of the tree has been used as input, which results inan overestimate, since the DBH are smaller than the diameter at the base. In spite of this itstill provides an idea of how C content grows with increases in BA. The two equationsfollow similar development paths, which supports the validity of Eq. 3 and the result. It isnot possible to subtract per hectare C content from the work of Schroth et al. (2002) forcomparisons, since the derivation of the allometric equations was part of a calculation oftotal biomass content in multi-strata agroforestry plantations.
y = 5.3955x0.6832
R² = 0.6332
0
10
20
30
40
50
60
70
0 5 10 15 20 25 30
Car
bon
[ton
/ha]
Palm age [years after field planting]
Fig. 5 Aboveground carbon in oil palm plantations. The squares are oil palm biomass results from 51 fields thathave been converted to carbon (carbon0biomass * 0.5). These data are from Germer and Sauerborn (2008). Thecircles are the results from our study: 7 years (43.4 tC/ha), 16 years (56.0 tC/ha), 23 years (90.6 tC/ha)
0
0.1
0.2
0.3
0.4
0.5
0.6
0.7
0.8
0 200 400 600 800 1000 1200 1400
Car
bon
[ton
]
Basel area [cm2]
Fig. 6 Comparisons of Eq. 3 (full line) and Eq. 1 (dotted line)
Mitig Adapt Strateg Glob Change
5 Conclusion
The C sequestration potential in plantations can be achieved, but it requires plantations to beestablished on land with modest C content, such as degraded forest or agricultural land. Forexample, the transformation of agricultural areas to grassland ecosystems is a commonproblem (Cotter et al. 2009), and converting these land-use types into plantations could bebeneficial from both C and economic perspectives (Li et al. 2008). The consequences ofconverting old-growth forest to plantations have shown to result in large C debts except forrubber plantations, where the C payback time will be around 40 years. In our study, it wasalso found that rubber plantations have the highest C content and can sequester C at an equalor higher level than natural forests in the area. The potential for conserving C is so high thatit may be considered a good practice to be included in future mitigation agreements under arevised Clean Development Mechanism. Rubber plantations also have the dual economicpotential of both latex and timber production (Rahaman and Sivakumaran 1998), and thesequestrated C can go into long-term storage if it is converted into permanent woodproducts, or decays over a moderate period of time if the wood is used for disposableproducts (Yang et al. 2005). Wood from cocoa, orange, and rubber plantations can also serveas fuelwood and thereby reduce the pressure on forest areas.
For oil palm the possible biofuel C savings were not taken into account; yet, Cpayback times for clearing tropical forests are unacceptably large in the context of anyreasonable C mitigation efforts. Conversely, C benefits are possible from planting oilpalm in already degraded lands or replacing other crops (Danielsen et al. 2009;Fargione et al. 2008; Gibbs et al. 2008) if this is done in way that does notcompromise local farmer’s livelihoods and food security. Furthermore, the C debtproduced by converting land to plantations greatly depends on the region where theseplantations are planted: for example, the oil palm yield in Africa is three times lowerthan in Asia and America (Gibbs et al. 2008). In general, expansion of plantationsinto natural tropical ecosystems will always lead to net C emissions, while expandingon to degraded or already cultivated land will provide almost immediate C savings.For instance, expansion into West Africa’s degraded scrublands, where cocoa planta-tions once grew, could provide C accumulation (Gibbs et al. 2008).
Overall, there is considerable potential for smallholder plantations especially to serve thedual purpose of mitigating GHG emissions while increasing local incomes and therebystrengthening the adaptive capacity that is often claimed to be necessary to adapt toinevitable climate variability and change (Osbahr et al. 2008; Mertz et al. 2009; Mertz etal. 2010). Unfortunately, establishing plantations is often less environmentally desirablecompared to afforestation in many situations. Plantations are man-made ecosystems that inmany cases do not favour biodiversity and often decrease ecosystem services such asbiodiversity, erosion control and water supply. Hence, it is also questionable whetherplantations will be acceptable under a REDD+mechanism in which safeguarding biodiver-sity plays an important part in the negotiations.
Finally, we have shown that, compared to destructive and other C measurement methods,the methods applied in this study only have very limited material needs and are less time-consuming. The results show that the simple approach gives reliable results, and it is feasibleto perform these very simple measurements and calculations to estimate C contents incountries with limited resources and capacity. This is important, as it is questionable whethersuch analyses would be conducted in many developing countries if only complex, resource-dependent methods are used. This could restrict the ability of such countries to participate inmitigation projects in future C payment schemes.
Mitig Adapt Strateg Glob Change
Acknowledgements Thanks are due to Dr G. Nkansah (Head of Centre ARC-Kade) and Dr K.G.Ofosu-Budu (Deputy Head of Centre ARC-Kade) for their collaboration and support in the field atARC-Kade. We are also grateful to Adu Solomon for assisting us in the plantations, Dr S. Adjei-Nsiah for local weather data, and Josep M. Kokroh for farming data. At the University of Copenha-gen, thanks are due to Henrik Breuning-Madsen for providing contacts in Ghana, biometrician HenrikMeilby for guidance in the carbon calculations, and Bjarne Fog for technical GPS- and GIS-support.The project was partly funded by grants kindly provided by the Løffler and Steensby’s Foundation,the Oticon Foundation, and the University of Copenhagen.
References
Alves LF, Vieira SA, Scaranello MA, Camargo PB, Santos FA, Joly CA, Martinelli LA (2010) Forest structureand live aboveground biomass variation along an elevational gradient of tropical Atlantic moist forest(Brazil). For Ecol Manage 260:679–691
Ayers JM, Huq S (2009) The value of linking mitigation and adaptation: a case study of Bangladesh. EnvironManage 43:753–764
Beer J, Bonnemann A, Chavez W et al (1990) Modeling agroforestry systems of cacao (Theobroma-Cacao)with Laurel (Cordia-Alliodora) Or Poro (Erythrina-Poeppigiana) in Costa-Rica.5. Productivity indexes,organic material models and sustainability over 10 years. Agroforestry Syst 12:229–249
Brown S (1997) Estimating biomass and biomass change of tropical forests: a primer. (FAO Forestry Paper -134). FAO - Food and Agriculture Organization of the United Nations, Rome, Italy
Canadell JG, Le Quere C, Raupach MR et al (2007) Contributions to accelerating atmospheric CO(2) growthfrom economic activity, carbon intensity, and efficiency of natural sinks. Proc Natl Acad Sci USA104:18866–18870
Chase LDC, Henson IE (2010) A detailed greenhouse gas budget for palm oil production. Int J Agr Sustain8:199–214
Cheng C, Wang R, Jiang J (2007) Variation of soil fertility and carbon sequestration by planting Heveabrasiliensis in Hainan Island, China. J Environ Sci (China) 19:348–352
Corley RHV, Gray BS, Kee NS (1971) Productivity of Oil Palm (Elaeis-Guineensis-Jacq) in Malaysia. ExpAgr 7:129–136
Cotter M, Martin K, Sauerborn J (2009) How do “Renewable Products” impact biodiversity and ecosystemservices—the example of natural rubber in China. J Agr Rural Dev Trop 110:9–22
Danielsen F, Beukema H, Burgess ND et al (2009) Biofuel plantations on forested lands: double jeopardy forbiodiversity and climate. Conserv Biol 23:348–358
Duguma B, Gockowski J, Bakala J (2001) Smallholder Cacao (Theobroma cacao Linn.) cultivation inagroforestry systems of West and Central Africa: challenges and opportunities. Agroforestry Systems51:177–188
Fargione J, Hill J, Tilman D et al (2008) Land clearing and the biofuel carbon debt. Science 319:1235–1238Fitzherbert EB, Struebig MJ, Morel A et al (2008) How will oil palm expansion affect biodiversity? Trends
Ecol Evol 23:538–545Foong-Kheong Y, Sundram K, Basiron Y (2010) Mitigating climate change through oil palm cultivation. Int J
Global Warm 2:118–127Fox J, Fujita Y, Ngidang D et al (2009) Policies, political-economy, and Swidden in Southeast Asia. Hum Ecol
37:305–322Germer J, Sauerborn J (2008) Estimation of the impact of oil palm plantation establishment on greenhouse gas
balance. Environ Dev Sustain 10:697–716Gibbs HK, Brown S, Niles JO et al (2007) Monitoring and estimating tropical forest carbon stocks: making
REDD a reality. Environ Res Lett 2:045023Gibbs HK, Johnston M, Foley JA et al (2008) Carbon payback times for crop-based biofuel expansion in the
tropics: the effects of changing yield and technology. Environ Res Lett 3:034001Gockowski J, Sonwa D (2011) Cocoa intensification scenarios and their predicted impact on CO(2) emissions,
biodiversity conservation, and rural livelihoods in the Guinea Rain Forest of West Africa. EnvironManage 48:307–321
Halsnæs K, Verhagen J (2007) Development based climate change adaptation and mitigation conceptualissues and lessons learned in studies in developing countries. Mitig Adapt Strat Glob Chang 12:665–684
Houghton RA, van der Werf GR, DeFries RS, Hansen MC, House JI, Le Quere C, Pongratz J, Ramankutty N(2012) Chapter G2 Carbon emissions from land use and land-cover change. BGD 9:835–878
Mitig Adapt Strateg Glob Change
IPCC (2003) Intergovernmental Panel on Climate Change. In: Penman J et al. (eds) Good practice guidancefor land use, land-use change and forestry (GPG-LULUCF). IPCC-IGES, Japan
IPCC (2006) Intergovernmental Panel on Climate Change. IPCC guidelines for national greenhouse gasinventories. In: Eggleston H, Buendia L, Miwa K, Ngara T, Tanabe K (eds) The national greenhouse gasinventories programme. IPCC-IGES, Japan
IPCC (2007) Summary for policymakers. In: Climate Change 2007: the physical science basis. Contributionof Working Group I to the Fourth Assessment Report of the Intergovernmental Panel on Climate Change.Cambridge University Press, Cambridge, United Kingdom and New York, NY, USA
IsaacM, Timmer V, Quashie-Sam S (2007) Shade tree effects in an 8-year-old cocoa agroforestry system: biomassand nutrient diagnosis of Theobroma cacao by vector analysis. Nutr Cycl Agroecosyst 78:155–165
Khalid H, Zin ZZ, Anderson JM (1999) Quantification of oil palm biomass and nutrient value in a matureplantation. I: Above-ground biomass. J Oil Palm Res 11:23–32
Klein RJT, Schipper EL, Dessai S (2005) Integrating mitigation and adaptation into climate and developmentpolicy: three research questions. Environ Sci Pol 8:579–588
Klein RJT, Huq S, Denton F, Downing TE, Richels RG, Robenson JB, Toth FL (2007) Inter-relationshipsbetween adaptation and mitigation. Climate Change 2007: Impacts, Adaptation and Vulnerability.Contribution of Working Group II to the Fourth Assessment Report of the Intergovernmental Panel onClimate Change. Cambridge University Press, Cambridge, UK
Koh LP, Wilcove DS (2008) Is oil palm agriculture really destroying tropical biodiversity. Conserv Lett1:60–64
Kongsager R, Napier J, Mertz O (in press) The breakeven price of REDD-credits: a case study from Kade,Ghana. Environmental Management
Kotto-Same J, Woomer PL, Appolinaire M et al (1997) Carbon dynamics in slash-and-burn agriculture andland use alternatives of the humid forest zone in Cameroon. Agric Ecosyst Environ 65:245–256
Li HM, Ma YX, Aide TM et al (2008) Past, present and future land-use in Xishuangbanna, China and theimplications for carbon dynamics. For Ecol Manage 255:16–24
Liguori G, Gugliuzza G, Inglese P (2009) Evaluating carbon fluxes in orange orchards in relation to plantingdensity. J Agric Sci 147:637–645
Lugo AE, Brown S (1993) Management of tropical soils as sinks or sources of atmospheric carbon. Plant Soil149:27–41
Mertz O, Halsnæs K, Olesen JE et al (2009) Adaptation to climate change in developing countries. EnvironManage 43:43–752
Mertz O, Mbow C, Nielsen JØ et al (2010) Climate factors play a limited role for past adaptation strategies inWest Africa. Ecol Soc 15:25
Ngidang D (2002) Contradictions in land development schemes: the case of joint ventures in Sarawak,Malaysia. Asia Pac Viewp 43:157–180
Nye PH (1961) Organic matter and nutrient cycles under moist tropical forest. Plant and Soff XIIIOsbahr H, Twyman C, Adger WN, Thomas DSG (2008) Effective livelihood adaptation to climate change
disturbance: scale dimensions of practice in Mozambique. Geoforum 39:1951–1964Pearson T, Walker S, Brown S (2005) Sourcebook for land use, land-use change and forestry projects.
Winrock InternationalRahaman WA, Sivakumaran S (1998) Studies of carbon sequestration in rubber. UNCTAD/IRSG RUBBER
FORUM, BaliSandker M, Nyame SK, Foerster J et al (2010) REDD payments as incentive for reducing forest loss. Conserv
Lett 3:114–121Schroth G, D'Angelo SA, Teixeira WG et al (2002) Conversion of secondary forest into agroforestry and
monoculture plantations in Amazonia: consequences for biomass, litter and soil carbon stocks after7 years. For Ecol Manage 163:131–150
Sheil D, Casson A, Meijaard E, van Noordwijk M, Gaskell J, Sunderland-Groves J, Wertz K, Kanninen M(2009) The impacts and opportunities of oil palm in Southeast Asia: what do we know and what do weneed to know? Occasional Paper No. 51. Center for International Forestry Research (CIFOR), Bogor,Indonesia
Song Q, Zhang Y (2010) Biomass, carbon sequestration and its potential of rubber plantations in Xishuang-banna, Southwest China. Shengtaixue Zazhi 29:1887–1891
Soto-Pinto L, Anzueto M, Mendoza J et al (2010) Carbon sequestration through agroforestry in indigenouscommunities of Chiapas, Mexico. Agroforestry Systems 78:39–51
Tol RSJ (2005) Adaptation and mitigation: trade-offs in substance and methods. Environ Sci Pol 8:572–578UNFCCC (2010) Nationally appropriate mitigation actions (NAMAs) of developing country Parties. Sub-
mission of Appendix II of the Copenhagen Accord - Ghana
Mitig Adapt Strateg Glob Change

Verchot L, van Noordwijk M, Kandji S et al (2007) Climate change: linking adaptation and mitigation throughagroforestry. Mitig Adapt Strat Glob Chang 12:901–918
Wauters J, Coudert S, Grallien E et al (2008) Carbon stock in rubber tree plantations in Western Ghana andMato Grosso (Brazil). For Ecol Manage 255:2347–2361
Wicke B, Dornburg V, Junginger M et al (2008) Different palm oil production systems for energy purposesand their greenhouse gas implications. Biomass Bioenerg 32:1322–1337
Yang J, Huang J, Tang J et al (2005) Carbon sequestration in rubber tree plantations established on formerarable lands in Xishuangbanna, SW china. Chin J Plant Ecology 29:296–303
Mitig Adapt Strateg Glob Change