the carbon balance of tropical, temperate and boreal forests
TRANSCRIPT
ABSTRACT
Forest biomes are major reserves for terrestrial carbon,and major components of global primary productivity.The carbon balance of forests is determined by a numberof component processes of carbon acquisition and carbonloss, and a small shift in the magnitude of these processeswould have a large impact on the global carbon cycle. Inthis paper, we discuss the climatic influences on the carbondynamics of boreal, temperate and tropical forests by pre-senting a new synthesis of micrometeorological, ecophysio-logical and forestry data, concentrating on threecase-study sites. Historical changes in the carbon balanceof each biome are also reviewed, and the evidence for acarbon sink in each forest biome and its likely behaviourunder future global change are discussed. We concludethat there have been significant advances in determiningthe carbon balance of forests, but there are still criticaluncertainties remaining, particularly in the behaviour ofsoil carbon stocks.
Key-words: biosphere – atmosphere interactions; carbon di-oxide; eddy covariance; forests; global carbon cycle; globalchange.
INTRODUCTION
The increasing concentration of carbon dioxide in the atmo-sphere since the industrial revolution is among the most sig-nificant of human influences on the global environment. Thesource of this carbon dioxide has been convincingly ascribedto the use of fossil fuels, cement manufacture and deforesta-tion, but considerable mystery remains because only a frac-tion of the estimated emissions of CO2 remains in theatmosphere.
Between 1980 & 1989, it is estimated (Schimel 1995) that5·5 ± 0·5 Gt C year–1 were released through fossil fuel com-bustion and cement production, and 1·6 ± 1·0 Gt C year–1
through tropical deforestation, resulting in total anthro-pogenic emissions of 7·1 ± 1·1 Gt C year–1. Of this total,only 3·3 ± 0·2 Gt C year–1 (46%) remained in the atmo-sphere, and a combination of modelling and measurementsof carbon isotopes and atmospheric O2/N2 ratios suggest that2·0 ± 0·8 Gt C year–1 were transferred into the oceans. This
leaves 1·8 ± 1·6 Gt C year–1 that are ascribed to a terrestrial‘missing sink’, a term that encompasses land-use changeprocesses such as forest regrowth resulting from abandon-ment of agricultural land in mid-latitudes, as well as eco-physiological processes such as enhanced forest growthattributable to CO2 fertilization, nitrogen deposition andresponse to climatic anomalies. It should be emphasized thatthe above figures for the global carbon cycle, although fre-quently quoted, are the mean for the 1980s, and global emis-sions have already moved significantly above this level.Recent (1996) global emissions resulting from the use offossil fuels and cement production are estimated to be6·5 Gt C year–1 (World Energy Council, Nature390,p. 215)and increasing at a rate of about 0·1 Gt year–1.
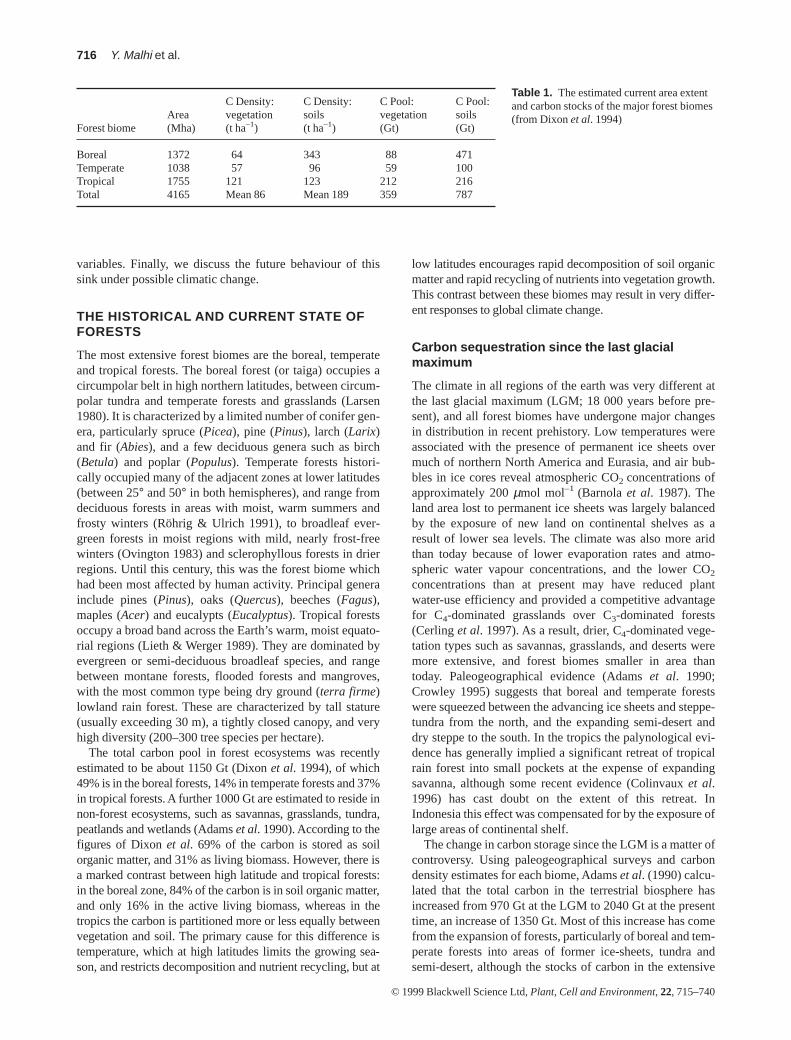
There is evidently considerable uncertainty about themagnitude of the terrestrial missing sink, and even largeruncertainty about its location. With a few significant excep-tions, such as tropical grasslands (Scurlock & Hall 1998),the sink is thought to be largely in the world’s forests, whichare large reservoirs of both biomass and soil carbon(Table 1), and, on a total biome basis, the largest contributorsto global primary productivity.
The net carbon budget of a forest is a fine balance betweenprocesses of carbon acquisition (photosynthesis, treegrowth, forest ageing, carbon accumulation in soils), andprocesses of carbon release (respiration of living biomass,tree mortality, microbial decomposition of litter, oxidationof soil carbon, degradation and disturbance). These pro-cesses operate on a variety of time scales from diurnal toseasonal, interannual, interdecadal and beyond, and areinfluenced by a number of climatic and environmentalvariables, such as temperature, moisture availability andfrequency of disturbance. Moreover, there are large differ-ences between different forest types such as the humidtropical forests of Amazonia and the cold boreal forests ofSiberia, so the major forest biomes need to be treated sepa-rately. In this article we first review the historical natural andanthropogenic processes that have affected the areal extentand total carbon balance of forest biomes. We then examinethe evidence for a present-day carbon sink in the majorbiomes from forestry, micrometeorological and atmosphericstudies. Utilizing three sites for which detailed data areavailable, we also present a comparison of carbon cycling inthe tropical, temperate and boreal forest biomes (using acombination of micrometeorological, ecophysiological andforest mensuration measurements), and a discussion of thediffering response of each forest type to environmental
Plant, Cell and Environment (1999) 22, 715–740
© 1999 Blackwell Science Ltd
The carbon balance of tropical, temperate and boreal forests
Y. MALHI 1, D. D. BALDOCCHI2 & P. G. JARVIS1
1Institute of Ecology and Resource Management, University of Edinburgh, Edinburgh EH9 3JU, Scotland, UK and2Atmospheric Turbulence and Diffusion Division, National Oceanographic and Atmospheric Administration, PO Box 2456,Oak Ridge, TN 37871, USA
ORIGINAL ARTICLE OA 220 EN
Correspondence: Yadvinder Malhi. Tel: +44 131 650 5744; Fax:+44 131 662 0478; e-mail: [email protected]
715
variables. Finally, we discuss the future behaviour of thissink under possible climatic change.
THE HISTORICAL AND CURRENT STATE OFFORESTS
The most extensive forest biomes are the boreal, temperateand tropical forests. The boreal forest (or taiga) occupies acircumpolar belt in high northern latitudes, between circum-polar tundra and temperate forests and grasslands (Larsen1980). It is characterized by a limited number of conifer gen-era, particularly spruce (Picea), pine (Pinus), larch (Larix)and fir (Abies), and a few deciduous genera such as birch(Betula) and poplar (Populus). Temperate forests histori-cally occupied many of the adjacent zones at lower latitudes(between 25° and 50° in both hemispheres), and range fromdeciduous forests in areas with moist, warm summers andfrosty winters (Röhrig & Ulrich 1991), to broadleaf ever-green forests in moist regions with mild, nearly frost-freewinters (Ovington 1983) and sclerophyllous forests in drierregions. Until this century, this was the forest biome whichhad been most affected by human activity. Principal generainclude pines (Pinus), oaks (Quercus), beeches (Fagus),maples (Acer) and eucalypts (Eucalyptus). Tropical forestsoccupy a broad band across the Earth’s warm, moist equato-rial regions (Lieth & Werger 1989). They are dominated byevergreen or semi-deciduous broadleaf species, and rangebetween montane forests, flooded forests and mangroves,with the most common type being dry ground (terra firme)lowland rain forest. These are characterized by tall stature(usually exceeding 30 m), a tightly closed canopy, and veryhigh diversity (200–300 tree species per hectare).
The total carbon pool in forest ecosystems was recentlyestimated to be about 1150 Gt (Dixon et al. 1994), of which49% is in the boreal forests, 14% in temperate forests and 37%in tropical forests. A further 1000 Gt are estimated to reside innon-forest ecosystems, such as savannas, grasslands, tundra,peatlands and wetlands (Adams et al. 1990). According to thefigures of Dixon et al. 69% of the carbon is stored as soilorganic matter, and 31% as living biomass. However, there isa marked contrast between high latitude and tropical forests:in the boreal zone, 84% of the carbon is in soil organic matter,and only 16% in the active living biomass, whereas in thetropics the carbon is partitioned more or less equally betweenvegetation and soil. The primary cause for this difference istemperature, which at high latitudes limits the growing sea-son, and restricts decomposition and nutrient recycling, but at
low latitudes encourages rapid decomposition of soil organicmatter and rapid recycling of nutrients into vegetation growth.This contrast between these biomes may result in very differ-ent responses to global climate change.
Carbon sequestration since the last glacialmaximum
The climate in all regions of the earth was very different atthe last glacial maximum (LGM; 18 000 years before pre-sent), and all forest biomes have undergone major changesin distribution in recent prehistory. Low temperatures wereassociated with the presence of permanent ice sheets overmuch of northern North America and Eurasia, and air bub-bles in ice cores reveal atmospheric CO2 concentrations ofapproximately 200µmol mol–1 (Barnola et al. 1987). Theland area lost to permanent ice sheets was largely balancedby the exposure of new land on continental shelves as aresult of lower sea levels. The climate was also more aridthan today because of lower evaporation rates and atmo-spheric water vapour concentrations, and the lower CO2
concentrations than at present may have reduced plantwater-use efficiency and provided a competitive advantagefor C4-dominated grasslands over C3-dominated forests(Cerling et al. 1997). As a result, drier, C4-dominated vege-tation types such as savannas, grasslands, and deserts weremore extensive, and forest biomes smaller in area thantoday. Paleogeographical evidence (Adams et al. 1990;Crowley 1995) suggests that boreal and temperate forestswere squeezed between the advancing ice sheets and steppe-tundra from the north, and the expanding semi-desert anddry steppe to the south. In the tropics the palynological evi-dence has generally implied a significant retreat of tropicalrain forest into small pockets at the expense of expandingsavanna, although some recent evidence (Colinvaux et al.1996) has cast doubt on the extent of this retreat. InIndonesia this effect was compensated for by the exposure oflarge areas of continental shelf.
The change in carbon storage since the LGM is a matter ofcontroversy. Using paleogeographical surveys and carbondensity estimates for each biome, Adams et al. (1990) calcu-lated that the total carbon in the terrestrial biosphere hasincreased from 970 Gt at the LGM to 2040 Gt at the presenttime, an increase of 1350 Gt. Most of this increase has comefrom the expansion of forests, particularly of boreal and tem-perate forests into areas of former ice-sheets, tundra andsemi-desert, although the stocks of carbon in the extensive
716 Y. Malhi et al.
© 1999 Blackwell Science Ltd, Plant, Cell and Environment,22, 715–740
C Density: C Density: C Pool: C Pool: Area vegetation soils vegetation soils
Forest biome (Mha) (t ha–1) (t ha–1) (Gt) (Gt)
Boreal 1372 64 343 88 471Temperate 1038 57 96 59 100Tropical 1755 121 123 212 216Total 4165 Mean 86 Mean 189 359 787
Table 1. The estimated current area extentand carbon stocks of the major forest biomes(from Dixon et al. 1994)
present-day wetlands and peatlands are also a significantcomponent (280 Gt). More recent estimates argue that theconstriction of forest area at the LGM was not so severe, andsuggest a smaller increase in terrestrial carbon storage of500 ± 200 Gt (Prentice et al. 1994), 610 ± 110 Gt(Friedlingstein et al. 1995) or 900 ± 150 Gt (Crowley 1995).
An alternative insight into carbon storage changes sincethe LGM comes from the observation that glacial oceanicsediments were isotopically lighter than today. Broecker &Peng (1993) estimate a shift in δ13C of 0·35‰; if this shift isdue to a transfer of carbon from the ocean (δ13C ~ 0%0) tothe terrestrial biosphere (δ13C ~ –25‰) it implies anincrease of terrestrial carbon storage of 500 ± 230 Gt (Bird,Lloyd & Farquhar 1994). This value is consistent with thelower estimates of carbon uptake, but there are still a numberof uncertainties in both methodologies, including possiblesinks for marine carbon on continental shelves, and possiblechanges in the density of carbon storage in each terrestrialbiome (Crowley 1995).
Whatever the exact figures, it is likely that all forestbiomes have sequestered significant amounts of carbonsince the LGM, and have acted as an indirect negative feed-back on the rise in CO2 concentration since deglaciation. Ifthis sequestered carbon were resident in the atmosphere,atmospheric CO2 concentrations would be 130–640µmolmol–1 higher than at present (1 Gt C ~ 0·47µmol mol–1
CO2), although in practice the oceans would have bufferedmuch of this fluctuation in the long term. Much of thissequestration probably occurred rapidly at the time ofdeglaciation (Crowley 1995), but it is possible that the forestbiomes have still not equilibrated after this sudden transi-tion. A recent analysis of an Antarctic ice core (Indermühleet al. 1999) found that atmospheric CO2 concentrationsdeclined from a post-glacial maximum of 268 p.p.m.,reached a minimum of 260 p.p.m. in the early Holocene(8200 years B.P.), and subsequently increased linearly to285 p.p.m. at the start of this millenium. Together with δ13Cdata, this implies that carbon storage in terrestrial biomesreached a maximum in the warm, moist, early Holocene, andhas subsequently declined by 195 Gt C, probably due to agradual cooling and aridification of Holocene climate.
Historical anthropogenic change
Since the discovery of fire management, all human societieshave relied on modifications of forest landscapes with conse-quent changes in the carbon storage densities of forests(Perlin 1989). In particular, most of the European andChinese temperate forests have been progressively cleared
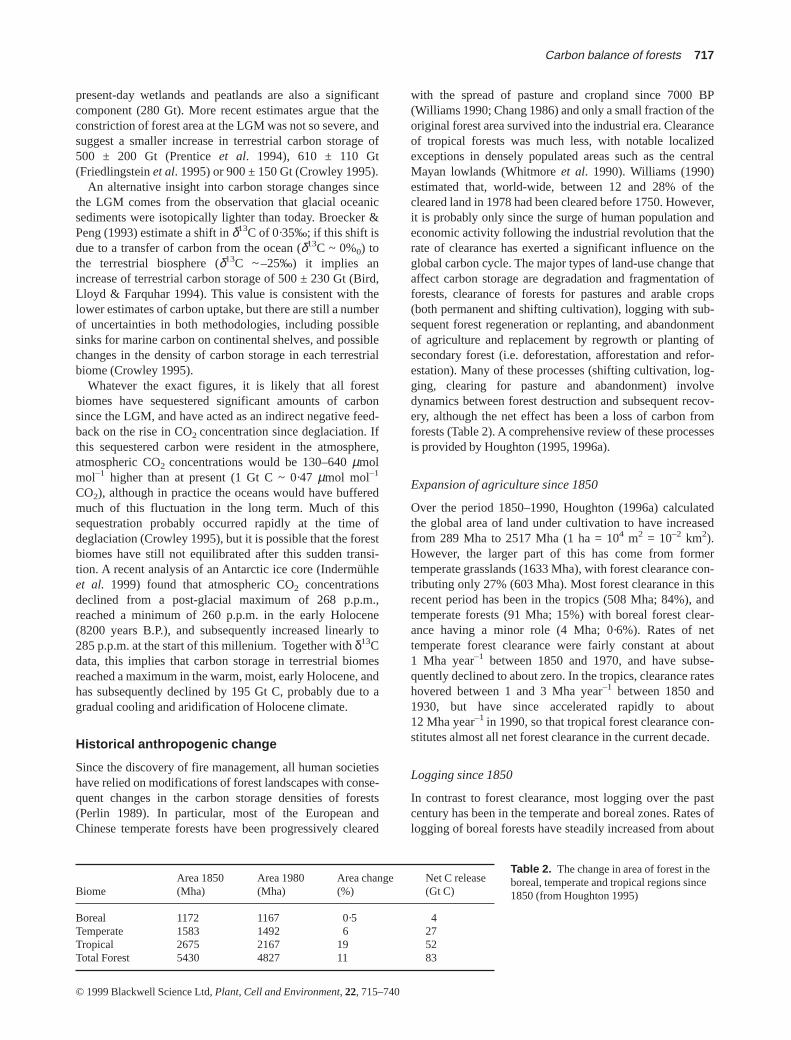
with the spread of pasture and cropland since 7000 BP(Williams 1990; Chang 1986) and only a small fraction of theoriginal forest area survived into the industrial era. Clearanceof tropical forests was much less, with notable localizedexceptions in densely populated areas such as the centralMayan lowlands (Whitmore et al. 1990). Williams (1990)estimated that, world-wide, between 12 and 28% of thecleared land in 1978 had been cleared before 1750. However,it is probably only since the surge of human population andeconomic activity following the industrial revolution that therate of clearance has exerted a significant influence on theglobal carbon cycle. The major types of land-use change thataffect carbon storage are degradation and fragmentation offorests, clearance of forests for pastures and arable crops(both permanent and shifting cultivation), logging with sub-sequent forest regeneration or replanting, and abandonmentof agriculture and replacement by regrowth or planting ofsecondary forest (i.e. deforestation, afforestation and refor-estation). Many of these processes (shifting cultivation, log-ging, clearing for pasture and abandonment) involvedynamics between forest destruction and subsequent recov-ery, although the net effect has been a loss of carbon fromforests (Table 2). A comprehensive review of these processesis provided by Houghton (1995, 1996a).
Expansion of agriculture since 1850
Over the period 1850–1990, Houghton (1996a) calculatedthe global area of land under cultivation to have increasedfrom 289 Mha to 2517 Mha (1 ha = 104 m2 = 10–2 km2).However, the larger part of this has come from formertemperate grasslands (1633 Mha), with forest clearance con-tributing only 27% (603 Mha). Most forest clearance in thisrecent period has been in the tropics (508 Mha; 84%), andtemperate forests (91 Mha; 15%) with boreal forest clear-ance having a minor role (4 Mha; 0·6%). Rates of nettemperate forest clearance were fairly constant at about1 Mha year–1 between 1850 and 1970, and have subse-quently declined to about zero. In the tropics, clearance rateshovered between 1 and 3 Mha year–1 between 1850 and1930, but have since accelerated rapidly to about12 Mha year–1 in 1990, so that tropical forest clearance con-stitutes almost all net forest clearance in the current decade.
Logging since 1850
In contrast to forest clearance, most logging over the pastcentury has been in the temperate and boreal zones. Rates oflogging of boreal forests have steadily increased from about
Carbon balance of forests 717
© 1999 Blackwell Science Ltd, Plant, Cell and Environment,22, 715–740
Area 1850 Area 1980 Area change Net C releaseBiome (Mha) (Mha) (%) (Gt C)
Boreal 1172 1167 0·5 4Temperate 1583 1492 6 27Tropical 2675 2167 19 52Total Forest 5430 4827 11 83
Table 2. The change in area of forest in theboreal, temperate and tropical regions since1850 (from Houghton 1995)
1 Mha year–1 in 1850 to 3·5 Mha year–1 in 1980, and in tem-perate forests from 3 Mha year–1 in 1850 to 6 Mha year–1 in1980 (Houghton 1996a). In contrast, logging of tropicalforests was below 0·5 Mha year–1 in 1850, was still less than2 Mha year–1 in 1950, but has since accelerated to8 Mha year–1 in 1980, overtaking temperate forest loggingonly in the mid-1970s. Overall, 1069 Mha of forest werelogged between 1850 and 1990, an area that was 77% largerthan the area of forest converted to agriculture. Once logged,however, forests are frequently left to recover and sequestercarbon; hence the overall impact of logging on CO2 emis-sions is less than that of land clearance.
Forest degradation and fragmentation
Fragmentation of remaining areas of forest is a commonside-effect of logging and clearance (Skole & Tucker 1993).In areas of forest that are close to cleared areas, there is fre-quently low level use of forest wood, and even in protectedareas there appears to be a loss of biomass subsequent tofragmentation, perhaps driven by changes in microclimate(Laurance et al. 1997, 1998). These processes are hard toassess and quantify, and so are rarely included in estimatesof carbon release by forest clearance.
The amount of carbon released through forest conversioncan be estimated by use of a land-use model which combineshistorical data of clearance and abandonment with subse-quent response curves of carbon stocks in live vegetation,soils, slash and wood products. Using such an approach,Houghton (1996a) estimated that, between 1850 and 1980, anet 83 Gt C were released by forest clearance and logging,and a further 14 Gt C by clearance of desert scrub and tem-perate grasslands. The annual net release increased from0·3 Gt C year–1 in 1850 to 1·6 Gt C year–1 in 1980–90.
According to Houghton’s estimates, the expansion ofcroplands has been responsible for the largest net carbonrelease (63 Gt C), followed by logging and regrowth offorests (23 Gt C) and conversion of forests to pasture(10 Gt C). These are net values, and thus take into accountregrowth after logging and abandonment of agriculture.
Current anthropogenic change
Over the period 1980–90, Hall & Uhlig (1991) estimated thenet effect of changes in land use to be a release of1·1 ± 0·5 Gt C year–1, whereas Houghton (1996a) calculateda net release of 1·6 ± 0·5 Gt C year–1. The differencebetween these two estimates is primarily the result of differ-ent assumptions about the mean biomass of cleared tropicalforest. The current net release is almost entirely the result ofland-use changes in the tropics, with changes in temperateand boreal forests having almost no net effect. Most of the netrelease results from clearance of tropical forests for croplands(55%) or cattle pasture (20%), with the expansion of loggingand shifting cultivation each contributing about 12%.Houghton’s estimates for individual regions are 0·6 ± 0·3,0·7 ± 0·3 and 0·3 ± 0·2 Gt C year–1 for Latin America, tropicalAsia and tropical Africa, respectively. None of these calcula-tions include the effects of degradation and fragmentation ofsuperficially intact primary forest, or take into account theimpact of illegal and unmonitored logging.
THE CARBON CYCLE OF INTACT FORESTS
As summarized above, forest clearance and degradation con-tinue to be a major source of atmospheric CO2. Less clear,however, is the extent to which intact or low disturbanceforests are currently sinks for carbon dioxide. In recent yearsconsiderable progress has been made in understanding theprocesses which determine forest carbon balance, through acombination of physiological, micrometeorological andmensurational studies. In this section we discuss the carbondynamics of various intact forest biomes, and the interactionbetween climate and the carbon cycle. All forest biomescontain a significant amount of spatial heterogeneity, but atthe same time have fundamental properties (related toclimate and plant phenotype) that are characteristic of thatbiome. Rather than attempt to describe each biome in all itscomplexity, we shall here illustrate and contrast the proper-ties of different biomes by concentrating on three intensivelystudied sites: a Canadian boreal forest (Jarvis et al. 1997;
718 Y. Malhi et al.
© 1999 Blackwell Science Ltd, Plant, Cell and Environment,22, 715–740
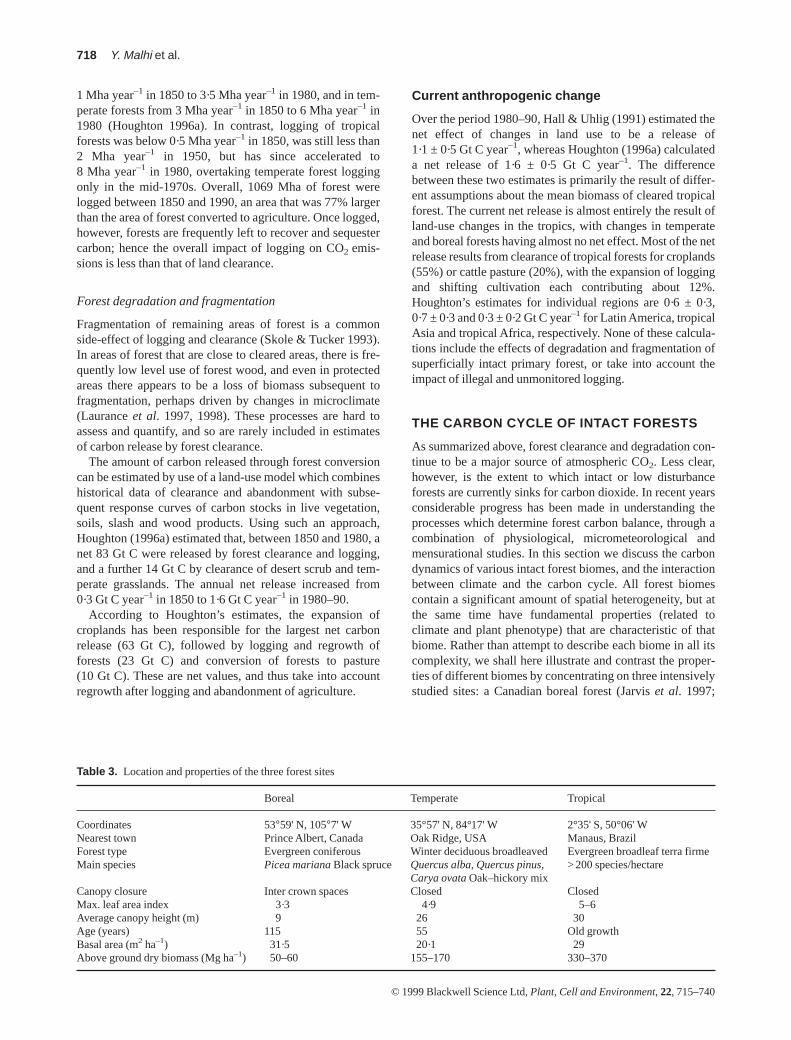
Table 3. Location and properties of the three forest sites
Boreal Temperate Tropical
Coordinates 53°59' N, 105°7' W 35°57' N, 84°17' W 2°35' S, 50°06' WNearest town Prince Albert, Canada Oak Ridge, USA Manaus, BrazilForest type Evergreen coniferous Winter deciduous broadleaved Evergreen broadleaf terra firmeMain species Picea mariana Black spruce Quercus alba, Quercus pinus, > 200 species/hectare
Carya ovataOak–hickory mixCanopy closure Inter crown spaces Closed ClosedMax. leaf area index 3·3 4·9 5–6Average canopy height (m) 9 26 30Age (years) 115 55 Old growthBasal area (m2 ha–1) 31·5 20·1 29Above ground dry biomass (Mg ha–1) 50–60 155–170 330–370
Rayment 1998; Massheder 1998; Rayment & Jarvis 1999a),a North American deciduous temperate forest (Baldocchi &Harley 1995; Harley & Baldocchi 1995; Greco & Baldocchi1996; Baldocchi 1997) and an Amazonian tropical rainforest (Higuchi et al. 1997; Malhi et al. 1998; Grace et al.1999; Malhi et al. unpublished data). Some details of thesesites are given in Table 3. These three forests have stronglycontrasting climatological and biophysical properties(described in the next section) and represent the three majorcategories of forest types. Measurements of net ecosystemexchange (NEE) using eddy covariance techniques havebeen made at the tropical and temperate sites since 1995 andwere made at the boreal forest site in 1994 and throughout1996. During these periods, additional intensive measure-ments have been made of the main component processes,particularly canopy photosynthesis, soil CO2 efflux, and treeand litter dynamics.
Characteristics of each site
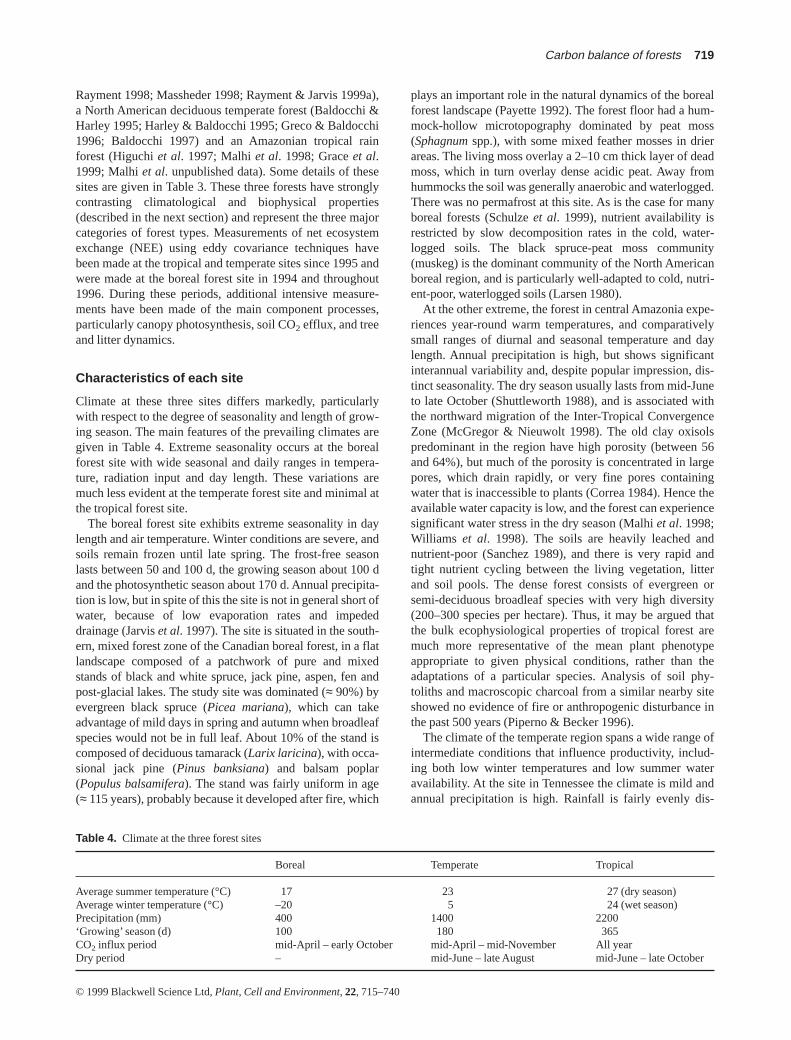
Climate at these three sites differs markedly, particularlywith respect to the degree of seasonality and length of grow-ing season. The main features of the prevailing climates aregiven in Table 4. Extreme seasonality occurs at the borealforest site with wide seasonal and daily ranges in tempera-ture, radiation input and day length. These variations aremuch less evident at the temperate forest site and minimal atthe tropical forest site.
The boreal forest site exhibits extreme seasonality in daylength and air temperature. Winter conditions are severe, andsoils remain frozen until late spring. The frost-free seasonlasts between 50 and 100 d, the growing season about 100 dand the photosynthetic season about 170 d. Annual precipita-tion is low, but in spite of this the site is not in general short ofwater, because of low evaporation rates and impededdrainage (Jarvis et al. 1997). The site is situated in the south-ern, mixed forest zone of the Canadian boreal forest, in a flatlandscape composed of a patchwork of pure and mixedstands of black and white spruce, jack pine, aspen, fen andpost-glacial lakes. The study site was dominated (≈ 90%) byevergreen black spruce (Picea mariana), which can takeadvantage of mild days in spring and autumn when broadleafspecies would not be in full leaf. About 10% of the stand iscomposed of deciduous tamarack (Larix laricina), with occa-sional jack pine (Pinus banksiana) and balsam poplar(Populus balsamifera). The stand was fairly uniform in age(≈ 115 years), probably because it developed after fire, which
plays an important role in the natural dynamics of the borealforest landscape (Payette 1992). The forest floor had a hum-mock-hollow microtopography dominated by peat moss(Sphagnumspp.), with some mixed feather mosses in drierareas. The living moss overlay a 2–10 cm thick layer of deadmoss, which in turn overlay dense acidic peat. Away fromhummocks the soil was generally anaerobic and waterlogged.There was no permafrost at this site. As is the case for manyboreal forests (Schulze et al. 1999), nutrient availability isrestricted by slow decomposition rates in the cold, water-logged soils. The black spruce-peat moss community(muskeg) is the dominant community of the North Americanboreal region, and is particularly well-adapted to cold, nutri-ent-poor, waterlogged soils (Larsen 1980).
At the other extreme, the forest in central Amazonia expe-riences year-round warm temperatures, and comparativelysmall ranges of diurnal and seasonal temperature and daylength. Annual precipitation is high, but shows significantinterannual variability and, despite popular impression, dis-tinct seasonality. The dry season usually lasts from mid-Juneto late October (Shuttleworth 1988), and is associated withthe northward migration of the Inter-Tropical ConvergenceZone (McGregor & Nieuwolt 1998). The old clay oxisolspredominant in the region have high porosity (between 56and 64%), but much of the porosity is concentrated in largepores, which drain rapidly, or very fine pores containingwater that is inaccessible to plants (Correa 1984). Hence theavailable water capacity is low, and the forest can experiencesignificant water stress in the dry season (Malhi et al. 1998;Williams et al. 1998). The soils are heavily leached andnutrient-poor (Sanchez 1989), and there is very rapid andtight nutrient cycling between the living vegetation, litterand soil pools. The dense forest consists of evergreen orsemi-deciduous broadleaf species with very high diversity(200–300 species per hectare). Thus, it may be argued thatthe bulk ecophysiological properties of tropical forest aremuch more representative of the mean plant phenotypeappropriate to given physical conditions, rather than theadaptations of a particular species. Analysis of soil phy-toliths and macroscopic charcoal from a similar nearby siteshowed no evidence of fire or anthropogenic disturbance inthe past 500 years (Piperno & Becker 1996).
The climate of the temperate region spans a wide range ofintermediate conditions that influence productivity, includ-ing both low winter temperatures and low summer wateravailability. At the site in Tennessee the climate is mild andannual precipitation is high. Rainfall is fairly evenly dis-
Carbon balance of forests 719
© 1999 Blackwell Science Ltd, Plant, Cell and Environment,22, 715–740
Table 4. Climate at the three forest sites
Boreal Temperate Tropical
Average summer temperature (°C) 17 23 27 (dry season)Average winter temperature (°C) –20 5 24 (wet season)Precipitation (mm) 400 1400 2200‘Growing’ season (d) 100 180 365CO2 influx period mid-April – early October mid-April – mid-November All yearDry period – mid-June – late August mid-June – late October
tributed through the year, but water stress is a frequentoccurrence in July and August (Greco & Baldocchi 1996).The growing season is 150–200 d and summer day length ismoderately long. The canopy is typically in full leaf by day140 (Baldocchi 1997). The stand is dominated by deciduousbroadleaf species, particularly oak (Quercus alba, Quercusprinus) and hickory (Carya ovata), with occasional maple(Acer rubrum), tulip poplar (Liriodendron tulipifera) andloblolly pine (Pinus taeda). The soil is an infertile chertysilt-loam. A feature distinguishing this site from the borealand tropical sites is that it is essentially an ‘old field succes-sion’ resulting from abandonment of agricultural land whenthe area around the Oak Ridge National Laboratory wasfenced off in 1941. The stand is still in a phase of activegrowth on previously non-forested land, and in that sense itsdynamics are not strictly comparable with the mature borealand tropical forest stands. However, it is representative ofmany temperate forests in North America and Europe, thatare regrowing following abandonment of agricultural lands(Moffat 1998).
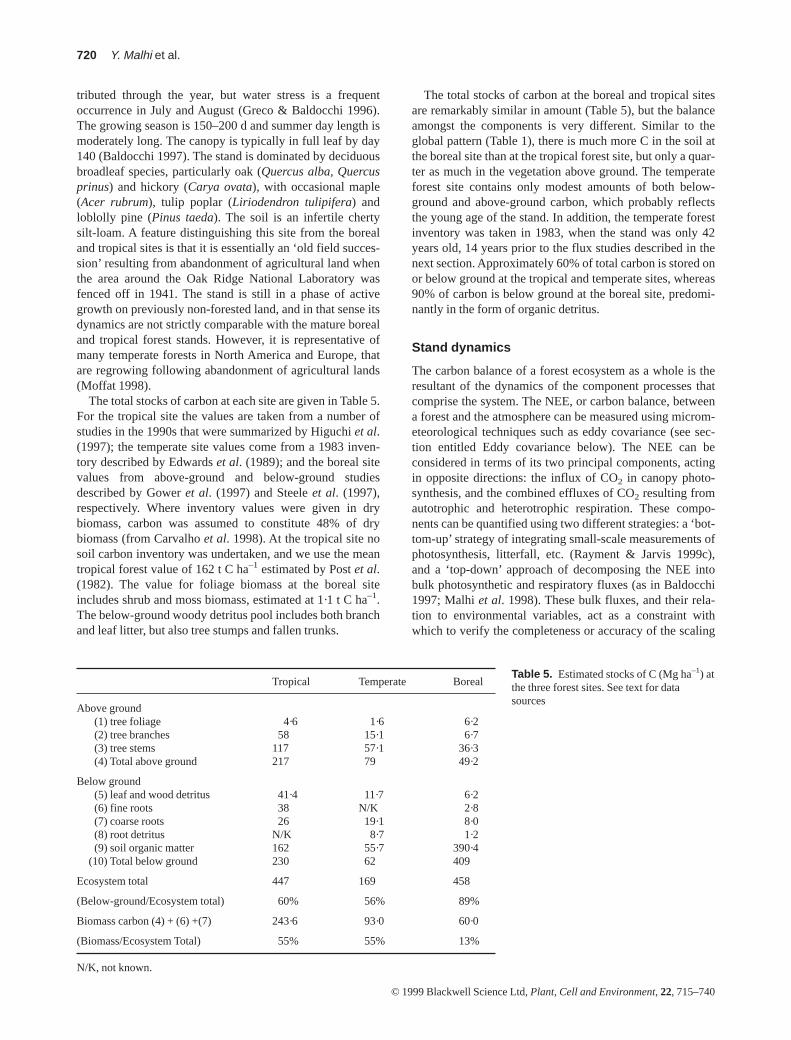
The total stocks of carbon at each site are given in Table 5.For the tropical site the values are taken from a number ofstudies in the 1990s that were summarized by Higuchi et al.(1997); the temperate site values come from a 1983 inven-tory described by Edwards et al. (1989); and the boreal sitevalues from above-ground and below-ground studiesdescribed by Gower et al. (1997) and Steele et al. (1997),respectively. Where inventory values were given in drybiomass, carbon was assumed to constitute 48% of drybiomass (from Carvalho et al. 1998). At the tropical site nosoil carbon inventory was undertaken, and we use the meantropical forest value of 162 t C ha–1 estimated by Post et al.(1982). The value for foliage biomass at the boreal siteincludes shrub and moss biomass, estimated at 1·1 t C ha–1.The below-ground woody detritus pool includes both branchand leaf litter, but also tree stumps and fallen trunks.
The total stocks of carbon at the boreal and tropical sitesare remarkably similar in amount (Table 5), but the balanceamongst the components is very different. Similar to theglobal pattern (Table 1), there is much more C in the soil atthe boreal site than at the tropical forest site, but only a quar-ter as much in the vegetation above ground. The temperateforest site contains only modest amounts of both below-ground and above-ground carbon, which probably reflectsthe young age of the stand. In addition, the temperate forestinventory was taken in 1983, when the stand was only 42years old, 14 years prior to the flux studies described in thenext section. Approximately 60% of total carbon is stored onor below ground at the tropical and temperate sites, whereas90% of carbon is below ground at the boreal site, predomi-nantly in the form of organic detritus.
Stand dynamics
The carbon balance of a forest ecosystem as a whole is theresultant of the dynamics of the component processes thatcomprise the system. The NEE, or carbon balance, betweena forest and the atmosphere can be measured using microm-eteorological techniques such as eddy covariance (see sec-tion entitled Eddy covariance below). The NEE can beconsidered in terms of its two principal components, actingin opposite directions: the influx of CO2 in canopy photo-synthesis, and the combined effluxes of CO2 resulting fromautotrophic and heterotrophic respiration. These compo-nents can be quantified using two different strategies: a ‘bot-tom-up’ strategy of integrating small-scale measurements ofphotosynthesis, litterfall, etc. (Rayment & Jarvis 1999c),and a ‘top-down’ approach of decomposing the NEE intobulk photosynthetic and respiratory fluxes (as in Baldocchi1997; Malhi et al. 1998). These bulk fluxes, and their rela-tion to environmental variables, act as a constraint withwhich to verify the completeness or accuracy of the scaling
720 Y. Malhi et al.
© 1999 Blackwell Science Ltd, Plant, Cell and Environment,22, 715–740
Tropical Temperate Boreal
Above ground(1) tree foliage 4·6 1·6 6·2(2) tree branches 58 15·1 6·7(3) tree stems 117 57·1 36·3(4) Total above ground 217 79 49·2
Below ground(5) leaf and wood detritus 41·4 11·7 6·2(6) fine roots 38 N/K 2·8(7) coarse roots 26 19·1 8·0(8) root detritus N/K 8·7 1·2(9) soil organic matter 162 55·7 390·4
(10) Total below ground 230 62 409
Ecosystem total 447 169 458
(Below-ground/Ecosystem total) 60% 56% 89%
Biomass carbon (4) + (6) +(7) 243·6 93·0 60·0
(Biomass/Ecosystem Total) 55% 55% 13%
N/K, not known.
Table 5. Estimated stocks of C (Mg ha–1) atthe three forest sites. See text for datasources
up of measurements made at smaller scales. Continuouslong-term measurements enable the main components of thecarbon balance to be integrated on an annual basis, and theinterannual variation in the carbon budget to be investigated.
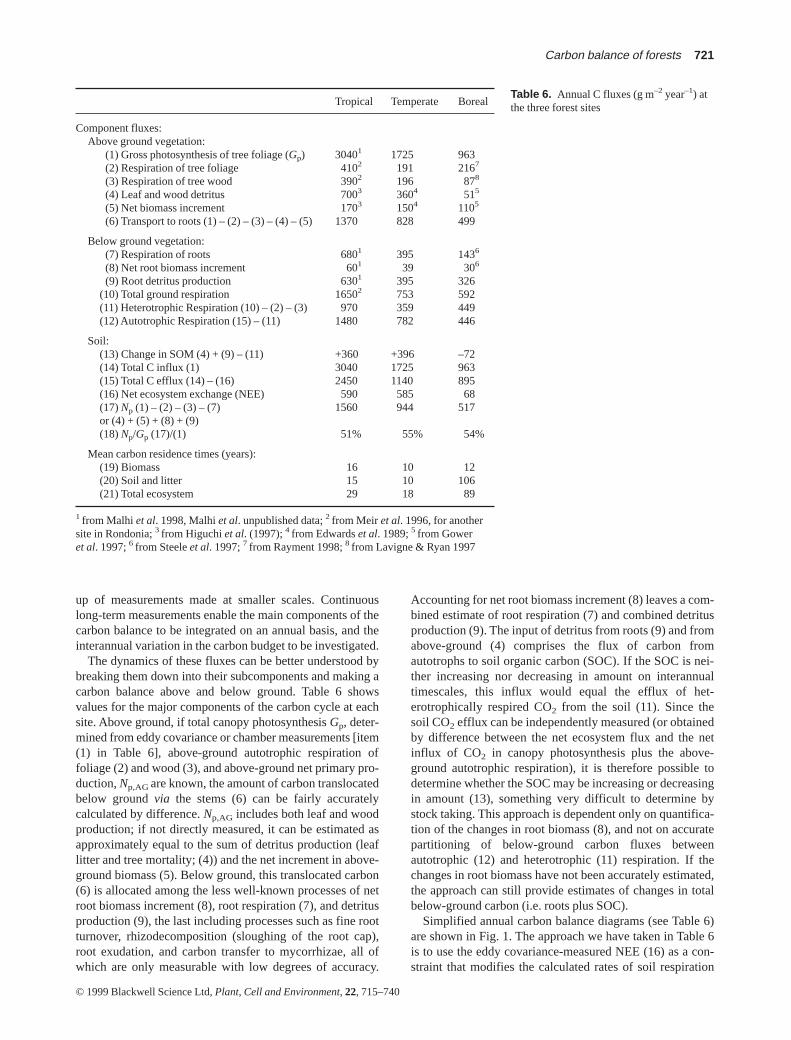
The dynamics of these fluxes can be better understood bybreaking them down into their subcomponents and making acarbon balance above and below ground. Table 6 showsvalues for the major components of the carbon cycle at eachsite. Above ground, if total canopy photosynthesis Gp, deter-mined from eddy covariance or chamber measurements [item(1) in Table 6], above-ground autotrophic respiration offoliage (2) and wood (3), and above-ground net primary pro-duction, Np,AG are known, the amount of carbon translocatedbelow ground via the stems (6) can be fairly accuratelycalculated by difference. Np,AG includes both leaf and woodproduction; if not directly measured, it can be estimated asapproximately equal to the sum of detritus production (leaflitter and tree mortality; (4)) and the net increment in above-ground biomass (5). Below ground, this translocated carbon(6) is allocated among the less well-known processes of netroot biomass increment (8), root respiration (7), and detritusproduction (9), the last including processes such as fine rootturnover, rhizodecomposition (sloughing of the root cap),root exudation, and carbon transfer to mycorrhizae, all ofwhich are only measurable with low degrees of accuracy.
Accounting for net root biomass increment (8) leaves a com-bined estimate of root respiration (7) and combined detritusproduction (9). The input of detritus from roots (9) and fromabove-ground (4) comprises the flux of carbon fromautotrophs to soil organic carbon (SOC). If the SOC is nei-ther increasing nor decreasing in amount on interannualtimescales, this influx would equal the efflux of het-erotrophically respired CO2 from the soil (11). Since thesoil CO2 efflux can be independently measured (or obtainedby difference between the net ecosystem flux and the netinflux of CO2 in canopy photosynthesis plus the above-ground autotrophic respiration), it is therefore possible todetermine whether the SOC may be increasing or decreasingin amount (13), something very difficult to determine bystock taking. This approach is dependent only on quantifica-tion of the changes in root biomass (8), and not on accuratepartitioning of below-ground carbon fluxes betweenautotrophic (12) and heterotrophic (11) respiration. If thechanges in root biomass have not been accurately estimated,the approach can still provide estimates of changes in totalbelow-ground carbon (i.e. roots plus SOC).
Simplified annual carbon balance diagrams (see Table 6)are shown in Fig. 1. The approach we have taken in Table 6is to use the eddy covariance-measured NEE (16) as a con-straint that modifies the calculated rates of soil respiration
Carbon balance of forests 721
© 1999 Blackwell Science Ltd, Plant, Cell and Environment,22, 715–740
Tropical Temperate Boreal
Component fluxes:Above ground vegetation:
(1) Gross photosynthesis of tree foliage (Gp) 30401 1725 963(2) Respiration of tree foliage 4102 191 2167
(3) Respiration of tree wood 3902 196 878
(4) Leaf and wood detritus 7003 3604 515
(5) Net biomass increment 1703 1504 1105
(6) Transport to roots (1) – (2) – (3) – (4) – (5) 1370 828 499
Below ground vegetation:(7) Respiration of roots 6801 395 1436
(8) Net root biomass increment 601 39 306
(9) Root detritus production 6301 395 326(10) Total ground respiration 16502 753 592(11) Heterotrophic Respiration (10) – (2) – (3) 970 359 449(12) Autotrophic Respiration (15) – (11) 1480 782 446
Soil:(13) Change in SOM (4) + (9) – (11) +360 +396 –72(14) Total C influx (1) 3040 1725 963(15) Total C efflux (14) – (16) 2450 1140 895(16) Net ecosystem exchange (NEE) 590 585 68(17) Np (1) – (2) – (3) – (7) 1560 944 517or (4) + (5) + (8) + (9)(18) Np/Gp (17)/(1) 51% 55% 54%
Mean carbon residence times (years):(19) Biomass 16 10 12(20) Soil and litter 15 10 106(21) Total ecosystem 29 18 89
1 from Malhi et al. 1998, Malhi et al. unpublished data; 2 from Meir et al. 1996, for anothersite in Rondonia; 3 from Higuchi et al. (1997); 4 from Edwards et al. 1989; 5 from Goweret al. 1997; 6 from Steele et al. 1997; 7 from Rayment 1998; 8 from Lavigne & Ryan 1997
Table 6. Annual C fluxes (g m–2 year–1) atthe three forest sites
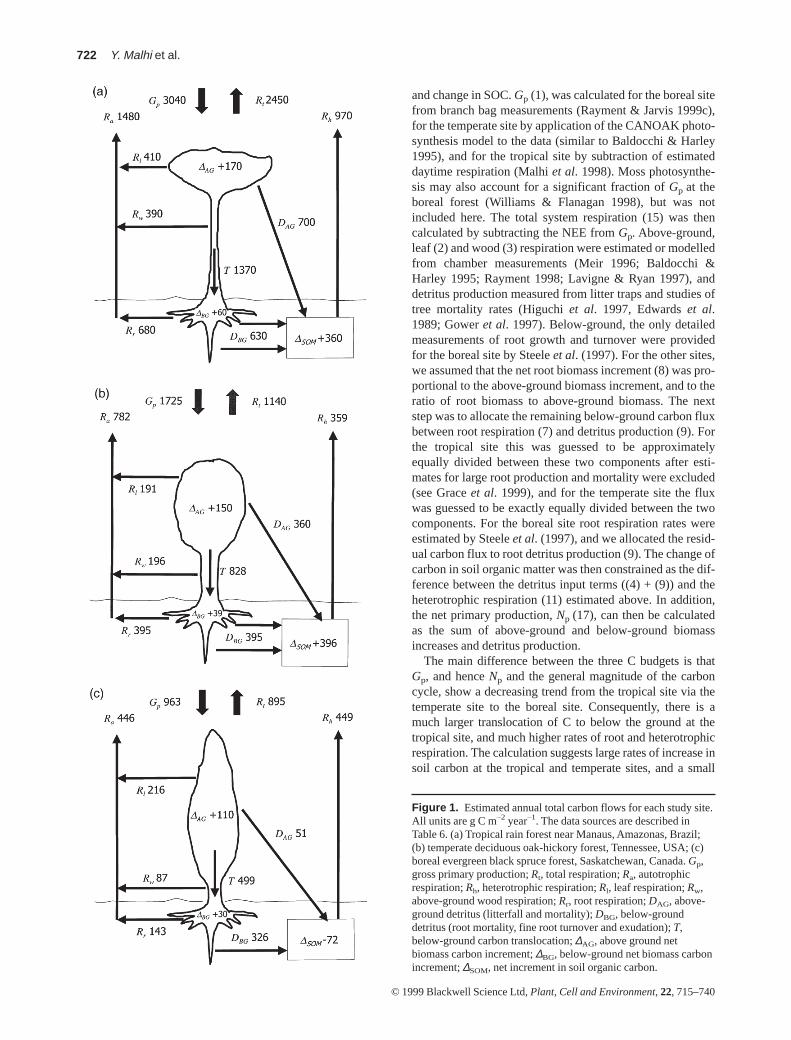
and change in SOC. Gp (1), was calculated for the boreal sitefrom branch bag measurements (Rayment & Jarvis 1999c),for the temperate site by application of the CANOAK photo-synthesis model to the data (similar to Baldocchi & Harley1995), and for the tropical site by subtraction of estimateddaytime respiration (Malhi et al. 1998). Moss photosynthe-sis may also account for a significant fraction of Gp at theboreal forest (Williams & Flanagan 1998), but was notincluded here. The total system respiration (15) was thencalculated by subtracting the NEE from Gp. Above-ground,leaf (2) and wood (3) respiration were estimated or modelledfrom chamber measurements (Meir 1996; Baldocchi &Harley 1995; Rayment 1998; Lavigne & Ryan 1997), anddetritus production measured from litter traps and studies oftree mortality rates (Higuchi et al. 1997, Edwards et al.1989; Gower et al. 1997). Below-ground, the only detailedmeasurements of root growth and turnover were providedfor the boreal site by Steele et al. (1997). For the other sites,we assumed that the net root biomass increment (8) was pro-portional to the above-ground biomass increment, and to theratio of root biomass to above-ground biomass. The nextstep was to allocate the remaining below-ground carbon fluxbetween root respiration (7) and detritus production (9). Forthe tropical site this was guessed to be approximatelyequally divided between these two components after esti-mates for large root production and mortality were excluded(see Grace et al. 1999), and for the temperate site the fluxwas guessed to be exactly equally divided between the twocomponents. For the boreal site root respiration rates wereestimated by Steele et al. (1997), and we allocated the resid-ual carbon flux to root detritus production (9). The change ofcarbon in soil organic matter was then constrained as the dif-ference between the detritus input terms ((4) + (9)) and theheterotrophic respiration (11) estimated above. In addition,the net primary production, Np (17), can then be calculatedas the sum of above-ground and below-ground biomassincreases and detritus production.
The main difference between the three C budgets is thatGp, and hence Np and the general magnitude of the carboncycle, show a decreasing trend from the tropical site via thetemperate site to the boreal site. Consequently, there is amuch larger translocation of C to below the ground at thetropical site, and much higher rates of root and heterotrophicrespiration. The calculation suggests large rates of increase insoil carbon at the tropical and temperate sites, and a small
722 Y. Malhi et al.
© 1999 Blackwell Science Ltd, Plant, Cell and Environment,22, 715–740
Figure 1. Estimated annual total carbon flows for each study site.All units are g C m–2 year–1. The data sources are described inTable 6. (a) Tropical rain forest near Manaus, Amazonas, Brazil;(b) temperate deciduous oak-hickory forest, Tennessee, USA; (c)boreal evergreen black spruce forest, Saskatchewan, Canada. Gp,gross primary production; Rt, total respiration; Ra, autotrophicrespiration; Rh, heterotrophic respiration; Rl, leaf respiration; Rw,above-ground wood respiration; Rr, root respiration; DAG, above-ground detritus (litterfall and mortality); DBG, below-grounddetritus (root mortality, fine root turnover and exudation); T,below-ground carbon translocation; ∆AG, above ground netbiomass carbon increment; ∆BG, below-ground net biomass carbonincrement; ∆SOM, net increment in soil organic carbon.
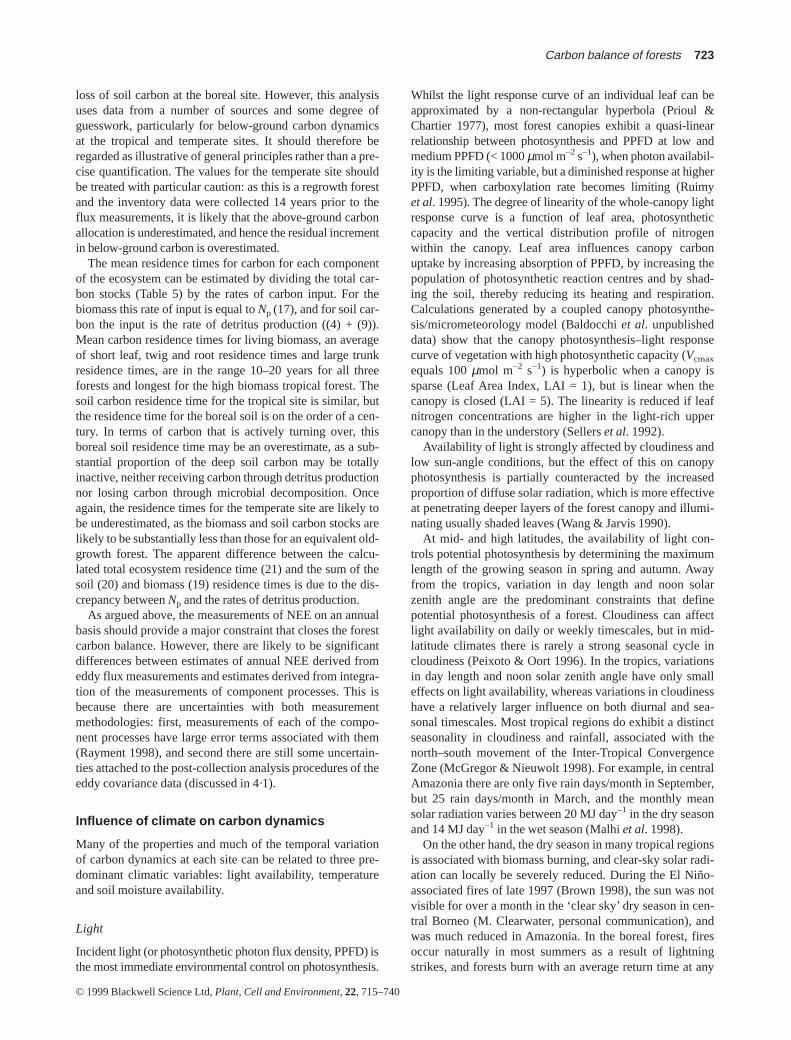
loss of soil carbon at the boreal site. However, this analysisuses data from a number of sources and some degree ofguesswork, particularly for below-ground carbon dynamicsat the tropical and temperate sites. It should therefore beregarded as illustrative of general principles rather than a pre-cise quantification. The values for the temperate site shouldbe treated with particular caution: as this is a regrowth forestand the inventory data were collected 14 years prior to theflux measurements, it is likely that the above-ground carbonallocation is underestimated, and hence the residual incrementin below-ground carbon is overestimated.
The mean residence times for carbon for each componentof the ecosystem can be estimated by dividing the total car-bon stocks (Table 5) by the rates of carbon input. For thebiomass this rate of input is equal to Np (17), and for soil car-bon the input is the rate of detritus production ((4) + (9)).Mean carbon residence times for living biomass, an averageof short leaf, twig and root residence times and large trunkresidence times, are in the range 10–20 years for all threeforests and longest for the high biomass tropical forest. Thesoil carbon residence time for the tropical site is similar, butthe residence time for the boreal soil is on the order of a cen-tury. In terms of carbon that is actively turning over, thisboreal soil residence time may be an overestimate, as a sub-stantial proportion of the deep soil carbon may be totallyinactive, neither receiving carbon through detritus productionnor losing carbon through microbial decomposition. Onceagain, the residence times for the temperate site are likely tobe underestimated, as the biomass and soil carbon stocks arelikely to be substantially less than those for an equivalent old-growth forest. The apparent difference between the calcu-lated total ecosystem residence time (21) and the sum of thesoil (20) and biomass (19) residence times is due to the dis-crepancy between Np and the rates of detritus production.
As argued above, the measurements of NEE on an annualbasis should provide a major constraint that closes the forestcarbon balance. However, there are likely to be significantdifferences between estimates of annual NEE derived fromeddy flux measurements and estimates derived from integra-tion of the measurements of component processes. This isbecause there are uncertainties with both measurementmethodologies: first, measurements of each of the compo-nent processes have large error terms associated with them(Rayment 1998), and second there are still some uncertain-ties attached to the post-collection analysis procedures of theeddy covariance data (discussed in 4·1).
Influence of climate on carbon dynamics
Many of the properties and much of the temporal variationof carbon dynamics at each site can be related to three pre-dominant climatic variables: light availability, temperatureand soil moisture availability.
Light
Incident light (or photosynthetic photon flux density, PPFD) isthe most immediate environmental control on photosynthesis.
Whilst the light response curve of an individual leaf can beapproximated by a non-rectangular hyperbola (Prioul &Chartier 1977), most forest canopies exhibit a quasi-linearrelationship between photosynthesis and PPFD at low andmedium PPFD (< 1000µmol m–2s–1), when photon availabil-ity is the limiting variable, but a diminished response at higherPPFD, when carboxylation rate becomes limiting (Ruimyet al. 1995). The degree of linearity of the whole-canopy lightresponse curve is a function of leaf area, photosyntheticcapacity and the vertical distribution profile of nitrogenwithin the canopy. Leaf area influences canopy carbonuptake by increasing absorption of PPFD, by increasing thepopulation of photosynthetic reaction centres and by shad-ing the soil, thereby reducing its heating and respiration.Calculations generated by a coupled canopy photosynthe-sis/micrometeorology model (Baldocchi et al. unpublisheddata) show that the canopy photosynthesis–light responsecurve of vegetation with high photosynthetic capacity (Vcmax
equals 100µmol m–2 s–1) is hyperbolic when a canopy issparse (Leaf Area Index, LAI = 1), but is linear when thecanopy is closed (LAI = 5). The linearity is reduced if leafnitrogen concentrations are higher in the light-rich uppercanopy than in the understory (Sellers et al. 1992).
Availability of light is strongly affected by cloudiness andlow sun-angle conditions, but the effect of this on canopyphotosynthesis is partially counteracted by the increasedproportion of diffuse solar radiation, which is more effectiveat penetrating deeper layers of the forest canopy and illumi-nating usually shaded leaves (Wang & Jarvis 1990).
At mid- and high latitudes, the availability of light con-trols potential photosynthesis by determining the maximumlength of the growing season in spring and autumn. Awayfrom the tropics, variation in day length and noon solarzenith angle are the predominant constraints that definepotential photosynthesis of a forest. Cloudiness can affectlight availability on daily or weekly timescales, but in mid-latitude climates there is rarely a strong seasonal cycle incloudiness (Peixoto & Oort 1996). In the tropics, variationsin day length and noon solar zenith angle have only smalleffects on light availability, whereas variations in cloudinesshave a relatively larger influence on both diurnal and sea-sonal timescales. Most tropical regions do exhibit a distinctseasonality in cloudiness and rainfall, associated with thenorth–south movement of the Inter-Tropical ConvergenceZone (McGregor & Nieuwolt 1998). For example, in centralAmazonia there are only five rain days/month in September,but 25 rain days/month in March, and the monthly meansolar radiation varies between 20 MJ day–1 in the dry seasonand 14 MJ day–1 in the wet season (Malhi et al. 1998).
On the other hand, the dry season in many tropical regionsis associated with biomass burning, and clear-sky solar radi-ation can locally be severely reduced. During the El Niño-associated fires of late 1997 (Brown 1998), the sun was notvisible for over a month in the ‘clear sky’ dry season in cen-tral Borneo (M. Clearwater, personal communication), andwas much reduced in Amazonia. In the boreal forest, firesoccur naturally in most summers as a result of lightningstrikes, and forests burn with an average return time at any
Carbon balance of forests 723
© 1999 Blackwell Science Ltd, Plant, Cell and Environment,22, 715–740
one site of between 100 and 150 years (Payette 1992). High-level smoke travels long distances in the deep convectiveboundary layers that develop over the boreal forests and alsointermittently reduces photosynthesis substantially.
Temperature
At the extremely low temperatures that occur in winter in theboreal region, chloroplast organization breaks down andPhotosystem 2 becomes inactivated (Strand & Öquist 1985;Öquist & Strand 1986) and may take eight or more weeksduring the spring to recover fully (Strand & Lundmark 1995,Bergh & Linder 1999). Through the growing season, leaftemperature also has an effect on maximum rates of photo-synthesis by affecting Rubisco specificity for CO2 and O2
(Long & Drake 1991), and in particular by enhancing pho-torespiration at high temperatures (Long 1991; Lloyd et al.1995) with the result that photosynthesis in trees (almost allC3 plants) has a well-defined, broad optimal temperature(Neilson, Ludlow & Jarvis 1972). An indirect, but probablymore important, influence of temperature is that high leaftemperatures also result in large atmospheric water vapoursaturation deficits and evaporation rates, so that carbonuptake is limited by stomatal closure (Sandford & Jarvis1986). However, the major influence of temperature on netcarbon balance is through its effects on rates of bothautotrophic and heterotrophic respiration. Arrhenius-typemodels (Lloyd & Taylor 1994) provide an appropriatedescription of this relationship, although in practice a sim-pler exponential relationship, with a global mean Q10 tem-perature coefficient of approximately 2·4, will usuallysuffice (Raich & Schlesinger 1992). Thus the respiration ratemore than doubles for a 10° C rise in temperature.
In middle and high latitudes, an additional effect of tem-perature on photosynthesis is its potential to inflict frostdamage on buds and leaves. As the annual cycle of air tem-perature lags some weeks behind that of insolation, the maineffect is to constrict the length of the photosynthetic seasonin the spring, when frosts can curtail daytime photosynthesisbelow expectation (Beadle et al. 1985). Photo-inhibition ofphotosynthesis occurs when temperature is low (< 5 °C) andirradiance high (Strand & Öquist 1985).
Temperature is thus a major determinant on seasonal pro-cesses which regulate both carbon gain and carbon loss intemperate and boreal forests. In the tropics, seasonality intemperature is generally minimal; for the central Amazonianforest, for example, the annual range in monthly mean tem-perature is 2 to 4 °C (Malhi et al. 1998). On interannualtimescales, however, temperature may influence the carbonbalance of all biomes.
Soil moisture
In high latitudes the start of the photosynthetically activeseason is determined by the availability of soil moisture.Frozen soil prevents water uptake by roots so that leaf tur-gor and stomatal opening are dependent on the limited sup-ply of stored water within the trees (Whitehead & Jarvis
1981). As air temperature rises and the snow cover beginsto thaw, melt water at close to 0 °C percolates downthrough the soil, replacing the ice and enabling wateruptake. In high and mid-latitudes, soil moisture reservesare largely replenished by autumn and winter precipitation(Waring & Running 1978), so lack of soil moisture has lit-tle impact on spring growth, but may restrict photosynthe-sis and growth in the late summer. During the growingseason soil moisture availability is a function of precipita-tion, runoff and evapotranspiration rates, and the moistureretention properties of the soil. Soil moisture thereforeshows more small-scale spatial variability within a forestecosystem than PPFD or temperature. Lack of soil moistureprimarily reduces carbon uptake by inducing stomatal clo-sure, but may also affect carbon (and nutrient) release byrestricting microbial decomposition. In the tropics, soil-mois-ture stress may become significant in the dry season, becauseof high evapotranspiration rates and the low available watercapacity in many old, highly eroded tropical clay soils(Hodnett et al. 1995). Together with PPFD, the availability ofsoil moisture is probably the most significant environmentalvariable in the tropics.
Seasonal cycles of carbon uptake and loss
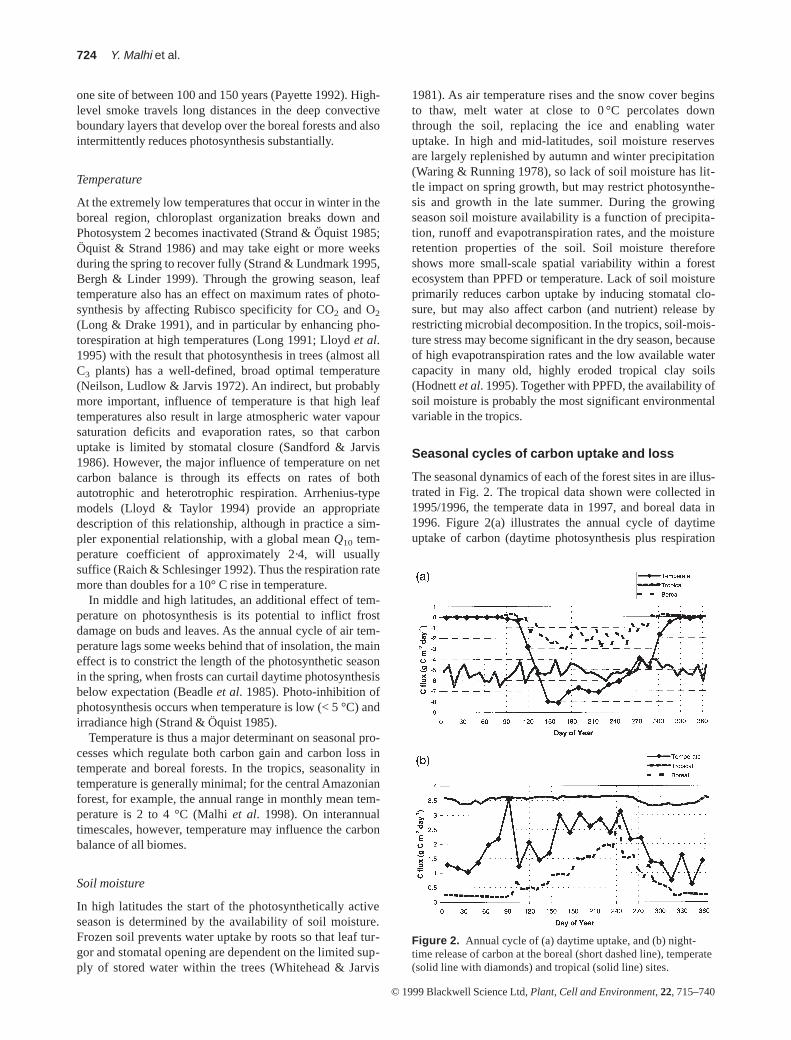
The seasonal dynamics of each of the forest sites in are illus-trated in Fig. 2. The tropical data shown were collected in1995/1996, the temperate data in 1997, and boreal data in1996. Figure 2(a) illustrates the annual cycle of daytimeuptake of carbon (daytime photosynthesis plus respiration
724 Y. Malhi et al.
© 1999 Blackwell Science Ltd, Plant, Cell and Environment,22, 715–740
Figure 2. Annual cycle of (a) daytime uptake, and (b) night-time release of carbon at the boreal (short dashed line), temperate(solid line with diamonds) and tropical (solid line) sites.
loss) and Fig. 2(b) shows the night-time release of carbon ateach site. It should be emphasized that the three data setshave not been analysed in an identical manner, primarilybecause of uncertainties in the best method of interpretingnight-time eddy covariance measurements. These uncertain-ties are discussed later in the section entitled Eddy covari-ance, but for completeness we describe the correctionprocedures applied to each data set here. In the boreal site, acorrection factor for night-time respiration is included onlow wind-speed nights, as described by Jarvis et al. (1997).Measurements were not made throughout the entire winter,and the low winter efflux has been estimated by linear inter-polation between measurements made at the start and end ofwinter, when temperatures were –15 °C to –30 °C. At thetemperate site, the night-time flux has been adjusted byusing an advection correction of the type proposed by Lee(1998). At the tropical site, no night-time correction hasbeen applied, but large gaps in the data have been interpo-lated using a semi-empirical light, temperature and watervapour pressure deficit (VPD) response model (Malhi et al.1998). In addition, the tropical data set actually runs fromSeptember 1995 to August 1996, but here has been presentedas a continuous annual cycle from January to December forthe purposes of comparison.
Daytime uptake
The tropical forest site showed the least seasonality in bothdaytime uptake (mean value 5·2 g C m–2 d–1) and night-timerelease (mean value 3·5 g C m–2 d–1), although there was sig-nificant seasonality in canopy photosynthetic capacity: Malhiet al. (1998) showed that peak photosynthetic rates declinemarkedly in the dry season, and a modelling analysis byWilliams et al. (1998) concluded that this was most likelybecause of shortage of soil moisture causing large reductionsin soil hydraulic conductivity. However, this reduction incapacity is partially compensated for by increased sunshine-hours in the dry season. Overall, water availability slightlyoutweighs cloudiness as a controlling variable, and the tropi-cal daytime uptake rates shown in Fig. 2 are higher in the wetseason (mean 6 g C m–2 d–1) than in the dry season (mean4 g C m–2 d–1). On the other hand, the balance between thesetwo variables may be different in other tropical regions, suchas western Amazonia, where the dry season is less pro-nounced and overcast days more frequent. On any individualday, carbon uptake at the tropical site can vary between1 g C m–2d–1on very overcast days to 9 g C m–2d–1on sunnydays in the wet season. In the dry season most days are sunnyand the day-to-day variation is much reduced. Cold periodsof low temperature and PPFD, associated with fronts of coldair originating in high southern latitudes (Marengo, Nobre &Culf 1997), suppress both net CO2 efflux at night and netinflux during the daytime (Grace et al. 1996).
Seasonality in both carbon uptake and release is much moreevident in boreal and temperate forests (Fig. 2). The predomi-nant latitudinal constraint on daily carbon uptake is daylength, but the start of the growing season is also constrainedby air and soil temperatures. In the temperate deciduous
forest, the ‘growing season’ is determined by the emergenceof leaves in the spring and the subsequent development of thefoliar canopy. In 1997, leaf growth started at the beginning ofApril (day 90) and rapidly reached a ceiling value around day140 (Greco & Baldocchi 1996). During winter there is a smallbut significant loss of carbon, but, as the canopy develops,photosynthesis surges rapidly, peaking in mid-June at about12 g C m–2 d–1 (approximately 1·5 times the rate of the tropi-cal rain forest), after which the rates remain fairly constantuntil mid-September, before declining as the days shorten.The leaves begin to senesce after approximately 180 d.
In the boreal evergreen, black spruce forest, the lengthof the active season is strongly influenced by the length ofthe frost-free period. The growing season begins and endswith abrupt temperature transitions. As the thaw begins inthe spring and snow starts to melt, the temperature risesrapidly towards zero and as it passes through about–1·5 °C (in mid-April in 1996), CO2 exchange switchesfrom carbon loss to carbon gain (Massheder 1998). Whenthe thaw occurs late, substantial amounts of solar radiationare effectively wasted and the annual carbon gain is corre-spondingly small. Carbon uptake rises to a peak of3 g C m–2 d–1 in late June, and then fluctuates at around2 g C m–2 d–1 until mid-September. Both uptake and lossrates are much smaller at all times in the boreal blackspruce forest.
Night-time CO2 efflux
For these forests, soil respiration rates are primarily deter-mined by temperature, and to a lesser extent by soil watercontent and the quantity and quality of the soil organic mat-ter. In tropical forests, more than 70% of respiratory CO2
originates from autotrophic and heterotrophic processeswithin the soil biomass (Meir et al. 1996). At theAmazonian site, soil temperature is the main cause of diur-nal variability of soil respiration, both through its meandiurnal cycle (23·0–24·5 °C at 5 cm depth; Malhi et al.1998) and sudden drops in temperature (typically 2 °C)associated with rainfall. Seasonally, soil temperature ishigher in the dry season (daily mean 26 °C) than in the wetseason (24 °C), but soil moisture is much reduced. Therewas little evidence of measurable seasonality in respirationrates in the eddy covariance data shown here, but the latedry season was not directly studied. Soil chamber measure-ments by Sotta (1998) at the same site in 1997 suggest thatrespiration rates decline as the soil dries down. Litter fallrates are highest in the dry season, but much of the litteraccumulates until the start of the rainy season(November/December), when a flush of decompositionwould be expected. Thus, as with photosynthesis, a balanceof opposing factors (litter pool size and soil temperature onone side, soil moisture on the other) acts to lessen the sea-sonal variability in tropical soil respiration.
Night-time carbon efflux rates in the temperate oak-hickory and boreal spruce forest sites follow the seasonalchanges in soil temperature. At the oak-hickory site in1997, rates rose from a constant 1 g C m–2 d–1 to a steady
Carbon balance of forests 725
© 1999 Blackwell Science Ltd, Plant, Cell and Environment,22, 715–740
4 g C m–2 d–1 in the June–August period (slightly higherthan the tropical rain forest), as the average daily soil tem-perature rose to approximately 22 °C, before falling awayagain in September. In a study of soil respiration in thisregion, Hanson et al. (1993) found that, although soil tem-perature explained most of the seasonal pattern, soil mois-ture availability and root metabolic activity (linked to grossproductivity) were also significant factors.
At the boreal site in winter-time there is a small but persis-tent efflux of about 0·2 g C m–2 d–1, when insulation by per-manent snow cover maintains surface soil temperature atclose to zero, whereas air temperatures are –15 to –35 °C(Rayment & Jarvis 1999b). During the spring thaw, CO2
exchange rates rise rapidly from this winter-time value; res-piration initially picks up more rapidly than photosynthesis,resulting in a brief peak of carbon loss from the system.Respiration rates increase steadily as the summer pro-gresses, reaching 2 g C m–2 d–1 by August, before droppingaway again through September and October to the winterbasal rate as the soil becomes frozen again. The high watertable close to the soil surface and low soil temperaturesrestrict soil CO2 efflux from April through to August, whenthe water table lowers and temperatures rise (Rayment &Jarvis 1999b). Point-to-point variation in soil CO2 efflux islarge. Chamber measurements (Rayment & Jarvis 1997)have shown that this local heterogeneity is related to thedepth of accumulated soil organic matter (Rayment & Jarvis1999b) which may reach 0.5 m or more in boreal forests.
To conclude, the broad photosynthetic responses of tem-perate and tropical broadleaf forests to light and temperatureare very similar. The differences between tropical and tem-perate deciduous forests in the annual course of CO2 fluxesare driven by the seasonality of day length, timing of budburst and senescence, variation in cloud cover, and soilmoisture availability. The light sensitivity of the borealspruce forest seems less pronounced than that of thebroadleaf forests (but is consistent with that measured atother coniferous forests, e.g. Ruimy et al. 1995). The totalcanopy leaf nitrogen is probably the major factor limiting
boreal canopy photosynthetic activity: boreal forests aregenerally chronically N-deficient (Linder 1995; Schulzeet al. 1999), as much of the organic nitrogen is held in thecool and often waterlogged soil, and therefore only slowlyreleased by decomposition processes.
Diurnal cycles
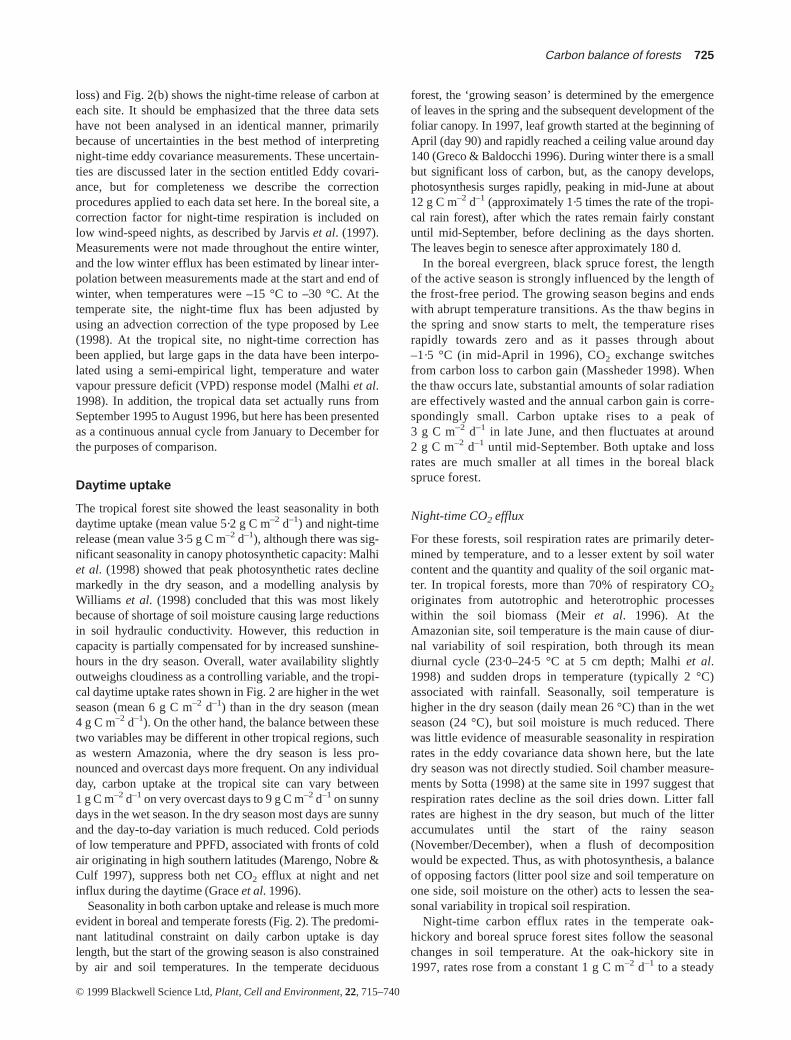
Figure 3 illustrates the mean diurnal CO2 cycle at each siteduring a high productivity part of the year (June for theboreal and temperate sites, November/December for thetropical site). The similarity of both photosynthetic and res-piration rates per unit ground area of the tropical and temper-ate forest sites is remarkable: both sites have similar LAI(Table 3) and show peak uptake rates of 18 to20 µmol m–2 s–1 just before noon, and mean night-time res-piration rates of 5 to 7µmol m–2 s–1. However, the longerday length in the temperate zone (15 h against 12 h) resultsin higher overall daily uptake rates in the oak-hickory forest.In the boreal forest, where LAI is much smaller, both uptakeand respiration rates are less than half those of the two otherforests, and the daily totals are much less, despite a daylength of 20 h.
Interannual variability
The data shown in Fig. 2 were all collected in 1996 or 1997and thus present a snapshot of the bulk physiology of threeforests. In recent years, however, long-term eddy covariancestudies have shown that there can be considerable interannualvariability in carbon dynamics (Goulden et al. 1996a). Thisvariability is primarily driven by variations in the controllingclimatic variables outlined above, but is also modulated bythe response and recovery times of each forest biome.
As discussed above, the primary meteorological determi-nants of the carbon balance of intact stands are: (1) thelength of the growing season determined by the radiationinputs and modified by soil and air temperatures in springand autumn; (2) the length of the period of snow cover; (3)the amount of cloud cover in the growing season; and (4) theoccurrence of drought in the late summer or dry season.Cloudiness and drought can directly limit photosyntheticuptake in the growing season, whereas the cold period con-trols the overall length of the growing season through itsimpact on phenology. Snow cover can be important in insu-lating the soil surface from extremely low temperatures, thuspermitting a moderate amount of soil respiration throughoutthe winter (Goulden et al. 1996a; Rayment & Jarvis 1999b).At the temperate deciduous Harvard Forest, inMassachusetts, Goulden et al. (1996a) found NEE to varybetween –2·8 and –1·4 t C ha–1 year–1 over the five years1990–95, and concluded that interannual climate variationsmay modify terrestrial CO2 exchange in the northern hemi-sphere by about 1 Gt C year–1. Measurements and calcula-tions indicate that an advance of 2 weeks in the start of thegrowing season at the temperate forest site would lead to achange in NEE of 1 t C ha–1 year–1 (Baldocchi, unpub-lished). In a sensitivity analysis of NEE of an old-growth
726 Y. Malhi et al.
© 1999 Blackwell Science Ltd, Plant, Cell and Environment,22, 715–740
Figure 3. Average diurnal cycle of net CO2 fluxes (eddycovariance flux plus within-canopy accumulation) at the three sitesat a time of high productivity: June for boreal (short-dashed line)and temperate sites (solid line with diamonds),November/December for the tropical site (solid line).
Scots pine/Norway spruce forest in central Sweden,Lindroth et al. (1998) suggested that annual respirationwould increase by 10% (74 g C m–2) for a 1 °C rise in tem-perature. Photosynthesis would need to increase by 12% tocompensate for this increased respiration; and thus the neteffect is for larger carbon loss in warm years. In contrast,model sensitivity calculations for a 35-year-old borealNorway spruce forest in northern Sweden (Bergh 1998;Bergh, McMurtrie & Linder 1998) suggest that a 2 °C rise intemperature would increase the length of the photosyntheticseason by 3 weeks, and lead to an increase in annual Np of 17to 18%. Using the model of Lloyd et al. (1995), Grace et al.(1995b) found respiration of the tropical forest to increaseby 144 g C m–2 per degree rise in temperature.
One of the primary drivers of global interannual climatevariability is the El Niño Southern Oscillation, the quasi-periodic redistribution of equatorial surface waters in thePacific Ocean (Allan, Lindesey & Parker 1996). In thetropics, El Niño is strongly associated with enhanced dryseasons in both eastern Amazonia and Indonesia andenhanced rainfall in western South America (Ropelewski &Halpert 1987). The overall influence is probably one ofincreased carbon loss, either through water stress causingreduced photosynthesis and increased tree mortality, ormore dramatically through drought-induced fires, asevidenced in Indonesia and Amazonia in the intense1997–98 El Niño (Brown 1998; Barbosa 1998). The impactof reduced water availability should also be counteracted byenhanced numbers of hours of sunshine in these regions; forexample Clark & Clark (1994) observed that tree growthwas higher in sunny dry years at a tropical forest site inCosta Rica. In many regions this effect is likely to be con-founded, however, by smoke emitted from forest fires, withan extreme example being the great smoke haze thatenveloped south-east Asia in late 1997 (Nichol 1998).
In mid- and high latitudes in the Americas the correlationis weaker, but El Niño is associated with mild, wet winters,with a reduced period of snow cover (Brown & Goodison1996; Cayan 1996). The overall effect is likely to be one ofenhanced carbon uptake because the mild winter induces alengthened growing season (Goulden et al. 1996a).Additionally, in drought-prone areas, the enhanced winterprecipitation may fully recharge soil water reserves andreduce the likelihood of a late summer drought. The impactof El Niño on temperate and boreal Eurasia is less evident.
Braswell et al. (1997) examined the correlation betweeninterannual variations in lower tropospheric mean tempera-ture and satellite-derived vegetation indices (normalized dif-ference vegetation index, NDVI) for a number of biomes. Inhigh latitude forests, warm years were correlated with highNDVI in the same years, suggesting increased productivity,but with a reduction in NDVI 1 to 2 years later. In C3-domi-nated tropical and arid areas the opposite pattern wasobserved, with reduced NDVI in warm years, probably asso-ciated with increased water stress, but increased NDVI 1 to 2years later. C4 savannas and grasslands showed a similar pat-tern to high latitude forests. Braswell et al. suggested that theobserved 1–2 years lag in NDVI was associated with the
response time of soil microbial activity: warm (cool) yearsare associated with increased (reduced) biomass inputs tothe soil at high (low) latitudes, which lead to increased(reduced) microbial competition for nutrients, and thereby toreduced (increased) plant growth in subsequent years.Globally they found that temperature anomalies were asso-ciated with lagged maxima in NDVI and lagged minima inthe rate of increase of atmospheric CO2 concentration, witha lag time of 1·5–2 years. The observed anticorrelation withrate of CO2 increase suggests that, globally, the response oftropical productivity and/or high latitude soil respiration ismore significant than the response of high latitude produc-tivity or low latitude respiration. Possibly correlationsbetween temperature and atmosphere–ocean CO2 fluxesmust also be considered, however.
While the description of climatic controls outlined abovedescribes the impact of climatic variability on intact foreststands, catastrophic events (such as drought, flood, fire andwind-throw) may have a spatially variable impact, but astrong influence on the overall carbon balance of the biomeat regional scale. For example, drought may reduce forestphotosynthesis and increase tree mortality, shifting the car-bon balance towards a net source, but a more significantfactor may be associated fires that turn patches of the forestinto strong, albeit temporary, carbon sources. Wind-throwmay create similar patches. Since such events are not infre-quent, the interannual variability of the spatially integratednet biome production (NBP; Schulze et al. 1999) is likelyto be different to the variability of NEE of a particularstand. The influence of spatial heterogeneity on the rela-tionship between NEE and NBP is discussed further below.
MEASURING THE CURRENT CARBONBALANCE OF FORESTS
In recent years there has been an accumulating body of evi-dence for a net sink of carbon in the terrestrial biosphere. Inthis section, we discuss the evidence for such a sink in themajor forest biomes. The three principal approaches to esti-mating the carbon balance of forest biomes are micrometeoro-logical measurements of surface fluxes, biomass inventoriesand the inversion of atmospheric gas concentrations. All threeapproaches still have methodological problems, but are point-ing towards a combined net terrestrial carbon sink (excludingdeforestation) of 1 to 3 Gt C year–1. However, the exact parti-tioning of carbon sequestration amongst the tropical, temper-ate and boreal forest biomes remains unclear.
Eddy covariance
This micrometeorological technique relies on directly mea-suring the turbulent transport of CO2 above a forest canopy(Moncrieff, Jarvis & Valentini 1999). In principle, the netcarbon balance of a site can be directly measured by inte-grating eddy covariance measurements of CO2 fluxes overthe diurnal, seasonal and annual cycles. The technologicalcombination of sonic anemometers and fast response CO2
analysers matured in the late 1980s, and field measurements
Carbon balance of forests 727
© 1999 Blackwell Science Ltd, Plant, Cell and Environment,22, 715–740
have subsequently been made in a range of biomes, includ-ing temperate, boreal and tropical forests. There has been anevolution from initial short-term, localized field studies, tolong-term multiple site campaigns, such as, BOREAS in theCanadian boreal forest (Sellers et al. 1997), investigatinglarger spatial and temporal scales, to long-term monitoringnetworks spanning whole continents (e.g. Euroflux inEurope (Aubinet et al. 1999), Ameriflux in North America).The range of measurements required at long-term monitoringsites is described by Baldocchi et al. (1996).
Although eddy covariance has already been demonstratedto provide reliable estimates of the bulk photosynthesis andrespiration of a forest site (Baldocchi 1997; Jarvis et al.1997; Malhi et al. 1998), there is still lingering uncertaintyas to whether it can yet provide accurate measurements ofthe net carbon balance. The net balance is the relativelysmall net sum of opposite daytime and night-time fluxes,and a small error in measurements in one of these periodscould lead to miscalculation of the net carbon balance, eventhough the bulk photosynthesis and respiration may lookplausible (Moncrieff, Malhi & Leuning 1996).
Much of the uncertainty has focused on the night-timefluxes, an area that was ignored in much of traditionalmicrometeorology because of its irrelevance to energy andwater budgets. On calm nights, respired CO2 tends to accu-mulate within the forest canopy, and is transferred to theatmosphere through intermittent events. Several studies(Goulden et al. 1996b; Jarvis et al. 1997) have demonstratedthat respiration rates estimated as the sum of the eddy fluxand the accumulation of CO2 within the forest canopy oncalm nights are not consistent with the estimates from eddycovariance in windy conditions. This discrepancy has led tothe suggestion that eddy covariance is ‘missing’ some of thenocturnal CO2 flux (Goulden et al. 1996b). The phenomenonappears less pronounced, but still apparent, in tropical forests(Grace et al. 1996; Malhi et al. 1998). Possible physicalmechanisms suggested to account for this missing flux focuson lateral advection of the respired CO2 within the forestcanopy, either down hillslopes or away from ‘cool spots’ ofsubsiding air (Goulden et al. 1996b). However, if this werethe case the phenomenon would be apparent only at sites atlocal topographic peaks, whereas in fact it appears at themajority of sites independent of local topography (A. Grelle,personal communication) Alternatively, the problem may bemethodological, if the detrending and coordinate rotationschemes currently used in the analysis of eddy covariancedata are not appropriate for the intermittent turbulence that isa characteristic feature of stable atmospheric conditions atnight. Conversely, there are still arguments that there is noproblem with the eddy covariance measurements, but that theproblem lies with the respired CO2 residing very close to, orremaining within, the soil surface and thus not being ade-quately captured by within-canopy measurements of CO2
accumulation (Malhi et al. 1998). Yet another possibility isthat there is a genuine reduction in soil CO2 efflux in non-tur-bulent conditions because of reduced pressure pumping of airout of soil pore spaces (T.A. Black, personal communica-tion). A very promising recent contribution to the debate has
been made by Lee (1998), who argues that net vertical advec-tion of CO2 because of horizontal flow convergence anddivergence has previously been neglected. Inclusion of thisterm (most significant at night) makes a significant impact onthe calculated net carbon balance and reduces the depen-dence of measured nocturnal respiration on wind speed(Baldocchi et al. 1999). However, some theoretical disagree-ments with Lee’s treatment have been voiced (Finnigan1999) and it remains to be seen whether this problem issolved.
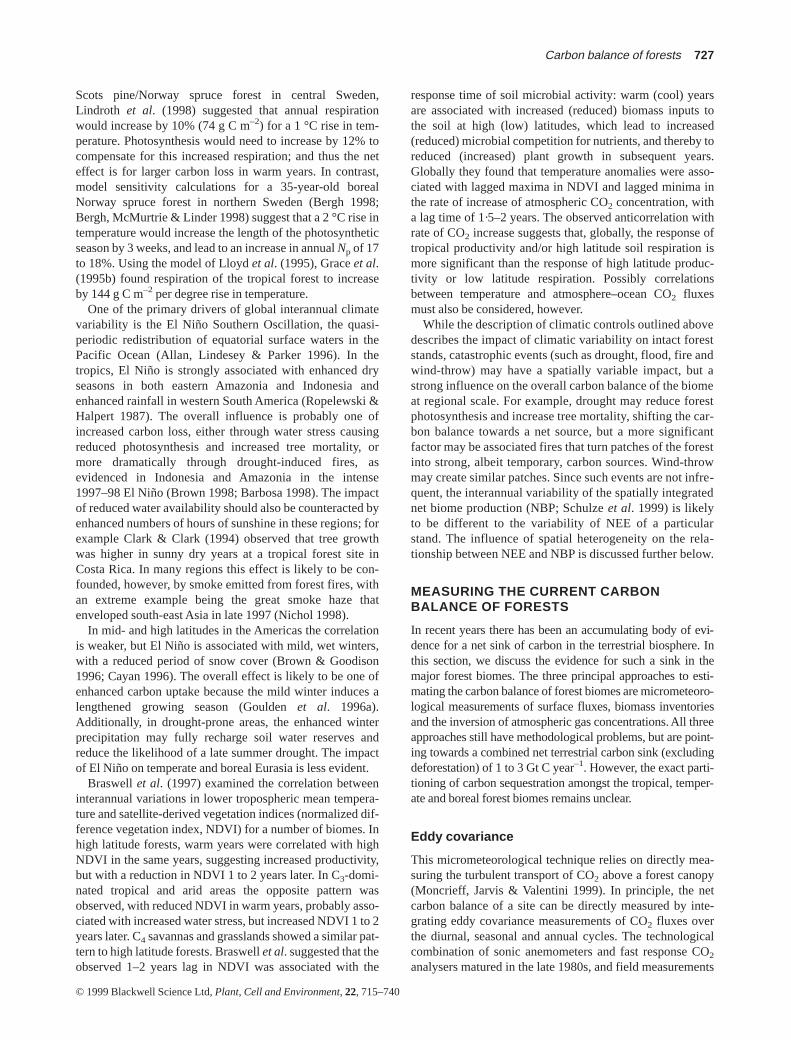
The annual cycle of net ecosystem exchange of each of thecase-study sites is shown in Fig. 4. This is the algebraic sumof the directionally opposed daytime and night-time fluxesshown in Fig. 2. Figure 4 should be viewed with some cau-tion because of the uncertainties outlined above. The borealforest data have been empirically corrected for possibleunder-estimation of night-time efflux at low wind speeds(Jarvis et al. 1997) and this reduced the initially estimatedannual NEE by 46% to the present value. Similar correctionshave not been made to the temperate and tropical forest databecause of lack of evidence that such a correction was neces-sary. Thus part of the difference between the value of NEEfor the boreal black spruce site and the other two sites mightbe attributable to this correction.
The tropical forest appears to be a net sink of CO2
throughout the year, whereas the higher latitude forests aresinks throughout most of the growing season and sourcesthroughout the winter. All three forests, however, can be car-bon sources on warm, cloudy days in the summer when pho-tosynthetic rates are low and soil respiration rates are high.NEE at the tropical forest site peaks in the early wet season(December to March), and then declines steadily to mini-mum values in the late dry season (October to November).This seasonality is the resultant of two opposing factors:variation in soil moisture status and amount of cloud cover.The observed minimum in the dry season indicates that soilmoisture availability is a more important constraint thanavailable sunshine at this site.
NEE at the temperate site is positive throughout the winter,and rises to a maximum in early March when warming temper-atures result in a peak of respiration of accumulated autumn and
728 Y. Malhi et al.
© 1999 Blackwell Science Ltd, Plant, Cell and Environment,22, 715–740
Figure 4. Annual cycle of net ecosystem exchange (NEE) ofcarbon (sum of daytime uptake and night-time release) in 1996 atthe boreal (short dashed line), temperate (solid line with diamonds)and tropical (solid line) sites.
winter litter. It then rapidly becomes negative as leaf develop-ment and photosynthetic activity commences, peaking in lateMay when the canopy is in full foliage. At its peak, NEE at thetemperate site is three to four times greater than at the tropicalsite, due to the longer day length (Fig. 3) and the lower respira-tion rates. Respiration rates are closer in magnitude to themean Np of a site, and therefore are lower at the temperate sitethan at the tropical site, despite the fact that monthly meanproductivity is higher at the temperate site in the summer.
The boreal site shows a similar seasonal cycle in NEE, butwith greatly reduced amplitude (Fig. 4). Its peak values ofNEE in May are similar to those of the tropical forest. Thesite is an increasingly frequent carbon source on cloudy daysin late summer, when soil temperatures are at a maximum,and there is a net loss of carbon on about one-quarter of thedays during the growing season.
The overall eddy covariance estimates of annual NEE at theboreal, temperate and tropical sites for the year shown indi-cate sinks of 70, 585 and 590 g C m–2years–1, respectively. Asa comparison with other measurements, in the boreal forestbiome Lindroth et al. (1998) reported a net carbon sourceof70 to 220 g C m–2 years–1 (depending on the correctionscheme used) for an old-growth Norway spruce-dominatedforest in central Sweden and Black et al. (1996) reported a netcarbon sink of 130 g C m–2 years–1 in a broadleaf hazelnut/aspen forest in Saskatchewan. In the temperate forestbiome, Goulden et al. (1996a) reported a net sink of between140 and 280 g C m–2years–1(depending on year) in the mixeddeciduous Harvard Forest, in Massachusetts. Valentini et al.(1996) reported a net sink of 450 g C m–2 years–1for a man-aged beech forest in the Appenines in central Italy, andHollinger et al. a net sink of 290 g C m–2 for a mixed decidu-ous forest in Maine. In the tropics, no other long-term recordof CO2 flux exists, although Grace et al. (1995b) inferred a netsink of 100 g C m–2 years–1 that was based on modelledextrapolation of 54 d of measurements in Rondonia, southernAmazonia.
All these values should currently be treated with somecaution until the issue of correct measurement of night-timefluxes is resolved. With the notable exceptions of the borealforest sites in Sweden (Lindroth et al. 1998) and Manitoba,Canada (Goulden et al. 1998), most sites show a net sink ofcarbon dioxide, and the reported net fluxes are much largerat the temperate and tropical forest sites than at the borealforest sites. This probably arises because the bulk photosyn-thetic and respiratory fluxes are larger in temperate and trop-ical forests, and therefore a small proportional change inthese bulk fluxes produces a larger net carbon differentialthan it would in the lower productivity boreal forests.
Biomass inventories
Another approach to estimating the carbon balance ofecosystems is through the use of conventional forest inven-tory methods. Measurements of the diameter at breast heightof trees can be converted to estimates of living, above-ground biomass using empirical allometric relations deter-mined for each tree species. By comparing successive
inventories, rates of tree recruitment, biomass growth, treemortality and net biomass increment can be determined.Carbon usually constitutes between 45 and 55% of dry treebiomass (Carvalho et al. 1998). The carbon stocks of detritusin deadwood and litter pools can also be directly measured(Vogt, Greer & Vogt 1986).
The advantage of biomass inventories over micrometeoro-logical techniques is that they are direct, fairly unambiguous,technologically simple and relatively low cost, and can thus beused to monitor changes in tree carbon stocks over wide areasand long time periods. The main disadvantage of forest carboninventories from the point of view of carbon sequestration isthat they are almost invariably incomplete, particularly withrespect to changes in below-ground carbon, in both roots andsoil organic matter. In addition they are labour-intensive andprovide only intermittent records of carbon stocks, which maynot capture the effects of seasonal and interannual changes. Asshown earlier, a combination of forest inventory and microme-teorological approaches can provide new insights into theabove-ground and below-ground flows of carbon.
Temperate and boreal forests
The long history of commercial use of northern hemispheremid-latitude forests (North America, Europe and Russia) hasresulted in extensive records of forest inventories andchanges in land use. Thus it is possible to estimate biomasschanges not only in mature forests, but also across the patch-work of forested landscapes affected by (and recoveringfrom) natural disturbance and human activity, and therebyarrive at a comprehensive estimate of biomass changes ofthe biome as a whole.
Syntheses of forest inventory data have been published forCanada (Apps & Kurz 1994), the United States (Turner et al.1995), Europe (Kauppi, Mililainen & Kyysela 1992;Spiecker et al. 1996) and the former USSR (Kolchugina &Vinson 1993). By compiling and comparing such data, Dixonet al. (1994) estimated that the northern temperate andboreal forests were accumulating 0·7 ± 0·2 Gt C year–1, andHoughton (1996b) estimated a net uptake of 0·8 Gt C year–1.Houghton’s figure includes net annual increments of livingbiomass (0·5 Gt C), wood products (0·14 Gt C), slash (0·08Gt C), soil (0·08 Gt C) and peatlands (0·02 Gt C), althoughthe figures for slash, soil and peat are based on measured ini-tial stocks and estimated respiration rates, and not on directmeasurements. This estimate of Houghton’s is significantlydifferent from the net source of 0·03 Gt C year–1estimated byHoughton & Hackler (1995) on the basis of land-use changealone. This difference arises because the biomass inventoryapproach incorporates any measured increase of biomass inundisturbed forests, and higher than expected rates ofregrowth in recovering forests.
Tropical forests
There have been few attempts to synthesize forest inventorydata from tropical forests to arrive at a large-scale net carbonbalance. Moreover, the high tree species diversity of tropical
Carbon balance of forests 729
© 1999 Blackwell Science Ltd, Plant, Cell and Environment,22, 715–740
forests (typically 200–300 species per hectare) and wide rangeof tree sizes complicates the use of empirical relationshipsbetween d.b.h. and above-ground biomass, expanding the needfor detailed destructive sampling (Brown et al. 1995). Thusthere have been few attempts to estimate biomass changeacross the patchwork of disturbed and regrowth forest areas.
Recently, Phillips et al. (1998) have compiled data fromforest inventories across 68 sites in apparently undisturbedforests across the tropics. They concluded that there is largevariability between plots, but that the South American plotsdemonstrate a mean rate of carbon accumulation of0·68 ± 0·33 t C ha–1 years–1 in above-ground biomass,implying a net accumulation of 0·6 ± 0·3 Gt C year–1 inneotropical forests as a whole. In African and Asian forests,there was no apparent net increase in biomass, but too fewplots were analysed to be confident in this conclusion. If thedifference between tropical forests in Amazonia, Africa andAsia is genuine, it may reflect the larger population densityand low level of human-induced disturbance in the pale-otropics, or be linked to the more maritime climate of theAsian forests. The primary source of uncertainty in this anal-ysis is the limited number and spatial extent of the individualplots, together with limited understanding of natural distur-bance dynamics in tropical forests. There may be a bias inselection of plots to forests recovering from disturbance,rather than to those currently losing biomass as a result ofrecent wind-throw, fire or flood (Nelson 1994).Alternatively, if the forest plots were biased towards maturestands that were more inclined to tree mortality, or degradedby human intervention, the spatial mean biomass increasemay have been underestimated (Brown & Lugo 1992).
Overall forests
This compilation of forest inventory data suggests that over-all there is a global net accumulation of 1·4 Gt C year–1 inbiomass in boreal, temperate and tropical forests. If the accu-mulation rates of secondary tropical forests and of woodproducts are also incorporated, together with better estimatesfor paleotropical forests, it is tempting to conclude thatincrease in forest biomass can account for the entire missingsink of 1·8 ± 1·6 Gt C year–1. However, accumulation of car-bon above ground in the trees is only a part of a full carboninventory, and leaves major uncertainties about what is hap-pening to carbon below ground in both root biomass and soilorganic matter. These stocks may be increasing in response toincreased growth and detritus production, or else decreasingbecause of enhanced fine-root turnover, autotrophic and het-erotrophic respiration, resulting from climate warming, par-ticularly at high latitudes. The fate of the stocks of soil carbonin this regard is crucial, but difficult to determine. To measurechanges in stocks accurately through inventory over assess-ment periods as short as 5 or 10 years is impractical. Possiblythe only sure way to determine if these stocks are changing isto measure the influxes and effluxes of carbon to and fromthe soil compartment, so that a full carbon inventory is likelyto require a combination of both stocktaking and flux mea-surements (Steffen et al. 1998).
Net ecosystem exchange and net biomeproduction
An issue that arises in any attempt to extrapolate from indi-vidual site measurements, whether micrometeorological orforestry-based, is the extent to which measurements of netcarbon balance at individual sites are representative of the car-bon balance of the whole forest biome, that is, the extent towhich NEE represents NBP. A crucial factor is the extent towhich intermittent, medium-scale disturbances determine for-est stand dynamics. Many boreal and temperate forests arecertainly affected by fire on a time-scale of a century (Payette1992); the pattern of natural disturbance in tropical forests isless obvious or well understood, but may involve a combina-tion of fire, drought, floods and storm blow-downs (Nelson1994). If such disturbances are frequent or extensive, the for-est may be composed of a patchwork of stands of variousages, each of them growing and accumulating carbon at a dif-ferent rate until the next major disturbance. If forest patchesare always recovering from the previous disturbance, andalways disturbed again before they reach equilibrium, it isconceivable that the net biome production, NBP, is zero, evenwhen measurements of NEE at all sites away from areasundergoing disturbance always indicate strong carbon uptake.
In principle, this should not present a problem as long asthere are a sufficient number of measurement sites to capturethe occasional disturbed patch and the full range of recover-ing patches, and there is no bias against obtaining data fromdisturbed sites. The extent to which such a bias existsremains unclear: in the extreme case there can be no tower-based eddy covariance measurements of CO2 fluxes duringforests fires, and we have to rely on other means, such asremote sensing of fires, to estimate carbon emissions. Toestimate NBP on a regional scale we must take into accountthe regional mosaic of disturbance and recovery, and henceconsider whether we are adequately sampling spatial hetero-geneity (Schulze et al. 1999).
Micrometeorological and forestry measurements tacklespatial heterogeneity at different scales. Eddy covariancemeasures carbon balance over an area of tens to thousands ofhectares (Malhi et al. 1998), and the measured carbon bal-ance is not likely to be affected by random variability on thisscale, such as canopy gap dynamics. However, eddy covari-ance sites have tended to be short-term and few in number,except during intensive campaigns such as BOREAS, andthus may not capture the range of natural disturbance andrecovery at regional scale. Forestry plots frequently onlycover a few hectares, and thus measurements at any particu-lar site are more prone to being affected by small-scale forestdynamics. They are very low-cost, however, and can thusprovide a dense and long-term network with which to cap-ture regional scale carbon balance.
An alternative strategy is to attempt to quantify the NBP,by directly measuring CO2 fluxes at a regional scale thatincorporates natural disturbance. This can be done at land-scape scale by making budgets of the amounts and isotopiccomposition of CO2 and other gases in the atmosphericboundary layer to estimate local fluxes (Denmead et al.
730 Y. Malhi et al.
© 1999 Blackwell Science Ltd, Plant, Cell and Environment,22, 715–740
1996; Culf et al. 1999), or by measuring NEE with aircraft-borne eddy covariance systems (Crawford et al. 1996). Alarger scale alternative is to use a global network of gasconcentration measurements to estimate continental-scalefluxes, as discussed below.
Atmospheric CO 2, 13CO2 and O2/N2 Studies
The net carbon balance of the terrestrial biosphere as awhole can be examined by analysis of the global atmo-spheric pattern of concentrations and isotopic compositionof CO2 and O2, as measured at flask sampling stationsaround the globe (Ciais et al. 1995; Francey et al. 1995;Keeling et al. 1995). In principle, if the global distributionof CO2 is known, and the global transport and dispersionrates estimated from meteorological models, the modelscan be inverted to provide a spatial surface map of sourcesand sinks of CO2 (Fan et al. 1998; Bousquet et al. 1999,Rayner et al. 1999). Monitoring the ratio 13C/12C andO2/N2 provides a further handle on the partition of thefluxes between oceans and terrestrial biosphere (Keelinget al. 1995; Ciais et al. 1995).
The isotopic ratio δ13C is particularly useful because C3
photosynthesis (the primary mechanism in a forest carbonsink) has a strong discriminating effect on this ratio(δ13Cleaves~ –27 to –32‰; δ13Catmosphere~ –7 to –8‰;Lloyd et al. 1996), whereas the dissolution of CO2 in oceanwater (the major alternative carbon sink mechanism) and C4
photosynthesis (δ13Cleaves~ –11 to –15%) have less impact.Similarly, changes in O2 concentration (measured relative tomore stable N2 concentrations) are related to CO2 fluxes viabiotic processes and combustion, but insensitive to the dis-solution of CO2 in ocean water (Keeling et al. 1996b).
This approach holds great promise as a future global bio-sphere monitoring strategy, but until now has tended to yieldcontradictory results. Some earlier studies (Keeling et al.1989; Tans, Fung & Takahashi 1990; Enting & Mansbridge1991; Ciais et al. 1995), indicated a very strong extra-tropi-cal sink (range –0·7 to –4·3 Gt C year–1) and generally alarge net tropical source (range +0·3 to +1·7 Gt C year–1).The studies covered different years, so some of the discrep-ancies may result from interannual variability. Many studies(Francey et al. 1995; Keeling et al. 1995; Rayner et al. 1998)have indicated strong interannual variability in terrestrialfluxes, although correlation of this variability to climaticfactors such as El Niño events is unclear.
The earlier, latitudinally averaged studies had a number ofmethodological difficulties, however, and more recent stud-ies have attempted to incorporate continental-scale resolu-tion. A regional analysis by Fan et al. (1998) suggested thatthe terrestrial sink is almost entirely localized in NorthAmerican temperate forests (1·7 ± 0·5 Gt C year–1) withEurasia being a weak sink (0·1 ± 0·6 Gt C year–1) and therest of the world a weak source (0·1 ± 0·6 Gt C year–1).However, this somewhat controversial result is contradictedin a study by Rayner et al. (1999) which, using global CO2measurements over the period 1980–95 and a long-termrecord of 13C/12C and O2/N2, suggests net sinks of 0·3 and
0·2 Gt C year–1 in the North American temperate and borealzones, respectively, 0·2 Gt C year–1 in Europe and zero inSiberia. For the terrestrial tropics they estimate a net sink of0·2 Gt C year–1, implying a tropical carbon sequestrationrate of approximately 1·8 Gt C year–1 to compensate for thetropical deforestation rates estimated by Houghton (1996a).A recent analysis of CO2 concentrations alone (Bousquetet al. 1999) also suggests modest sinks in North America(0·5 Gt C year–1) and Europe (0·3 Gt C year–1), similar toRayner et al. (1999), but a very large sink in Siberia(1·5 Gt C year–1) that is offset by a large net tropical sourceof 1·1 Gt C year–1, particularly concentrated in tropical Asia(0·8 Gt C year–1).
There is clearly no current consensus in these results frominverse modelling. Perhaps the study of Rayner et al. (1999)is the only one which approaches consistency with the cur-rent, albeit inconclusive, ground-based evidence. The lackof consistency amongst studies suggests that this approachstill faces a number of problems. Amongst the principle dif-ficulties are the following:
1 The inverse problem is very poorly constrained, and fre-quently an a priori guess of terrestrial sources and sinksis made to help constrain the solution (Enting, Trudinger& Francey 1995).
2 The current network of long-term flask sampling sites israther sparse and strongly biased towards coastal sites thatsample the marine boundary layer, and is thus not wellsuited to determining the terrestrial carbon budget. Thenetwork is particularly sparse over the southern oceansand tropical continents but this problem will diminish asthe network continues to be extended. North America isthe best-covered continent, and therefore the most con-strained in any regional analysis (Fan et al. 1998).
3 A number of the long-term records appear to havemethodological errors in the early years. For example,prior to 1988 the three longest 13C records (as describedby Keeling et al. 1995, Francey et al. 1995 and Nakazawaet al. 1997) show major differences from one another ininterannual behaviour that appear to be too large to be ofsource/sink origin and imply systematic error.
4 The tropics in particular are almost totally unconstrainedbecause the intensity of tropical convection results invigorous mixing and dilution of any CO2 signal verti-cally through the troposphere and horizontally to higherlatitudes (Denning, Fung & Randall 1995). The carbonbalance of the tropics is therefore more or less estimatedas a residue of the results calculated for mid- and highlatitudes. If the complex mixing between tropical andmid-latitudes is inaccurately modelled, it is possible thatany carbon sink at tropical latitudes can ‘leak out’ andappear as a sink at mid- and high latitudes.
5 The atmospheric boundary layer is shallower in winterand at higher latitudes, and so changes in concentrationsof gases are more sensitive to surface fluxes in suchconditions. The covariance of this effect with seasonal-ity of photosynthesis and respiration in the biosphereproduces an interhemispheric CO2 concentration gradi-
Carbon balance of forests 731
© 1999 Blackwell Science Ltd, Plant, Cell and Environment,22, 715–740
ent even if there were no net fluxes (Denning, Fung &Randall 1995). Accurate modelling of the seasonal andlatitudinal variation of boundary layer height, and ofthe transport of CO2 between the atmospheric boundarylayer and the free atmosphere, is required to compen-sate for this effect.
FUTURE SCENARIOS
Global climate change
IPCC (1995) estimates as a ‘best guess’ that global meantemperature will increase by 2·4 °C by 2100, with a range of0·8 °C to 4·5 °C according to climate model and CO2 emis-sion scenario. The warming is concentrated more on land(typically 3 to 4 °C) than over oceans (0 to 2 °C), predomi-nantly because of the larger thermal inertia of the oceans.Almost all models predict a mean warming of 5 to 6 °C inthe boreal region, predominantly in late autumn and winterbecause of the late formation of sea ice, but with only a 2 to4 °C warming in summer, when the influence of ice is muchreduced. In the temperate region the predicted warming isalso mainly in winter, but generally smaller (typically 1 to2 °C), because of the cooling effect of industrial aerosolemissions in North America, Europe and East Asia. A meanwarming of 3 to 4 °C is predicted for the tropics, but less (1to 3 °C) in the more maritime Asian tropics, with little evi-dent seasonality.
Predictions of future precipitation and soil moisture areless reliable than those of temperature. Mean global precipi-tation is predicted to increase with global warming, becauseof higher atmospheric water vapour content and enhancedpoleward transport and convergence of water vapour.Precipitation is expected to increase in winter by 0·0 to0·5 mm d–1 in boreal and temperate latitudes, but much ofthis excess precipitation may be lost in run-off and have littleimpact on summer soil moisture, because the soil is close tosaturation in winter. A reduction in summer soil moisturecontent is predicted for mid- and high latitudes, because oflittle change in precipitation but enhanced evapotranspira-tion resulting from higher surface temperatures. In the trop-ics mean precipitation is predicted to increase by 0·0 to1·0 mm d–1and the Asian monsoon will probably strengthen,but there is little agreement on the general spatial pattern ofincrease. Many models predict a change in the distributionof sea surface temperature similar to El Niño conditions, andthis would imply an intensified and prolonged dry season inIndonesia and central and eastern South America, and inten-sified rain in western South America.
A primary difficulty in assessing the response of forests toclimate change is that each climatic variable may have bothpositive and negative effects on forest carbon balance. Forexample, higher soil temperatures result in both enhancedsoil respiration (Raich & Schlesinger 1992) and enhancedsoil mineralization and nutrient availability to the trees(Melillo et al. 1993); enhanced precipitation is also associ-ated with enhanced cloud cover; higher air temperatures maylead to longer growing seasons but also to enhanced moisture
stress. The history of vegetation distribution since the LGM(already considered above) suggests that, without anthro-pogenic limitations, a change to a warmer, moister climateresults in an overall expansion of forest biomes at theexpense of tundra at high latitudes, at the expense of semiaridvegetation in mid-latitudes, and at the expense of savanna inthe tropics. However, the upper temperature and moisturelimits to these processes of replacement are not known.Moreover, the response of forest biomes to rapid changemay involve a number of transient phenomena with differ-ent response times, such that a biome may switch frombeing a carbon source to a sink or vice versa as climatechange proceeds.
For example, a temperature rise at high latitudes will leadto higher respiration rates, and oxidation of soil carbon,much of which has accumulated at high latitudes over thepast 12 000 years since the retreat of the ice sheets. Increasedevapotranspiration may also increase late summer moisturestress and thus decrease late summer photosynthesis. On theother hand, higher temperatures may also result in a length-ened growing season and enhanced decomposition andrelease of soil nutrients. The modelling study by Bergh(1998) of a young Norway spruce stand predicted a three-week extension of the growing season and a 17% increase inNp for a 2 °C rise in temperature. For a 4 °C rise in tempera-ture there was a seven-week extension of the growing seasonbut no further increase in Np, because of the compensatingeffects of enhanced tissue respiration. Overall, the field evi-dence suggests that these opposing effects are currently inapproximate balance: NEE measurements at the nineBOREAS forest sites (Sellers et al. 1997) indicate onlysmall net sinks in the Canadian boreal forest during theunusually warm years of the 1990s. In particular, the studyby Goulden et al. (1998) of a black spruce site at the north-ern limit of the forest in Manitoba showed that the netsequestration of carbon into woody biomass was balancedby the release of ancient soil carbon as a direct result of thelowering of the permafrost layer. A number of recently initi-ated soil-warming experiments (Bergh & Linder 1999) mayshed further light on this issue over the next 10 years.
Atmospheric and satellite data provide further insights:Keeling et al. (1996a) reported that the amplitude of theannual cycle of CO2 concentration has increased since the1960s by 20% at mid-latitudes and by 40% at high latitudes,and the increase was largest in warm years. These observa-tions can be explained both by increased carbon uptake inphotosynthesis, and by enhanced winter respiration. In addi-tion, the timing of the drawdown in spring has advanced byseven days, implying a lengthening growing season. Myneniet al. (1997) found a similar pattern in remotely sensed vege-tation indices at high latitudes (45°N to 70°N). There istherefore significant evidence for increasing vegetationactivity resulting from warming temperatures at high lati-tudes – what remains unclear is the corresponding responseof the soil carbon pools.
There is similar uncertainty with regard to the future oftropical forests: possible increase in productivity, resultingfrom CO2 and N fertilization (see the following section),
732 Y. Malhi et al.
© 1999 Blackwell Science Ltd, Plant, Cell and Environment,22, 715–740
may be compensated for by enhanced respiration of the soilcarbon pool. One source of uncertainty is the role ofenhanced soil mineralization rates at higher temperatures. Anumber of authors (Melillo et al. 1993) have argued that thiswill have an important impact in boosting nutrient availabil-ity in resource-poor tropical soils, whereas Houghton,Davidson & Woodwell (1998) have recently argued thatmost of the enhanced nutrient supply will be utilized by soilmicrobes with little extra being available for plant growth.Depending on its seasonal distribution, enhanced precipita-tion is likely to mitigate soil moisture limitation in the dryseason and allow expansion of rain forest into savannas, butits uncertain spatial distribution may lead to gains in someareas balanced by losses in others. In addition, the associatedincrease in cloudiness is likely to reduce photosynthesis sothat the overall effect may be little increase in forest produc-tivity. Figure 3 demonstrates that for the Amazonian sitethese two factors (precipitation and cloudiness) balancedeach other in 1996 so that there was almost no difference inNEE between the wet and dry seasons.
Increases in CO 2 concentration
The average atmospheric CO2 concentration has increasedfrom a pre-industrial concentration of about 280µmol mol–1
to 364µmol mol–1 in 1997, and is currently increasing atabout 1·5µmol mol year–1 (Keeling & Whorf 1998). This islikely to have a fertilizing impact on global C3 photosynthe-sis and to increase water-use efficiency; the extent andevidence for this effect is comprehensively discussed else-where in this volume.
In recent years a number of studies have attempted tomodel the response of the terrestrial biosphere to rising CO2
concentrations (Kohlmaier et al. 1987; Goudriaan 1992,Polglase & Wang 1992; Gifford 1994; Friedlingstein et al.1995; Lloyd & Farquhar 1996). It now appears likely thatenhanced atmospheric CO2 concentrations will increaseforest productivity, with a resulting terrestrial carbon sinkof 1 to 2 Gt C year–1. It must be emphasized that a seques-tration rate of 2 Gt C year–1 does not require that global netprimary productivity, Np, be increased by this amount; thelag time between carbon acquisition through primary pro-duction and carbon loss through respiration is also impor-tant. The net carbon sequestration by an ecosystem is thebalance between carbon uptake, equal to Np, and carbonrespiration, which is approximately equal to the value of Np,τ years in the past, where τ is the mean residence time forcarbon in the ecosystem. For a linear increase in Np fol-lowed by a linear increase in respiration with lag time τ, therate of carbon sequestration can therefore be estimated asdM/dt = τ dNp/dt (Taylor & Lloyd 1992), where M is thetotal (plant and soil) carbon density, and τ can be calculatedas τ = M/Np. We estimate τ to be 30, 20, and 90 years for thetropical, temperate and boreal case-study sites, respectively(Table 6). This calculation should be treated with some cau-tion: as explained in the section entitled Stand dynamics,above, the calculated value of τ for the boreal forest may bean overestimate, and that for the temperate forest may be an
underestimate. If a terrestrial carbon sink of 2 Gt C year–1
were exclusively and evenly distributed over the currentextent (4165 Mha) of tropical, temperate and boreal forests(Table 1), this is equivalent to a per unit area sequestrationrate of 50 g C m–2 year–1. Assuming that the values of Np
and τ calculated for each case-study site (Table 6) are repre-sentative of the appropriate biome, the rates of increase ofNp required to generate this sequestration rate are 1·7, 2·5and 0·6 g C m–2 years–1, or, relative to current values of Np,0·1, 0·2 and 0·1% year–1 for the tropical, temperate andboreal forests, respectively. This seems a very plausiblepossibility.
Many of the model studies (Polglase & Wang 1992;Gifford 1994; Wang & Polglase 1995; Lloyd & Farquhar1996) suggest that the most productive biomes (i.e. tropicaland warm temperate forests) should dominate the directresponse to CO2 fertilization. Even allowing for the likeli-hood of a warming-lengthened growing season at high lati-tudes (Myneni et al. 1997), it seems difficult to argue for acarbon sink focused solely at high latitudes, as suggested bysome global CO2 inversion studies (described in the sectionon CO2
13CO2 and O2/N2 studies, above). In addition toboosting overall forest productivity, CO2 fertilization mayincrease the competitive advantage of C3 forests against C4grasslands and savannahs, and lead to the expansion offorests in transition areas. However, this factor may becounteracted by the higher light-use efficiency of C4 plantsat high temperatures.
Increasing rates of N deposition
Human activity has also had a major impact on the globalnitrogen cycle: global nitrogen fixation is estimated to haveincreased from a natural biological rate of 0·09 to0·13 Gt N year–1 to about 0·25 Gt N year–1, with a currentannual rate of increase of 0·6% year1 (Galloway et al. 1995).This increase is the result of fertiliser production (about0·08 Gt N year–1), cultivation of legumes, pulses, ground-nuts and rice (about 0·04 Gt N year–1) and fossil fuel com-bustion (0·02 Gt N year–1). Fossil fuel combustion directlyreleases NOx into the atmosphere, but much of the N releaseassociated with land use is also released to the atmosphere,in the form of ammonia (NH3) from pastures and fertilizedfields, as NO and N2O from fertilized soils, and as HNO3from biomass burning. However, reactive N compoundshave short atmospheric residence times of hours to days, sothat N is rapidly deposited downwind of emission areas, par-ticularly in East Asia, eastern North America and Europe,where deposition rates can be up to 100 kg N ha–1 year–1. Inboreal and tropical forest areas, deposition rates are gener-ally much lower (5 to 10 kg N ha–1 year–1) because of dis-tance from major sources, except in areas adjacent tobiomass burning (particularly in West Africa) where deposi-tion may reach about 60 kg ha–1 year–1 (Galloway et al.1995). However, because of the highly effective, turbulentexchange between forest canopies and the atmosphere,rough coniferous forest canopies, in particular, may scav-enge 30 kg N ha–1 year–1 at sites where the nominal deposi-
Carbon balance of forests 733
© 1999 Blackwell Science Ltd, Plant, Cell and Environment,22, 715–740
tion rate is only 5 kg ha–1 year–1 (D. Fowler, personal com-munication).
Several recent studies have attempted to estimate theeffect of increased N deposition on carbon sequestration(Townsend et al. 1996; Holland et al. 1997). They suggest aglobal N-induced carbon sequestration rate of the order of1 Gt C year–1, similar to that estimated to be induced by CO2
fertilization, and concentrated particularly in high deposi-tion areas such as eastern North America, central Europeand East Asia. Experimental studies on young trees showsignificant interactions between N and CO2 fertilizationeffects (McGuire, Melillo & Joyce 1995; Jarvis 1998). Thecombination of elevated CO2 concentration and N inputsmay well be the reason why tree growth is on the increase(see section entitled Biomass inventories, above). On theother hand, a recent study of uptake of 15N tracer at ninetemperate forest sites found that only a small fraction (20%)of added N was fixed by vegetation, with most ending up insoils (Nadelhoffer et al. 1999). A key question is whether theglobal forests will become carbon-saturated in the foresee-able future, thus losing their carbon sequestration capacityas suggested by Cao & Woodward (1998). With the present,increasing scale of N inputs, this does not seem very likely,but the damaging effects of acute high rates of N depositionto forests near centres of population and industry (Schulze1989) may also dampen carbon sequestration rates.
Another question is whether increases in plant productivitywill be limited by availability of other nutrients, in particularphosphorus, which is relatively immobile but vital to produc-tivity (Smeck 1985). Tropical forest soils, particularly, inAmazonia, contain very low amounts of available phosphorus(Vitousek & Sandford 1986) and the primary supply is miner-alization of soil organic matter and inorganic compounds. Ithas therefore often been assumed that low phosphorus avail-ability may limit the CO2 fertilization of tropical forests(Friedlingstein et al. 1995; McKane et al. 1995). On the otherhand, Lloyd (1999) argues that there is much recent evidencethat high CO2 concentrations improve plant carbohydrateavailability, which in turn enhances phosphorus acquisitionprocesses such as mycorrhizal colonization (Wang, Rey &Jarvis 1998; Staddon & Fitter 1998), production of phos-phatase enzymes which break down soil organic P compounds(Duff, Sarath & Plaxton 1994), and exudation of organic acidswhich increases mineralization of inorganic P (Bolan et al.1994). Thus the forest phosphorus cycle may simply speed upto meet the demands of enhanced plant growth.
Where is the forest carbon sink?
In conclusion, most modelling studies suggest that CO2 andN fertilization are boosting global forest primary productiv-ity, and this in turn results in a carbon sequestration rate of 1to 3 Gt C year–1, a result that is in accordance with require-ments to balance the global carbon budget (seeIntroduction), and with field biomass studies (see section onbiomass inventories, above). A case can be made for a signif-icant carbon sink in each major forest biome: in tropicalforests because of CO2 fertilization of their intrinsic high
productivity, in temperate forests because of regrowth andhigh N deposition rates, and in boreal forests because oftheir lengthening growing season. Indeed, it is likely that theterrestrial carbon sink is not confined to or dominated by anyone biome or region.
The direction of the effect of climate change is less cer-tain, but for the moment its effects are particularly concen-trated at boreal latitudes. There the evidence suggests thatwarming temperatures are leading to an enhanced growingseason, but this effect may be negated or reversed byenhanced oxidation of soil carbon. This underlines theimportance of understanding and monitoring the behaviourof soil carbon, which is as important to the carbon balance ofthe terrestrial biosphere as is the vegetation.
Some simple insight can be obtained by inverting the cal-culations in the section on increases in CO2 concentration,above. If we assume that, for whatever reason, Np has risenuniformly at 0·1% year–1 in all three forest biomes for sev-eral decades, we can examine where the carbon is likely tobe sequestered. The sequestration rate for each biome is pro-portional to the area of the biome (from Table 1), the intrin-sic Np per unit area (from Table 6, assuming the case-studysites are representative), and the carbon residence times(from Table 6, calculating the soil carbon residence timesusing the same value of Np as for biomass carbon residencetimes). The calculation predicts a global sequestration rate of1·59 Gt C year–1, of which 0·78 Gt C year–1 (49%) is in trop-ical forests, 0·18 Gt C year–1 (11%) is in temperate forestsand 0·63 Gt C year–1 (40%) in boreal forests. Within thetropical forest, the calculation suggests that 54% of thesequestration is in biomass and 46% in soil organic matter,in the temperate forest 54% is in biomass, and in the borealforest only 13% is in biomass. Overall, 38% of the seques-tration is calculated to be in biomass, and 62% in soil. Theresults are simplistic but nonetheless instructive. There islikely to be a large carbon sink in intact tropical forests,because of their large area and high productivity, unless afactor such as phosphorus availability is strongly limiting Np
increase. Moreover, if there is already a carbon sink in tropi-cal forest biomass, as suggested by Phillips et al. (1998),there is also likely to be a further sink of similar magnitudein tropical forest soils, unless rising temperatures are result-ing in enhanced soil respiration. Although the temperate for-est calculation should be treated with caution because of theunusual case-study site, the result does suggest that totalsequestration in temperate forests is small because of theirlimited area coverage. However, as many of these forests areactively regrowing, their rates of increase of Np may behigher than for other forests. It is much more difficult tosequester carbon in boreal forest biomass than in the otherforests, because of the low productivity of boreal forest.Unless boreal forest Np is increasing much more rapidly inboreal forests than in other forests, a boreal carbon sink ismuch more likely to be in the soil, because of its long carbonresidence time. However, the size of the boreal forest activecarbon pool may be much smaller than the value estimatedhere, or there may be enhanced carbon loss as a result ofhigh latitude climate warming. Put another way, if boreal
734 Y. Malhi et al.
© 1999 Blackwell Science Ltd, Plant, Cell and Environment,22, 715–740
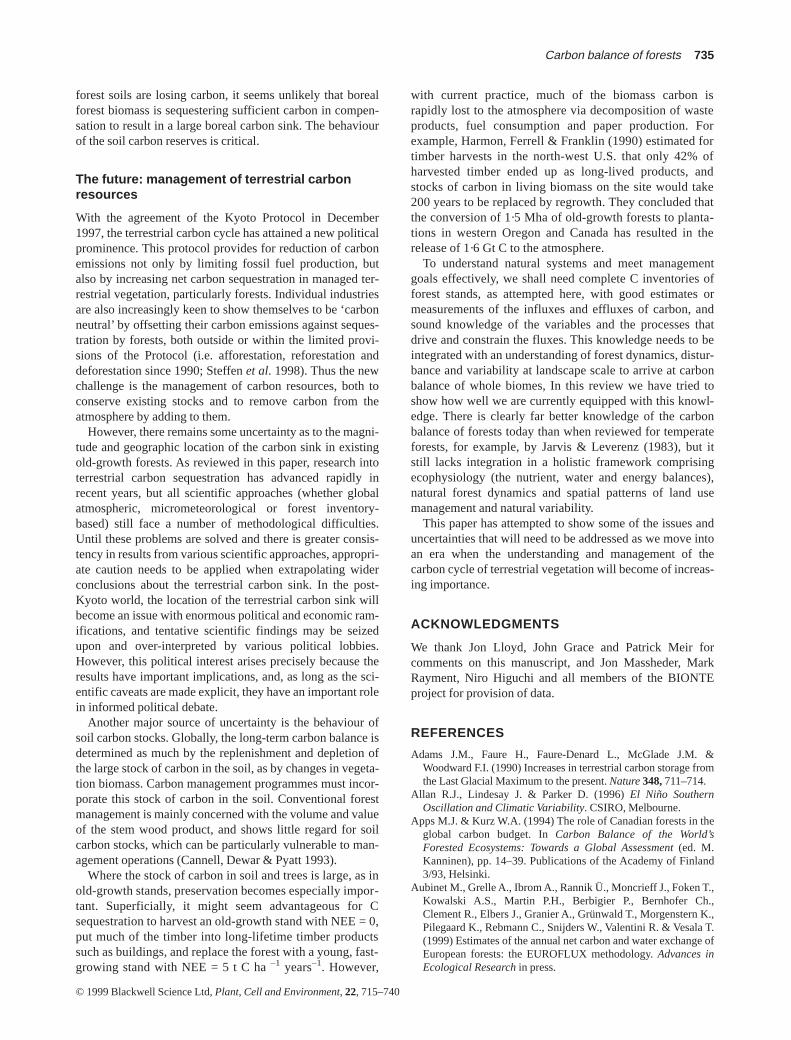
forest soils are losing carbon, it seems unlikely that borealforest biomass is sequestering sufficient carbon in compen-sation to result in a large boreal carbon sink. The behaviourof the soil carbon reserves is critical.
The future: management of terrestrial carbonresources
With the agreement of the Kyoto Protocol in December1997, the terrestrial carbon cycle has attained a new politicalprominence. This protocol provides for reduction of carbonemissions not only by limiting fossil fuel production, butalso by increasing net carbon sequestration in managed ter-restrial vegetation, particularly forests. Individual industriesare also increasingly keen to show themselves to be ‘carbonneutral’ by offsetting their carbon emissions against seques-tration by forests, both outside or within the limited provi-sions of the Protocol (i.e. afforestation, reforestation anddeforestation since 1990; Steffen et al. 1998). Thus the newchallenge is the management of carbon resources, both toconserve existing stocks and to remove carbon from theatmosphere by adding to them.
However, there remains some uncertainty as to the magni-tude and geographic location of the carbon sink in existingold-growth forests. As reviewed in this paper, research intoterrestrial carbon sequestration has advanced rapidly inrecent years, but all scientific approaches (whether globalatmospheric, micrometeorological or forest inventory-based) still face a number of methodological difficulties.Until these problems are solved and there is greater consis-tency in results from various scientific approaches, appropri-ate caution needs to be applied when extrapolating widerconclusions about the terrestrial carbon sink. In the post-Kyoto world, the location of the terrestrial carbon sink willbecome an issue with enormous political and economic ram-ifications, and tentative scientific findings may be seizedupon and over-interpreted by various political lobbies.However, this political interest arises precisely because theresults have important implications, and, as long as the sci-entific caveats are made explicit, they have an important rolein informed political debate.
Another major source of uncertainty is the behaviour ofsoil carbon stocks. Globally, the long-term carbon balance isdetermined as much by the replenishment and depletion ofthe large stock of carbon in the soil, as by changes in vegeta-tion biomass. Carbon management programmes must incor-porate this stock of carbon in the soil. Conventional forestmanagement is mainly concerned with the volume and valueof the stem wood product, and shows little regard for soilcarbon stocks, which can be particularly vulnerable to man-agement operations (Cannell, Dewar & Pyatt 1993).
Where the stock of carbon in soil and trees is large, as inold-growth stands, preservation becomes especially impor-tant. Superficially, it might seem advantageous for Csequestration to harvest an old-growth stand with NEE = 0,put much of the timber into long-lifetime timber productssuch as buildings, and replace the forest with a young, fast-growing stand with NEE = 5 t C ha–1 years–1. However,
with current practice, much of the biomass carbon israpidly lost to the atmosphere via decomposition of wasteproducts, fuel consumption and paper production. Forexample, Harmon, Ferrell & Franklin (1990) estimated fortimber harvests in the north-west U.S. that only 42% ofharvested timber ended up as long-lived products, andstocks of carbon in living biomass on the site would take200 years to be replaced by regrowth. They concluded thatthe conversion of 1·5 Mha of old-growth forests to planta-tions in western Oregon and Canada has resulted in therelease of 1·6 Gt C to the atmosphere.
To understand natural systems and meet managementgoals effectively, we shall need complete C inventories offorest stands, as attempted here, with good estimates ormeasurements of the influxes and effluxes of carbon, andsound knowledge of the variables and the processes thatdrive and constrain the fluxes. This knowledge needs to beintegrated with an understanding of forest dynamics, distur-bance and variability at landscape scale to arrive at carbonbalance of whole biomes, In this review we have tried toshow how well we are currently equipped with this knowl-edge. There is clearly far better knowledge of the carbonbalance of forests today than when reviewed for temperateforests, for example, by Jarvis & Leverenz (1983), but itstill lacks integration in a holistic framework comprisingecophysiology (the nutrient, water and energy balances),natural forest dynamics and spatial patterns of land usemanagement and natural variability.
This paper has attempted to show some of the issues anduncertainties that will need to be addressed as we move intoan era when the understanding and management of thecarbon cycle of terrestrial vegetation will become of increas-ing importance.
ACKNOWLEDGMENTS
We thank Jon Lloyd, John Grace and Patrick Meir forcomments on this manuscript, and Jon Massheder, MarkRayment, Niro Higuchi and all members of the BIONTEproject for provision of data.
REFERENCES
Adams J.M., Faure H., Faure-Denard L., McGlade J.M. &Woodward F.I. (1990) Increases in terrestrial carbon storage fromthe Last Glacial Maximum to the present.Nature348,711–714.
Allan R.J., Lindesay J. & Parker D. (1996) El Niño SouthernOscillation and Climatic Variability. CSIRO, Melbourne.
Apps M.J. & Kurz W.A. (1994) The role of Canadian forests in theglobal carbon budget. In Carbon Balance of the World’sForested Ecosystems: Towards a Global Assessment(ed. M.Kanninen), pp. 14–39. Publications of the Academy of Finland3/93, Helsinki.
Aubinet M., Grelle A., Ibrom A., Rannik Ü., Moncrieff J., Foken T.,Kowalski A.S., Martin P.H., Berbigier P., Bernhofer Ch.,Clement R., Elbers J., Granier A., Grünwald T., Morgenstern K.,Pilegaard K., Rebmann C., Snijders W., Valentini R. & Vesala T.(1999) Estimates of the annual net carbon and water exchange ofEuropean forests: the EUROFLUX methodology. Advances inEcological Research in press.
Carbon balance of forests 735
© 1999 Blackwell Science Ltd, Plant, Cell and Environment,22, 715–740
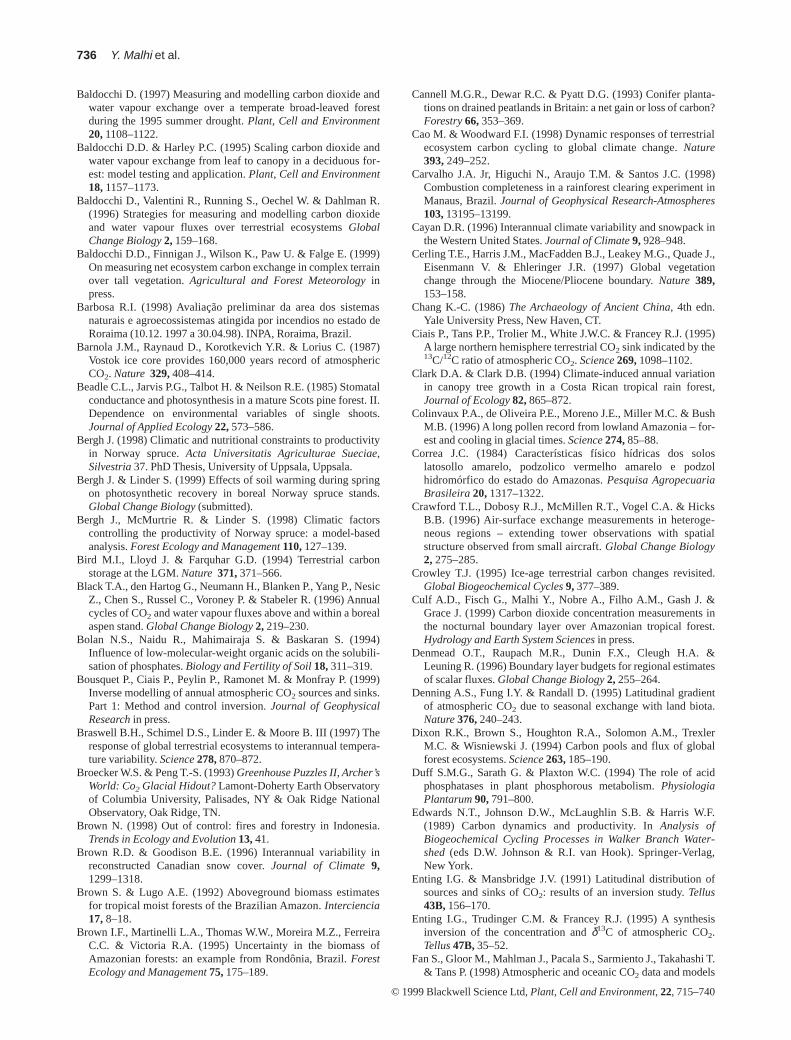
Baldocchi D. (1997) Measuring and modelling carbon dioxide andwater vapour exchange over a temperate broad-leaved forestduring the 1995 summer drought. Plant, Cell and Environment20, 1108–1122.
Baldocchi D.D. & Harley P.C. (1995) Scaling carbon dioxide andwater vapour exchange from leaf to canopy in a deciduous for-est: model testing and application.Plant, Cell and Environment18,1157–1173.
Baldocchi D., Valentini R., Running S., Oechel W. & Dahlman R.(1996) Strategies for measuring and modelling carbon dioxideand water vapour fluxes over terrestrial ecosystems GlobalChange Biology2, 159–168.
Baldocchi D.D., Finnigan J., Wilson K., Paw U. & Falge E. (1999)On measuring net ecosystem carbon exchange in complex terrainover tall vegetation.Agricultural and Forest Meteorologyinpress.
Barbosa R.I. (1998) Avaliação preliminar da area dos sistemasnaturais e agroecossistemas atingida por incendios no estado deRoraima (10.12. 1997 a 30.04.98). INPA, Roraima, Brazil.
Barnola J.M., Raynaud D., Korotkevich Y.R. & Lorius C. (1987)Vostok ice core provides 160,000 years record of atmosphericCO2. Nature 329, 408–414.
Beadle C.L., Jarvis P.G., Talbot H. & Neilson R.E. (1985) Stomatalconductance and photosynthesis in a mature Scots pine forest. II.Dependence on environmental variables of single shoots.Journal of Applied Ecology22,573–586.
Bergh J. (1998) Climatic and nutritional constraints to productivityin Norway spruce. Acta Universitatis Agriculturae Sueciae,Silvestria37. PhD Thesis, University of Uppsala, Uppsala.
Bergh J. & Linder S. (1999) Effects of soil warming during springon photosynthetic recovery in boreal Norway spruce stands.Global Change Biology(submitted).
Bergh J., McMurtrie R. & Linder S. (1998) Climatic factorscontrolling the productivity of Norway spruce: a model-basedanalysis.Forest Ecology and Management110, 127–139.
Bird M.I., Lloyd J. & Farquhar G.D. (1994) Terrestrial carbonstorage at the LGM. Nature 371, 371–566.
Black T.A., den Hartog G., Neumann H., Blanken P., Yang P., NesicZ., Chen S., Russel C., Voroney P. & Stabeler R. (1996) Annualcycles of CO2 and water vapour fluxes above and within a borealaspen stand.Global Change Biology2, 219–230.
Bolan N.S., Naidu R., Mahimairaja S. & Baskaran S. (1994)Influence of low-molecular-weight organic acids on the solubili-sation of phosphates.Biology and Fertility of Soil18,311–319.
Bousquet P., Ciais P., Peylin P., Ramonet M. & Monfray P. (1999)Inverse modelling of annual atmospheric CO2 sources and sinks.Part 1: Method and control inversion. Journal of GeophysicalResearch in press.
Braswell B.H., Schimel D.S., Linder E. & Moore B. III (1997) Theresponse of global terrestrial ecosystems to interannual tempera-ture variability.Science278,870–872.
Broecker W.S. & Peng T.-S. (1993) Greenhouse Puzzles II, Archer’sWorld: Co2 Glacial Hidout?Lamont-Doherty Earth Observatoryof Columbia University, Palisades, NY & Oak Ridge NationalObservatory, Oak Ridge, TN.
Brown N. (1998) Out of control: fires and forestry in Indonesia.Trends in Ecology and Evolution13,41.
Brown R.D. & Goodison B.E. (1996) Interannual variability inreconstructed Canadian snow cover.Journal of Climate9,1299–1318.
Brown S. & Lugo A.E. (1992) Aboveground biomass estimatesfor tropical moist forests of the Brazilian Amazon.Interciencia17,8–18.
Brown I.F., Martinelli L.A., Thomas W.W., Moreira M.Z., FerreiraC.C. & Victoria R.A. (1995) Uncertainty in the biomass ofAmazonian forests: an example from Rondônia, Brazil.ForestEcology and Management75,175–189.
Cannell M.G.R., Dewar R.C. & Pyatt D.G. (1993) Conifer planta-tions on drained peatlands in Britain: a net gain or loss of carbon?Forestry66,353–369.
Cao M. & Woodward F.I. (1998) Dynamic responses of terrestrialecosystem carbon cycling to global climate change.Nature393,249–252.
Carvalho J.A. Jr, Higuchi N., Araujo T.M. & Santos J.C. (1998)Combustion completeness in a rainforest clearing experiment inManaus, Brazil.Journal of Geophysical Research-Atmospheres103,13195–13199.
Cayan D.R. (1996) Interannual climate variability and snowpack inthe Western United States.Journal of Climate9, 928–948.
Cerling T.E., Harris J.M., MacFadden B.J., Leakey M.G., Quade J.,Eisenmann V. & Ehleringer J.R. (1997) Global vegetationchange through the Miocene/Pliocene boundary.Nature 389,153–158.
Chang K.-C. (1986)The Archaeology of Ancient China, 4th edn.Yale University Press, New Haven, CT.
Ciais P., Tans P.P., Trolier M., White J.W.C. & Francey R.J. (1995)A large northern hemisphere terrestrial CO2 sink indicated by the13C/12C ratio of atmospheric CO2. Science269,1098–1102.
Clark D.A. & Clark D.B. (1994) Climate-induced annual variationin canopy tree growth in a Costa Rican tropical rain forest,Journal of Ecology82,865–872.
Colinvaux P.A., de Oliveira P.E., Moreno J.E., Miller M.C. & BushM.B. (1996) A long pollen record from lowland Amazonia – for-est and cooling in glacial times.Science274,85–88.
Correa J.C. (1984) Características físico hídricas dos soloslatosollo amarelo, podzolico vermelho amarelo e podzolhidromórfico do estado do Amazonas.Pesquisa AgropecuariaBrasileira20,1317–1322.
Crawford T.L., Dobosy R.J., McMillen R.T., Vogel C.A. & HicksB.B. (1996) Air-surface exchange measurements in heteroge-neous regions – extending tower observations with spatialstructure observed from small aircraft.Global Change Biology2, 275–285.
Crowley T.J. (1995) Ice-age terrestrial carbon changes revisited.Global Biogeochemical Cycles9, 377–389.
Culf A.D., Fisch G., Malhi Y., Nobre A., Filho A.M., Gash J. &Grace J. (1999) Carbon dioxide concentration measurements inthe nocturnal boundary layer over Amazonian tropical forest.Hydrology and Earth System Sciencesin press.
Denmead O.T., Raupach M.R., Dunin F.X., Cleugh H.A. &Leuning R. (1996) Boundary layer budgets for regional estimatesof scalar fluxes.Global Change Biology2, 255–264.
Denning A.S., Fung I.Y. & Randall D. (1995) Latitudinal gradientof atmospheric CO2 due to seasonal exchange with land biota.Nature376,240–243.
Dixon R.K., Brown S., Houghton R.A., Solomon A.M., TrexlerM.C. & Wisniewski J. (1994) Carbon pools and flux of globalforest ecosystems.Science263,185–190.
Duff S.M.G., Sarath G. & Plaxton W.C. (1994) The role of acidphosphatases in plant phosphorous metabolism.PhysiologiaPlantarum90,791–800.
Edwards N.T., Johnson D.W., McLaughlin S.B. & Harris W.F.(1989) Carbon dynamics and productivity. In Analysis ofBiogeochemical Cycling Processes in Walker Branch Water-shed (eds D.W. Johnson & R.I. van Hook). Springer-Verlag,New York.
Enting I.G. & Mansbridge J.V. (1991) Latitudinal distribution ofsources and sinks of CO2: results of an inversion study.Tellus43B,156–170.
Enting I.G., Trudinger C.M. & Francey R.J. (1995) A synthesisinversion of the concentration and δ13C of atmospheric CO2.Tellus47B,35–52.
Fan S., Gloor M., Mahlman J., Pacala S., Sarmiento J., Takahashi T.& Tans P. (1998) Atmospheric and oceanic CO2 data and models
736 Y. Malhi et al.
© 1999 Blackwell Science Ltd, Plant, Cell and Environment,22, 715–740
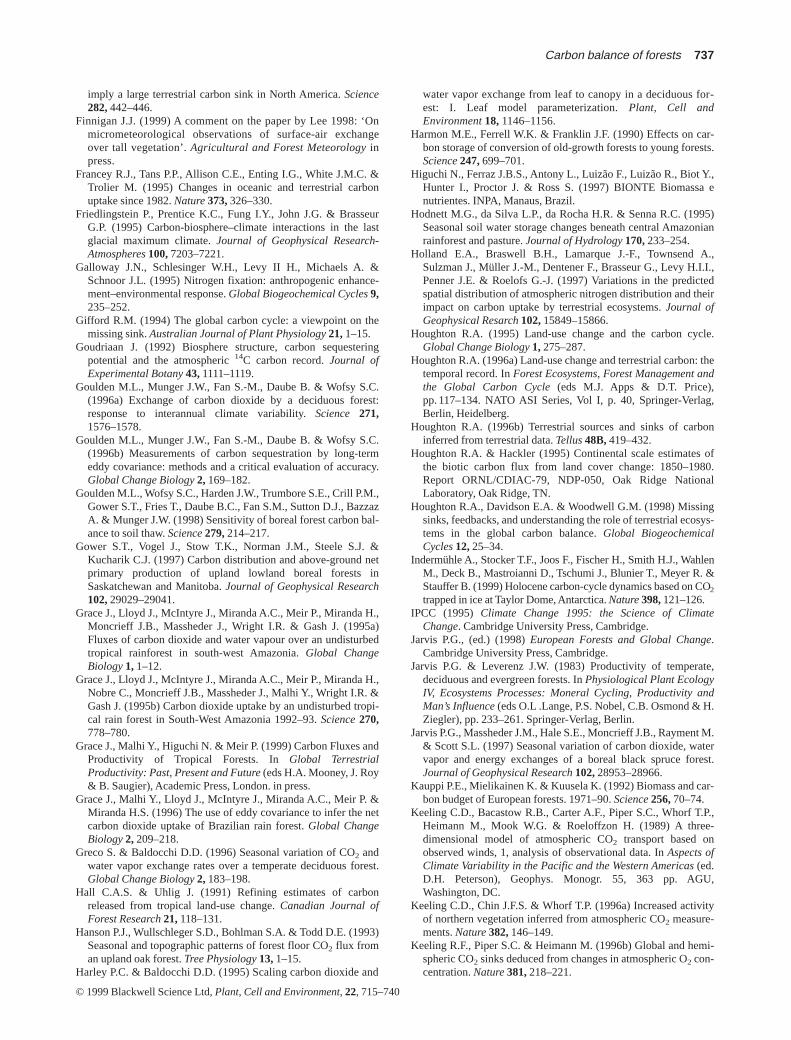
imply a large terrestrial carbon sink in North America. Science282, 442–446.
Finnigan J.J. (1999) A comment on the paper by Lee 1998: ‘Onmicrometeorological observations of surface-air exchangeover tall vegetation’. Agricultural and Forest Meteorologyinpress.
Francey R.J., Tans P.P., Allison C.E., Enting I.G., White J.M.C. &Trolier M. (1995) Changes in oceanic and terrestrial carbonuptake since 1982.Nature373,326–330.
Friedlingstein P., Prentice K.C., Fung I.Y., John J.G. & BrasseurG.P. (1995) Carbon-biosphere–climate interactions in the lastglacial maximum climate. Journal of Geophysical Research-Atmospheres100,7203–7221.
Galloway J.N., Schlesinger W.H., Levy II H., Michaels A. &Schnoor J.L. (1995) Nitrogen fixation: anthropogenic enhance-ment–environmental response. Global Biogeochemical Cycles 9,235–252.
Gifford R.M. (1994) The global carbon cycle: a viewpoint on themissing sink.Australian Journal of Plant Physiology21,1–15.
Goudriaan J. (1992) Biosphere structure, carbon sequesteringpotential and the atmospheric 14C carbon record.Journal ofExperimental Botany43,1111–1119.
Goulden M.L., Munger J.W., Fan S.-M., Daube B. & Wofsy S.C.(1996a) Exchange of carbon dioxide by a deciduous forest:response to interannual climate variability.Science 271,1576–1578.
Goulden M.L., Munger J.W., Fan S.-M., Daube B. & Wofsy S.C.(1996b) Measurements of carbon sequestration by long-termeddy covariance: methods and a critical evaluation of accuracy.Global Change Biology2, 169–182.
Goulden M.L., Wofsy S.C., Harden J.W., Trumbore S.E., Crill P.M.,Gower S.T., Fries T., Daube B.C., Fan S.M., Sutton D.J., BazzazA. & Munger J.W. (1998) Sensitivity of boreal forest carbon bal-ance to soil thaw.Science279,214–217.
Gower S.T., Vogel J., Stow T.K., Norman J.M., Steele S.J. &Kucharik C.J. (1997) Carbon distribution and above-ground netprimary production of upland lowland boreal forests inSaskatchewan and Manitoba.Journal of Geophysical Research102,29029–29041.
Grace J., Lloyd J., McIntyre J., Miranda A.C., Meir P., Miranda H.,Moncrieff J.B., Massheder J., Wright I.R. & Gash J. (1995a)Fluxes of carbon dioxide and water vapour over an undisturbedtropical rainforest in south-west Amazonia.Global ChangeBiology1, 1–12.
Grace J., Lloyd J., McIntyre J., Miranda A.C., Meir P., Miranda H.,Nobre C., Moncrieff J.B., Massheder J., Malhi Y., Wright I.R. &Gash J. (1995b) Carbon dioxide uptake by an undisturbed tropi-cal rain forest in South-West Amazonia 1992–93.Science270,778–780.
Grace J., Malhi Y., Higuchi N. & Meir P. (1999) Carbon Fluxes andProductivity of Tropical Forests. In Global TerrestrialProductivity: Past, Present and Future (eds H.A. Mooney, J. Roy& B. Saugier), Academic Press, London. in press.
Grace J., Malhi Y., Lloyd J., McIntyre J., Miranda A.C., Meir P. &Miranda H.S. (1996) The use of eddy covariance to infer the netcarbon dioxide uptake of Brazilian rain forest.Global ChangeBiology2, 209–218.
Greco S. & Baldocchi D.D. (1996) Seasonal variation of CO2 andwater vapor exchange rates over a temperate deciduous forest.Global Change Biology2, 183–198.
Hall C.A.S. & Uhlig J. (1991) Refining estimates of carbonreleased from tropical land-use change.Canadian Journal ofForest Research21,118–131.
Hanson P.J., Wullschleger S.D., Bohlman S.A. & Todd D.E. (1993)Seasonal and topographic patterns of forest floor CO2 flux froman upland oak forest.Tree Physiology13,1–15.
Harley P.C. & Baldocchi D.D. (1995) Scaling carbon dioxide and
water vapor exchange from leaf to canopy in a deciduous for-est: I. Leaf model parameterization.Plant, Cell andEnvironment18,1146–1156.
Harmon M.E., Ferrell W.K. & Franklin J.F. (1990) Effects on car-bon storage of conversion of old-growth forests to young forests.Science247,699–701.
Higuchi N., Ferraz J.B.S., Antony L., Luizão F., Luizão R., Biot Y.,Hunter I., Proctor J. & Ross S. (1997) BIONTE Biomassa enutrientes. INPA, Manaus, Brazil.
Hodnett M.G., da Silva L.P., da Rocha H.R. & Senna R.C. (1995)Seasonal soil water storage changes beneath central Amazonianrainforest and pasture. Journal of Hydrology170, 233–254.
Holland E.A., Braswell B.H., Lamarque J.-F., Townsend A.,Sulzman J., Müller J.-M., Dentener F., Brasseur G., Levy H.I.I.,Penner J.E. & Roelofs G.-J. (1997) Variations in the predictedspatial distribution of atmospheric nitrogen distribution and theirimpact on carbon uptake by terrestrial ecosystems.Journal ofGeophysical Resarch102,15849–15866.
Houghton R.A. (1995) Land-use change and the carbon cycle.Global Change Biology1, 275–287.
Houghton R.A. (1996a) Land-use change and terrestrial carbon: thetemporal record. In Forest Ecosystems, Forest Management andthe Global Carbon Cycle (eds M.J. Apps & D.T. Price),pp. 117–134. NATO ASI Series, Vol I, p. 40, Springer-Verlag,Berlin, Heidelberg.
Houghton R.A. (1996b) Terrestrial sources and sinks of carboninferred from terrestrial data.Tellus48B,419–432.
Houghton R.A. & Hackler (1995) Continental scale estimates ofthe biotic carbon flux from land cover change: 1850–1980.Report ORNL/CDIAC-79, NDP-050, Oak Ridge NationalLaboratory, Oak Ridge, TN.
Houghton R.A., Davidson E.A. & Woodwell G.M. (1998) Missingsinks, feedbacks, and understanding the role of terrestrial ecosys-tems in the global carbon balance.Global BiogeochemicalCycles12,25–34.
Indermühle A., Stocker T.F., Joos F., Fischer H., Smith H.J., WahlenM., Deck B., Mastroianni D., Tschumi J., Blunier T., Meyer R. &Stauffer B. (1999) Holocene carbon-cycle dynamics based on CO2
trapped in ice at Taylor Dome, Antarctica. Nature 398,121–126.IPCC (1995) Climate Change 1995: the Science of Climate
Change. Cambridge University Press, Cambridge.Jarvis P.G., (ed.) (1998) European Forests and Global Change.
Cambridge University Press, Cambridge.Jarvis P.G. & Leverenz J.W. (1983) Productivity of temperate,
deciduous and evergreen forests. In Physiological Plant EcologyIV, Ecosystems Processes: Moneral Cycling, Productivity andMan’s Influence (eds O.L .Lange, P.S. Nobel, C.B. Osmond & H.Ziegler), pp. 233–261. Springer-Verlag, Berlin.
Jarvis P.G., Massheder J.M., Hale S.E., Moncrieff J.B., Rayment M.& Scott S.L. (1997) Seasonal variation of carbon dioxide, watervapor and energy exchanges of a boreal black spruce forest.Journal of Geophysical Research102,28953–28966.
Kauppi P.E., Mielikainen K. & Kuusela K. (1992) Biomass and car-bon budget of European forests. 1971–90.Science256,70–74.
Keeling C.D., Bacastow R.B., Carter A.F., Piper S.C., Whorf T.P.,Heimann M., Mook W.G. & Roeloffzon H. (1989) A three-dimensional model of atmospheric CO2 transport based onobserved winds, 1, analysis of observational data. In Aspects ofClimate Variability in the Pacific and the Western Americas (ed.D.H. Peterson), Geophys. Monogr. 55, 363 pp. AGU,Washington, DC.
Keeling C.D., Chin J.F.S. & Whorf T.P. (1996a) Increased activityof northern vegetation inferred from atmospheric CO2 measure-ments.Nature382,146–149.
Keeling R.F., Piper S.C. & Heimann M. (1996b) Global and hemi-spheric CO2 sinks deduced from changes in atmospheric O2 con-centration.Nature381,218–221.
Carbon balance of forests 737
© 1999 Blackwell Science Ltd, Plant, Cell and Environment,22, 715–740
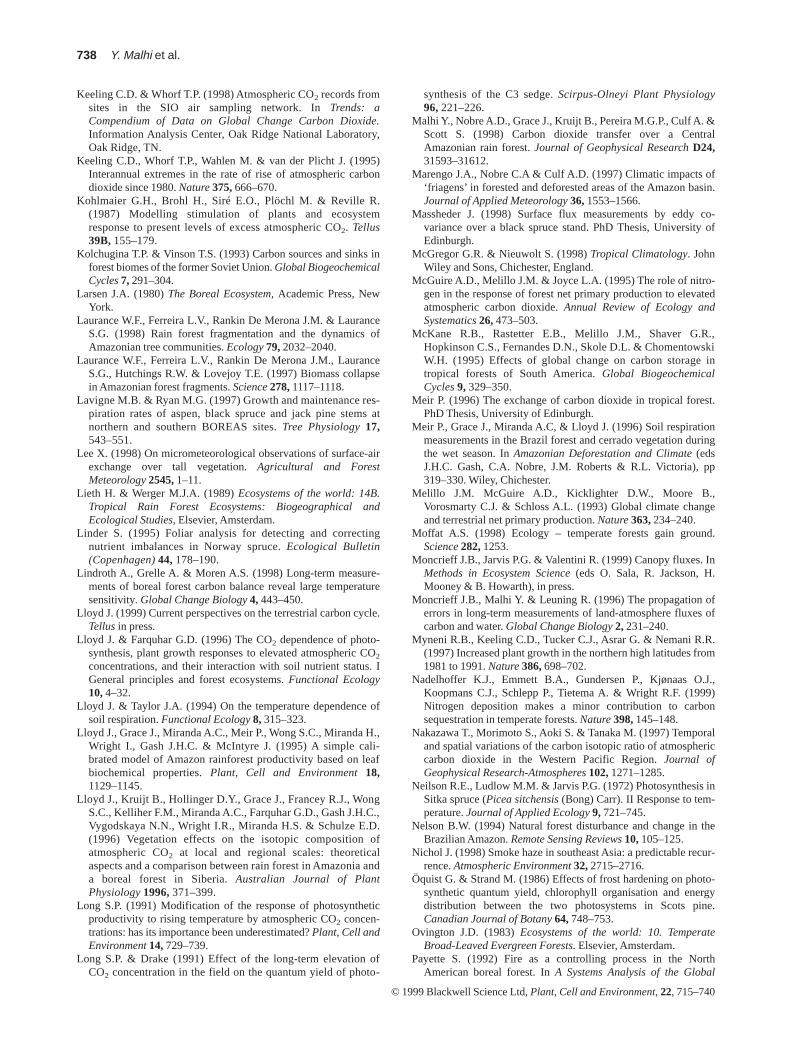
Keeling C.D. & Whorf T.P. (1998) Atmospheric CO2 records fromsites in the SIO air sampling network. In Trends: aCompendium of Data on Global Change Carbon Dioxide.Information Analysis Center, Oak Ridge National Laboratory,Oak Ridge, TN.
Keeling C.D., Whorf T.P., Wahlen M. & van der Plicht J. (1995)Interannual extremes in the rate of rise of atmospheric carbondioxide since 1980.Nature375,666–670.
Kohlmaier G.H., Brohl H., Siré E.O., Plöchl M. & Reville R.(1987) Modelling stimulation of plants and ecosystemresponse to present levels of excess atmospheric CO2. Tellus39B,155–179.
Kolchugina T.P. & Vinson T.S. (1993) Carbon sources and sinks inforest biomes of the former Soviet Union.Global BiogeochemicalCycles7,291–304.
Larsen J.A. (1980)The Boreal Ecosystem, Academic Press, NewYork.
Laurance W.F., Ferreira L.V., Rankin De Merona J.M. & LauranceS.G. (1998) Rain forest fragmentation and the dynamics ofAmazonian tree communities.Ecology79, 2032–2040.
Laurance W.F., Ferreira L.V., Rankin De Merona J.M., LauranceS.G., Hutchings R.W. & Lovejoy T.E. (1997) Biomass collapsein Amazonian forest fragments.Science278,1117–1118.
Lavigne M.B. & Ryan M.G. (1997) Growth and maintenance res-piration rates of aspen, black spruce and jack pine stems atnorthern and southern BOREAS sites.Tree Physiology17,543–551.
Lee X. (1998) On micrometeorological observations of surface-airexchange over tall vegetation.Agricultural and ForestMeteorology2545,1–11.
Lieth H. & Werger M.J.A. (1989) Ecosystems of the world: 14B.Tropical Rain Forest Ecosystems: Biogeographical andEcological Studies, Elsevier, Amsterdam.
Linder S. (1995) Foliar analysis for detecting and correctingnutrient imbalances in Norway spruce. Ecological Bulletin(Copenhagen)44,178–190.
Lindroth A., Grelle A. & Moren A.S. (1998) Long-term measure-ments of boreal forest carbon balance reveal large temperaturesensitivity. Global Change Biology4, 443–450.
Lloyd J. (1999) Current perspectives on the terrestrial carbon cycle.Tellusin press.
Lloyd J. & Farquhar G.D. (1996) The CO2 dependence of photo-synthesis, plant growth responses to elevated atmospheric CO2
concentrations, and their interaction with soil nutrient status. IGeneral principles and forest ecosystems.Functional Ecology10,4–32.
Lloyd J. & Taylor J.A. (1994) On the temperature dependence ofsoil respiration.Functional Ecology8, 315–323.
Lloyd J., Grace J., Miranda A.C., Meir P., Wong S.C., Miranda H.,Wright I., Gash J.H.C. & McIntyre J. (1995) A simple cali-brated model of Amazon rainforest productivity based on leafbiochemical properties.Plant, Cell and Environment18,1129–1145.
Lloyd J., Kruijt B., Hollinger D.Y., Grace J., Francey R.J., WongS.C., Kelliher F.M., Miranda A.C., Farquhar G.D., Gash J.H.C.,Vygodskaya N.N., Wright I.R., Miranda H.S. & Schulze E.D.(1996) Vegetation effects on the isotopic composition ofatmospheric CO2 at local and regional scales: theoreticalaspects and a comparison between rain forest in Amazonia anda boreal forest in Siberia.Australian Journal of PlantPhysiology1996,371–399.
Long S.P. (1991) Modification of the response of photosyntheticproductivity to rising temperature by atmospheric CO2 concen-trations: has its importance been underestimated?Plant, Cell andEnvironment14,729–739.
Long S.P. & Drake (1991) Effect of the long-term elevation ofCO2 concentration in the field on the quantum yield of photo-
synthesis of the C3 sedge. Scirpus-Olneyi Plant Physiology96,221–226.
Malhi Y., Nobre A.D., Grace J., Kruijt B., Pereira M.G.P., Culf A. &Scott S. (1998) Carbon dioxide transfer over a CentralAmazonian rain forest.Journal of Geophysical Research D24,31593–31612.
Marengo J.A., Nobre C.A & Culf A.D. (1997) Climatic impacts of‘friagens’ in forested and deforested areas of the Amazon basin.Journal of Applied Meteorology 36,1553–1566.
Massheder J. (1998) Surface flux measurements by eddy co-variance over a black spruce stand. PhD Thesis, University ofEdinburgh.
McGregor G.R. & Nieuwolt S. (1998) Tropical Climatology. JohnWiley and Sons, Chichester, England.
McGuire A.D., Melillo J.M. & Joyce L.A. (1995) The role of nitro-gen in the response of forest net primary production to elevatedatmospheric carbon dioxide. Annual Review of Ecology andSystematics26,473–503.
McKane R.B., Rastetter E.B., Melillo J.M., Shaver G.R.,Hopkinson C.S., Fernandes D.N., Skole D.L. & ChomentowskiW.H. (1995) Effects of global change on carbon storage intropical forests of South America. Global BiogeochemicalCycles9, 329–350.
Meir P. (1996) The exchange of carbon dioxide in tropical forest.PhD Thesis, University of Edinburgh.
Meir P., Grace J., Miranda A.C, & Lloyd J. (1996) Soil respirationmeasurements in the Brazil forest and cerrado vegetation duringthe wet season. In Amazonian Deforestation and Climate(edsJ.H.C. Gash, C.A. Nobre, J.M. Roberts & R.L. Victoria), pp319–330. Wiley, Chichester.
Melillo J.M. McGuire A.D., Kicklighter D.W., Moore B.,Vorosmarty C.J. & Schloss A.L. (1993) Global climate changeand terrestrial net primary production. Nature363,234–240.
Moffat A.S. (1998) Ecology – temperate forests gain ground.Science282,1253.
Moncrieff J.B., Jarvis P.G. & Valentini R. (1999) Canopy fluxes. InMethods in Ecosystem Science(eds O. Sala, R. Jackson, H.Mooney & B. Howarth), in press.
Moncrieff J.B., Malhi Y. & Leuning R. (1996) The propagation oferrors in long-term measurements of land-atmosphere fluxes ofcarbon and water. Global Change Biology2, 231–240.
Myneni R.B., Keeling C.D., Tucker C.J., Asrar G. & Nemani R.R.(1997) Increased plant growth in the northern high latitudes from1981 to 1991. Nature386,698–702.
Nadelhoffer K.J., Emmett B.A., Gundersen P., Kjønaas O.J.,Koopmans C.J., Schlepp P., Tietema A. & Wright R.F. (1999)Nitrogen deposition makes a minor contribution to carbonsequestration in temperate forests. Nature398, 145–148.
Nakazawa T., Morimoto S., Aoki S. & Tanaka M. (1997) Temporaland spatial variations of the carbon isotopic ratio of atmosphericcarbon dioxide in the Western Pacific Region. Journal ofGeophysical Research-Atmospheres102,1271–1285.
Neilson R.E., Ludlow M.M. & Jarvis P.G. (1972) Photosynthesis inSitka spruce (Picea sitchensis(Bong) Carr). II Response to tem-perature.Journal of Applied Ecology9, 721–745.
Nelson B.W. (1994) Natural forest disturbance and change in theBrazilian Amazon. Remote Sensing Reviews10,105–125.
Nichol J. (1998) Smoke haze in southeast Asia: a predictable recur-rence. Atmospheric Environment32,2715–2716.
Öquist G. & Strand M. (1986) Effects of frost hardening on photo-synthetic quantum yield, chlorophyll organisation and energydistribution between the two photosystems in Scots pine.Canadian Journal of Botany64,748–753.
Ovington J.D. (1983) Ecosystems of the world: 10. TemperateBroad-Leaved Evergreen Forests. Elsevier, Amsterdam.
Payette S. (1992) Fire as a controlling process in the NorthAmerican boreal forest. In A Systems Analysis of the Global
738 Y. Malhi et al.
© 1999 Blackwell Science Ltd, Plant, Cell and Environment,22, 715–740
Boreal Forest(ed. H.H. Shugart, R. Leemans & G.B. Bonan),Cambridge University Press, Cambridge.
Peixoto J.P. & Oort A.H. (1996) The climatology of relative humid-ity in the atmosphere.Journal of Climate9, 3443–3463.
Perlin J. (1989) A Forest Journey: the Role of Wood in theDevelopment of Civilization. Harvard University Press,Cambridge, MA.
Phillips O.L., Malhi Y., Higuchi N., Laurance W.F., Nuñez V.P.,Vasquez M.R., Laurance S.G., Ferreira L.V., Stern M., Brown S.& Grace J. (1998) Changes in the carbon balance of tropicalforests: evidence from long-term plots.Science282,439–442.
Piperno D.R. & Becker P. (1996) Vegetational history of a site in theCentral Amazon Basin derived from phytolith and charcoalrecords from natural soils.Quaternary Research45,202–209.
Polglase P.J. & Wang Y.P. (1992) Potential CO2 enhanced storageby the terrestrial biosphere.Australian Journal of Botany40,641–656.
Post W.M., Emanuel W.R., Zinke P.J. & Stangenberger A.G.(1982) Soil carbon pools and world life zones.Nature 298,156–159.
Prentice I.C., Sykes M.T., Lautenschlager M., Harrison S.P.,Denissenko O. & Bartlein P.J. (1994) Modelling global vegeta-tion patterns and terrestrial carbon storage at the Last GlacialMaximum. Global Ecological Biogeographical Letters3,67–76.
Prioul J.L. & Chartier P. (1977) Partitioning of transfer andcarboxylation components of intracellular resistance to photo-synthetic CO2 fixation: a critical analysis of the methods used.Annals of Botany41,789–800.
Raich J.W. & Schlesinger W.H. (1992) The global carbon dioxideflux in soil respiration and its relationship to vegetation and cli-mate.Tellus44B,81–99.
Rayment M.B. (1998) Carbon and water fluxes in a boreal forestecosystem. PhD Thesis, University of Edinburgh.
Rayment M.B. & Jarvis P.G. (1999a) Long-term measurement ofphotosynthesis, respiration and transpiration of black spruce.Canadian Journal of Forest Researchin press.
Rayment M.B. & Jarvis P.G. (1999b) Temporal and spatial variationof soil respiration in a Canadian boreal forest. Soil Biology andBiochemistryin press.
Rayment M.B. & Jarvis P.G. (1999c) Photosynthesis and respira-tion of black spruce at three organisational scales: shoot, branchand canopy. Plant, Cell and Environment in press.
Rayment M.B. & Jarvis P.G. (1997) An improved open chambersystem for measuring CO2 fluxes in the field. Journal ofGeophysical Research D24,28779–28784.
Rayner P.J., Enting I.G., Francey R.J. & Langenfelds R. (1998)Reconstructing the carbon cycle from atmospheric CO2, δ 13Cand O2/N2 observations.Tellusin press.
Röhrig E. & Ulrich B. (1991) Ecosystems of the world: 7.Temperate Deciduous Forests. Elsevier, Amsterdam.
Ropelewski C.F. & Halpert M.S. (1987) Global and regional scaleprecipitation patterns associated with the El-Nino southern oscil-lation.Monthly Weather Review115,1606–1626.
Ruimy A., Jarvis P.G., Baldocchi D.D. & Saugier B. (1995) CO2
fluxes over plant canopies and solar radiation: a review.Advances in Ecological Research26,1–81.
Sanchez P.A. (1989) Soils. In Tropical Rain Forest Ecosystems:Biogeographical and Ecological Studies (eds H. Lieth & M.J.A.Werger), pp. 132–161. Elsevier, New York.
Sandford A.P. & Jarvis P.G. (1986) Stomatal responses to humidityin selected conifers.Tree Physiology2, 89–103.
Schimel D.S. (1995) Terrestrial ecosystems and the global carboncycle.Global Change Biology1, 77–91.
Schulze E.-D. (1989) Air-pollution and forest decline in a spruce(Picea-Abies) forest.Science244,776–783.
Schulze E.-D., Lloyd J., Kelliher F.M., Wirth C., Rebmann C.,
Lühker B., Mund M., Milukova I., Schulze W., Ziegler W.,Varlagin A., Sogachov A., Valentini R., Dore S., Grigoriev S.,Kolle O. & Vygodskaya N.N. (1999) Productivity of forests inthe Eurosiberian boreal region and their potential to act as acarbon sink – a synthesis of existing knowledge and originaldata.Global Change Biologyin press.
Scurlock J.M.O. & Hall D.O. (1998) The global carbon sink: agrassland perspective.Global Change Biology4, 229–233.
Sellers P.J. et al. (1997) BOREAS in 1997: experiment overview,scientific results, and future directions.Journal of GeophysicalResearchD24,28731–28769.
Sellers P.J., Berry J.A., Collatz G.J., Field C.F. & Hall F.G. (1992)Canopy reflectance, photosynthesis, and transpiration. III. Areanalysis using improved leaf models and a new canopy integra-tion scheme.Remote Sensing Environment42,187–216.
Shuttleworth W.J. (1988) Evaporation from Amazonian rain-forest. Proceedings of the Royal Society of LondonB 233,321–346.
Skole D.L. & Tucker C.J. (1993) Tropical deforestation and habitatfragmentation in the Amazon: satellite data from 1978 to 1988.Science260,1905–1910.
Smeck N.E. (1985) Phosphorus dynamics in soils and landscapes.Geoderma36,185–199.
Sotta E.D. (1998) Fluxo de CO2 entre solo e atmosfera em florestatropical umida da Amazônia central. MSc Thesis, INPA,Manaus, Brazil.
Spiecker H., Mielikäinen K., Köhl M. & Skovsgaard J. (eds)(1996) Growth Trends in European Forests, Springer-Verlag,Berlin, Heidelberg.
Staddon P.L. & Fitter A.H. (1998) Does elevated carbon dioxideaffect arbuscular mycorrhizas?Trends in Ecology and Evolution13,455–458.
Steele S.J., Gower S.T., Vogel J.G. & Norman J.M. (1997) Rootmass, net primary production and turnover in aspen, jack pineand black spruce forests in Saskatchewan and Manitoba, Canada.Tree Physiology17,577–587.
Steffen W. et al. (1998) The terrestrial carbon cycle: implicationsfor the Kyoto Protocol.Science280,1393–1394.
Strand M. & Lundmark T. (1995) Recovery of photosynthesis in 1-year old needles of unfertilized and fertilized Norway Spruce(Picea Abies(L.) Karst) during spring. Tree Physiology15,151–158.
Strand M. & Öquist G. (1985) Inhibition of photosynthesis byfreezing temperatures and high light levels in cold-acclimatedseedlings of Scots pine (Pinus sylvestris). I. Effects on the light-limited and light-saturated rates of CO2 assimilation.Physiologia Plantarum64,425–430.
Tans P.P., Fung I.Y. & Takahashi T. (1990) Observational con-straints on the global atmospheric CO2 budget.Science247,1431–1438.
Taylor J.A. & Lloyd J. (1992) Sources and sinks of CO2. AustralianJournal of Botany40,407–417.
Townsend A.R., Braswell B.H., Holland E.A. & Penner J.E.(1996) Spatial and temporal patterns in terrestrial carbon stor-age due to deposition of fossil fuel nitrogen.EcologicalApplications6, 806–814.
Turner D.P., Koerper G.J., Harmon M.E. & Lee J.J. (1995) A carbonbudget for forests of the conterminous United States. EcologicalApplications 5, 421–436.
Valentini R., DeAngelis P., Matteucci G., Monaco R., Dore S. &Mugnozza G.E.S. (1996) Seasonal net carbon dioxide exchangeof a beech forest with the atmosphere. Global Change Biology2,199–207.
Vitousek P.M. & Sandford R.L. (1986) Nutrient cycling in moisttropical forest.Annual Review of Ecology and Systematics17,137–167.
Vogt K.A., Grier C.C. & Vogt D.J. (1986) Production, turnover, and
Carbon balance of forests 739
© 1999 Blackwell Science Ltd, Plant, Cell and Environment,22, 715–740
nutrient dynamics of above- and below-ground detritus of worldforests. In Advances in Ecological Research (eds A. MacFadyen& E.D. Ford), pp. 303–377. Academic Press, San Diego.
Wang Y.P. & Jarvis P.J. (1990) Influence of crown structural proper-ties on PAR absorption, photosynthesis and transpiration in Sitkaspruce – application of a model (MAESTRO).Tree Physiology7,297–316.
Wang Y.P. & Polglase P.J. (1995) Carbon balance in the tundra,boreal forest and humid tropical forest during climate change:scaling up from leaf physiology and soil carbon dynamics.Plant,Cell and Environment18,1226–1244.
Wang Y.P., Rey A. & Jarvis P.G. (1998) Carbon balance of youngbirch trees grown in ambient and elevated atmospheric CO2 con-centrations.Global Change Biology4, 797–807.
Waring R.H. & Running S.W. (1978) Sapwood water storage: itscontribution to transpiration and effect upon water conductancethrough the stems of old-growth Douglas fir.Plant, Cell andEnvironment1, 131–140.
Whitehead D. & Jarvis P.G. (1981) Coniferous forests and planta-
tions. In: Water Deficits and Plant Growth(ed. T.T. Kozlowski),Vol VI, pp. 49–152. Academic Press, San Diego.
Whitmore T.M., Turner B.L. II, Johnson D.L., Kates R.W. &Gottschang T.R. (1990) Long-term population change. In TheEarth as Transformed by Human Action (eds B.L. Turner II,W.C. Clark, R.W. Kates, J.F. Richards, J.T. Mathews & W.B.Meyer), pp. 25–39. Cambridge University Press, Cambridge.
Williams M. (1990) Forests. In The Earth as Transformed byHuman Action (eds B.L. Turner II, W.C. Clark R.W. Kates J.F.Richards J.T.Mathews & W.B. Meyer), pp. 179–201. CambridgeUniversity Press, Cambridge.
Williams T.G. & Flanagan L.B. (1998) Measuring and modellingenvironmental influences on photosynthetic gas exchange inSphagnumand Pleurozium. Plant, Cell and Environment21,555–564.
Williams M., Malhi Y., Nobre A.D., Rastetter E.B., Grace J. &Pereira M.G.P. (1998) Seasonal variation in net carbon exchangeand evapotranspiration in a Brazilian rain forest: a modellinganalysis.Plant, Cell and Environment21, 953–968.
740 Y. Malhi et al.
© 1999 Blackwell Science Ltd, Plant, Cell and Environment,22, 715–740