the canadian immigration system: some history, facts & stats all information adapted from ‘the...
TRANSCRIPT

The Canadian Immigration System:Some History, Facts & Stats
All information adapted from ‘the public policy framework- fostering immigration’, York University, 2012

Brainstorm
Why does Canada need immigrants?

We need them possibly because…
1. Supplement populations low natural increase rate2. Replace Canadians who leave & work abroad3. Increase the supply of skilled workers4. Enrich our culture5. Aid our economy- let in rich immigrants6. Help those in need
Do you agree with these reasons?
Lets examine a little history, some facts & some stats…

A Little History on Canadian Immigration Policy:
“When I speak of quality, I have in mind something that is quite different from what is in the mind of the average writer or speaker upon the question of immigration. I think of a stalwart peasant in a sheep-skin coat, born on the soil, whose forefathers have been farmers for generations, with a stout wife and half-a-dozen children, is good quality.”
Sir Clifford Sifton, 1922

The beginning: 1867 –1913Main goals
1. Securing farmers from Western Europe
2. Settle Western Canada with farmers
The highest levels ever: 330,000 in 1911 and 400,000 in 1913.
3. Keep out the Chinese
Head tax on Chinese immigrants $100 then $500 then outlawed in 1923

"The Last, Best West"

Chinese Head Tax Certificate
A slow evolution in policy
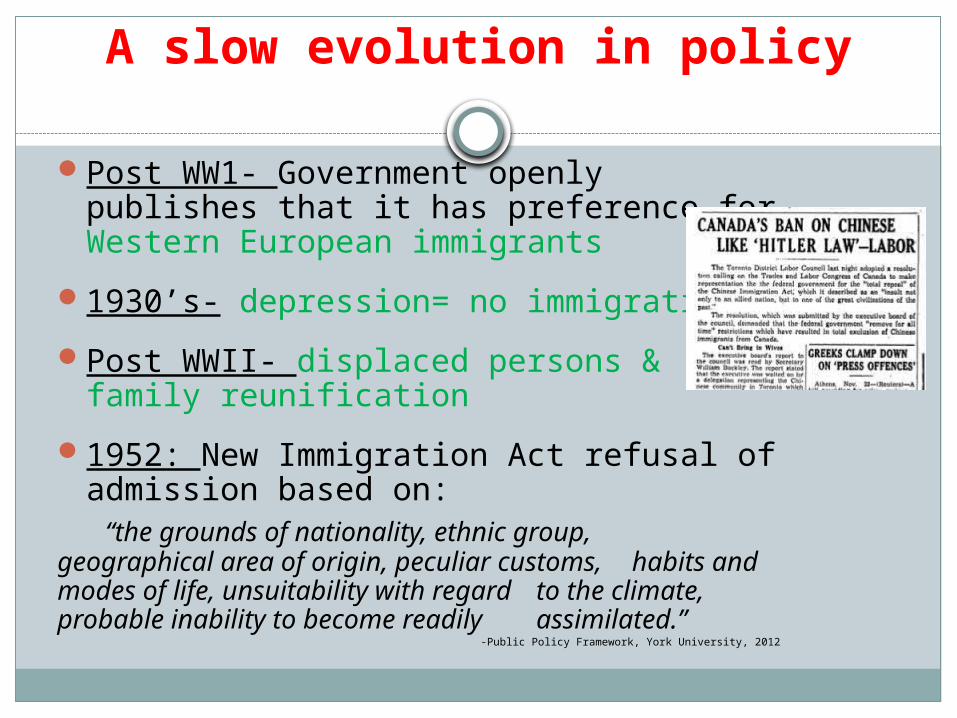
Post WW1- Government openly publishes that it has preference for Western European immigrants
1930’s- depression= no immigration
Post WWII- displaced persons & family reunification
1952: New Immigration Act refusal of admission based on:
“the grounds of nationality, ethnic group, geographical area of origin, peculiar customs, habits and modes of life, unsuitability with regard
to the climate, probable inability to become readily assimilated.”
-Public Policy Framework, York University, 2012
Postwar Immigration Policy
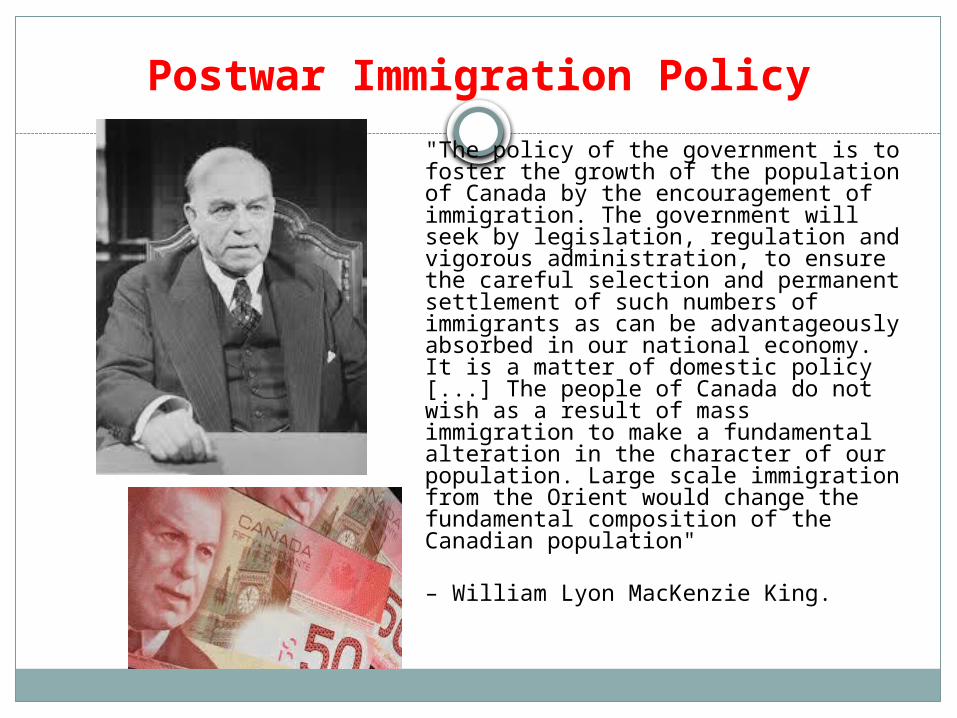
"The policy of the government is to foster the growth of the population of Canada by the encouragement of immigration. The government will seek by legislation, regulation and vigorous administration, to ensure the careful selection and permanent settlement of such numbers of immigrants as can be advantageously absorbed in our national economy. It is a matter of domestic policy [...] The people of Canada do not wish as a result of mass immigration to make a fundamental alteration in the character of our population. Large scale immigration from the Orient would change the fundamental composition of the Canadian population"
– William Lyon MacKenzie King.

Lose the Racism- 1960’s
1962: Canada abandoned its all White racist immigration policy
-Admission to be based on individual personal characteristics; not
nationality
1967: Point system created to facilitate and encourage the flow of skilled migrants

Immigration in Canada Today:Components of Immigration Intake
Family Reunification Members of the Family Class
Humanitarian Convention Refugees; Members of Designated Classes; Persons eligible under special humanitarian measures
Economic Business Immigrants: EntrepreneursSelf-employed persons InvestorsRetirees

Canadian Immigration in 2005:By Admissible Category
Economic 56.1%
Family 28.5%
Refugee 12.8%
Other 2.6%
Total Number ofImmigrants
262,157 (100%)

Selection Grid for Economic Immigrants (Point System)
Factor One: Education Maximum 25
Factor Two: Official Languages Maximum 24
1st Official Language Maximum 16
2nd Official Language Maximum 8
Factor Three: Experience Maximum 21
Factor Four: Age Maximum 10
Factor Five: Arranged Employment in Canada
Maximum 10
Factor Six: Adaptability Maximum 10
Total Maximum 100
Passing Mark 67

Selection Factor: Adaptability
Factor Six: Adaptability Maximum 10points
Spouse’s or common-law partner’s education 3 - 5
Minimum one year full-time authorized work in Canada
5
Minimum two years full-time authorized post-secondary study in Canada
5
Have received points under the Arranged Employment in Canada factor
5
Family relationship in Canada 5
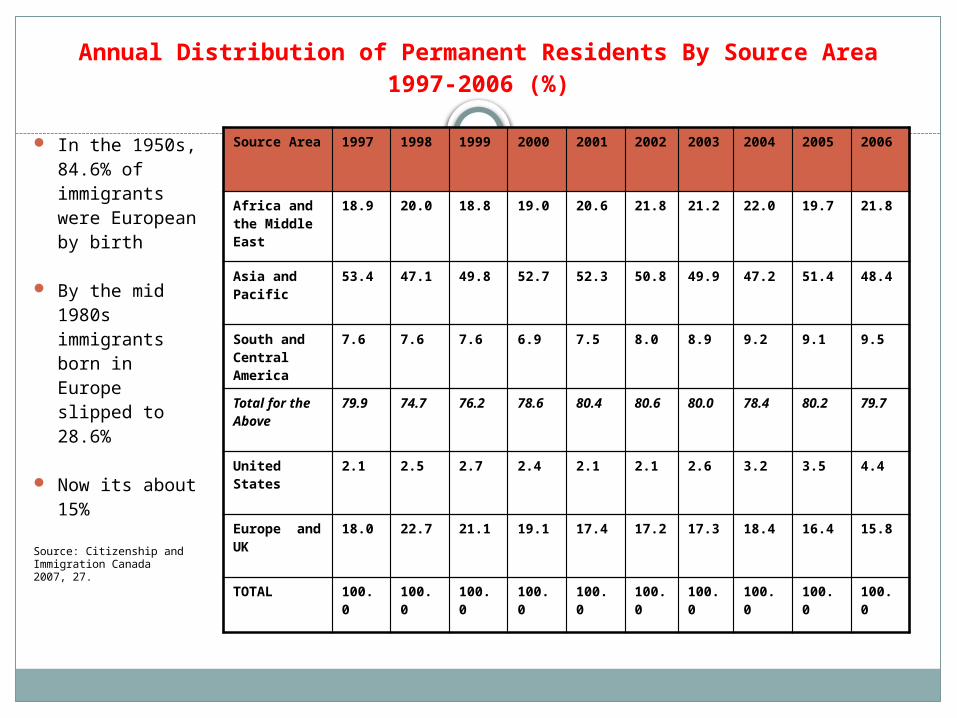
Annual Distribution of Permanent Residents By Source Area1997-2006 (%)
In the 1950s, 84.6% of immigrants were European by birth
By the mid 1980s immigrants born in Europe slipped to 28.6%
Now its about 15%
Source: Citizenship and Immigration Canada2007, 27.
Source Area 1997 1998 1999 2000 2001 2002 2003 2004 2005 2006
Africa and the Middle East
18.9 20.0 18.8 19.0 20.6 21.8 21.2 22.0 19.7 21.8
Asia and Pacific
53.4 47.1 49.8 52.7 52.3 50.8 49.9 47.2 51.4 48.4
South and Central America
7.6 7.6 7.6 6.9 7.5 8.0 8.9 9.2 9.1 9.5
Total for the Above
79.9 74.7 76.2 78.6 80.4 80.6 80.0 78.4 80.2 79.7
United States 2.1 2.5 2.7 2.4 2.1 2.1 2.6 3.2 3.5 4.4
Europe and UK
18.0 22.7 21.1 19.1 17.4 17.2 17.3 18.4 16.4 15.8
TOTAL 100.0 100.0 100.0 100.0 100.0 100.0 100.0 100.0 100.0 100.0

Canadian Immigration Source Countries 2005 Number of Immigrants
China 42,291
India 33,146
Philippines 17,525
Pakistan 13,576
United States 9,262
Columbia 6,031
United Kingdom 5,865
South Korea 5,819
Iran 5,502
France 5,430
Romania 4,964
Sri Lanka 4,690
Russia 3,607
Taiwan 3.092
Hong Kong 1,784
Yugoslavia (Former) 272
Top 10 Source Counties 144,447
Other 117,789
Total 262,236

Where do Permanent Residents settle in Canada?
Province/Territory 2005 %
Nova Scotia 1,929 0.7%
Other Atlantic Provinces* 1,918 0.7%
Quebec 43,308 16.5%
Ontario 140,533 53.6%
Manitoba 8,097 3.1%
Saskatchewan 2,106 0.8%
Alberta 19,399 7.4%
British Columbia 44,767 17.1%
Territories** 160 0.06%
Provinces/Territories not stated
19 >0.001%
Total 262,236
* Newfoundland andLabrador, NewBrunswick, PrinceEdward Island** Yukon, NorthwestTerritories, Nunavut

Salary GapDisparity in median incomes among recent immigrants
Recent Immigrants from 2001 to 2006
University educated, $26,301
Non-university educated, $19,280
Immigrants from 2000 and before:
University educated, $37,647
Non-University educated, $29,301
Canadian-born:
University educated, $57,695
Non-university educated, $39,586.

Brainstorm…
Is immigration good for Canada? Why/why not?

Canadian Multicultural Policy
• Introduced 1971, law in 1988
• Immigrants encouraged to keep cultural heritage
• Allocated federal funds to ethnic groups to help them preserve their culture

Brainstorm…
Is our multiculturalism policy good for Canada? Why/why not?