the business case for safety adding value and competitive advantage a joint initiative of osha,...
Post on 19-Dec-2015
214 views
TRANSCRIPT
THE BUSINESS CASETHE BUSINESS CASE FOR SAFETY FOR SAFETY
Adding Value and Competitive AdvantageAdding Value and Competitive Advantage
A Joint Initiative of OSHA, Abbott, and A Joint Initiative of OSHA, Abbott, and The Center for Business and Public Policy The Center for Business and Public Policy
at Georgetown Universityat Georgetown University March 2005March 2005
WHY BE CONCERNED WITH SAFETY?
– Safety is good business– Right thing to do…
– Employee morale / protection of most valuable resource
– Control costs (direct and indirect) – Safety and health excellence correlates with
business excellence (quality, efficiency, profitability)
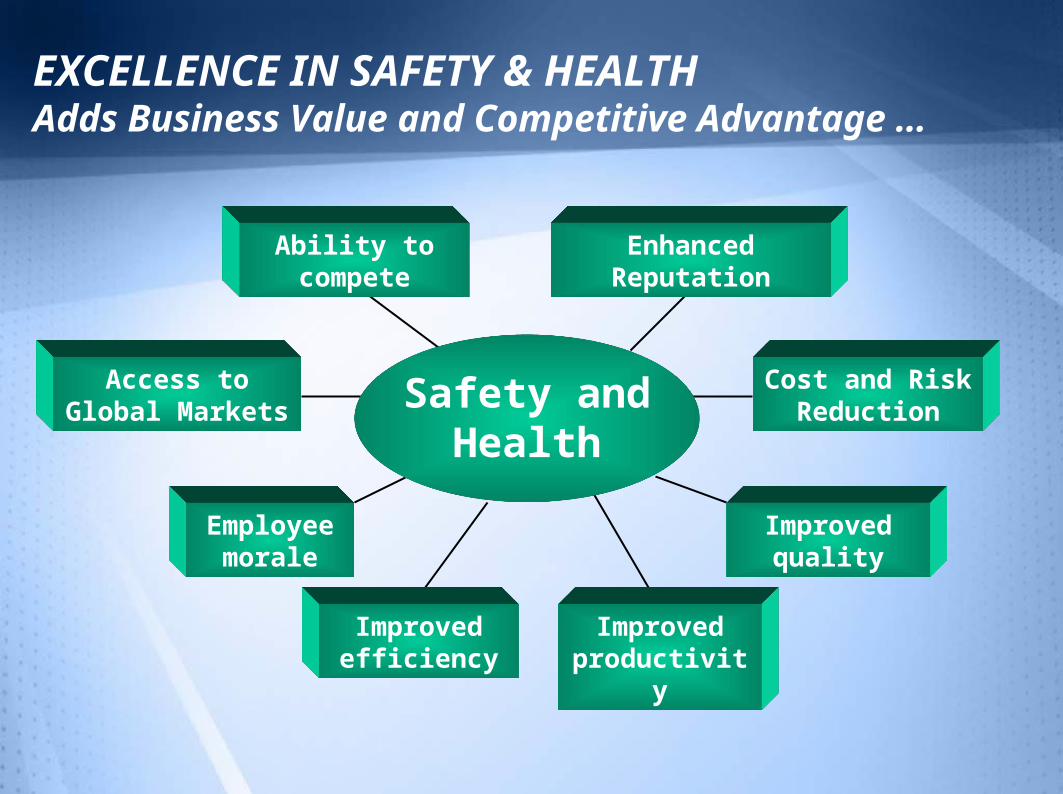
EXCELLENCE IN SAFETY & HEALTH Adds Business Value and Competitive Advantage …
Safety and Health
Ability to compete
Access to Global
Markets
Cost and Risk Reduction
Enhanced Reputation
Employee morale
Improved quality
Improved efficiency
Improved productivit
y
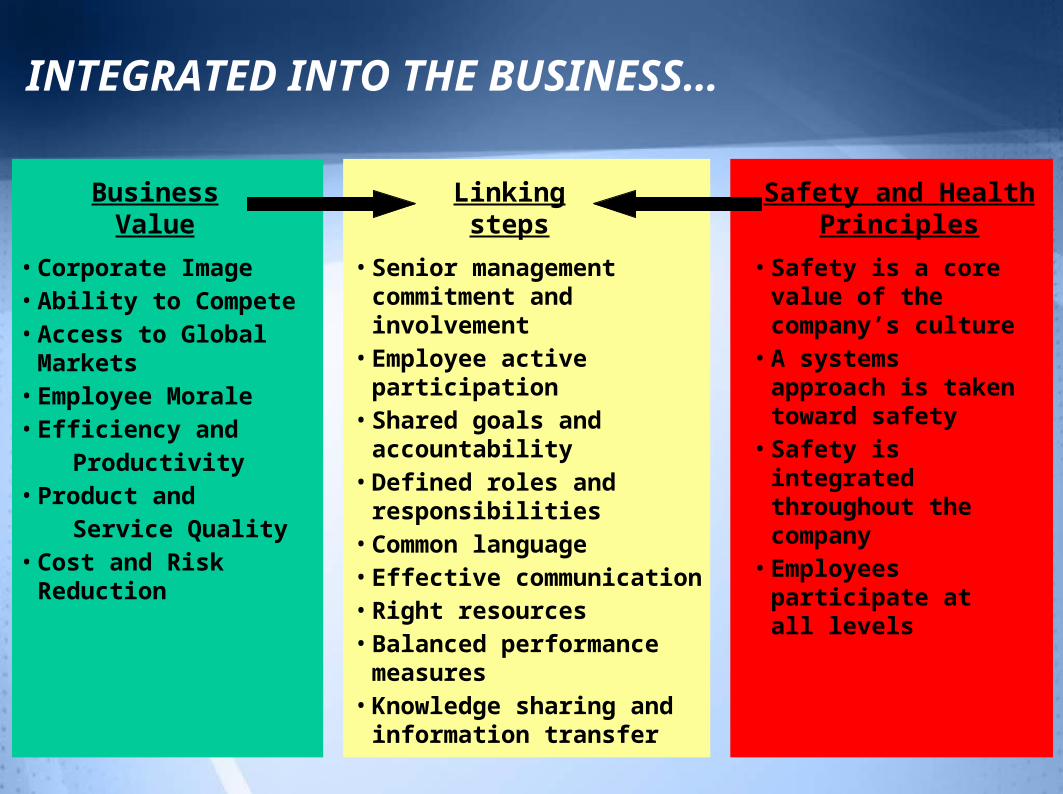
INTEGRATED INTO THE BUSINESS…
Business Value
Linking steps
•Safety is a core value of the company’s culture
•A systems approach is taken toward safety
•Safety is integrated throughout the company
•Employees participate at all levels
•Corporate Image•Ability to Compete•Access to Global
Markets•Employee Morale•Efficiency and
Productivity•Product and
Service Quality•Cost and Risk
Reduction
•Senior management commitment and involvement
•Employee active participation
•Shared goals and accountability
•Defined roles and responsibilities
•Common language•Effective communication•Right resources•Balanced performance
measures•Knowledge sharing and
information transfer
Safety and Health Principles
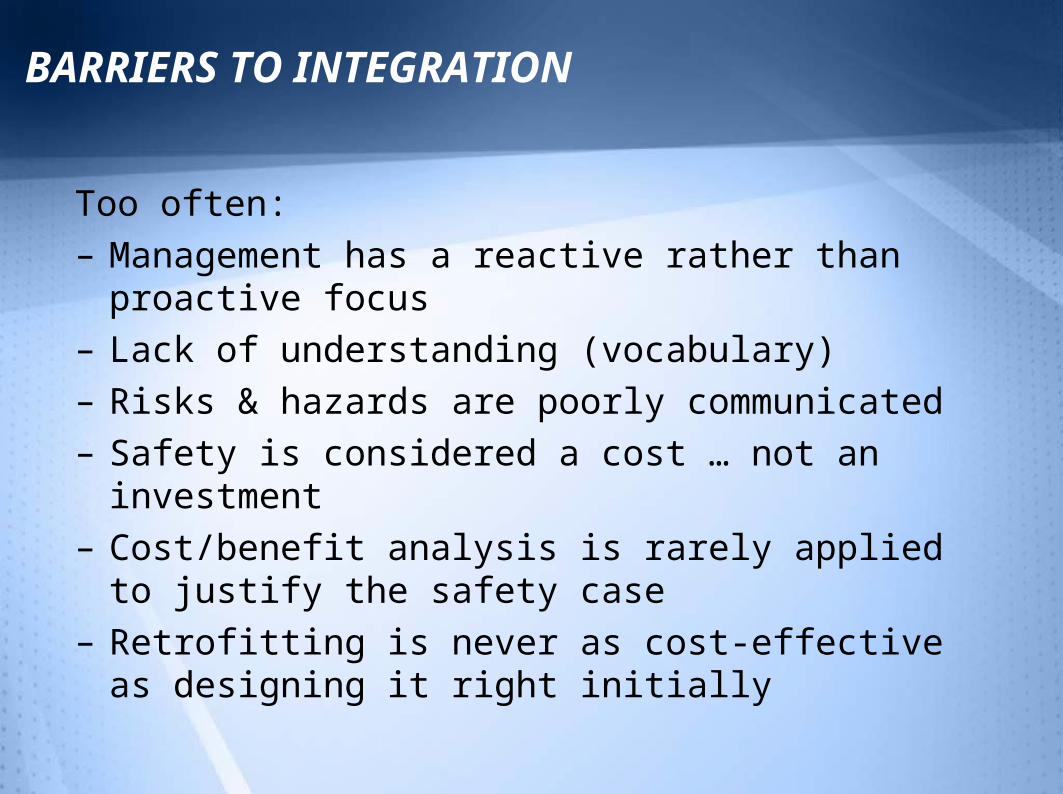
BARRIERS TO INTEGRATION
Too often:– Management has a reactive rather than proactive
focus– Lack of understanding (vocabulary)– Risks & hazards are poorly communicated– Safety is considered a cost … not an investment– Cost/benefit analysis is rarely applied to justify the
safety case– Retrofitting is never as cost-effective as designing it
right initially
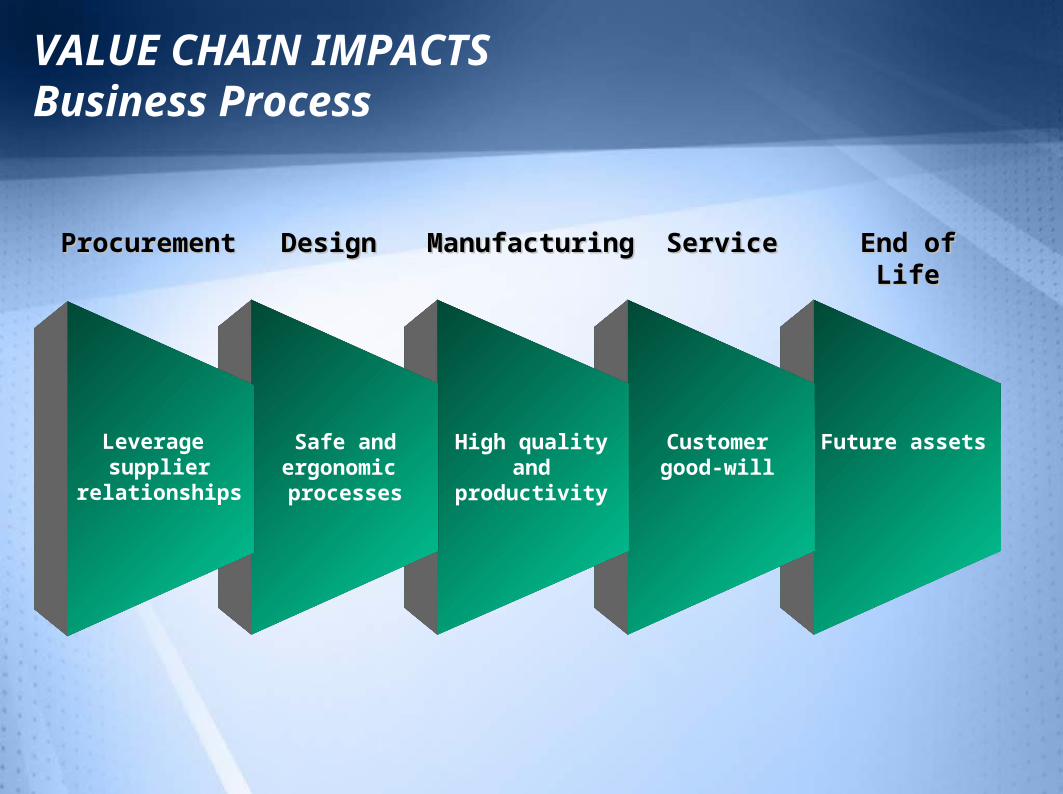
VALUE CHAIN IMPACTSBusiness Process
ProcurementProcurement DesignDesign ManufacturingManufacturing ServiceService End of LifeEnd of Life
Leverage supplier
relationships
Safe and ergonomic processes
High quality and
productivity
Customer good-will
Future assets
SAFETY IN THE VALUE CHAIN
– Safety and Health issues must be managed throughout the product life-cycle.
– The return on investment for Safety & Health decisions is greatest when the decisions are made early in the life-cycle.
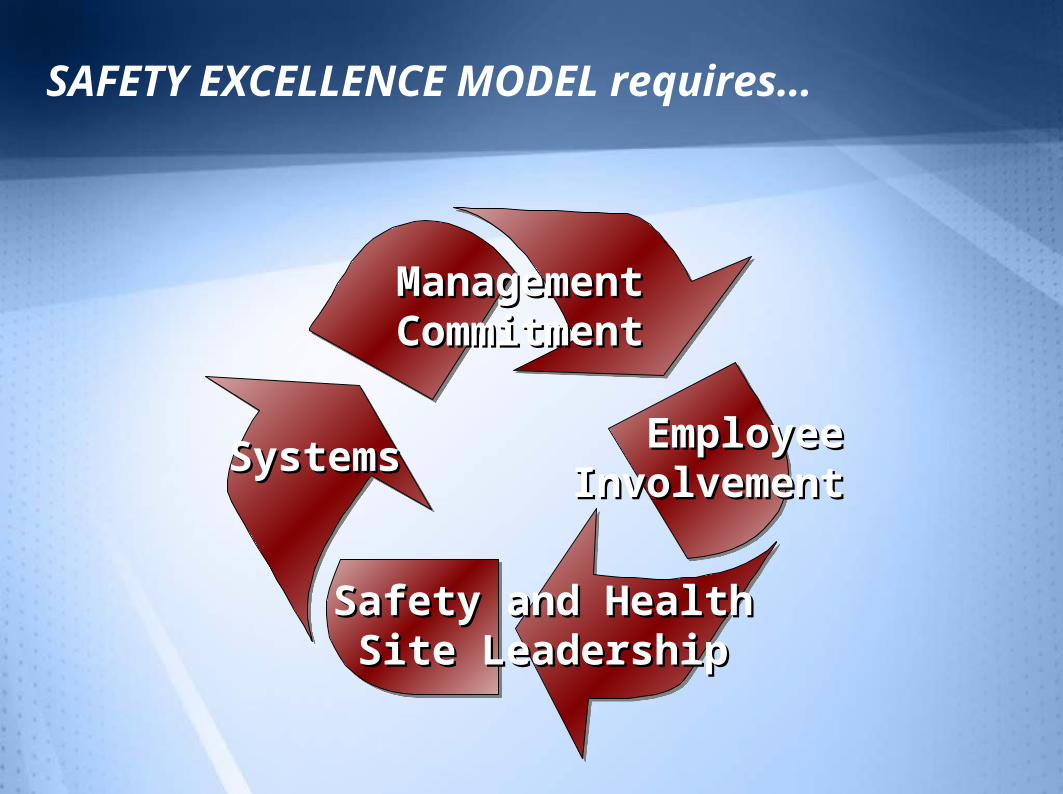
SAFETY EXCELLENCE MODEL requires…
Management Management CommitmentCommitment
SystemsSystems
Safety and HealthSafety and HealthSite LeadershipSite Leadership
Employee Employee InvolvementInvolvement
MANAGEMENT COMMITMENT MEANS…
– Valuing and caring for human resources
– Demonstrating a visible commitment with continuous involvement
– Setting high expectations and accountability for safety
– Motivating proper behaviors through leadership
– “Walk the Talk”
– Providing resources to affect change
– Encouraging employee involvement
EMPLOYEE INVOLVEMENT MEANS…
– Shared ownership of and commitment to the program
– Active support of the program
– Accountability for one’s personal safety and that of his/her co-workers
WAYS TO INVOLVE EMPLOYEES…
– Regular communication with employees on the subject of safety, risk, and hazards
– Provide access to information
– Provide ways to participate in the program– e.g., worksite self inspections, safety and health
annual evaluation process, incident investigation
– Provide ways to report hazards, injuries and make recommendations to control hazards
SAFETY AND HEALTH SITE LEADERSHIPKey Criteria
– Multiple Roles – Leader, Facilitator, Internal Consultant,
and Change Agent– Partner with Management
– Placement and Organizational Structure– Authority and Responsibility to act when
needed– Knowledge, Skills and Abilities
– Technical expertise– People skills
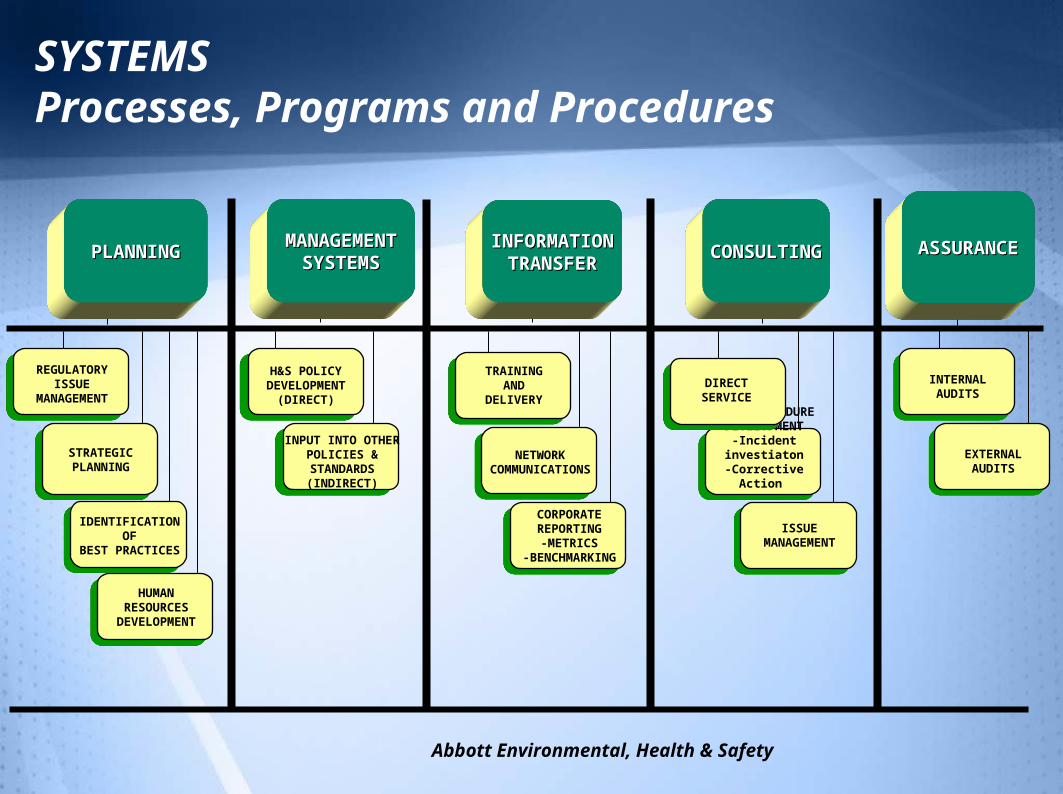
SYSTEMSProcesses, Programs and Procedures
REGULATORYISSUE
MANAGEMENT
EXTERNALAUDITS
INTERNALAUDITS
HUMANRESOURCES
DEVELOPMENT
STRATEGICPLANNING
IDENTIFICATIONOF
BEST PRACTICES
ASSURANCEASSURANCEMANAGEMENTMANAGEMENTSYSTEMSSYSTEMSPLANNINGPLANNING INFORMATIONINFORMATION
TRANSFERTRANSFERCONSULTINGCONSULTING
NETWORKCOMMUNICATIONS
CORPORATEREPORTING-METRICS
-BENCHMARKING
TRAININGAND
DELIVERY
H&S POLICYDEVELOPMENT
(DIRECT)
INPUT INTO OTHERPOLICIES &
STANDARDS(INDIRECT)
ISSUEMANAGEMENT
TOOL/PROCEDUREDEVELOPMENT
-Incident investiaton-Corrective Action
DIRECTSERVICE
Abbott Environmental, Health & Safety
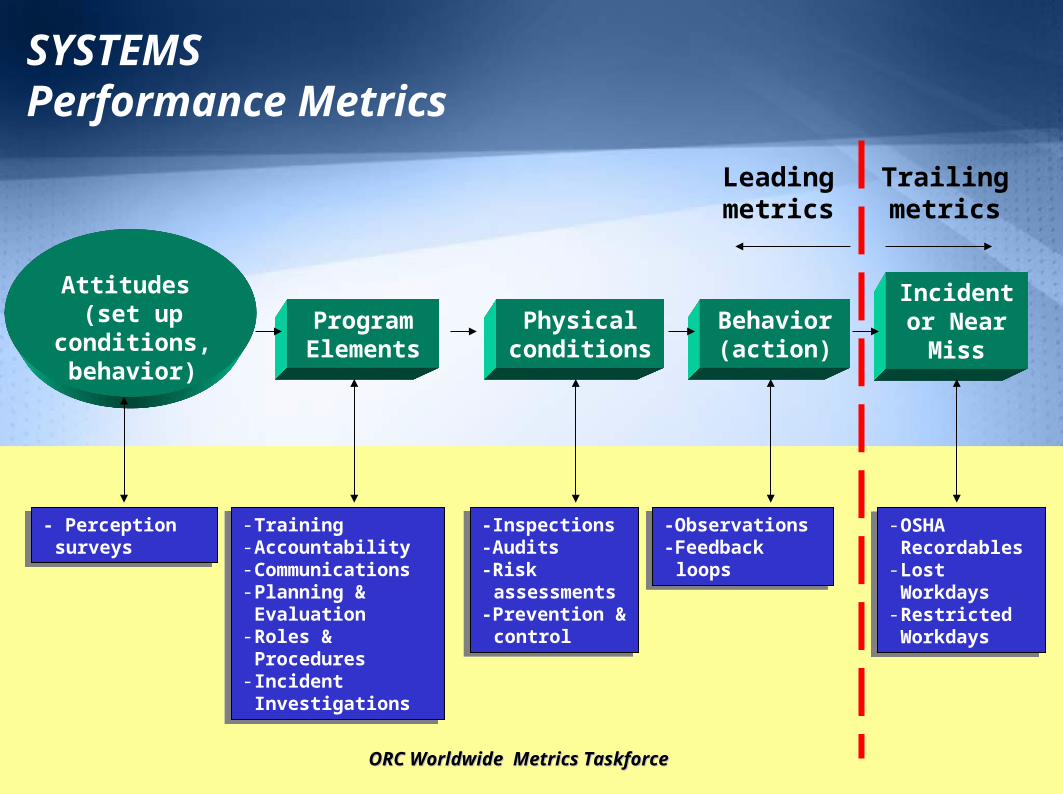
SYSTEMSPerformance Metrics
Attitudes (set up conditions,
behavior)Program Elements
Physical conditions
Behavior (action)
- Perception surveys- Perception surveys
- Training- Accountability- Communications- Planning & Evaluation
- Roles & Procedures
- Incident Investigations
- Training- Accountability- Communications- Planning & Evaluation
- Roles & Procedures
- Incident Investigations
-Inspections-Audits-Risk assessments
-Prevention & control
-Inspections-Audits-Risk assessments
-Prevention & control
-Observations-Feedback loops
-Observations-Feedback loops
Incident or Near
Miss
- OSHA Recordables
- Lost Workdays
- Restricted Workdays
- OSHA Recordables
- Lost Workdays
- Restricted Workdays
Leading metrics
Trailing metrics
ORC Worldwide Metrics TaskforceORC Worldwide Metrics Taskforce
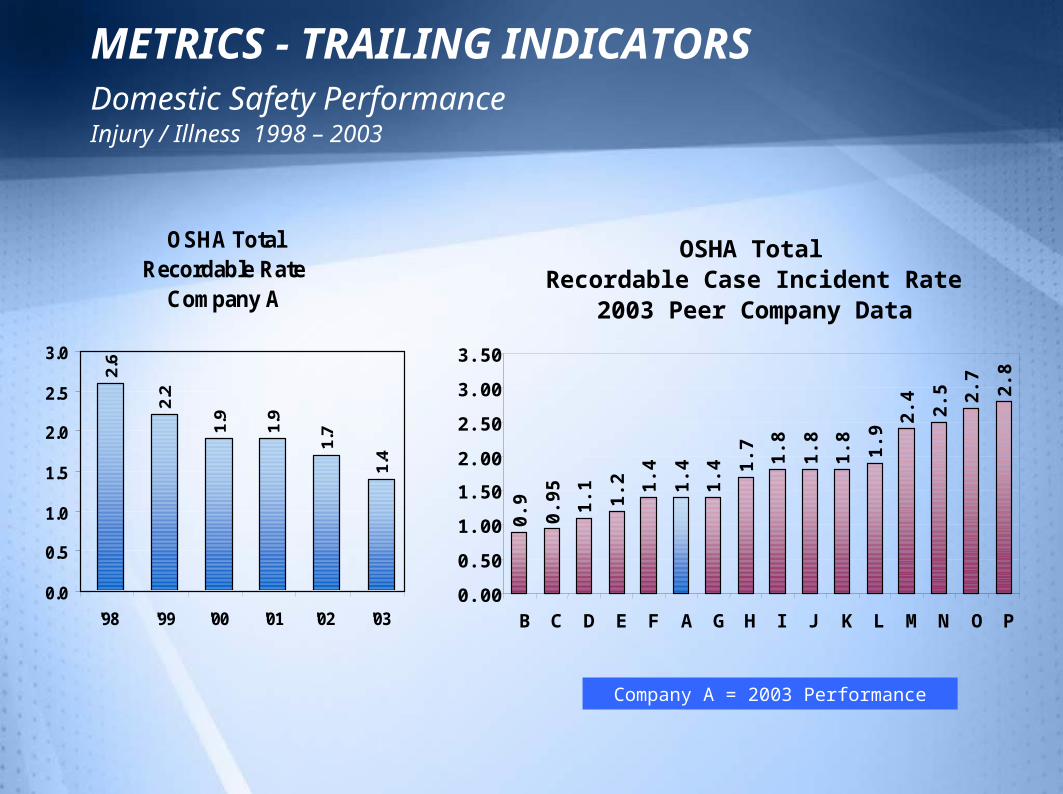
METRICS - TRAILING INDICATORS
Domestic Safety Performance Injury / Illness 1998 – 2003
0.00
0.50
1.00
1.50
2.00
2.50
3.00
3.50
OSHA Total Recordable Case Incident Rate
2003 Peer Company Data
0.9
0.95 1.
1 1.2 1.
4
1.4
1.4 1.
7 1.8
1.8
1.8 1.9
2.4 2.5 2.
7 2.8
B C D E F A G H I J K L M N O P
Company A = 2003 Performance
OSHA Total Recordable Rate
Company A
2.6
2.2
1.9
1.9
1.7
1.4
0.0
0.5
1.0
1.5
2.0
2.5
3.0
'98 '99 '00 '01 '02 '03
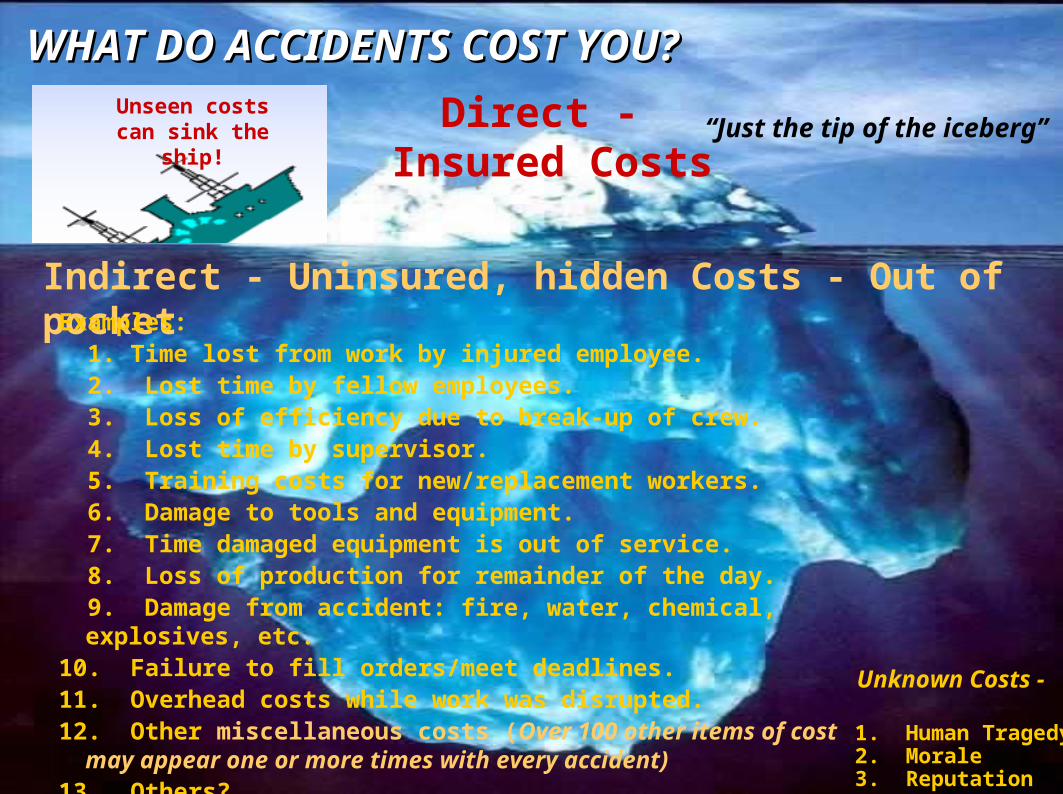
WHAT DO ACCIDENTS COST YOU?WHAT DO ACCIDENTS COST YOU?
Direct - Insured Costs
“Just the tip of the iceberg”Unseen costs can sink the
ship!
Indirect - Uninsured, hidden Costs - Out of pocketExamples: 1. Time lost from work by injured employee. 2. Lost time by fellow employees. 3. Loss of efficiency due to break-up of crew. 4. Lost time by supervisor. 5. Training costs for new/replacement workers. 6. Damage to tools and equipment. 7. Time damaged equipment is out of service. 8. Loss of production for remainder of the day. 9. Damage from accident: fire, water, chemical, explosives, etc. 10. Failure to fill orders/meet deadlines.11. Overhead costs while work was disrupted. 12. Other miscellaneous costs (Over 100 other items of cost may
appear one or more times with every accident)13. Others? ________________________________
Unknown Costs -
1. Human Tragedy2. Morale3. Reputation
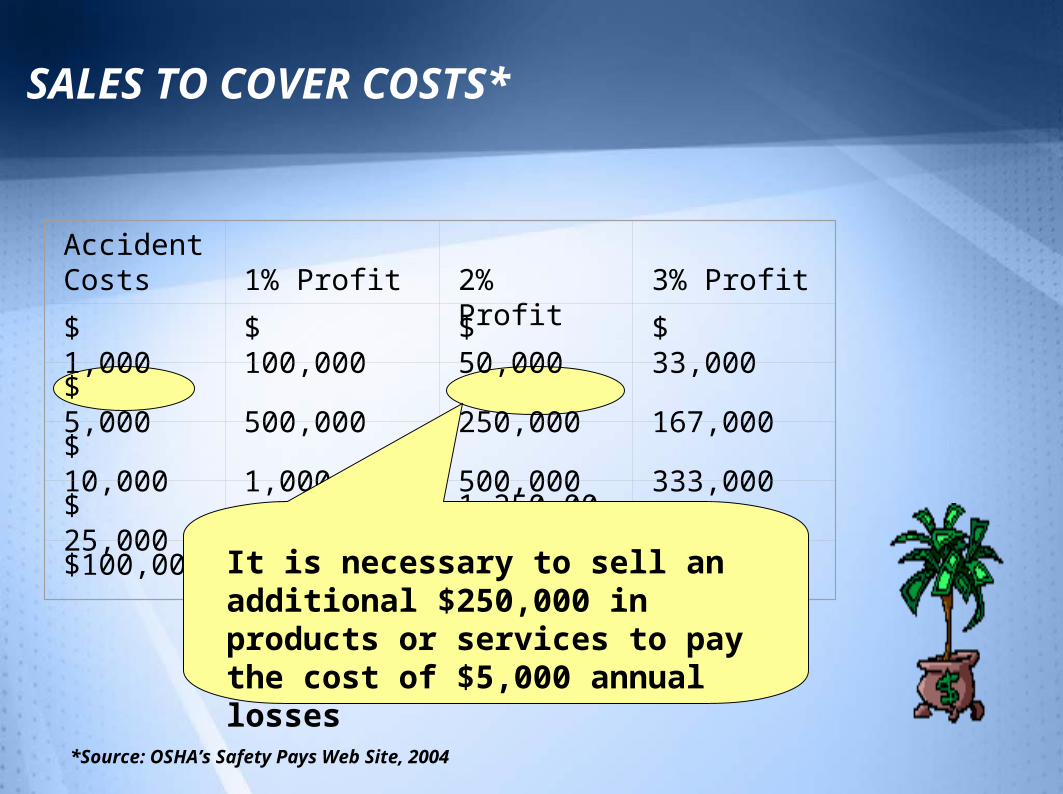
Accident Costs
1% Profit
2% Profit
3% Profit
$ 1,000 $ 100,000 $ 50,000 $ 33,000
$ 5,000 500,000 250,000 167,000
$ 10,000 1,000,000 500,000 333,000
$ 25,000 2,500,000 1,250,000 833,000
$100,000 10,000,000 5,000,000 3,333,000
SALES TO COVER COSTS*
It is necessary to sell an additional $250,000 in products or services to pay the cost of $5,000 annual losses
*Source: OSHA’s Safety Pays Web Site, 2004
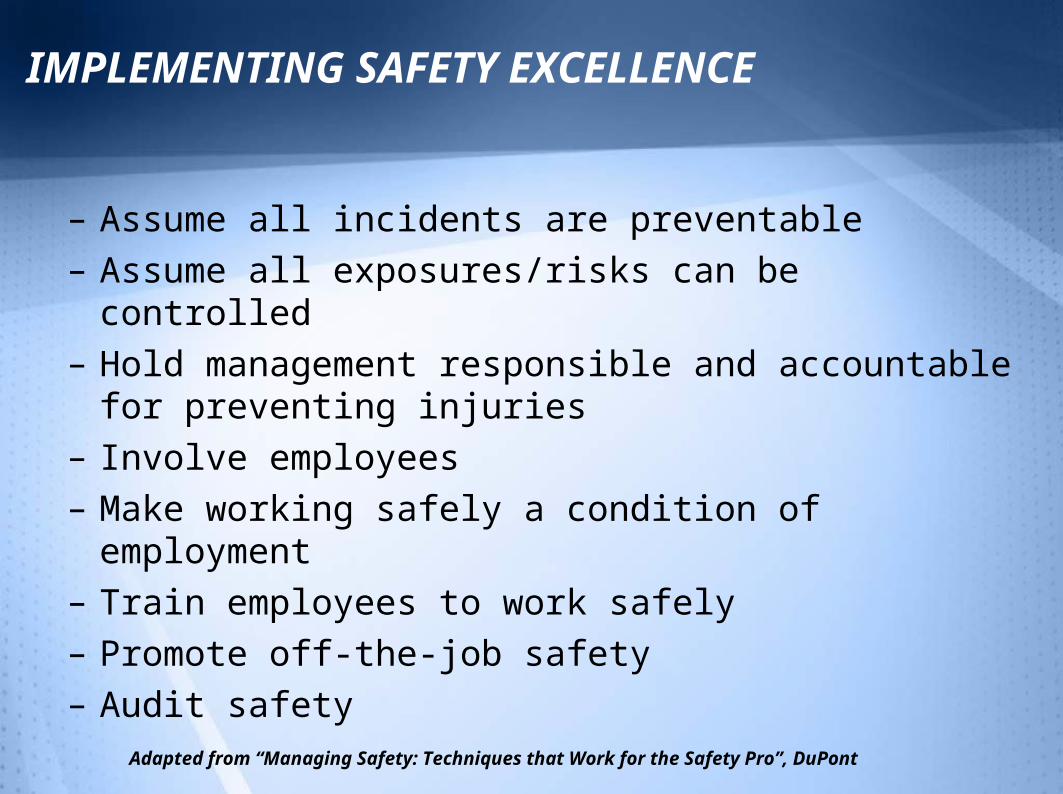
IMPLEMENTING SAFETY EXCELLENCE
– Assume all incidents are preventable
– Assume all exposures/risks can be controlled
– Hold management responsible and accountable for preventing injuries
– Involve employees
– Make working safely a condition of employment
– Train employees to work safely
– Promote off-the-job safety
– Audit safetyAdapted from “Managing Safety: Techniques that Work for the Safety Pro”, DuPont
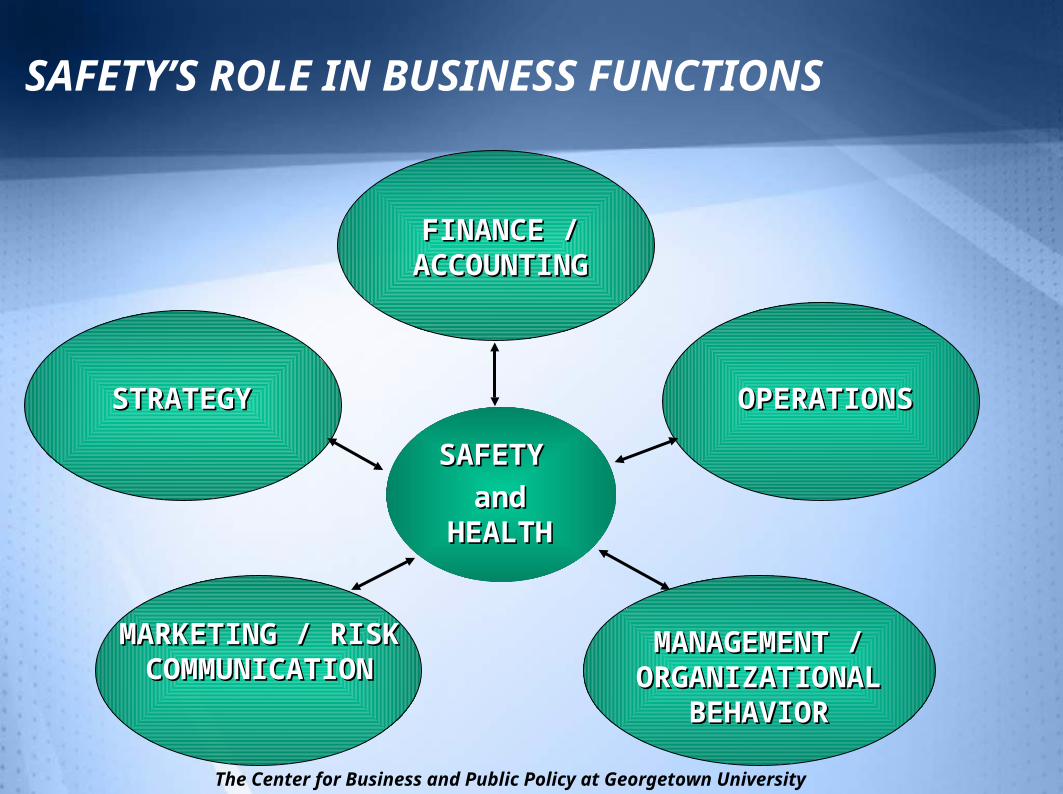
SAFETY’S ROLE IN BUSINESS FUNCTIONS
FINANCE / FINANCE / ACCOUNTINGACCOUNTING
OPERATIONSOPERATIONS
SAFETY SAFETY
and and HEALTHHEALTH
STRATEGYSTRATEGY
MANAGEMENT / MANAGEMENT / ORGANIZATIONAL ORGANIZATIONAL
BEHAVIORBEHAVIOR
MARKETING / RISK MARKETING / RISK COMMUNICATIONCOMMUNICATION
The Center for Business and Public Policy at Georgetown University
SAFETY’S ROLEStrategy
– Providing a safe workplace is key to meeting business objectives– Protecting reputation– Attracting and retaining high potential
employees
SAFETY’S ROLEFinancial
– Financial cost/benefit analysis cases for safety must include the “true costs”– Direct costs, and– Indirect “Hidden” costs
– costs from high turnover rates, and– costs avoided
– Safety must be considered at every step in the value chain – Designing safety into a process is cheaper than
retrofitting for safety later.
– To be able to effectively manage a program and improve safety… measurements must include:– Both Leading and Trailing Indicators– Leading indicators should correlate with trailing
ones.
SAFETY’S ROLEOperations
SAFETY’S ROLEManagement / Organizational Behavior
– Leadership and employee empowerment are keys to creating a proactive safety culture.– Senior management commitment is critical to
improving safety
– Promote program results both internally and externally
SAFETY’S ROLEMarketing & Communications
• People are inherently biased when it comes to evaluating risks.
• Safety managers must be able to effectively communicate the risks to:
• Engage senior management • Affect employee behavior

REMEMBER…
You will achieve the level of Safety Excellence…
that YOU demonstrate you want to achieve...
Final Thoughts…
“ Establishing a safety and health culture that leads to superior performance is not only the right thing to do or the socially responsible thing to do…
It is also the right economic approach.
Reducing workplace injuries and illnesses conserves critical resources and improves the use of those resources. It saves money, avoids unnecessary costs and ultimately maximizes returns on business investments.”
John Henshaw, Assistant Secretary of Labor, OSHA
CASE STUDIESCASE STUDIES
CASE STUDIES
– Review the impact of safety programs on the “bottom line” in several industries:– Construction– Foundry– Healthcare (Nursing Homes)– Auto Parts Manufacturing– Insurance– Pharmaceutical
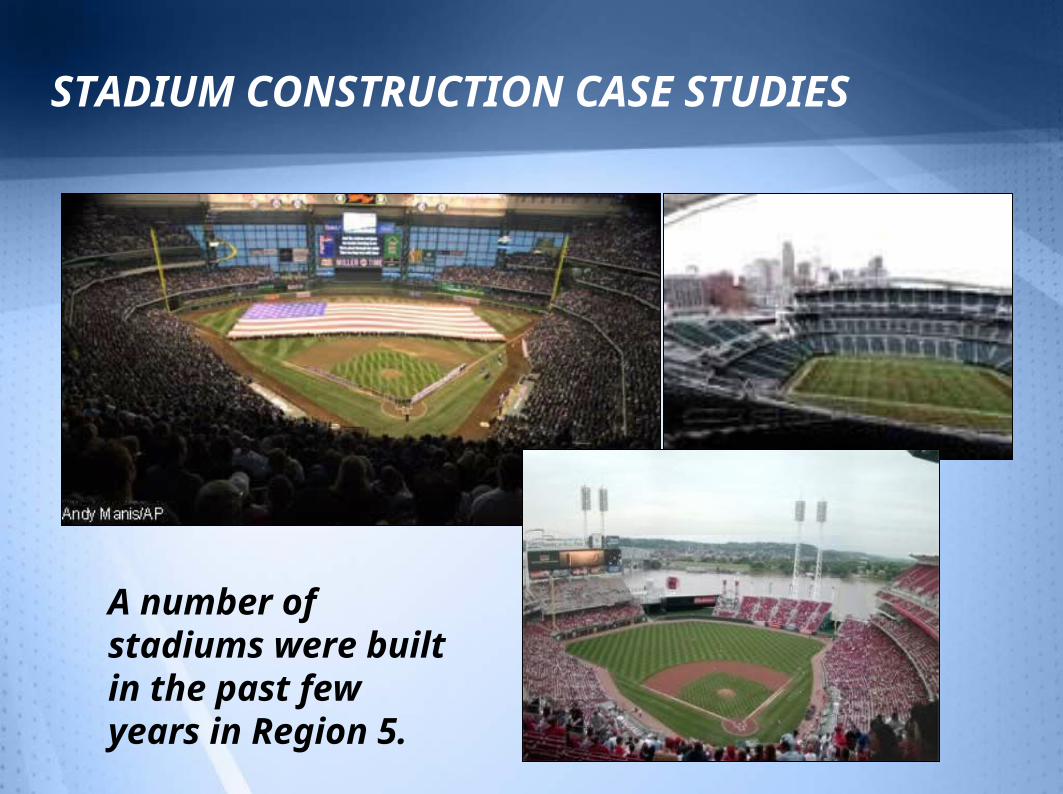
STADIUM CONSTRUCTION CASE STUDIES
A number of stadiums were built in the past few years in Region 5.
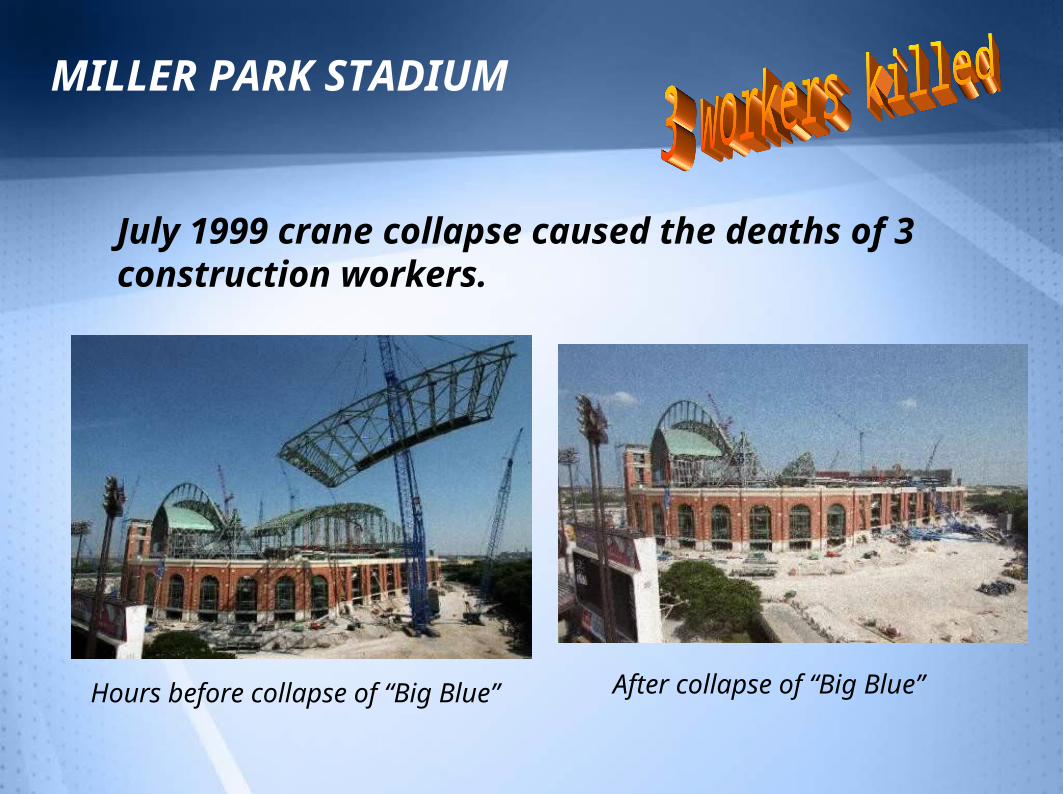
MILLER PARK STADIUM
July 1999 crane collapse caused the deaths of 3 construction workers.
Hours before collapse of “Big Blue” After collapse of “Big Blue”
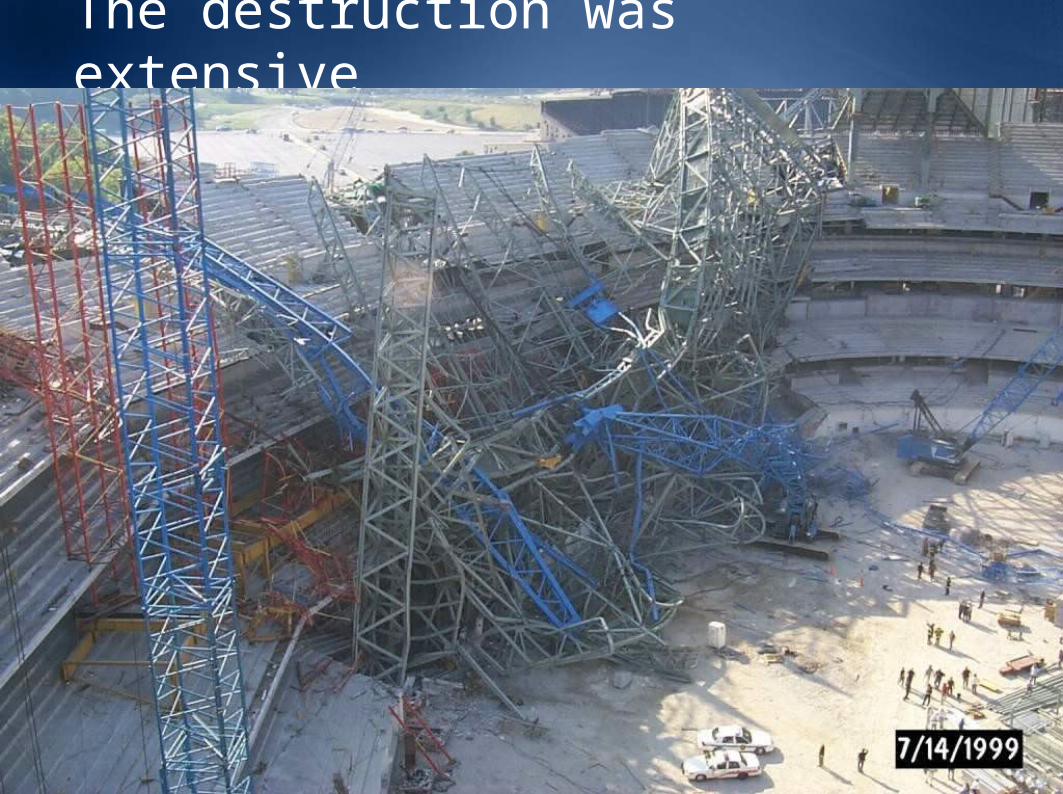
The destruction was extensive
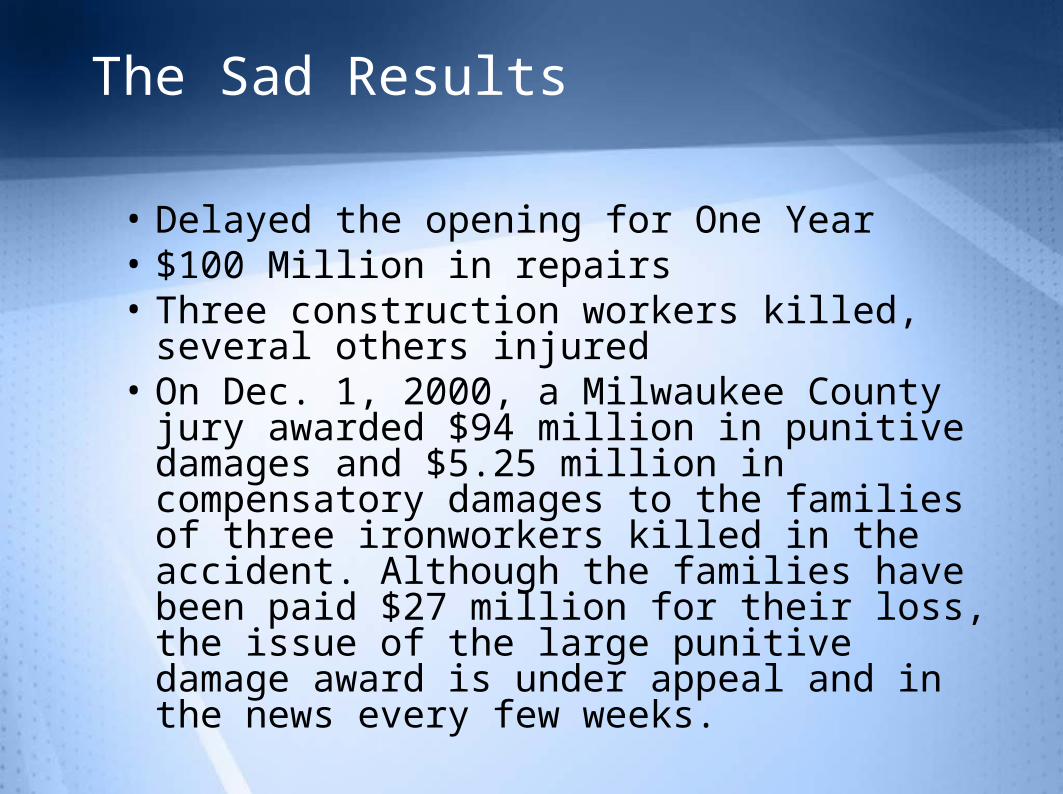
The Sad Results
• Delayed the opening for One Year • $100 Million in repairs • Three construction workers killed, several
others injured• On Dec. 1, 2000, a Milwaukee County jury
awarded $94 million in punitive damages and $5.25 million in compensatory damages to the families of three ironworkers killed in the accident. Although the families have been paid $27 million for their loss, the issue of the large punitive damage award is under appeal and in the news every few weeks.
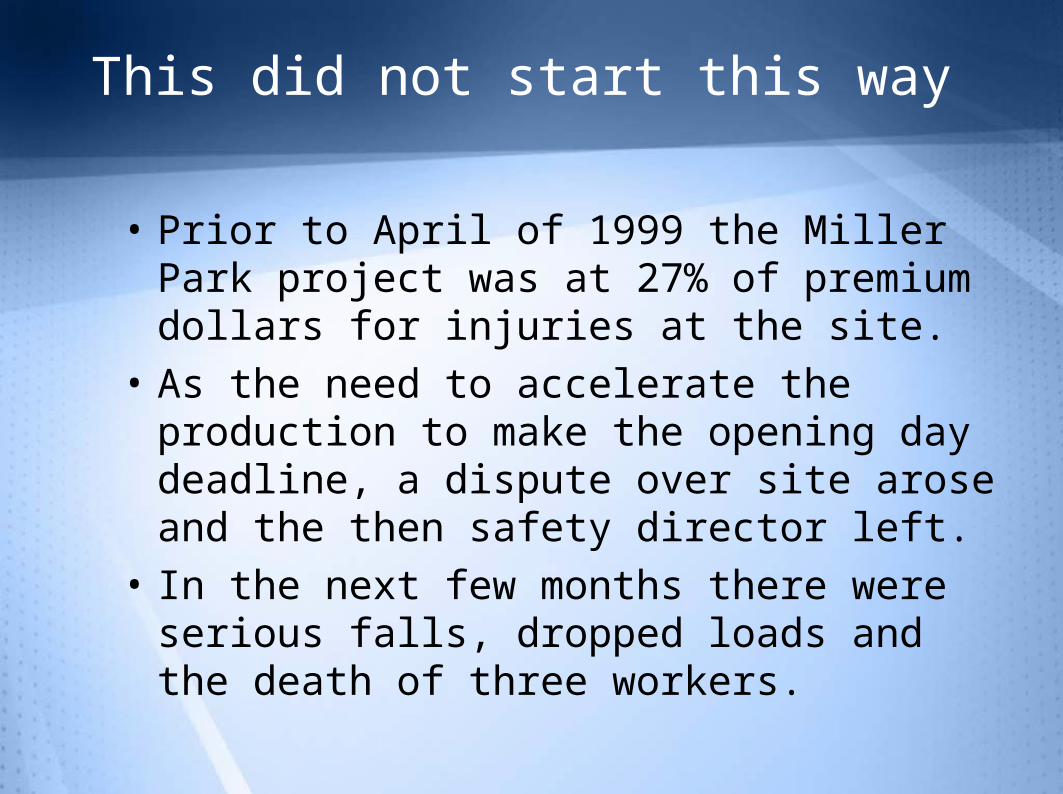
This did not start this way
• Prior to April of 1999 the Miller Park project was at 27% of premium dollars for injuries at the site.
• As the need to accelerate the production to make the opening day deadline, a dispute over site arose and the then safety director left.
• In the next few months there were serious falls, dropped loads and the death of three workers.
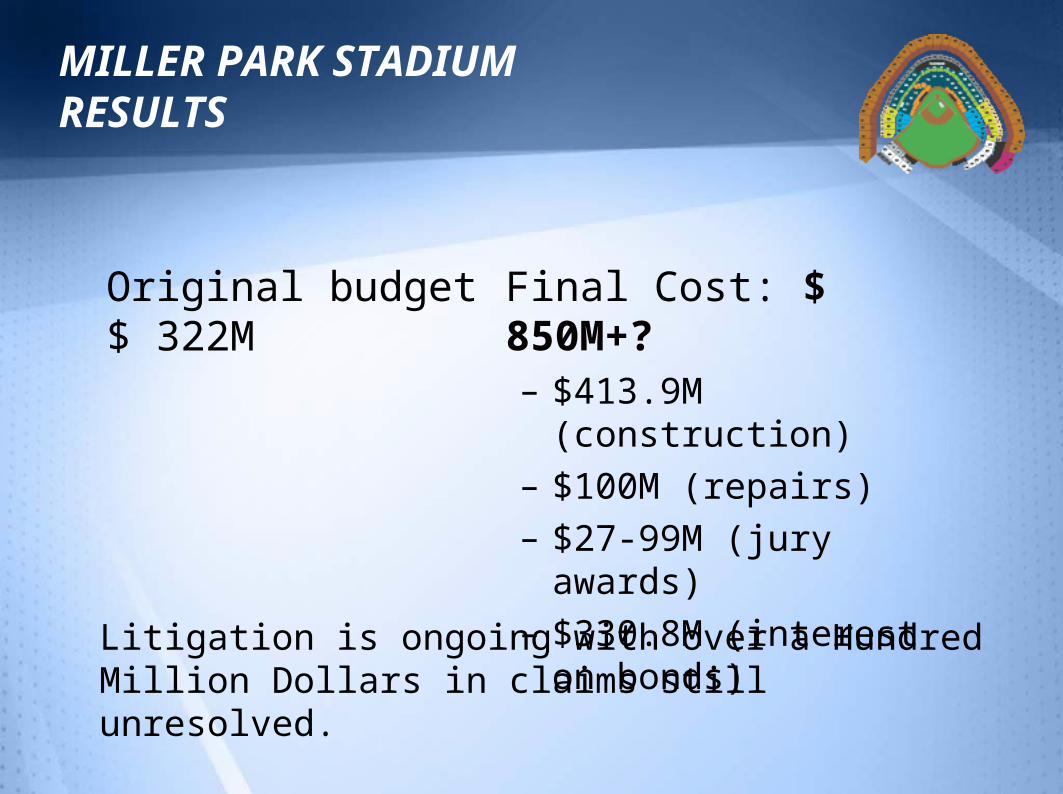
MILLER PARK STADIUMRESULTS
Original budget$ 322M
Final Cost: $ 850M+?– $413.9M (construction)
– $100M (repairs)
– $27-99M (jury awards)
– $330.8M (interest on bonds)
Litigation is ongoing with over a Hundred Million Dollars in claims still unresolved.
Other Stadium Construction Deaths
• Milwaukee (WI) County Stadium – 1953– 3 workers killed
• Rosemont (IL) Horizon Arena – 1979– 5 workers killed
• Seattle (WA) Kingdome – 1994– 2 workers killed
• Olympic Stadium – Atlanta (GA) - 1995– 1 worker killed
Other Stadium Construction Deaths
• Bank One Ballpark – Phoenix (AZ) - 1996– 1 worker killed
• Philip’s Arena – Atlanta (GA) - 1998– 2 workers killed
• University of Florida – Gainesville (FL) – 2002– 1 worker killed
• Ford Field – Detroit (MI) - 2002– 1 worker killed
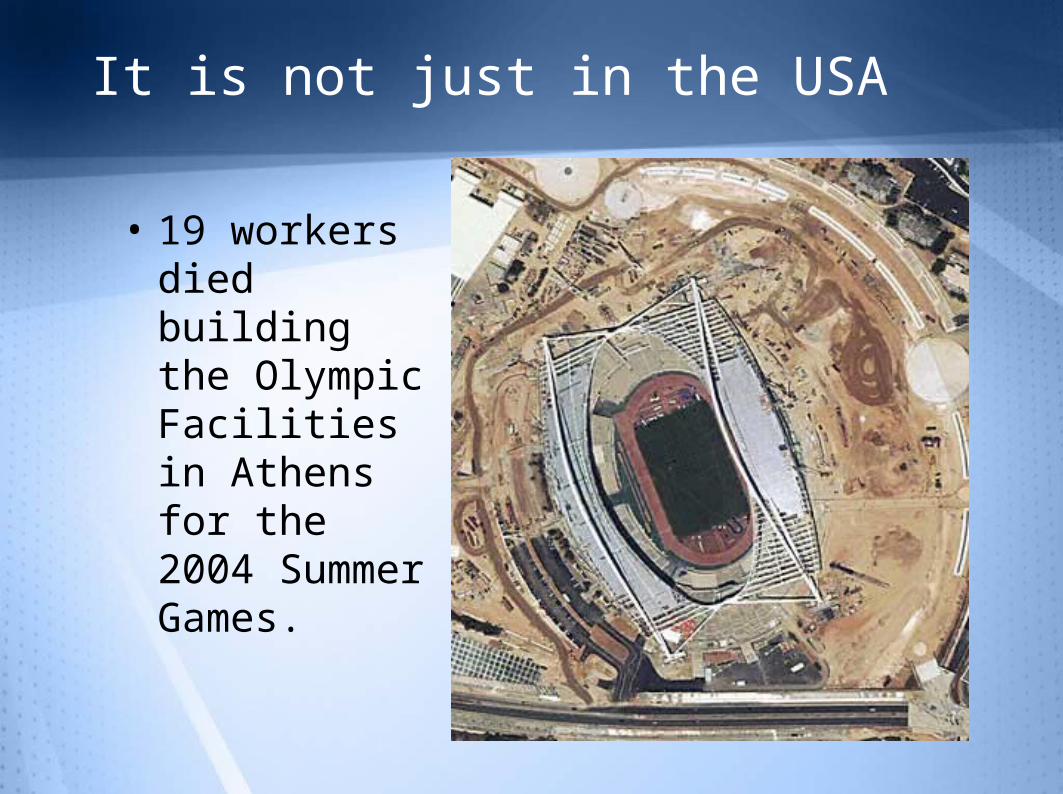
It is not just in the USA
• 19 workers died building the Olympic Facilities in Athens for the 2004 Summer Games.
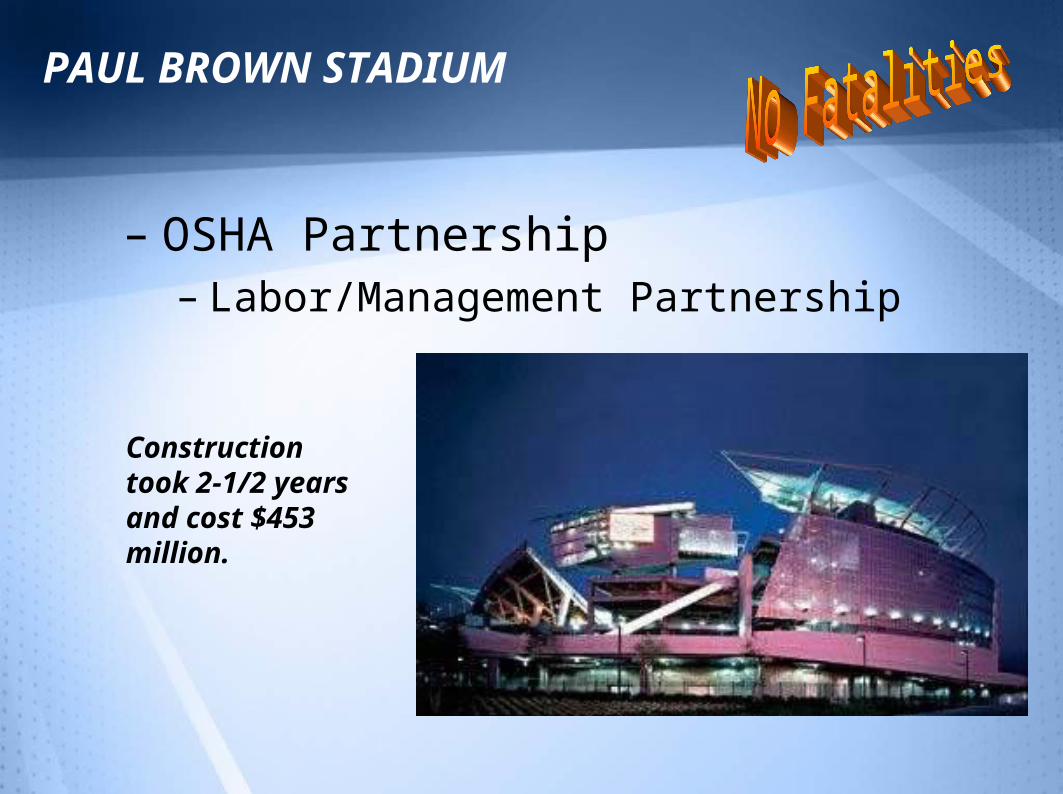
PAUL BROWN STADIUM
– OSHA Partnership– Labor/Management Partnership
Construction took 2-1/2 years and cost $453 million.
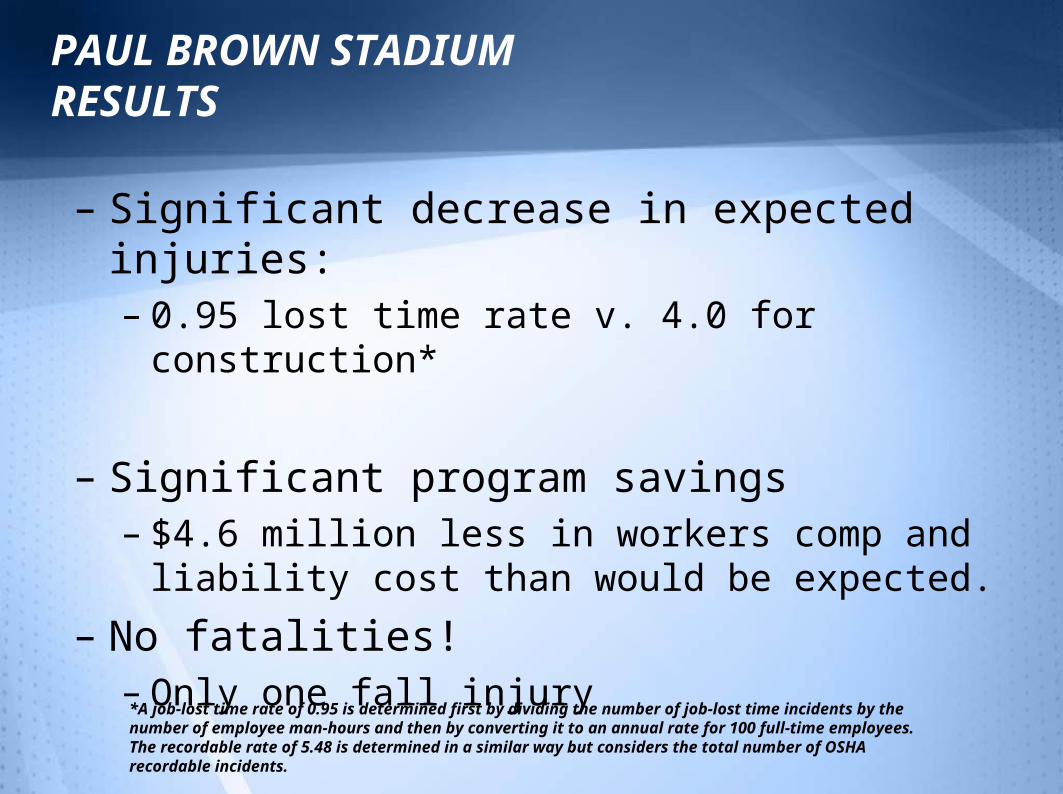
PAUL BROWN STADIUM RESULTS
– Significant decrease in expected injuries:– 0.95 lost time rate v. 4.0 for construction*
– Significant program savings– $4.6 million less in workers comp and liability
cost than would be expected.
– No fatalities!– Only one fall injury
*A job-lost time rate of 0.95 is determined first by dividing the number of job-lost time incidents by the number of employee man-hours and then by converting it to an annual rate for 100 full-time employees. The recordable rate of 5.48 is determined in a similar way but considers the total number of OSHA recordable incidents.
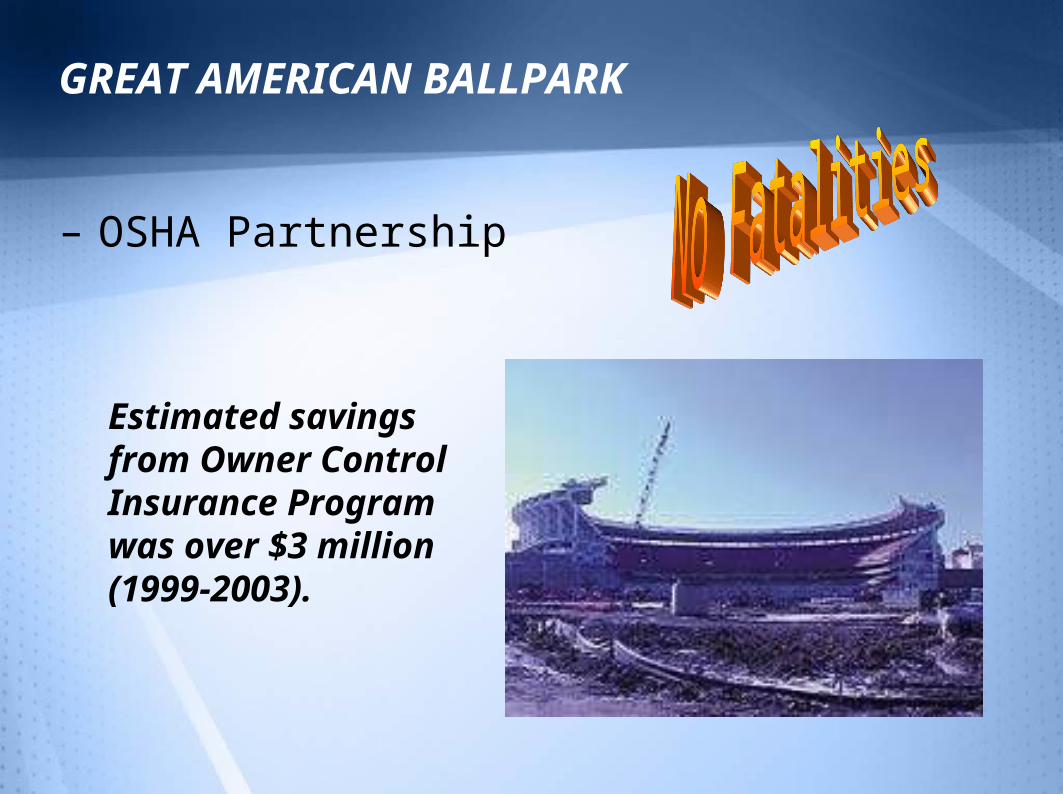
GREAT AMERICAN BALLPARK
– OSHA Partnership
Estimated savings from Owner Control Insurance Program was over $3 million (1999-2003).
GREAT AMERICAN BALLPARKRESULTS
– After 1.2 million construction hours, a job-lost time rate of 0.8
– Estimated savings from Owner Control Insurance Program (July 1999-May 2003) was $3.125 million (project is on-going until July 2005)
Soldier Field
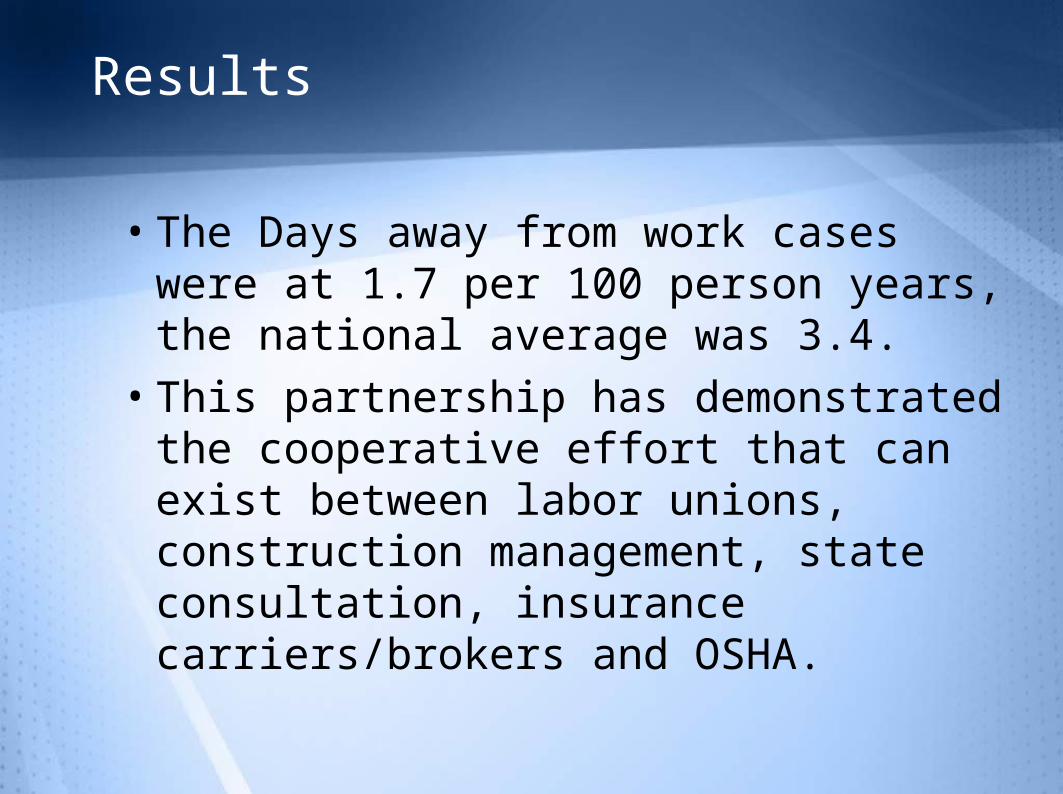
Results
• The Days away from work cases were at 1.7 per 100 person years, the national average was 3.4.
• This partnership has demonstrated the cooperative effort that can exist between labor unions, construction management, state consultation, insurance carriers/brokers and OSHA.

Camp Randal RenovationUniversity of Wisconsin Madison
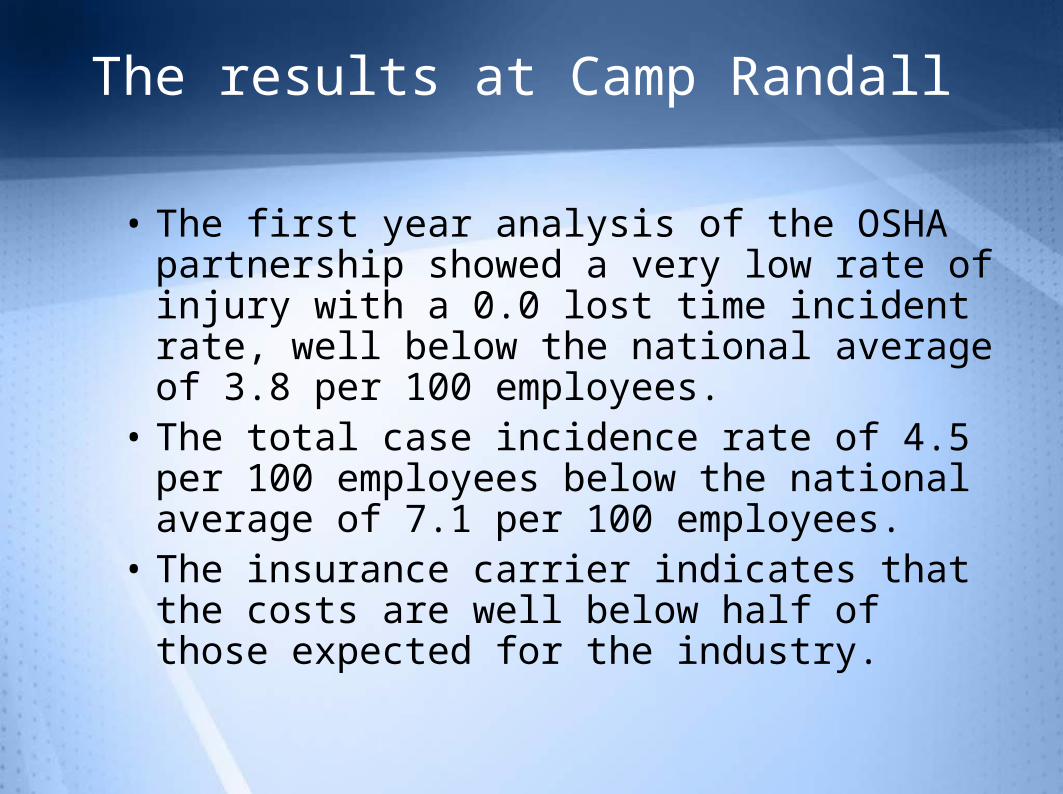
The results at Camp Randall
• The first year analysis of the OSHA partnership showed a very low rate of injury with a 0.0 lost time incident rate, well below the national average of 3.8 per 100 employees.
• The total case incidence rate of 4.5 per 100 employees below the national average of 7.1 per 100 employees.
• The insurance carrier indicates that the costs are well below half of those expected for the industry.

Lambeau Field
• Expansion of the existing Stadium, completed on time with construction and football coexisting for two seasons.
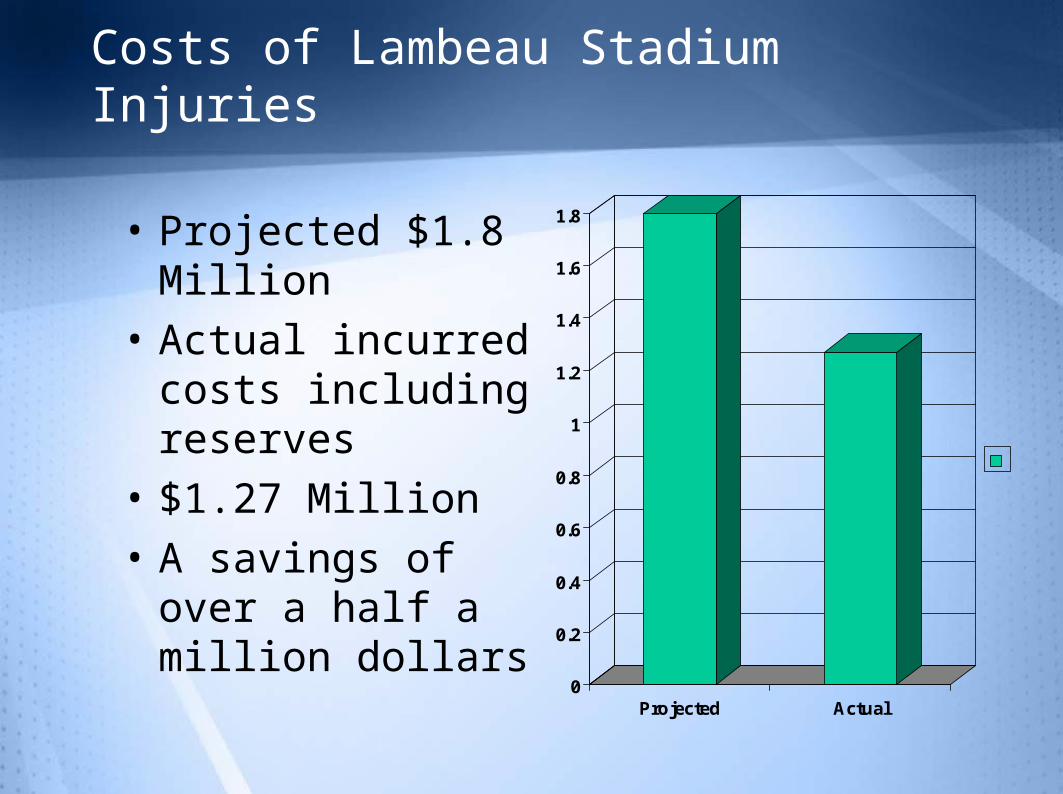
Costs of Lambeau Stadium Injuries
• Projected $1.8 Million
• Actual incurred costs including reserves
• $1.27 Million• A savings of over a
half a million dollars
0
0.2
0.4
0.6
0.8
1
1.2
1.4
1.6
1.8
Projected Actual
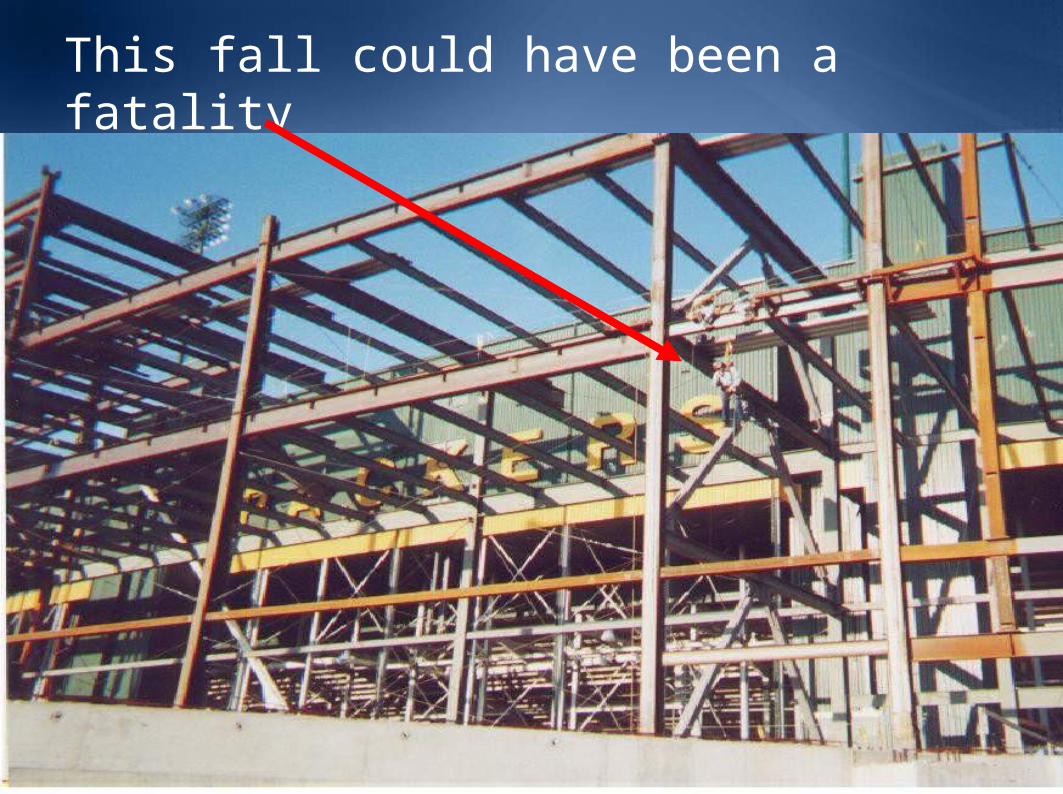
This fall could have been a fatality
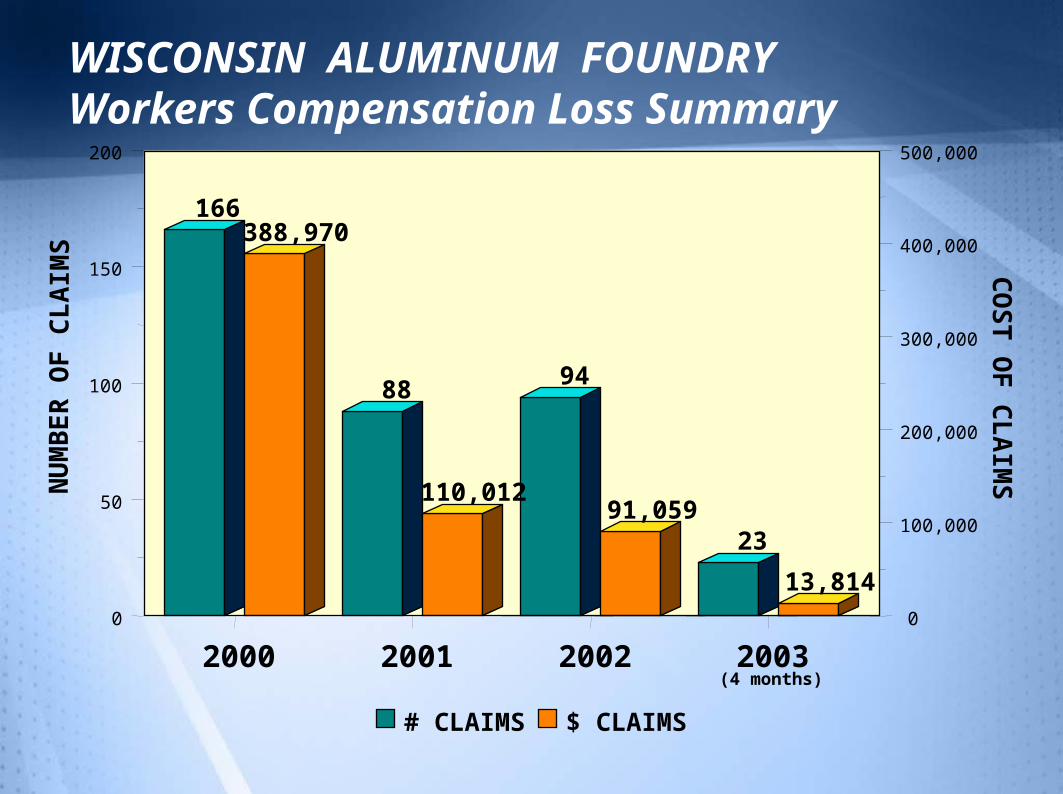
WISCONSIN ALUMINUM FOUNDRYWorkers Compensation Loss Summary
2000 2001 2002 20030
50
100
150
200
0
100,000
200,000
300,000
400,000
500,000
166
88 94
23
388,970
110,01291,059
13,814
NU
MB
ER
OF
CL
AIM
SC
OS
T O
F C
LA
IMS
# CLAIMS $ CLAIMS
(4 months)
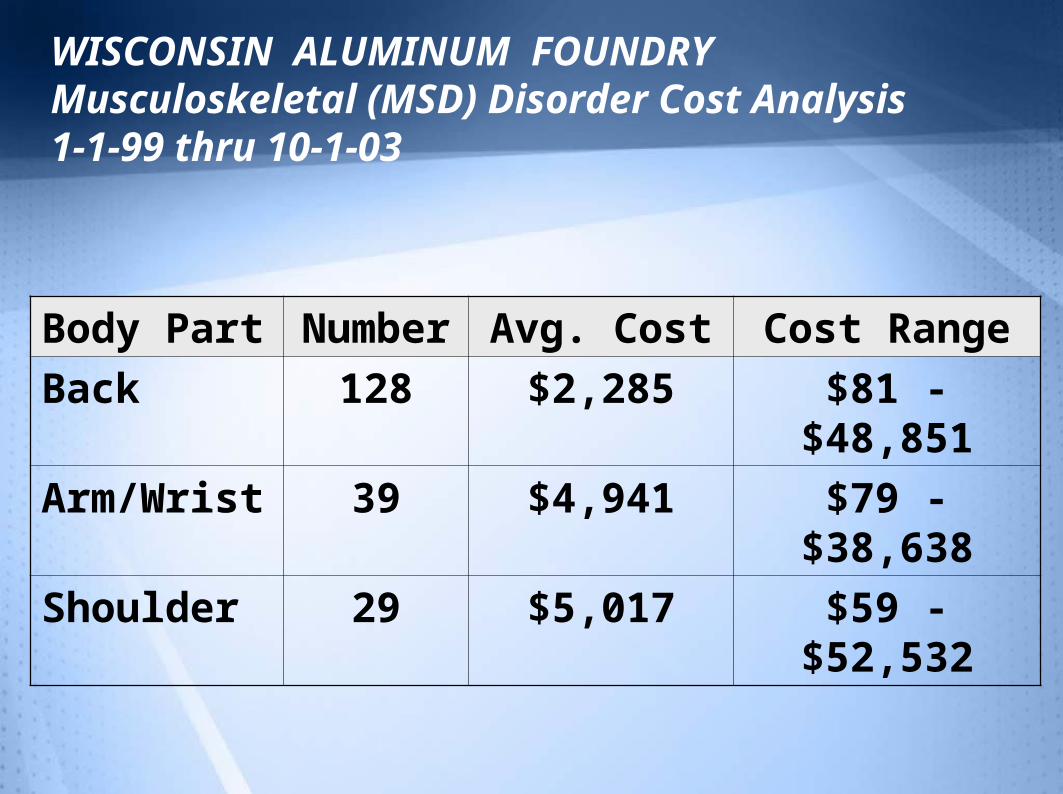
WISCONSIN ALUMINUM FOUNDRYMusculoskeletal (MSD) Disorder Cost Analysis1-1-99 thru 10-1-03
Body Part Number Avg. Cost Cost Range
Back 128 $2,285 $81 - $48,851
Arm/Wrist 39 $4,941 $79 - $38,638
Shoulder 29 $5,017 $59 - $52,532
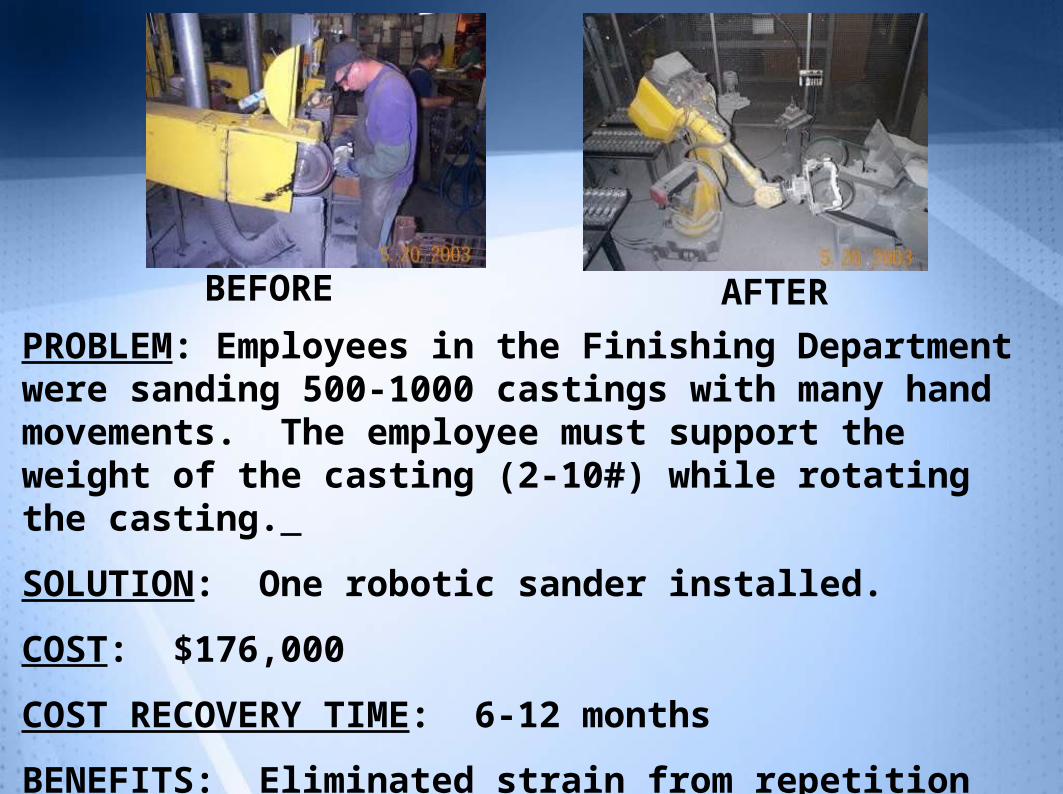
PROBLEM: Employees in the Finishing Department were sanding 500-1000 castings with many hand movements. The employee must support the weight of the casting (2-10#) while rotating the casting.
SOLUTION: One robotic sander installed.
COST: $176,000
COST RECOVERY TIME: 6-12 months
BENEFITS: Eliminated strain from repetition and force, increased productivity.
BEFORE AFTER
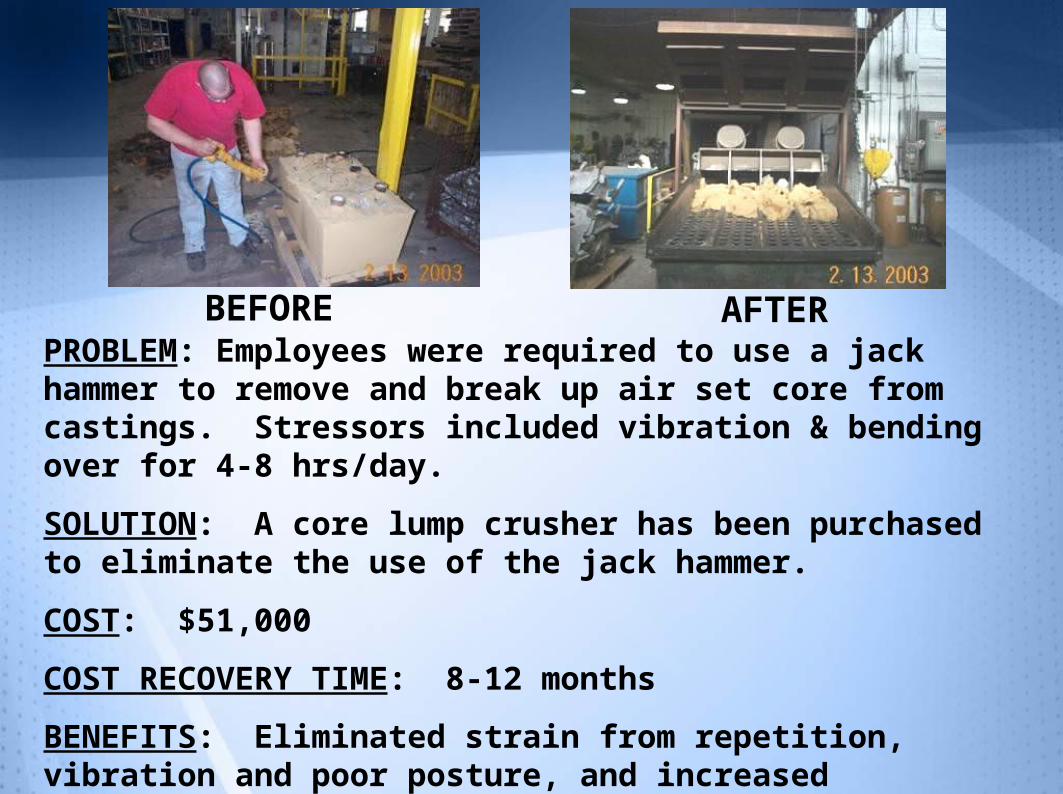
PROBLEM: Employees were required to use a jack hammer to remove and break up air set core from castings. Stressors included vibration & bending over for 4-8 hrs/day.
SOLUTION: A core lump crusher has been purchased to eliminate the use of the jack hammer.
COST: $51,000
COST RECOVERY TIME: 8-12 months
BENEFITS: Eliminated strain from repetition, vibration and poor posture, and increased productivity and recovery rate.
BEFORE AFTER
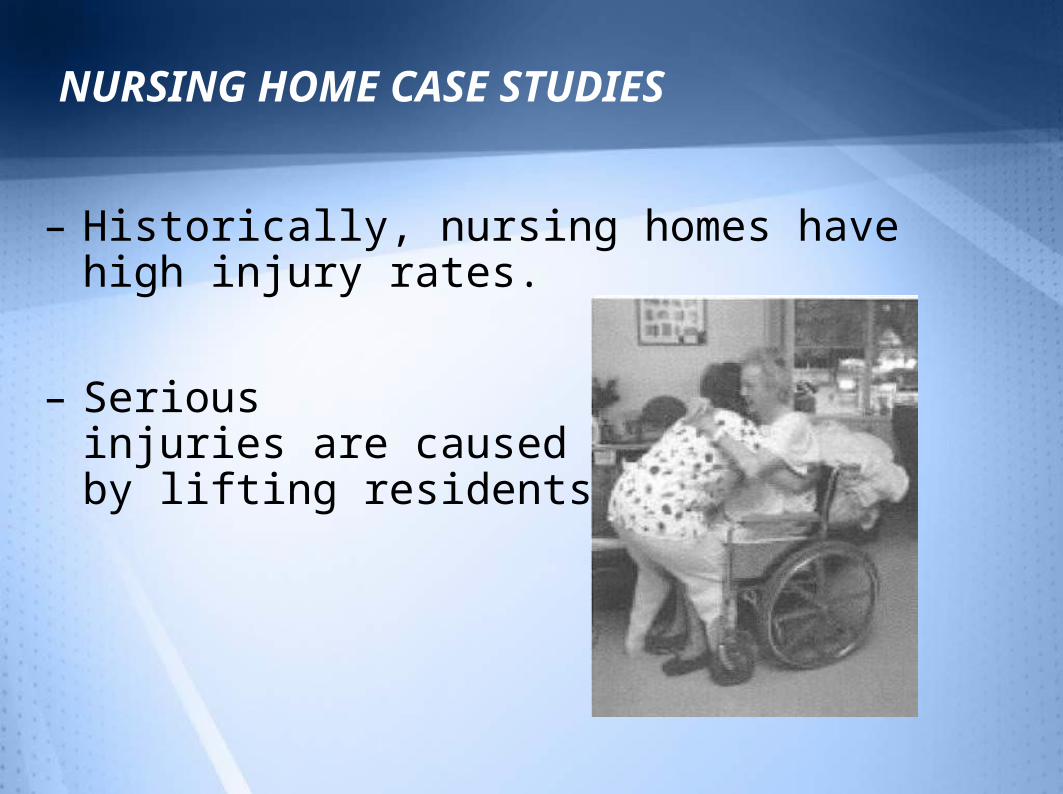
NURSING HOME CASE STUDIES
– Historically, nursing homes have high injury rates.
– Serious injuries are caused by lifting residents.
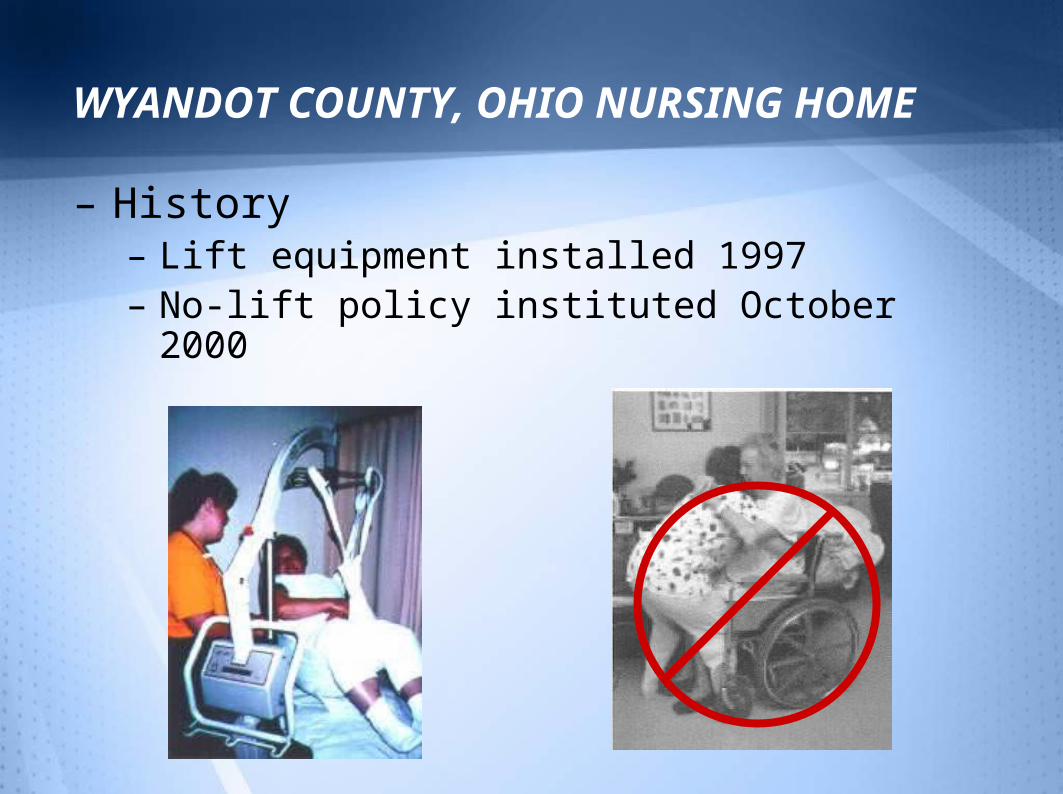
WYANDOT COUNTY, OHIO NURSING HOME
– History– Lift equipment installed 1997– No-lift policy instituted October 2000
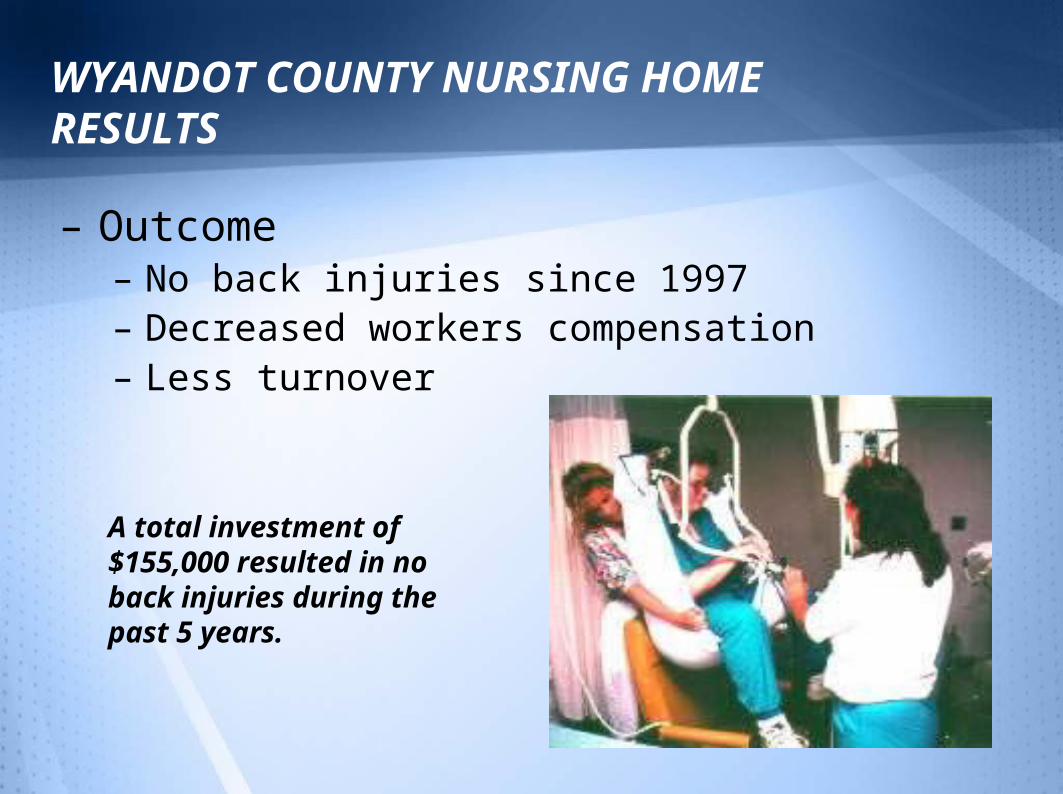
WYANDOT COUNTY NURSING HOMERESULTS
– Outcome– No back injuries since 1997– Decreased workers compensation– Less turnover
A total investment of $155,000 resulted in no back injuries during the past 5 years.
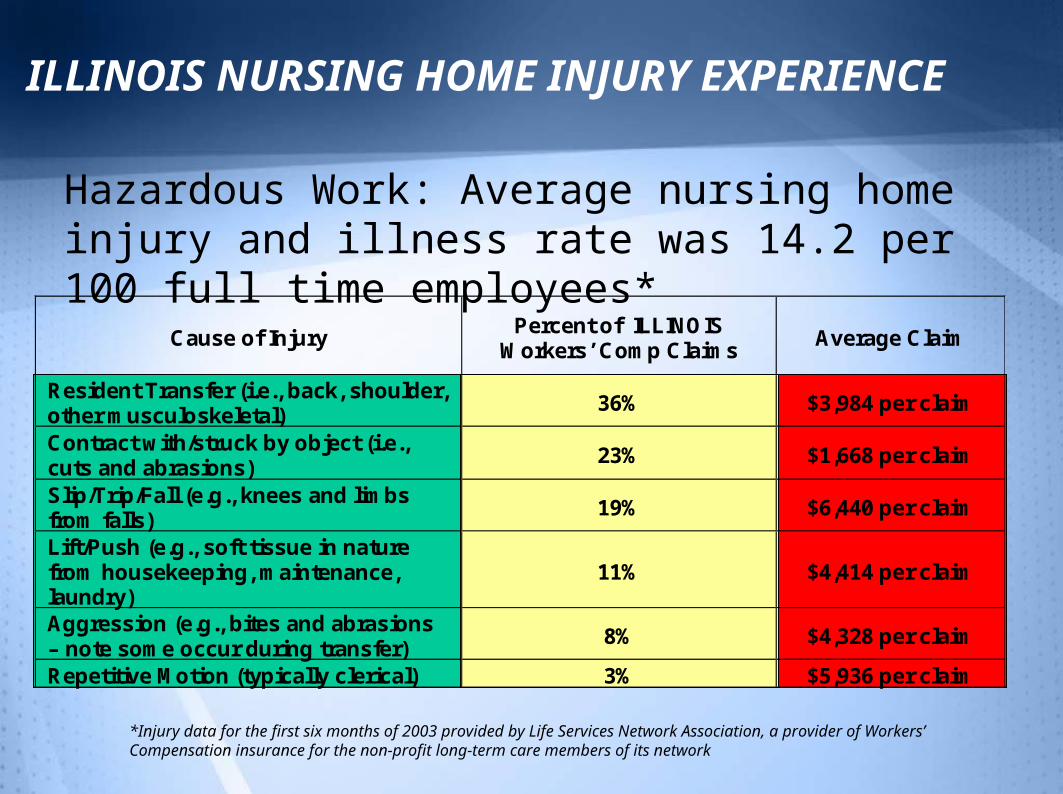
Cause of Injury Percent of ILLINOIS
Workers’ Comp Claims Average Claim
Resident Transfer (i.e., back, shoulder, other musculoskeletal)
36% $3,984 per claim
Contract with/struck by object (i.e., cuts and abrasions)
23% $1,668 per claim
Slip/Trip/Fall (e.g., knees and limbs from falls)
19% $6,440 per claim
Lift/Push (e.g., soft tissue in nature from housekeeping, maintenance, laundry)
11% $4,414 per claim
Aggression (e.g., bites and abrasions – note some occur during transfer)
8% $4,328 per claim
Repetitive Motion (typically clerical) 3% $5,936 per claim
ILLINOIS NURSING HOME INJURY EXPERIENCE
Hazardous Work: Average nursing home injury and illness rate was 14.2 per 100 full time employees*
*Injury data for the first six months of 2003 provided by Life Services Network Association, a provider of Workers’ Compensation insurance for the non-profit long-term care members of its network
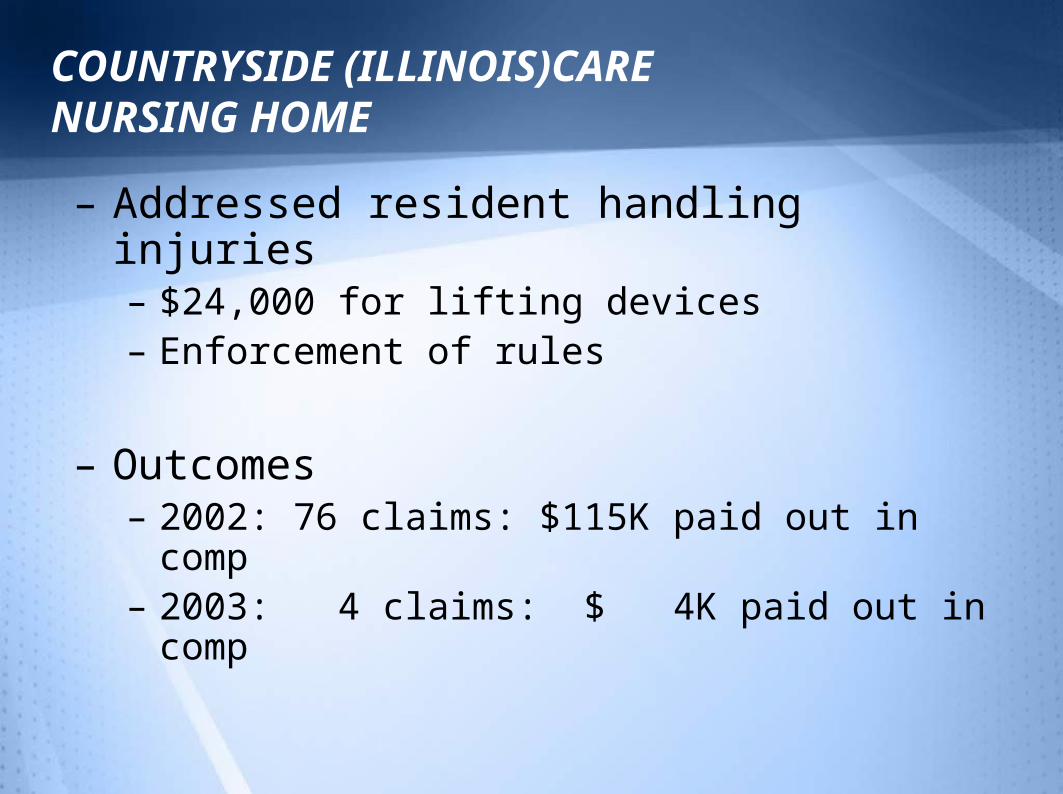
COUNTRYSIDE (ILLINOIS)CARE NURSING HOME
– Addressed resident handling injuries– $24,000 for lifting devices– Enforcement of rules
– Outcomes– 2002: 76 claims: $115K paid out in comp– 2003: 4 claims: $ 4K paid out in comp
AUTO PRODUCTS MANUFACTURING (APM) CORPORATION
– 1988-1994: company growing rapidly
– 350-400 of the 425 employees were temp workers
– OSHA referral from local hospital - treating 2-6 injuries from plant daily
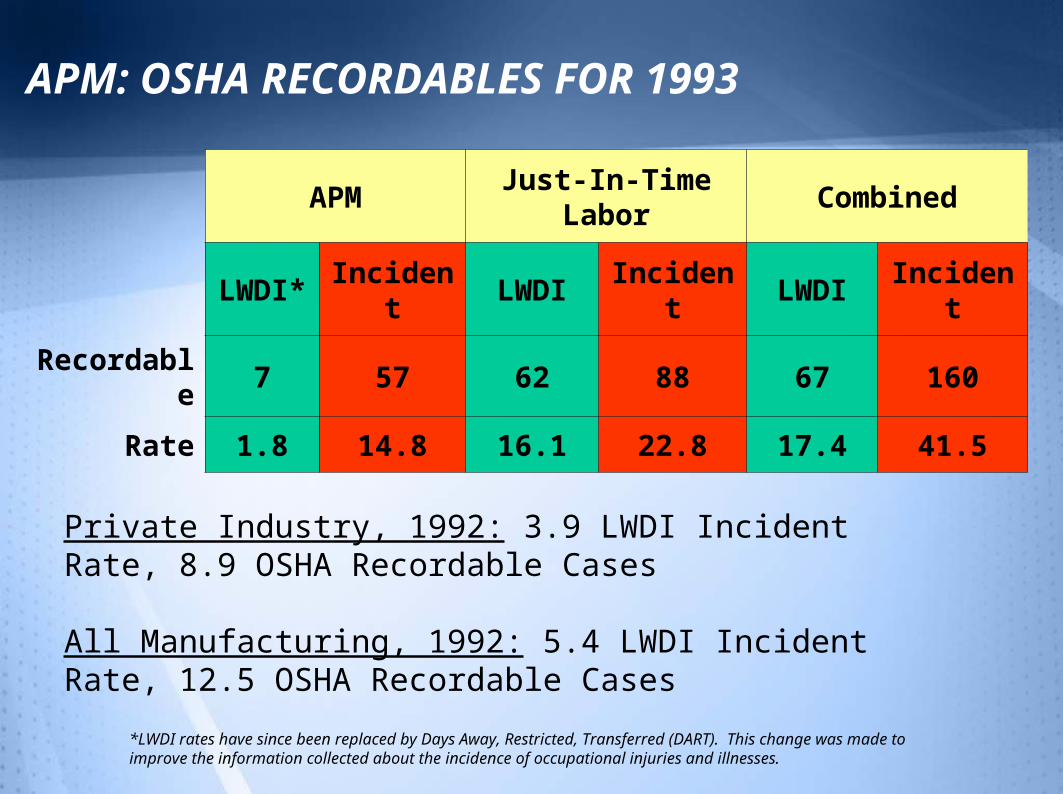
APM: OSHA RECORDABLES FOR 1993
APMJust-In-Time
LaborCombined
LWDI* Incident LWDI Incident LWDI Incident
Recordable 7 57 62 88 67 160
Rate 1.8 14.8 16.1 22.8 17.4 41.5
Private Industry, 1992: 3.9 LWDI Incident Rate, 8.9 OSHA Recordable Cases
All Manufacturing, 1992: 5.4 LWDI Incident Rate, 12.5 OSHA Recordable Cases
*LWDI rates have since been replaced by Days Away, Restricted, Transferred (DART). This change was made to improve the information collected about the incidence of occupational injuries and illnesses.
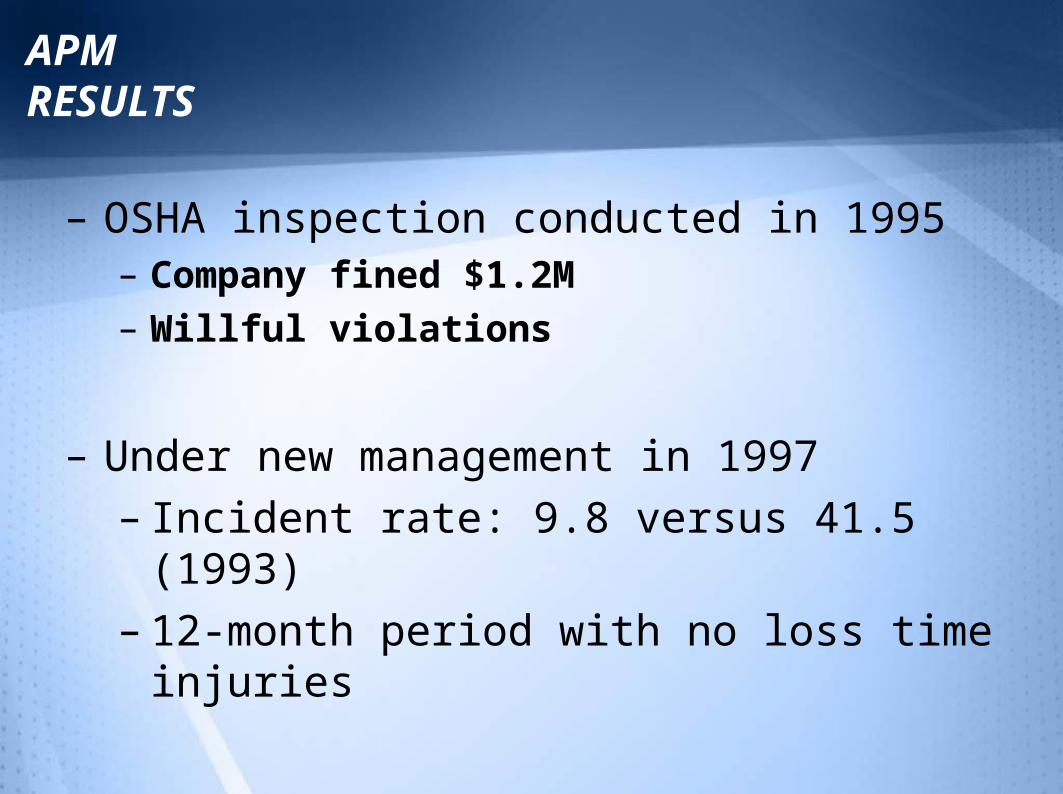
APM RESULTS
– OSHA inspection conducted in 1995– Company fined $1.2M– Willful violations
– Under new management in 1997
– Incident rate: 9.8 versus 41.5 (1993)
– 12-month period with no loss time injuries
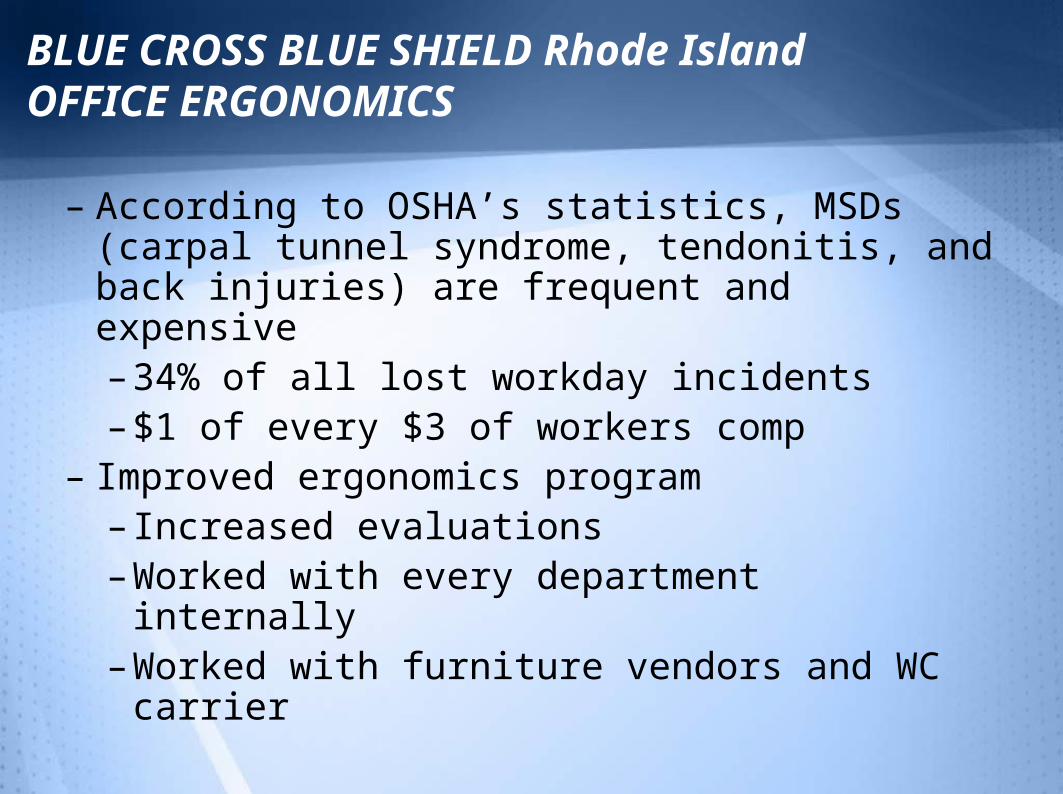
BLUE CROSS BLUE SHIELD Rhode IslandOFFICE ERGONOMICS
– According to OSHA’s statistics, MSDs (carpal tunnel syndrome, tendonitis, and back injuries) are frequent and expensive– 34% of all lost workday incidents– $1 of every $3 of workers comp
– Improved ergonomics program– Increased evaluations– Worked with every department internally– Worked with furniture vendors and WC
carrier
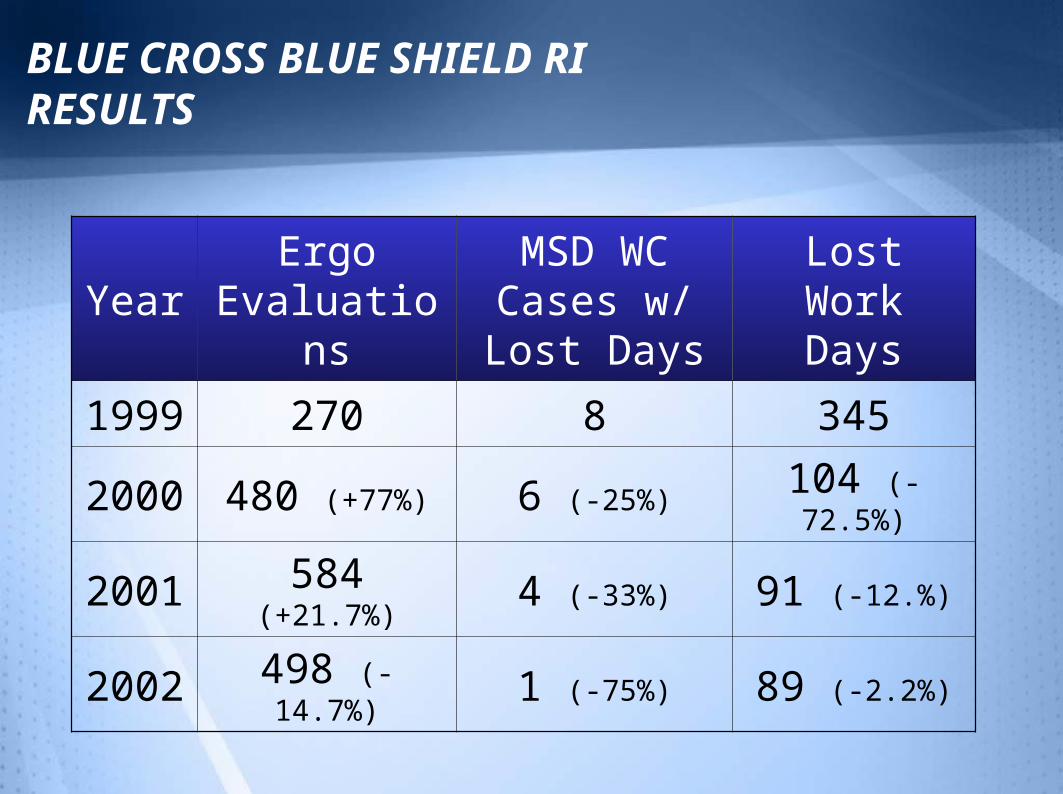
BLUE CROSS BLUE SHIELD RIRESULTS
YearErgo
Evaluations
MSD WC Cases w/ Lost Days
Lost Work Days
1999 270 8 345
2000 480 (+77%) 6 (-25%) 104 (-72.5%)
2001 584 (+21.7%) 4 (-33%) 91 (-12.%)
2002 498 (-14.7%) 1 (-75%) 89 (-2.2%)
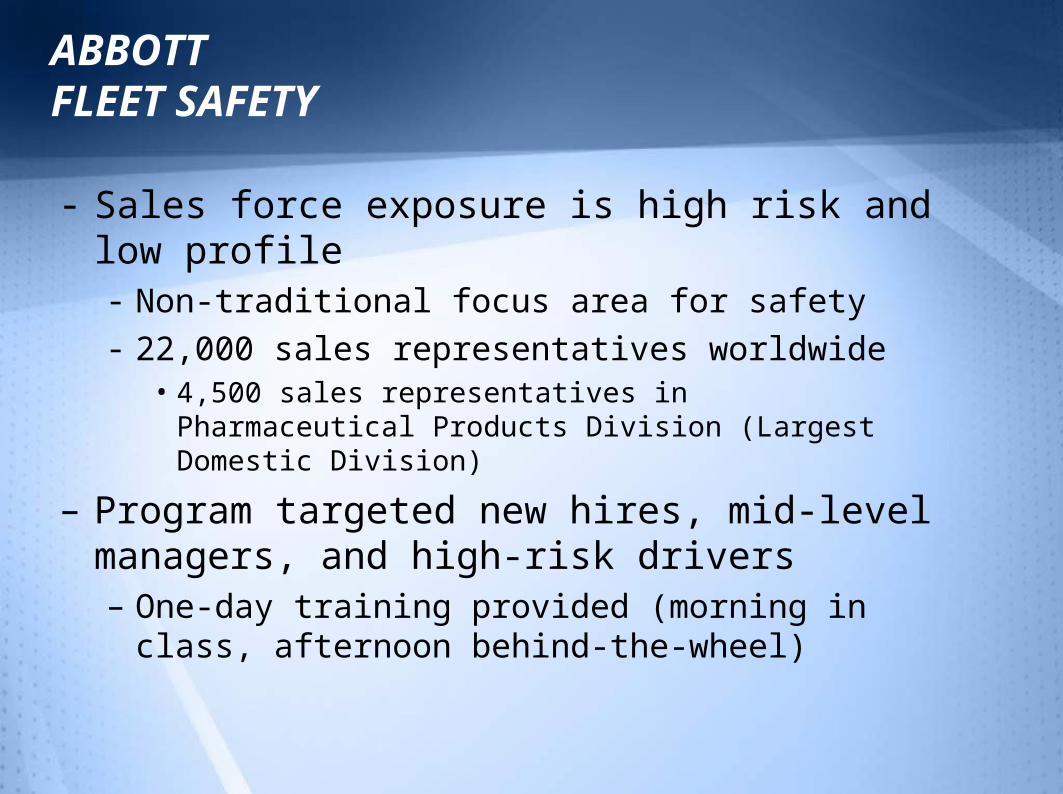
ABBOTT FLEET SAFETY
- Sales force exposure is high risk and low profile- Non-traditional focus area for safety- 22,000 sales representatives worldwide
• 4,500 sales representatives in Pharmaceutical Products Division (Largest Domestic Division)
– Program targeted new hires, mid-level managers, and high-risk drivers – One-day training provided (morning in class,
afternoon behind-the-wheel)
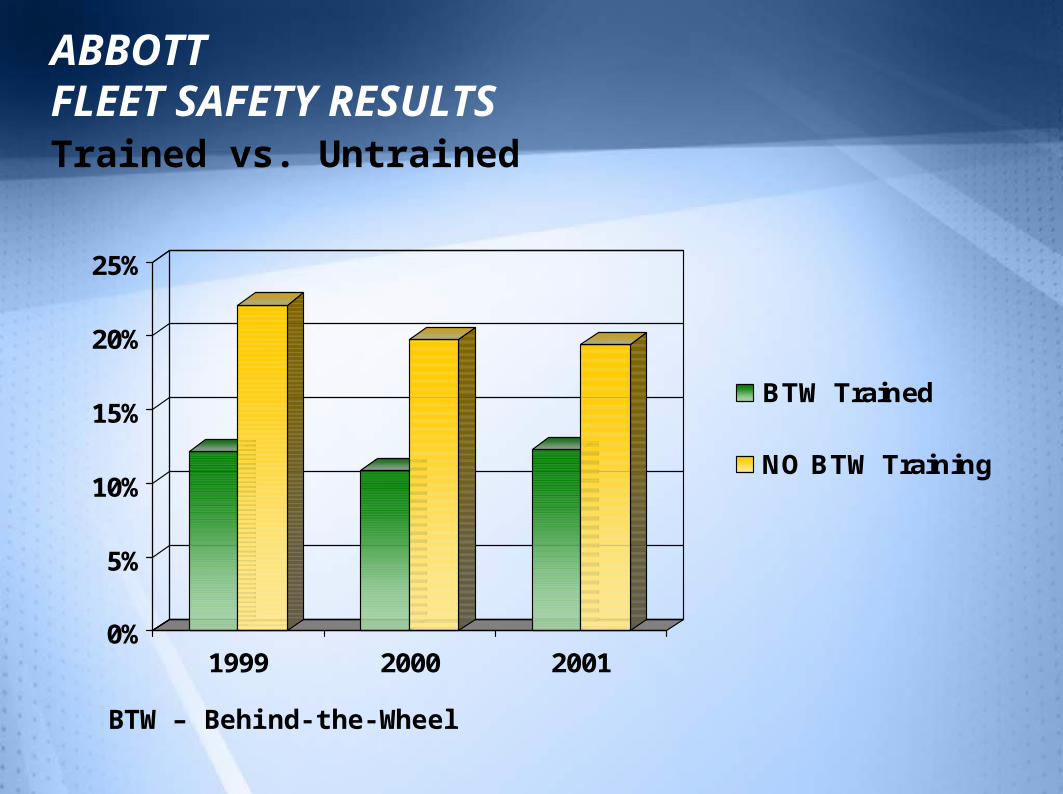
ABBOTT FLEET SAFETY RESULTS Trained vs. Untrained
0%
5%
10%
15%
20%
25%
1999 2000 2001
BTW Trained
NO BTW Training
BTW – Behind-the-Wheel
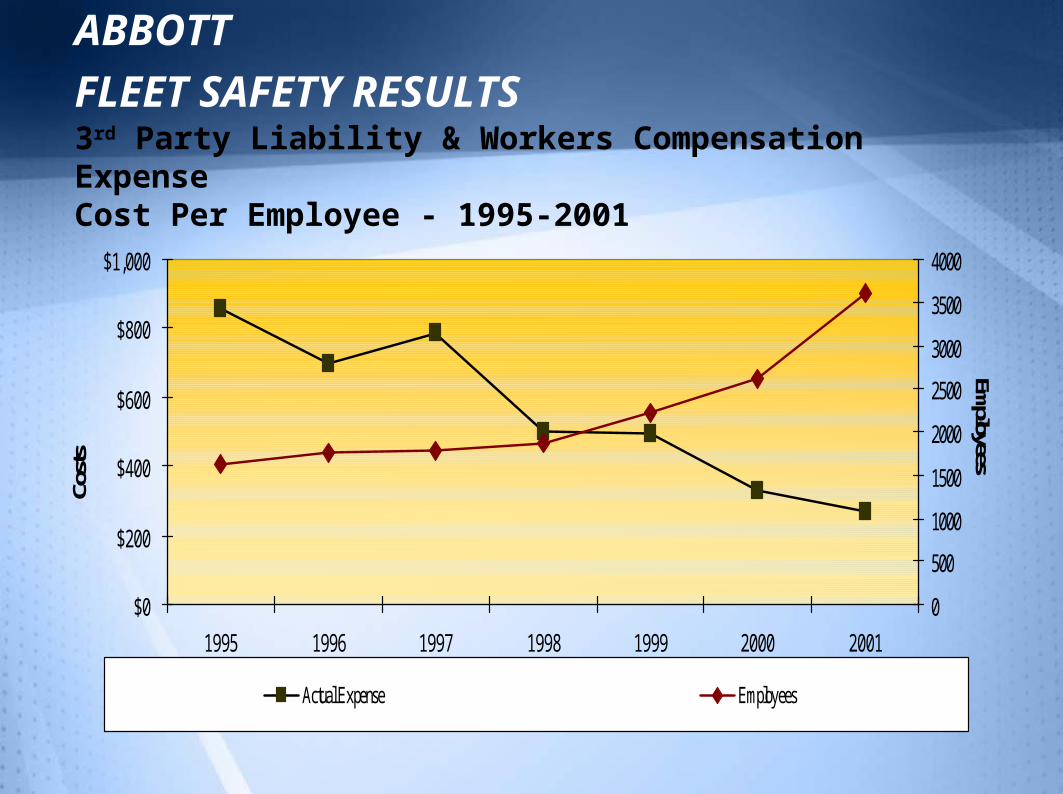
ABBOTT
FLEET SAFETY RESULTS 3rd Party Liability & Workers Compensation ExpenseCost Per Employee - 1995-2001
$0
$200
$400
$600
$800
$1,000
1995 1996 1997 1998 1999 2000 2001
Costs
0
500
1000
1500
2000
2500
3000
3500
4000
Employees
Actual Expense Employees
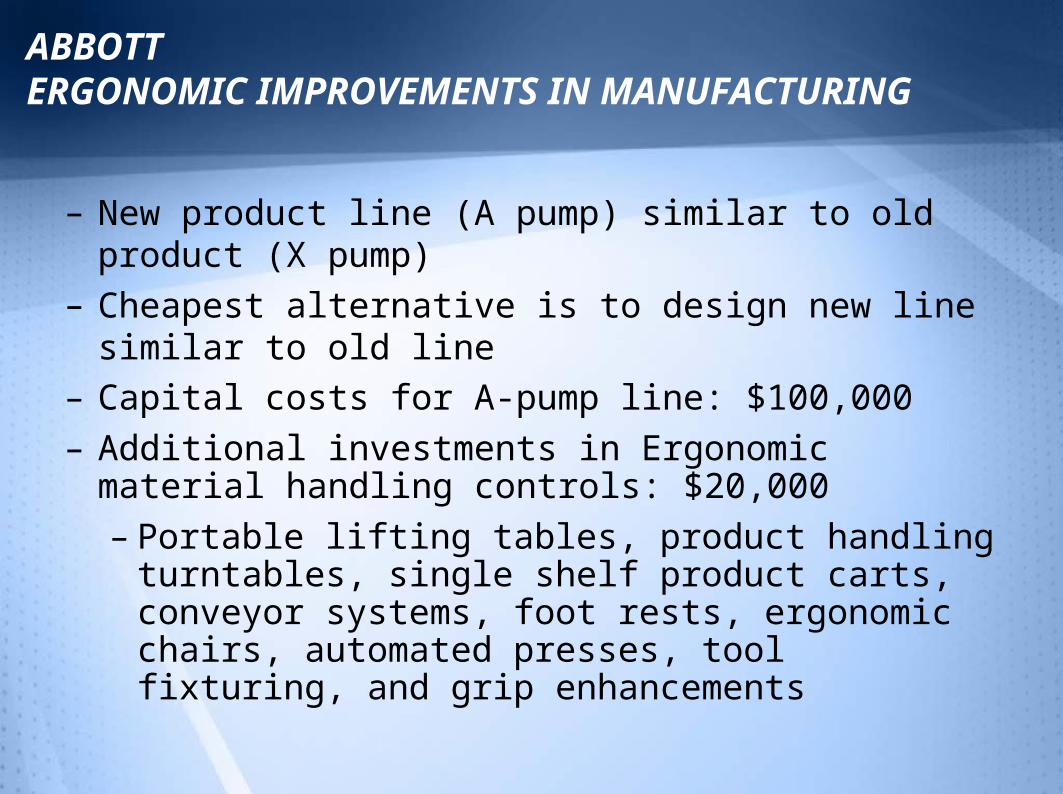
ABBOTT ERGONOMIC IMPROVEMENTS IN MANUFACTURING
– New product line (A pump) similar to old product (X pump)
– Cheapest alternative is to design new line similar to old line
– Capital costs for A-pump line: $100,000
– Additional investments in Ergonomic material handling controls: $20,000
– Portable lifting tables, product handling turntables, single shelf product carts, conveyor systems, foot rests, ergonomic chairs, automated presses, tool fixturing, and grip enhancements
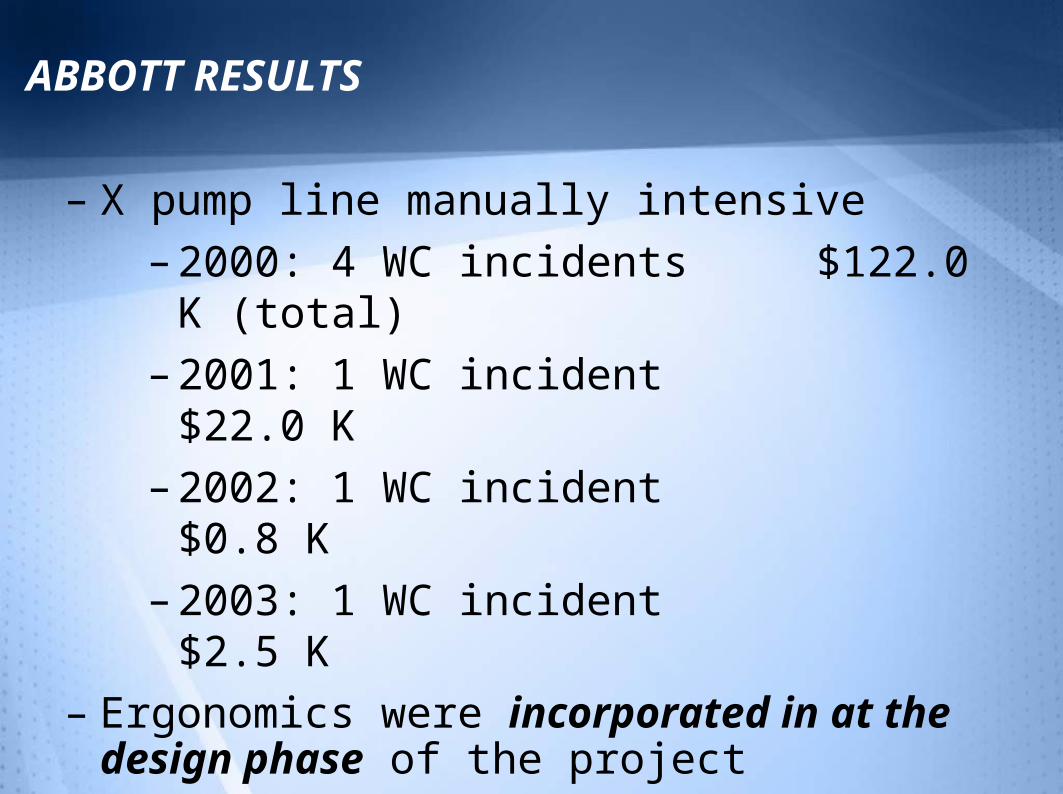
ABBOTT RESULTS
– X pump line manually intensive
– 2000: 4 WC incidents $122.0 K (total)
– 2001: 1 WC incident $22.0 K
– 2002: 1 WC incident $0.8 K
– 2003: 1 WC incident $2.5 K
– Ergonomics were incorporated in at the design phase of the project
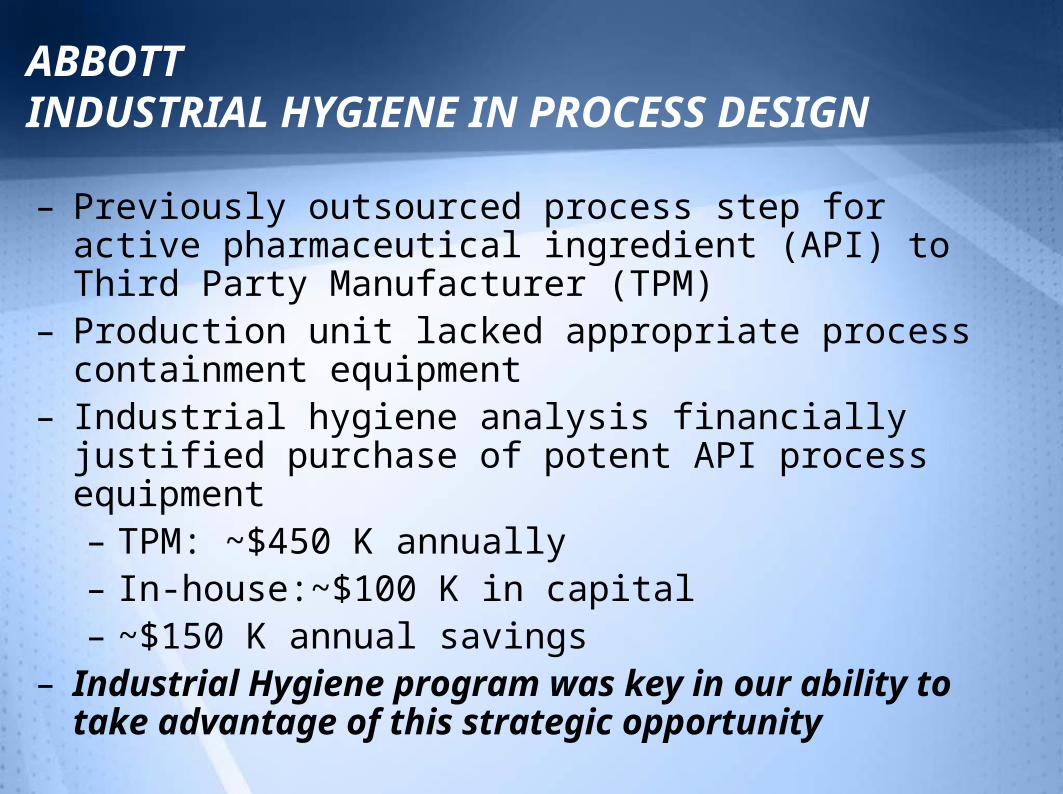
ABBOTT INDUSTRIAL HYGIENE IN PROCESS DESIGN
– Previously outsourced process step for active pharmaceutical ingredient (API) to Third Party Manufacturer (TPM)
– Production unit lacked appropriate process containment equipment
– Industrial hygiene analysis financially justified purchase of potent API process equipment– TPM: ~$450 K annually– In-house:~$100 K in capital– ~$150 K annual savings
– Industrial Hygiene program was key in our ability to take advantage of this strategic opportunity

This slide intentionally
left blank.
SAFETY IS NOT AN EXPENSE --
IT IS AN INVESTMENT