the bayview/hunters point community resiliency …...trees can improve air quality by absorbing...
TRANSCRIPT

San Francisco Department of Public Health 1
The Bayview/Hunters Point
Community Resiliency Assessment
The objectives of the Bayview Hunters Point Neighborhood Community Resiliency Assessment
are to identify potential hazards, prioritize their likelihood, and briefly summarize important
contextual factors that will impact the severity of the hazard. These contextual factors include
the accessibility of public transportation, community connectedness, the availability of goods
and services, housing quality, economic wellbeing, demographics, health and well-being.
Community resiliency is a compilation of these contextual factors: the ability or inability of a
community to prepare and respond to acute external stressors, such as a disaster or chronic
stressors such as climate change.
Bayview Hunters Point Neighborhood Community Resiliency Assessment:
1. An introduction to the neighborhood.
2. A summary of Bayview Hunters Point neighborhood resiliency indicators.
3. A hazard-analysis of neighborhood vulnerability and resiliency. The hazards will be
organized from greatest risk to least great risk.
4. All indicator maps with descriptions in the appendix.
Introduction: Bayview Hunters Point
The Bayview Hunters Point Neighborhood is
located on the southeastern edge of San Francisco,
between the Bay and Highway 101, from Cesar
Chavez Street in the north all the way to the
border of Brisbane in the south.
Because of its long bayside border, the Bayview
Hunters Point neighborhood has been historically
defined by a heavy industrial, naval, and shipping
presence. As these industries have waned, much of the land is in the process of being
repurposed as large-scale housing and retail developments, and open space. 3rd Street cuts
diagonally through Bayview and acts as the major commercial corridor of the neighborhood.
The following pages include introductory neighborhood maps that introduce the location of
open space, retail, and public assets such as fire stations, police stations, and health care
facilities.

San Francisco Department of Public Health 2

San Francisco Department of Public Health 3

San Francisco Department of Public Health 4
Community Resiliency Indicators
Community Resiliency Indicators measure both measure both resilience and recovery, to a
hazard event and are also used to assess areas and populations of high vulnerability, which is
often indicative of an inability to resist or respond to disaster. Vulnerability and resilience both
play a role in how a disaster will impact a community and how that community will recover. The
following list of community resiliency indicators was developed after an extension literature
review, engagement process, and review by City staff and community members. More
information on community resiliency indicators can be found at www.sfclimatehealth.org.
The community resiliency indicators are divided into nine categories: hazards, environment,
community, public realm, housing, economic, health, and demographic. Each category has a
resiliency score on a scale of 1 (least resilient) to 5 (most resilient). The score is comparative
and ranks Bayview Hunters Point to other San Francisco neighborhoods.
The Bayview Hunters Point neighborhood is vulnerable to stressors scores below the City
average for most indicators. Non-hazard indicators where the neighborhood is particularly
more vulnerable than San Francisco citywide are colored red. These indicators are: tree cover,
violent crimes, overcrowding, preventable hospitalizations, non-white populations, and
poverty. Hazard risk will be discussed in detail later in the assessment.
Tree Cover
Tree cover and tree canopy can both increase storm-water absorption and provide shade
during extreme heat events. Trees can improve air quality by absorbing pollutants.
Violent Crimes
Besides the physical and emotional trauma of a violent crime, a high violent crime rate can
exacerbate distrust among neighbors and communities and is negatively correlated with social
cohesion.
Overcrowding
Overcrowded households often result in poorer living conditions and can impact both physical
and mental health. Overcrowding can exacerbate the effect of an extreme heat event, and
overcrowded households often have poor ventilation.

San Francisco Department of Public Health 5
Preventable Hospitalizations
Neighborhoods with high rates of preventable hospitalizations indicate that residents of these
neighborhoods may not be receiving proper care on a routine basis. These populations are
among the most vulnerable in a hazard situation.
Ethnicity
Because of historical and current structural, political, cultural and economic power imbalances,
many minority groups lack the political access and economic resources to recover from hazard
events.
Poverty
Families under 200% of the poverty rate are less likely to have the means to prepare for hazard
events and absorb and recover from losses associated with hazard events. Poverty also
institutes barriers on everyday life including poor nutrition, lack of preventative medical
services, and unhealthy housing conditions.
Bayview Hunters Point San Francisco
Hazard Percent of the neighborhood in the 100 year storm flood plain.
6.83% 0.02%
Percent of the neighborhood in ‘high’ or ‘very high’ heat vulnerability areas
58.65% 26.70%
Percent of the neighborhood in a liquefaction or landslide zone
55.73% 22.86%
Hazard Risk Score 1
Environment Percent impervious surface 69.32% 63.50%
Percent tree cover 6.75% 13.74%
Percent of land with 'low' or 'very low' air quality 0.04% 3.73%
Percent of the neighborhood within .25 miles of a contamination risk
26.98% 0.00%
Environmental Resiliency Score 1
Transportation Average minutes of active transportation (walk+bike) per day
15.34 16.4
Public Transit Score 13.75 14.6
Transportation Resiliency Score 1
Community Violent crimes, per 1000 people 105.8 53.1
Voting rates in the 2012 Presidential Election 63.18% 72.50%
Percent of the population that moved to San Francisco within the last year
4.72% 7.60%
Percent of the population without United States citizenship
23.66% 18.00%
Percent of population living in households without English spoken “Very Well”
28.18% 23.20%
Community Resiliency Score 2
San Francisco Department of Public Health 6
Bayview Hunters Point San Francisco
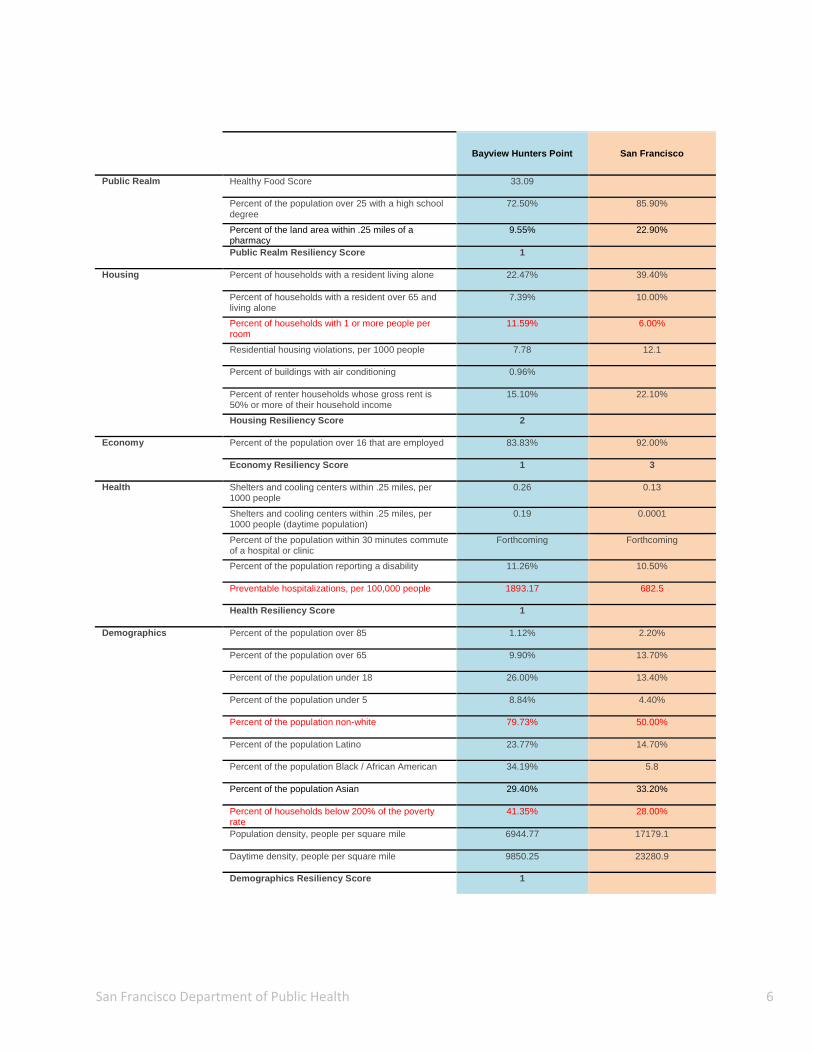
Public Realm Healthy Food Score 33.09
Percent of the population over 25 with a high school degree
72.50% 85.90%
Percent of the land area within .25 miles of a pharmacy
9.55% 22.90%
Public Realm Resiliency Score 1
Housing Percent of households with a resident living alone 22.47% 39.40%
Percent of households with a resident over 65 and living alone
7.39% 10.00%
Percent of households with 1 or more people per room
11.59% 6.00%
Residential housing violations, per 1000 people 7.78 12.1
Percent of buildings with air conditioning 0.96%
Percent of renter households whose gross rent is 50% or more of their household income
15.10% 22.10%
Housing Resiliency Score 2
Economy Percent of the population over 16 that are employed 83.83% 92.00%
Economy Resiliency Score 1 3
Health Shelters and cooling centers within .25 miles, per 1000 people
0.26 0.13
Shelters and cooling centers within .25 miles, per 1000 people (daytime population)
0.19 0.0001
Percent of the population within 30 minutes commute of a hospital or clinic
Forthcoming Forthcoming
Percent of the population reporting a disability 11.26% 10.50%
Preventable hospitalizations, per 100,000 people 1893.17 682.5
Health Resiliency Score 1
Demographics Percent of the population over 85 1.12% 2.20%
Percent of the population over 65 9.90% 13.70%
Percent of the population under 18 26.00% 13.40%
Percent of the population under 5 8.84% 4.40%
Percent of the population non-white 79.73% 50.00%
Percent of the population Latino 23.77% 14.70%
Percent of the population Black / African American 34.19% 5.8
Percent of the population Asian 29.40% 33.20%
Percent of households below 200% of the poverty rate
41.35% 28.00%
Population density, people per square mile 6944.77 17179.1
Daytime density, people per square mile 9850.25 23280.9
Demographics Resiliency Score 1

San Francisco Department of Public Health 7
In a hazard event, residents of residential care homes and facilities will require city resources as
this population is more likely to have pre-existing health conditions, and are often reliant on
medicine, respirators and other medical devices. Any disruption in electricity service or public
transportation service, or sheltering-in-place will be particularly impactful to this population.
Although Bayview Hunters Point has a relatively low percentage of elderly residents when
compared to San Francisco citywide, a similarly low concentration of pharmacies renders
knowing the location of these facilities important in any resilience planning effort.
The following is a map of residential care homes and facilities for the elderly, children,
chronically-ill, and other vulnerable populations that will require special aid and city services in
the event of a hazard.

San Francisco Department of Public Health 8
Hazard Assessment - Extreme Heat (Very High Risk)
With few trees and a high concentration of impervious surface, Bayview Hunters Point is at very
high risk for extreme heat. According to historical weather and mortality data gathered by the
San Francisco Department of Public Health, there is an increase in health risk when
temperatures ‘spike’ over 85-degrees for two straight days without an adequate drop in
nighttime temperature. Those most vulnerable to extreme heat are children, the elderly,
people with diabetes and other preexisting conditions, and people with mobility issues.
Bayview Hunters Point has high levels of both children and people who do not receive regular
medical attention.

San Francisco Department of Public Health 9
Hazard Assessment – Earthquakes (Very High Risk)
According to the liquefaction/landslide map, much of the Bayview Hunters Point neighborhood
has been built on sediment, infill and other unstable land predicted to liquefy in an earthquake.
Structures built on top of liquefaction or landslide zones are prone to severe shaking in an
earthquake. Liquefaction and landslide zones are a significant threat to public health. In the event of an earthquake, proximity to community assets and commercial resources
increases in importance if there are gaps in transportation, electricity, water, and other
important services.

San Francisco Department of Public Health 10
Hazard Assessment - Flood Inundation (Very High Risk)
As climate change accelerates the pace of sea-level rise, and erratic precipitation patterns and
pineapple express atmospheric rivers cause extreme storms, flood inundation will become a
problem for San Francisco’s east and west coastlines.
The 52-inch flood inundation map, a 100-year-storm with 12-inches of sea level rise,
demonstrates how flooding threatens the bay shoreline, especially near Islais Creek. San
Francisco is also prone to sewer overflows, downed trees and power-lines, and other inland
effects of storms. According to a rough analysis of 311 calls regarding flooding during the most
recent extreme storm event, many sewer overflows occurred along Ingalls Street in the
southeast quadrant of the neighborhood.

San Francisco Department of Public Health 11
Hazard Assessment - Air Quality (High Risk)
Because the neighborhood both straddles Interstate 280 and Highway 101, and has heavy
industrial sites, the Bayview Hunters Point neighborhood is at a high risk for poor air quality
compared to the rest of San Francisco.
Residents of the neighborhood most vulnerable to the respiratory effects of poor air quality
include children, the elderly, and those with preexisting conditions such as asthma or allergies.

San Francisco Department of Public Health 12
Hazard Assessment – Tsunami (High Risk)
The coast of the Bayview Hunters Point Neighborhood lies in a Tsunami Hazard Zone. A
Tsunami would occur after a large earthquake off the Pacific Coast. The impact of a Tsunami
could be devastating to San Francisco coastal communities.
San Francisco Department of Public Health
Hazard indicators
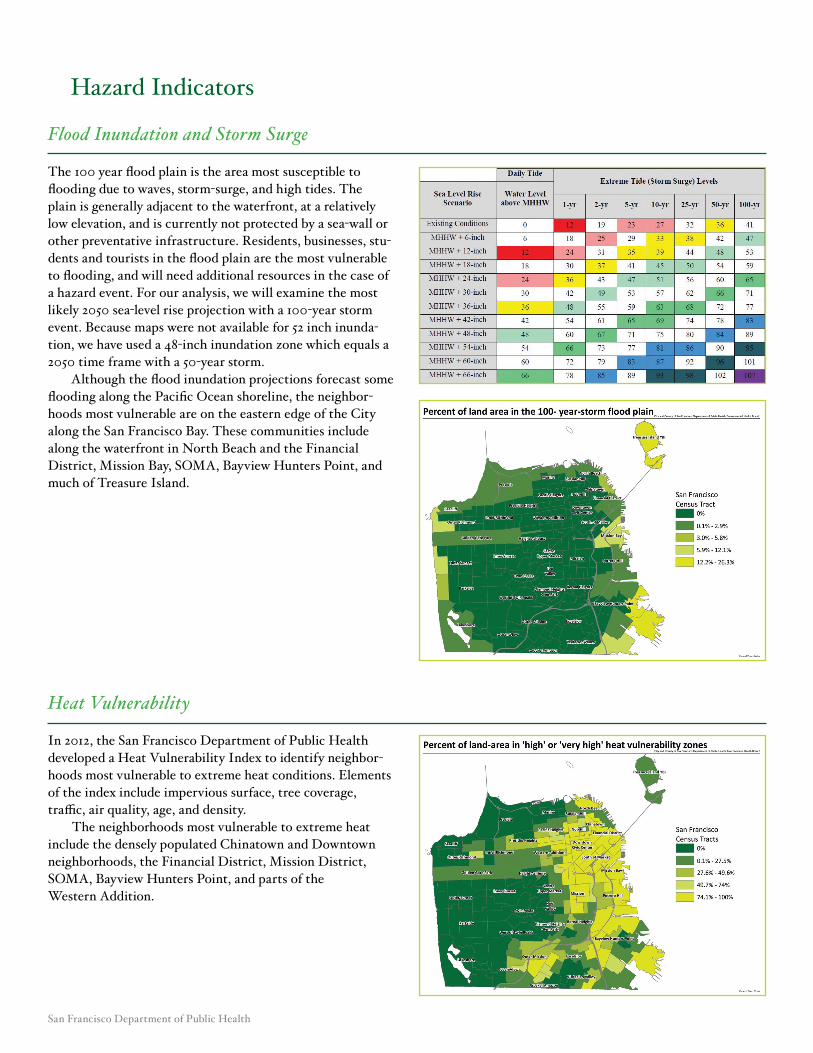
Flood Inundation and Storm Surge
The 100 year flood plain is the area most susceptible to flooding due to waves, storm-surge, and high tides. The plain is generally adjacent to the waterfront, at a relatively low elevation, and is currently not protected by a sea-wall or other preventative infrastructure. Residents, businesses, stu-dents and tourists in the flood plain are the most vulnerable to flooding, and will need additional resources in the case of a hazard event. For our analysis, we will examine the most likely 2050 sea-level rise projection with a 100-year storm event. Because maps were not available for 52 inch inunda-tion, we have used a 48-inch inundation zone which equals a 2050 time frame with a 50-year storm. Although the flood inundation projections forecast some flooding along the Pacific Ocean shoreline, the neighbor-hoods most vulnerable are on the eastern edge of the city along the San Francisco Bay. These communities include along the waterfront in north Beach and the Financial District, mission Bay, Soma, Bayview Hunters Point, and much of Treasure Island.
HeatVulnerability
in 2012, the San Francisco Department of Public Health developed a Heat Vulnerability index to identify neighbor-hoods most vulnerable to extreme heat conditions. Elements of the index include impervious surface, tree coverage, traffic, air quality, age, and density. the neighborhoods most vulnerable to extreme heat include the densely populated chinatown and Downtown neighborhoods, the Financial District, mission District, Soma, Bayview Hunters Point, and parts of the Western Addition.

San Francisco Department of Public Health
ImperviousSurface
Impervious surfaces can exacerbate the impact of flood inun-dation and extreme heat. Neighborhoods without natural areas can experience both increased storm-water runoff and diminished heat absorption. the neighborhoods with the highest concentration of impervious surfaces include both the urban core of the city: Downtown, the Financial District, chinatown, Soma and Nob Hill. The SOMA neighborhood is vulnerable to both extreme heat and flood inundation. Its high concentration of impervious surface compounds this risk.
TsunamiandLiquefaction/LandslideZones
Although not climate change-related in nature, San Francisco is susceptible to both tsunami and earthquake hazard events. Liquefaction and landslide zones are those most vulnerable to shaking in an earthquake. Liquefaction zones are areas where the soil is less stable and more prone to liquefying. If the soil liquefies, the structures above are prone to more extreme and erratic movements in times of stress, such as an earthquake. The areas with the largest liq-uefaction zones are along the eastern border of the city and the Marina district. These areas are comprised of landfill as opposed to natural hard rock or other solid surfaces. Similar to extreme heat, flood inundation, and air quality concerns, tsunami and earthquake vulnerability are exacerbated by pre-existing socioeconomic inequalities. The process for pre-paring for these events is similar to that of climate change-related disasters. In tsunamis and earthquakes, resiliency is affected by quality of housing, financial resources available, neighborhood amenities, government services, public trans-portation, and individual pre-existing physical and mental health conditions.
environmental indicators

San Francisco Department of Public Health
Contaminated Sites
in a hazard event, living or working within close proxim-ity of a contaminated site can increase risk of exposure to hazardous materials. Runoff from inundation events may contaminate drinking water or storm water, and fumes caused by extreme heat may worsen nearby air quality. In San Francisco, many sites adjacent to the Bay Side of the waterfront have had heavy-industrial uses. These sites, in the mission Bay, Bayview Hunters Point and Soma neighbor-hoods, would pose a significant risk to surrounding commu-nities in a hazard event.
AirQuality
the number of San Franciscans who live in census tracts with PM2.5 concentration above California standards is set to increase. Using data from the Bay Area Air Quality Management District (BAAQMD), the San Francisco Department of Public Health modeled total PM2.5 concen-tration from all sources in the city. the San Francisco neighborhoods with the worst air quality include those along the freeway corridors, heavily-trafficked arterials, and/or adjacent to industrial activities. these communities include Bayview Hunters Point, outer mission, the mission, Bernal Heights, the Financial District, and SOMA.
TreeCover/Canopy
in contrast to the impervious surface indicator, tree canopy can both increase storm-water absorption and provide shade during heat waves. Trees can improve air quality by absorb-ing carbon dioxide, producing oxygen, and trapping and filtering other pollutants. While the areas with the highest concentration of tree cover are Golden Gate Park, the Presidio, and other natural areas. The Mission District, Noe Valley, and the Western Addition have higher-than-average tree coverage. SOMA, chinatown, Bayview Hunters Point, mission Bay, and the Downtown neighborhoods have lowest percentage of tree cover in the city.

San Francisco Department of Public Health
transportation indicators
ActiveTransportation
active transportation is correlated with health outcomes including lower rates of obesity, diabetes and heart disease. those that routinely bicycle or walk will be less dependent on city services in the case of a hazard event. The urban design of neighborhoods effects active transportation totals, and the neighborhoods that are the densest and closest to jobs, stores, and other services encourage active transportation. The transportation districts with the highest percentages of residents who make trips by foot or bicycle are Downtown, Chinatown, SOMA and the Mission.
Public Transit Score
the public transit score is a relative measure of the number of transit routes within one mile, weighted by frequency and distance. Those served best by public transit live in neigh-borhoods that are generally more compact, and offer more social services. The areas with the best public transit service are the downtown neighborhoods of Downtown, Financial District, chinatown, nob Hill, and Soma, and along the BART line to Mission and Bernal Heights. The areas with the least transit access are the Bayview Hunters Point, Parkside and the Outer Sunset. These populations are more likely to be car-dependent.
ViolentCrime
High rates of violent crime exacerbates distrust among neighbors and communities. Violence is negatively correlated with social cohesion. Using the measurement of offenses / 1000 people, the areas with the highest violent crime rate include the Bayview Hunters Point, Soma, Downtown, and the Financial district.
community indicators

San Francisco Department of Public Health
VotingRates
Voting rates can approximate the degree to which residents are tapped into city services. Political engagement has been proven to be correlated with health effects—those that are more politically aware also have greater awareness of govern-ment policies and procedures. The areas with the highest voter turnout are the twin Peaks, West of twin Peaks, noe Valley and the Castro/Upper Market neighborhoods. These tend to be some of the more affluent neighborhoods in the city. Conversely, some of the neighborhoods with the lowest turnout include the Bayview Hunters Point and Visitacion Valley neighborhoods.
NewtotheRegion
those new to a community may not be as aware of local organizations, evacuation plans, and private businesses, and may be more likely to be socially isolated. The neighbor-hoods with the highest concentration of residents who have lived in San Francisco for a year or less include the neighbor-hoods with universities like Lakeshore (SF State), the Inner Richmond (USF) and Mission Bay (UCSF), and neighbor-hoods like SOMA with large concentrations of biotech firms and other large employment centers.
Citizenship
those without United States citizenship have less access to many public resources. Those without citizenship are less likely to have health insurance, less likely to ask police and health officials for assistance in the case of emergency, less likely to be employed, and are more likely to be low-income. Although non-citizens may have robust informal networks that strengthen their social capital, this population is more likely to be isolated from the government and public service sectors. The neighborhoods with the highest concentration of residents without american citizenship are chinatown, mission Bay, north Beach, and the southern Visitacion Valley and Excelsior neighborhoods.

San Francisco Department of Public Health
Public realm indicators
Non-EnglishSpeaking
Those who cannot speak English will have a more difficult time recognizing warnings and public service announce-ments, and interacting with public health officials. Though this population may have strong informal social capital, isolation from city services puts those without english comprehension at risk in a hazard event. The neighbor-hoods with the highest proportion of non-English speak-ing residents include the chinatown, Visitacion Valley, and Crocker-Amazon, Outer Sunset, and Outer Richmond neighborhoods.
Educational Attainment
according to a Vienna University of economics and Business study, there is no indicator more correlated with resilience to climate hazard events than educational attain-ment. Education allows a resident to more adequately prepare for, respond to, and recover from disaster events. those with higher levels of educational attainment have more job opportunities and are likelier to have higher wages. the neighborhoods with the lowest percentage of residents 25-and-older with a high school diploma include Chinatown and Downtown, and the southeastern neighborhoods of Bayview Hunters Point, crocker amazon, Visitacion Valley and Excelsior.
Healthy Food Score
those in proximity to healthy food are generally less vulnerable before, during, and after a hazard event. During a hazard event, populations near food retail establishments will have the access to healthy food options that may prove more difficult for auto-dependent populations. The food market score is a relative measure of the number and variety of retail food resources within one mile, weighted by food offerings and distance. The neighborhoods that have the highest food retail score are some of the densest neighborhoods in the city, including the Financial District, Castro/Upper Market, Nob Hill, and Chinatown.

San Francisco Department of Public Health
Proximity and Access to Pharmacies
those dependent on medication are especially vulnerable in hazard events. If residents are forced to shelter in place or the transit network becomes disrupted, many residents might not be able to access a pharmacy to pick up necessary prescriptions. The neighborhoods with the largest percent-age of residents within a quarter-mile of a pharmacy are the dense heavily-commercial Downtown, Financial District, Chinatown, and Nob Hill neighborhoods. The Excelsior, Visitacion Valley, outer Sunset, and treasure island, all primarily residential, lack access to pharmacies.
Housing indicators
LivingAlone
Those that live alone are at greater risk of illness or injury. they are more likely to be socially isolated, and will need more assistance to prepare for a disaster, to shelter dur-ing a disaster, and to recover after a disaster. In the 2003 Paris heat wave, 92% of all hospitalized lived alone. At even greater risk are elderly residents living alone. This popula-tion may need assistance evacuating and obtaining necessary medication or care. The neighborhoods with the highest percentage of one person households are Downtown / civic Center, Marina and Lakeshore. Downtown / Civic Center also has a relatively high percentage of people aged 65-and-older living alone. This population will need extra city resources in the case of a hazard event.

San Francisco Department of Public Health
Overcrowding
SFDPH defines an overcrowded household as a household with 1 or more resident per room. Residential overcrowd-ing has long been identified as an important housing issue and health concern. Residential overcrowding is a complex issue which involves several push factors such as housing affordability, low income, and immigration concentrations. overcrowding results in poorer living conditions and can contribute to higher levels of ill-health, including respiratory and infectious disease such as tuberculosis. Overcrowding also tends to be linked to poor ventilation and increased moisture in the house. Damp housing encourages mites, cockroaches, virus and molds, which lead to chronic illness. overcrowding not only impacts physical health, but also mental health, through high noise levels and lack of privacy. Crowding within housing units can increase the effect of extreme heat and heat hazard events, and can impede evacu-ation. Chinatown has the largest percent of overcrowded households, but Soma, the Financial District, and Downtown all have large concentrations of overcrowding.
ResidentialHealthandSafetyViolations
Housing quality is an important measure of risk and vul-nerability in hazard events. Passive cooling systems can prevent heat-related illnesses in extreme heat events. The effects of cold snaps can be mitigated with good insulation. Flood inundation events might exacerbate mold and rot. residences with high volumes of health and safety violations are more likely to be in either states of neglect or disuse. The Downtown neighborhood has the highest concentration of residential code violations from the Department of Building and inspections, the Fire Department, and the Department of Public Health.
Air Conditioning
Despite some disagreement between the climate change mitigation and adaptation communities over the use of air conditioning units, in housing stock without other forms of ventilation, air conditioning can prevent the health effects of extreme heat. Residents in buildings with centralized air conditioning units are at far lesser risk of internal heat stress. In multi-unit buildings without centralized air, personal units often place the financial burden of cooling on low income residents and incentivize disuse. According to a 2009 california residential appliance Saturation Study (RASS), most San Francisco residents live without access to air conditioning.

San Francisco Department of Public Health
ExcessiveRentBurden
Those that dedicate at least 50% or more of their monthly income to rent are likely to be vulnerable to any financial effects of climate hazard events. This population is the most at risk to become food insecure if agricultural prices increase, and some of the least likely to seek health care in the event of injury. The areas with the highest concentra-tion of rent burdened households are the Downtown and Bayview Hunters Point neighborhoods. Lakeshore and oceanview have high concentrations as well, but that could be due to San Francisco State University and its large student population.
economy indicators
EmploymentStatus
Those that are employed are more likely to have the finan-cial resources to prepare for and respond to, and absorb the indirect impacts of hazard situations. A community of coworkers can be an important resource to disseminate information before and after hazard events. Because health insurance is provided through an employer, those without steady employment forced to pay for out-of-pocket coverage may be disincentivized to seek health care. The neighbor-hoods with the highest concentration of unemployment are Bayview Hunters Point, Downtown, and Excelsior.

San Francisco Department of Public Health
in the case of a hazard event, walkable access to shelters and cooling centers allows residents without safe housing or air conditioning ability to get the assistance they require. the neighborhoods with the largest percentage of resi-dents within a quarter-mile of a shelter or cooling center are Downtown, Western addition, and marina neighbor-hoods. Visitacion Valley, Twin Peaks, and Mission Bay have little access to shelters and cooling centers. Those without automobiles may need assistance to reach a shelter or cooling center in the case of a hazard event. The development of cooling centers started in 2012. there are various resources from across many city depart-ments and agencies that will be utilized in preparation for or during an extreme heat emergency event and organizing cooling centers. SFDPH in conjunction with DEM has been developing a list of cooling centers and is developing moUs
Health indicators
Proximity and Access to Shelters and Cooling Centers
with those sites. This process is still on going. The initial list of cooling shelters was developed from analysis of high heat vulnerability areas and cross referencing those areas with the DEM shelter database. In addition, the San Francisco library has agreed for their facilities (where appropriate) to be used as cooling centers. San Francisco Human Service Agency (HSA) with support from American Red Cross (ARC) will be the lead agency to open and setup cooling centers
(including provision of staff and supplies). HSA will contact arc, DPH, and other departments if additional resources are needed. Because identifying and selecting cooling center and shelter locations is a fluid process, the proximity and access map is subject to change in the coming months and years.
ProximityandAccesstoHospitalsandClinics
the ability to access a hospital or clinic is tantamount in extreme hazard events. For populations without access to an automobile, the city transportation and health network influences the ease and accessibility of medical care. The outer richmond, outer Sunset, and Parkside neighborhoods to the west, and the southern crocker amazon, Visitacion Valley, excelsior, and ocean View neighborhoods all have a low density of medical care facilities while simultaneously in areas with low or very low transit scores.

San Francisco Department of Public Health
PreventableHospitalizations
the preventable hospitalizations indicator measures the reach of San Francisco outpatient care. Preventable hospi-talizations include diabetes, chronic obstructive pulmonary disease, hypertension, heart failure, dehydration, bacterial pneumonia, urinary tract infection, angina without proce-dure, and asthma. Those that have any of these pre-existing health conditions are highly vulnerable to hazard events. If a resident is hospitalized for one of these conditions, it also indicates that they might not receiving proper care on a routine basis. The areas with the highest rate of prevent-able hospitalizations include the Bayview Hunters Point, Chinatown, Western Addition and SOMA.
MobilityDisability
those with disabilities are at greater risk during a hazard event and may need assistance evacuating or getting to a cooling center during a hazard event. Chinatown, Financial District, Downtown and Soma have the highest percentage of disabled residents. These locations are all high-density, and well-served by public transit and healthy food options. conversely, the relatively isolated twin Peaks neighbor-hood’s large concentration of disabled residents may need more public assistance in the case of major hazard event.
Demographic indicators
Elderly populations are at an increased risk for mortality. they are vulnerable to cardiovascular, respiratory disease, and other heat-related illnesses. The elderly are also more likely to have mobility constraints that decrease resilience in disaster situations, are more likely to be socially isolated, and dependent on city and federal resources such as social security income. Children are similarly vulnerable. Children develop dehydration, malnutrition and exhaustion more quickly than adults. A child’s respiratory rate can be two-to-three times higher than an adult respiratory rate, so children experience the effects of poor air quality to a greater degree than an adult. During hazard situations, children may need assistance and resources to evacuate or seek shelter. Post-disaster, parents with children are more likely to be finan-cially burdened if day care facilities and schools are affected.
the elderly residents of chinatown are especially at risk due to the neighborhood’s high residential density, overcrowded living conditions, and urban heat island vulnerability. Some of the neighborhoods with the highest elderly population are located in the northeast quadrant of the city. These neighborhoods include chinatown, nob Hill, russian Hill, and Pacific Heights. The neighborhoods with the high-est concentration of elderly residential care facilities are the Western Addition and Presidio Heights. The elderly residents of chinatown are especially at risk due to the neighborhood’s high residential density, overcrowded living conditions, and urban heat island vulnerability. the areas with the largest percentage of children include the southern Bayview Hunters Point, Visitacion Valley, Crocker Amazon and West of Twin Peaks neighborhoods.
Age(Over85,Over65,Under18,andUnder5)

San Francisco Department of Public Health
in addition to large concentration of children, the daytime population of the Parkside and the outer Sunset neighbor-hood includes many students. In the event of a hazard event, these areas would require additional support and services.
Ethnicity
race and ethnicity are major indicators of community resil-ience. Because of historical and current structural, political, cultural, and economic power imbalances, many minority groups lack the political access and economic resources to recover from hazard events. Many of these same groups are often concentrated in at-risk neighborhoods of the city, live in vulnerable housing stock, and have greater rates of poverty. During the 2006 California heat wave, there were comparative increases in the rates of emergency department visits for most non-white racial and ethnic groups. much of San Francisco’s african american population is concentrated in the Bayview Hunters Point and Western Addition neighborhoods. Chinatown, the Outer Sunset, outer richmond, Parkside, crocker amazon, and Visitacion
Valley are all majority Asian. The Latino population is concentrated in the Mission District and Bernal Heights. the rest of the city is predominately white, with the highest concentrations in the Marina, Pacific Heights, Noe Valley, and the Castro/Upper Market neighborhoods.

San Francisco Department of Public Health
Wealth enables communities to absorb and recover from losses more quickly. There is a strong correlation between people that live below the poverty level and infant mortal-ity, heart disease, cancers, and homicide. People who live in poverty also tend to suffer from social deprivation and are less resilient in disasters. Poverty institutes barriers on everyday life such as poor nutrition, lack of preventive medi-cal services, and unhealthy housing conditions47. the damage from poverty not only comes from material determinants but also from the social and psychological problems that it causes48. Because San Francisco’s average median income and cost-of-living are both so high, we have defined a ‘low income family’ as one at or below 200% of the poverty rate. the neighborhoods with the highest concentration of low income households are in the dense chinatown, Financial District, and Downtown neighborhoods and Treasure Island.
LowIncomeFamilies(Familiesatorbelow200%ofthepovertyrate)

San Francisco Department of Public Health
PopulationandDaytimeDensity
the higher the density in a particular neighborhood, the more resources needed to mitigate the impacts of all haz-ard events before, during, and after the disaster. Population density can affect heat vulnerability by raising surround-ing temperatures in urban areas. During and after a hazard event, density might challenge evacuation efforts and strain public health resources. Because a population fluctuates over the course of the day, we’ve decided to create two density indicators: one that counts residents, and one that approxi-mates those present during normal work hours. Daytime density measures commute patterns, local school enrollment population, and employment density. The daytime popula-tion indicator does not account for university student enroll-ment and tourism. the neighborhoods with the highest residential den-sity are nob Hill, Downtown, chinatown, the mission, and parts of the Inner Richmond. The neighborhoods with the highest daytime density are Soma, Downtown, the Financial District, North Beach, and the Inner Sunset. although the indicator does not include university popula-tions, the major San Francisco universities: San Francisco State in the lake Shore neighborhood, University of San Francisco in the inner richmond, and city college of San Francisco in the outer mission all will have high daytime populations.