the assessment method for multi-azimuth and …...stealth technology of aircraft, known as one of...
TRANSCRIPT

10
The Assessment Method for
Multi-Azimuth and Multi-Frequency
Dynamic Integrated Stealth
Performance of Aircraft
Ying Li, Jun Huang, Nanyu Chen and Yang Zhang Beijing University of Aeronautics and Astronautics, Beijing,
China
1. Introduction
Stealth technology of aircraft, known as one of the three technological revolutions together with high-energy laser weapons and cruise missiles in the development history of military science since 1980s, has become the third milestone after jet engines and swept wings technology in modern aviation history. Stealth aircraft has been also considered as one of the ten greatest inventions of the U.S. ADARPA (Defense Advance Research Project Agency). Nowadays, stealth technology has become one key technology. The countries all over the world have paid great attention and strived to develop the stealth technology. Reasonable assessment method for stealth performance plays a crucial role in the development of advanced stealth technology. For example, the result of the stealth performance assessment of aircraft can provide reference for modifying the aircraft’s stealth design to achieve a higher stealth performance. Meanwhile, it can also provide reference for making some specific strategies to increase the probability of successful tasks by reducing the detecting probability of the radar or radar network. Nowadays, the electronic battlefield is becoming more complex and it is urgent to build up a new method to analyze the multi-azimuth and multi-frequency dynamic integrated stealth performance of aircraft, under the complex electronic environment. The existing stealth performance assessment methods include two types. One is the static stealth performance assessment method, the other is the stealth assessment method based on the effectiveness of combat simulation. The former just uses the average RCS value of target circumferential area, or that of some critical radar detecting areas, under some important radar frequencies as the basis. And the latter uses aircraft’s survival probability (including detection probability, hitting probability and damage probability) in specific combat tasks as the basis to assess the stealth performance of aircraft. Each method can reflect the characteristics of the target’s stealth performance well. However, there are still some limitations such as: the results based on the two methods can’t reflect the impact on aircraft stealth performance caused by different target scattering characteristics. As not taking the certain combat task and detecting environment into consideration, the results also fail to reflect the dynamic characteristics of stealth performance, which happens in the entire
www.intechopen.com

Aeronautics and Astronautics
280
proceeding of different combat tasks of aircraft, and the multi-azimuth and multi-frequency integrated stealth performance under complex electronic environment. According to the above, the development of modern stealth technology urgently requires a new type of stealth performance assessment method to provide the reliable basis. In this paper, a new type assessment method for multi-azimuth and multi-frequency
dynamic integrated stealth performance of aircraft was established by building the multi-
azimuth and multi-frequency dynamic integrated stealth performance assessment models
and the series of assessment criteria. With these efforts, on the one hand, a more reasonable
analysis result of stealth performance based on the multi-azimuth and multi-frequency
dynamic detecting environment can be provided, on the other hand, the limitations of the
existing stealth performance assessment methods can be overcame.
2. The existing stealth performance assessment method
Although lots of countries home and abroad started researches about the stealth
technology early, there are just only a few assessment methods for stealth performance of
aircraft. One of the two main existing methods is static stealth performance assessment
method, the other is the stealth performance assessment method based on the
effectiveness of combat.
2.1 The static stealth performance assessment method 2.1.1 The theory of the static stealth performance assessment
The classical static stealth performance assessment method includes two aspects: one is
the static testing assessment method and the other is theoretical calculation assessment
method. The American scholar Knott E.F has made a number of deep studies into the
radar cross section calculation and testing technologies. Chinese scholars, such as
Ruanying Zheng, Kao Zhang, Dongli Ma and so on, also have done researches on radar
cross section calculation and testing, they propose the concept of critical RCS reduction
region of aircraft, which has been widely used. At present, the radar cross section testing
technology home and abroad has been used widely. The static radar cross section testing
is a method, by doing the outfield or laboratory RCS testing on made full-scale models or
reduce-scale models to get a basic understanding of the target scattering characteristics.
The existing methods of the radar cross section theoretical calculation mainly include
three types and they are the high frequency approximation, finite difference time domain
and finite difference time domain.
The detailed steps of static stealth performance assessment are as follows: First of all,
obtaining the RCS curve of the target under different radar detecting frequencies through
static testing method or theoretical calculation method, then analyzing the stealth
performance of aircraft, according to the average RCS of target circumferential area, or that
of some critical radar detecting area, or the RCS value of certain radar detecting azimuth,
under some important radar frequencies.
The assessment criteria of the static stealth performance assessment method is that the lower
the average RCS of target circumferential area, or that of some critical radar detecting area,
or the RCS of specific azimuth, under some important radar frequencies, the better the
stealth performance of aircraft has. Technology flow chart of the static stealth performance
assessment method is shown as Fig.1.
www.intechopen.com
The Assessment Method for Multi-Azimuth and Multi-Frequency Dynamic Integrated Stealth Performance of Aircraft
281
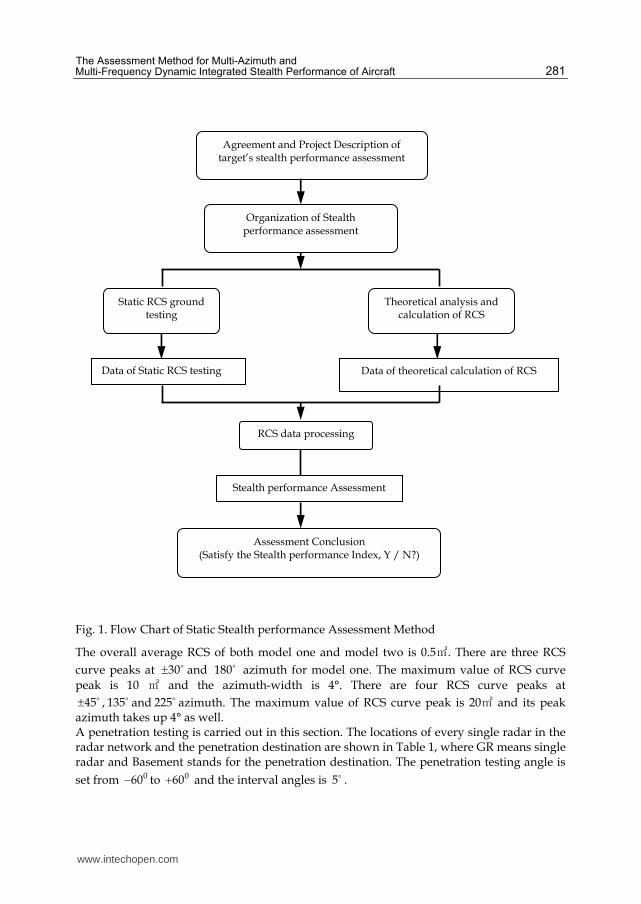
Fig. 1. Flow Chart of Static Stealth performance Assessment Method
The overall average RCS of both model one and model two is 0.5㎡. There are three RCS
curve peaks at 30 and 180 azimuth for model one. The maximum value of RCS curve
peak is 10 ㎡ and the azimuth-width is 4°. There are four RCS curve peaks at
45 , 135 and 225 azimuth. The maximum value of RCS curve peak is 20㎡ and its peak azimuth takes up 4° as well. A penetration testing is carried out in this section. The locations of every single radar in the radar network and the penetration destination are shown in Table 1, where GR means single radar and Basement stands for the penetration destination. The penetration testing angle is
set from 060 to 060 and the interval angles is 5 .
RCS data processing
Stealth performance Assessment
Assessment Conclusion (Satisfy the Stealth performance Index, Y / N?)
Agreement and Project Description of target’s stealth performance assessment
Organization of Stealth performance assessment
Theoretical analysis and calculation of RCS
Data of theoretical calculation of RCS Data of Static RCS testing
Static RCS ground testing
www.intechopen.com

Aeronautics and Astronautics
282
Fig. 2. Circumferential scattering distributions of model one
Fig. 3. Circumferential scattering distributions of model two
Name GR1 GR2 GR3 GR4 GR5 GR6 GR7 Basement
Longitude 119.6330 121.550 120.4830 121.5330 121.6170 121.05 121.9667 121.5
Latitude 23.5667 24.0667 22.70 25.0330 24.0167 25.0667 24.8 25.0
Table 1. Locations of Each Single Radar and the Penetration Destination
Fig.4 to Fig.7 just show several simulation results of these two models. The Y axis of the
testing diagram the FoundValue stands for the radar network detection results. When
FoundValue is equal to 0, it means that no target has been found by radar network. When
FoundValue is equal to 1, it means the target has been found. The X axis of the diagram the
Time stands for the time length of the penetration testing process. Fig (a) is the radar
detection results of simulation model one and Fig (b) is the radar detection results of
simulation model two.
www.intechopen.com

The Assessment Method for Multi-Azimuth and Multi-Frequency Dynamic Integrated Stealth Performance of Aircraft
283
(a) (b)
Fig. 4. Simulation results comparison of model one and model two (penetration angle -60°)
(a) (b)
Fig. 5. Simulation results comparison of model one and model two (penetration angle -45°)
(a) (b)
Fig. 6. Simulation results comparison of model one and model two (penetration angle 0°)
www.intechopen.com

Aeronautics and Astronautics
284
(a) (b)
Fig. 7. Simulation results comparison of model one and model two (penetration angle 15°)
It can be seen from the results that although the overall average RCS of the two simulation
models is 0.5㎡, the dynamic stealth performance of these two models differs much from each other. Such as it is shown in Fig.6 and Fig.7, the simulation model two would be discovered earlier by radar network than the model one at the same penetration angle. After the model two was discovered for the first time, it was lost by the radar network for a long time, while the model one was detected continuously by radar network after its first being found. Above all, the static stealth performance assessment method still has some limitations. Conclusions drawn from the tests are listed as follows: 1. Different circumferential scattering distribution can makes the aircraft has absolutely
different stealth performance, even if they have the same circumferential average RCS; 2. According to the stealth performance of aircraft with different circumferential scattering
distribution, the average RCS of aircraft requirement could be appropriately relaxed.
2.3 The assessment method based on the effectiveness of combat
Based on the radar simulation and target signal simulation technology, the steps of
assessment method based on the effectiveness of combat are listed: first of all, calculating
the aircraft survival probability during the whole combat mission, then summarizing the
effects of RCS characteristic on aircraft survivability and evaluating the stealth performance
of aircraft. The rules of this method are the aircraft with higher survivability has better
stealth performance. The assessment method based on aircraft effectiveness of combat has
been investigated early abroad. Ball R E made deep studies into the RCS reducing
technology which would improve the survivability of aircraft greatly. At the same time,
some software corporations abroad developed many kinds of analysis software that were
applied for analyzing survivability and vulnerability of aircraft. For example, several kinds
of software developed by SURVIAC center could quantitatively and comprehensively
evaluate the survivability and vulnerability of aircraft in the situation of one to one air
battle. In China there are a great deal of research about the effects of aircraft RCS on its
survivability have been done. For example, Zhang Kao and Ma Dongli proposed the method
of calculating the survivability of stealth aircraft that carries out given mission. Aimed at
analyzing the effects of reducing aircraft RCS on survivability of aircraft.
www.intechopen.com

The Assessment Method for Multi-Azimuth and Multi-Frequency Dynamic Integrated Stealth Performance of Aircraft
285
Assessment method based on the effectiveness of combat reflects the stealth performance of
aircraft carrying out the given mission, but still has some limitations: firstly, this method
couldn’t reflect the process and dynamic character of the stealth performance of aircraft
during the whole mission. For example, the target ‘flashing signal’ caused by the different
distributions of strong scattering source. Secondly, the assessment method based on the
survivability could not reflect the character of multi-azimuth and multi-frequency dynamic
comprehensive stealth performance of aircraft, and it also ignores characters of the multi-
azimuth and multi-frequency electronic detecting environment.
3. The multi-azimuth and multi-frequency dynamic integrated stealth
performance assessment method
Because of the limitations of the existing assessment method told in chapter 2, it should
build up a new assessment method for stealth performance of aircraft. This method could
evaluate the multi-azimuth and multi-frequency dynamic comprehensive stealth
performance of aircrafts, not just gives the evaluation conclusions based on the average RCS
of target circumferential area, or that of some critical radar detecting areas. The aircraft with
different scattering characteristic could meet requirements of different missions. In order to
evaluate the multi-azimuth and multi-frequency dynamic comprehensive stealth
performance of aircraft, it should build up the RCS scattering model and the multi-azimuth
and multi-frequency dynamic detecting environment model when the aircraft carries the
given mission, then make the assessment rules for analyzing the multi-azimuth and multi-
frequency dynamic comprehensive stealth performance of aircraft.
3.1 The multi-azimuth and multi-frequency dynamic comprehensive assessment
models
This section describes the building steps of the multi-azimuth and multi-frequency dynamic
comprehensive assessment models in detail, the assessment model includes the typical
complex dynamic detecting environment simulation model based on the given mission and
the RCS scattering model of aircraft.
3.1.1 The RCS scattering model of aircraft
In order to build a model that could reflect the RCS scattering character of aircraft and use
this model to analyze the stealth performance, we need to guarantee the accuracy of the
model.
Aircrafts executing different missions will encounter different detecting threat at different
azimuths from land, sea, air and space. And even if using the same detector with the same
working mode, the signal of aircraft the radar detected may still changes at any moment in
the mission. So the method of building reduced-scale model of aircraft and doing
experiments is considered. We can acquire the corresponding data for building up the
scattering model of aircraft. The RCS database should include the data of aircraft RCS at
different azimuths, under different frequencies. It is impossible to meet the needs of
building the database by the way of building model and testing it because of the limitation
of experiment condition. So the feasible way is to combine the data from both experiment
and theoretical calculating. Fig 8 shows the detailed steps.
www.intechopen.com

Aeronautics and Astronautics
286
Fig. 8. Flow chart of building the RCS database
Fig. 9. Schematic illustration of the aircraft scattering model
The aircraft scattering model can be built up based on the adequate RCS data. The detailed steps of building up the aircraft scattering model are showed as Fig.9. The coordinate system in Fig.9 is defined just the same as aircraft body axes coordinate system for building
X
Y
Z
Front direction of aircraft
O
The direction of radar wave
www.intechopen.com

The Assessment Method for Multi-Azimuth and Multi-Frequency Dynamic Integrated Stealth Performance of Aircraft
287
up equation of motion, which follows the right-handed screw rule. and are two
parameters of radar detecting wave. is defined as the angle between the project of radar
wave on the XOY plane and the X-axes. is defined as the angle between the project of
radar wave on the YOZ plane and the Y-axes. and together decide the location of radar
wave in aircraft body axes coordinate system. The planform of one aircraft scattering model is shown as Fig10. Fig11 shows the test RCS curve of this model. We can see from the two figures that the model’s RCS scattering character is consistent with experiment result which looks like a butterfly. This building method of the RCS scattering model is feasible. The method of building a scattering model is an innovation, which accurately reflects the RCS scattering character of the aircraft under different frequencies. This method could be applied for analyzing different kinds of stealth aircraft.
Fig. 10. Planform of the Aircraft Scattering Model
Fig. 11. Circumferential Test RCS curve of Aircraft
www.intechopen.com

Aeronautics and Astronautics
288
3.1.2 The typical complex dynamic detecting environment model
The typical detecting environment is different when the aircraft executes different missions. So if we want to evaluate the multi-azimuth and multi-frequency dynamic comprehensive stealth performance of aircraft, we must consider the typical complex detecting environment. For example, when an aircraft is executing a penetration mission, the main radar detecting thread is from the head or tail direction of aircraft. The detection environment of warfare is becoming more complex, so it is extremely difficult to describe it completely and accurately. By studying the performance of radar detection systems, we can summarize the typical detection environment. Here are the main elements to describe the typical complex and dynamic detection environmental model including two types, one is the main tactical applications, such as (1) characters of the two sides of combat. (2) Threat which the opposing sides may meet. (3) Interference and anti-interference measures of the opposing sides. The other is the related information of electronic equipment in typical detection environment, such as: (1) Number of detectors. (2) Spatial distribution of detectors. (3) Density of the detectors (time domain). (4) Parameters of the detector’s signal. (5) Frequency and scope of the detector’s signal. (6) The power of detector. (7) Working mode of detector. Using these model parameters above, we can accurately describe the typical complex dynamic detection environment when aircraft carries a specific mission.
3.2 The multi-azimuth and multi-frequency dynamic comprehensive stealth assessment rules
As mentioned above, the existing assessments method is based on the average RCS of aircraft. In order to make sure that the aircraft stealth performance assessments conclusions are applicable, which can be used to guide the new type of stealth aircraft design and stealth performance analysis, we should consider the specific tasks the aircraft carries. When performing different tasks, the aircraft may encounter different typical detection environment. So it is not reasonable to use the same stealth performance assessment rules. Therefore, this section will establish the multi-azimuth and multi-frequency dynamic integrated stealth performance assessment rules based on the given mission. Based on specific combat mission, the assessment rules should be built up by analyzing various types of detection threat the aircraft may encounter and the influence of the aircraft scattering characteristic. Based on the conclusions got from the assessment rules above, we can compare and analyze the stealth performance of different aircrafts which perform the same task. The task-based aircraft multi-azimuth and multi- frequency dynamic integrated stealth performance assessment rules should satisfy two conditions: 1. Assessment rules should reflect the character of specific tasks carried by aircraft. For
example, the stealth performance assessment rules for penetration aircraft should reflect the character of penetration task firstly. In different stages of penetration task, the influence of the aircraft survivability and successful mission probability is different. For example, the first time when penetration aircraft is found by radar (or radar network) decides how many times the aircraft would probably be attacked by enemy firepower. When penetration aircraft was first discovered by radar network, the distance from the penetration destination determines whether the plane could use the remote attack weapon. Therefore, the establishment of penetration stealth performance assessment rules should be combined with the penetration characters, so that the evaluation conclusions reflect the differences of stealth performance among different aircraft when executing penetration.
www.intechopen.com

The Assessment Method for Multi-Azimuth and Multi-Frequency Dynamic Integrated Stealth Performance of Aircraft
289
2. The conclusion got from the assessment rules should be able to reflect the scattering
character of aircraft. For example, during the process of penetration, aircraft mainly get
detecting thread from its front azimuth by various types of detectors in the enemy air
defense. If the aircraft goes through the first line of air defense system undetected and
continues to fly to the enemy's air defense system, it may also be detected by radars at
its two side azimuths. Therefore, when establishing stealth performance assessment
rules, we should focus on the stealth performance of the front and two side azimuths of
aircraft. The stealth performance of penetration aircraft is changing all the time.
Therefore, the assessment rules should not only combine with combat characteristics of
the penetration mission, but also need to consider the dynamic scattering character of
penetration aircraft.
4. The effects of different aircraft circumferential RCS scattering characters
The aircrafts with different circumferential scattering characters is suitable for different
combat missions, caused by various configuration design parameters. The stealth
performance evaluation conclusions of aircraft with different circumferential RCS scattering
characters can provide reference for a reasonable layout design of new type of aircraft. This
section will combine the multi-azimuth and multi-frequency dynamic comprehensive
assessment rules developed in chapter 3 to analyze and evaluate the aircrafts with different
circumferential RCS scattering characters.
4.1 The new target integrated circumferential RCS scattering model 4.1.1 The relevant model parameters
There are several requirements which the model should meet for the new analysis method:
1) quantified the overall and partial RCS scattering characters of target; 2) setting up the
relations between each different radar detecting areas; 3) controlling the RCS scattering
changing trends of model through inducing several model RCS scattering control
parameters. Considering that the RCS value can reflect the quantified target scattering
characters and the differences between the RCS values may up to the magnitude order for
the different target azimuth, the average RCS value of target circumferential area is
introduced as one of the RCS scattering characteristic parameters of model and the unit is
dBsm, and its symbol is ave .
The existing analysis method does not take the effects of the changing relations between different important radar detecting region on the target stealth ability into account. For example, the aircraft could be excellent in depth penetration mission, if it has lower RCS value at the front azimuth and higher RCS values at other azimuths. Moreover, if the stealth aircraft has lower RCS value at its two side azimuths compared with that for the rest azimuths, it can carry out penetration mission with a smaller horizontal distance arriving at the enemy bases. In order to build up the relations between different target important detecting areas, the new analysis method uses the average RCS value of target front important radar detect area as the basis. Furthermore, the average RCS values of another radar detecting areas are introduced into the model as the target local RCS scattering
characteristic parameters and the corresponding symbols are i (i=0,1,…). The subscript i
represents the sequence of radar detecting areas. For describing the relations between the
www.intechopen.com

Aeronautics and Astronautics
290
target front and other direction important radar detecting areas, the new model defines a set
of relational parameters. Their symbols are i
k (i = 0,1,…) and can be written as:
0/i ik (1)
where 0 represents the average RCS value of the target front important radar detecting
area.
Fig. 12. RCS curve corresponding to one type of stealth aircraft (Under the S wave band).
Fig. 13. RCS curve corresponding to one type of aircraft (Under the S wave band).
www.intechopen.com

The Assessment Method for Multi-Azimuth and Multi-Frequency Dynamic Integrated Stealth Performance of Aircraft
291
Due to different stealth design parameters the UCAV X-45 and X-47 have, so they have completely different RCS scattering characters. Their RCS curves differ much from each other, as shown in Fig.12 and Fig.13. So the same set of RCS scattering controlling parameters can not be used to describe the dissimilar RCS curve patterns and control the RCS scattering changing trends of various new models well. There are two requirements for the RCS scattering control parameters: one is that it is not advisable to introduce too many RCS scattering control parameters, the other is the model can satisfy all kinds of stealth ability analysis requirements. For example, building up the target circumferential RCS scattering model with triangle pattern character as shown in Fig.2 needs two RCS scattering control parameters, which can meet the requirements of controlling RCS scattering changing trends and conducting target integrated stealth performance analysis. These parameters are
LK and AK respectively, LK and AK can be expressed as:
/L a bK L L (2)
/ 360A FK A (3)
where aL and bL are the side lengths of model with triangle circumferential RCS scattering
character. The parameter LK can control the RCS scattering changing trends of target head
and tail areas. By this way, it can satisfy the analysis requirements about the effects of different target head and tail stealth performance on its integrated stealth
performance. FA represents the angular region of target front important radar detecting area.
Likewise, the models with different FA values can meet the analysis requirements about the
effects of different front important radar detecting areas on target integrated stealth performance.
Fig. 14. RCS curves of different target RCS scattering models.
www.intechopen.com

Aeronautics and Astronautics
292
Fig.14 shows the models with various target circumferential RCS scattering characters and
being built up by changing the values of LK and AK , when ave is equal to -10dBsm.
4.1.2 The model building method
According to Fig.12, the detailed building steps of the new model are described in this
section. First of all, defining the suitable target whole and local RCS scattering
characteristic parameters and introducing several model RCS scattering controlling
parameters according to the different target RCS scattering characters are necessary. So as
it is shown from Fig.1, the average RCS value of target circumferential area and the
heading direction within the angular region of 030 to 030 are introduced as the target
entire and local RCS scattering characteristic parameters respectively. Their
corresponding symbols are ave and—
0δ . LK represents the ratio between long side and
short side lengths. Secondly, different functions are used to describe the RCS curves of
different radar detecting regions. The variable of curve function is angle value , its
corresponding function value is length value R. But in the target RCS curve, the
corresponding value of angle is the target RCS value. Therefore, a transform between
the coordinate length value R and the target RCS value is needed. Based on this
transform, RCS value in any direction of the target can be expressed by:
m in( ) ( )
1
1
1( )
1
N
ave
ave i N
i
i
i
R RN
RN
(4)
where ( )R denotes the R value in any target azimuth, iR is one of the series values of R
in any target important radar detecting areas and subscript i represents the sequence of
these R values, ave is the average RCS value of target circumferential area or local radar
detecting areas and min represents the RCS value of the coordinate origin. The stealth
analysis about the target local RCS scattering character should be included in the
conclusions of target integrated stealth performance analysis. So the last step is dividing
the target RCS curve into several parts according to the target RCS scattering characters,
then using different functions to describe these parts respectively. By this way, the
analysis conclusion about how the target local stealth performance affects its integrated
stealth ability can be reached. All the functions for every part of the curve can be written
as:
min( ) ( ) min
1
( )
1ave
N
i
i
R
RN
(5)
where ( )i and ( )iR are the target RCS values and R values respectively and corresponding
to the target azimuth of . The subscript i represents the sequence of target important radar
detecting areas.
The functions corresponding to Fig.12 can be expressed as:
www.intechopen.com

The Assessment Method for Multi-Azimuth and Multi-Frequency Dynamic Integrated Stealth Performance of Aircraft
293
min min
( )
min min
91( )
2 cos
0
(180 ) (180 )
(360 ) 360
1 91( )
2 sin
(180 ) (360 )
(360 ) 360
Lave
Limit
Limit Limit
i Limit
ave
Limit Limit
Limit
K
Sum
or
or
Sum
or
(6)
90
0 1
1
2 cos 2 sin
Limit
Limit
LK
Sum
where ave is the average RCS value of target circumferential area, min represents the RCS
value of the coordinate origin, is the radar detect angle and LK is the model RCS
scattering controlling parameter.
4.2 Examples and discussions
In this section, the new kind of target circumferential RCS scattering models will be built according to Fig.12 and Fig.13. Before that, disposing several radars in different azimuths of enemy base. Combing relevant dynamic models and integrated stealth analysis rules can give the detailed integrated stealth analysis conclusions. In these examples, aircraft flight altitude is 1000m and flight velocity is 500m/s. The aircraft carries out the penetration mission along a straight flight course at the azimuth of 90 degrees. The azimuths of these radars are 0, 30, 45, 60, 90, 120, 135 and 180 degrees respectively. A comparison is made between the integrated stealth performance of these two serial models are given blow.
4.2.1 Rectangular RCS scattering models
Combining the new modeling methods described in Section 4.1.2 and the relevant stealth performance analysis requirements, the serial models with absolutely different RCS scattering characters are modeled.
The values of relevant model RCS scattering parameters are ave
=-10dBsm and 0dBsm and
LK =0.5, 1.0 and 2.0 respectively. Fig.15 and Fig.16 compare the average radar detecting
probability of these serial models. Fig.15 shows that when ave is equal to -10dBsm, the RCS
scattering characters of these three models differs much from each other. Among these
models, the one corresponding to LK =0.5 has the highest average radar detecting
probability. When LK =1.0, the corresponding model will have much lower average radar
detecting probability. When LK = 0.5, the radars located in the two sides of the enemy base
will have much higher detecting probability than that for LK =1.0. So when ave is around -
10dBsm, the condition of LK =1.0 can make the penetration aircraft with rectangular RCS
scattering character have excellent sidewise stealth ability. Then the aircraft can carry out
www.intechopen.com

Aeronautics and Astronautics
294
the penetration mission with a small transverse distance arriving at enemy base. The
average radar detecting probability rises remarkably, when ave goes up to 0dBsm.
Fig. 15. Comparison of radar detecting probability corresponding to serial models
( ave =-10dBsm).
Fig. 16. Comparison of radar detecting probability corresponding to serial models
( ave =0dBsm).
Av
erag
e ra
dar
det
ecti
ng
pro
bab
ilit
y
Radar series number
Av
erag
e ra
dar
det
ecti
ng
pro
bab
ilit
y
Radar series number
www.intechopen.com

The Assessment Method for Multi-Azimuth and Multi-Frequency Dynamic Integrated Stealth Performance of Aircraft
295
LK Radar series
number
Lost target number FirstT
Stable tracking number
Tracking duration うsえ
0.5 0 1 289 1 315
0.5 1 1 201 1 291
0.5 2 1 174 1 263
0.5 3 1 161 1 225
0.5 4 1 167 1 159
0.5 5 1 162 1 223
0.5 6 1 175 1 261
0.5 7 1 290 1 313
1.0 0 2 194 1 139
2 139
1.0 1 2 110 1 174
2 174
1.0 2 1 87 1 436
1.0 3 1 79 1 389
1.0 4 1 89 1 315
1.0 5 1 81 1 385
1.0 6 1 89 1 433
1.0 7 2 196 1 141
2 142
2.0 0 2 1 1 142
2 300
2.0 1 2 1 1 105
2 346
2.0 2 2 1 1 137
2 399
2.0 3 2 1 1 197
2 469
2.0 4 1 1 1 765
2.0 5 2 1 1 202
2 474
2.0 6 2 1 1 142
2 402
2.0 7 2 1 1 147
2 304
Table 2. Relevant radar detecting data of serial models ( ave =-10dBsm)
Table 2 lists the radar detecting data of this serial models. The data shows that when
ave =-10dBsm, the lost target number will increase and FirstT will decrease with the increase
of LK . Suppose that the aircraft will counter the threat of enemy firepower only when it is
continuously found by radar more than a certain time threshold and the corresponding
notation is LimitT . If the time threshold is 200 seconds, when LK =0.5, 1.0 and 2.0, the
www.intechopen.com

Aeronautics and Astronautics
296
corresponding valid stable track number are 7 , 5 and 8 respectively. So when LK =1.0, the
model has the least chances of meeting with enemy firepower.
LK Radar series
number
Lost target
number FirstT
Stable tracking number
Tracking duration
0.5 0 1 242 1 4090.5 1 1 156 1 3810.5 2 1 132 1 3470.5 3 1 122 1 3030.5 4 1 131 1 2310.5 5 1 123 1 3010.5 6 1 133 1 3440.5 7 1 244 1 4061.0 0 1 86 1 7211.0 1 1 4 1 6851.0 2 1 1 1 6261.0 3 1 1 1 5691.0 4 1 1 1 5091.0 5 1 1 1 5681.0 6 1 1 1 6251.0 7 1 88 1 7172.0 0 2 1 1 250
2 9662.0 1 2 1 1 201
2 10032.0 2 1 1 1 221
2 10492.0 3 1 1 1 13902.0 4 1 1 1 13472.0 5 1 1 1 13892.0 6 2 1 1 255
2 10532.0 7 2 1 1 255
2 970
Table 3. Relevant radar detecting data of serial models ( ave = 0dBsm)
The data in Table 3 shows that when ave =0dBsm, the duration of aircraft being stable
tracked rises obviously and the valid stable tracking number also increases. It is also learned
from the data that the time of models first being found by radar corresponding to LK =1.0
and 2.0 will be much earlier. Therefore, the data shows that the RCS scattering controlling
parameter ave has big effects on the integrated stealth performance of serial models.
4.2.2 Triangular RCS scattering models The serial models with triangular RCS scattering characters are established according to the methods described in section 4.1.1. The meanings of ave , LK and AK have been told in
www.intechopen.com

The Assessment Method for Multi-Azimuth and Multi-Frequency Dynamic Integrated Stealth Performance of Aircraft
297
section 4.1.1. The values of LK and AK are taken as LK =1.5、2.0 and AK = 1/12, 7/72 and
1/9 respectively. Fig.6 and Fig.7 show the comparison of average radar detecting probability between these serial models.
Fig. 17. Comparison of radar detecting probability of serial models
( ave =-10dBsm, LK =1.5).
Fig. 18. Comparison of radar detecting probability of serial models
( ave =-10dBsm, LK =2.0).
Av
erag
e ra
dar
det
ecti
ng
pro
bab
ilit
y
Radar series number
Av
erag
e ra
dar
det
ecti
ng
pro
bab
ilit
y
Radar series number
www.intechopen.com

Aeronautics and Astronautics
298
Fig.17 shows that when ave =-10dBsm and LK = 1.5, the model with RCS scattering
parameters AK =1/9 has lower radar detecting probability than both the models for
AK =1/12 and 7/72 respectively. The radar detecting probability curves in Fig.18 show that
when LK =2.0 and AK adopts different values, the average radar detecting probability of all
these serial models are decreased. Especially for the situation of AK =7/72, the decreasing
range is the maximum one. Both the two models corresponding to AK = 7/72 and 1/9
respectively have lower radar detecting probability in their two sides than that in their heading direction. Especially when the RCS scattering controlling parameter AK =7 /72.
LK Radar series number
Lost target number FirstT
Stable tracking number
Tracking duration
1.5 0 1 1 1 378
1.5 1 1 1 1 299
1.5 2 1 1 1 279
1.5 3 1 1 1 269
1.5 4 1 1 1 684
1.5 5 1 1 1 270
1.5 6 1 1 1 281
1.5 7 1 1 1 380
2.0 0 2 120 1 161
2 773
2.0 1 2 37 1 197
2 1020
2.0 2 2 16 1 224
2 1244
2.0 3 2 9 1 243
2 1476
2.0 4 1 17 1 2097
2.0 5 2 10 1 243
2 1489
2.0 6 2 17 1 226
2 1259
2.0 7 2 121 1 165
2 799
Table 4. Relevant radar detecting data of series modelsθ ave =-10dBsm, AK =7/72χ
Table 4 lists the relevant radar detecting data corresponding to the situation for the RCS
scattering controlling parameters ave = -10dBsm and AK =7/72 and LK adopts different
values.
The data in Table 4 shows that when ave = -10 dBsm, the models with RCS scattering
parameter LK = 2.0 will have more chances of being tracked by radar and the duration of
radar stable tracking will be longer than the models corresponding to LK =1.5.
www.intechopen.com
The Assessment Method for Multi-Azimuth and Multi-Frequency Dynamic Integrated Stealth Performance of Aircraft
299
5. The effects of different aircraft RCS curve peak characters
Analyzing rules about effects of the aircraft RCS curve peaks with different shape on penetration stealth performance reasonably, is meaningful. These rules could be references for both the concept penetration aircraft's stealth configuration design and making effective aircraft RCS reduction plans.
5.1 The target RCS curve peak numerical simulation model 5.1.1 The relevant model parameters
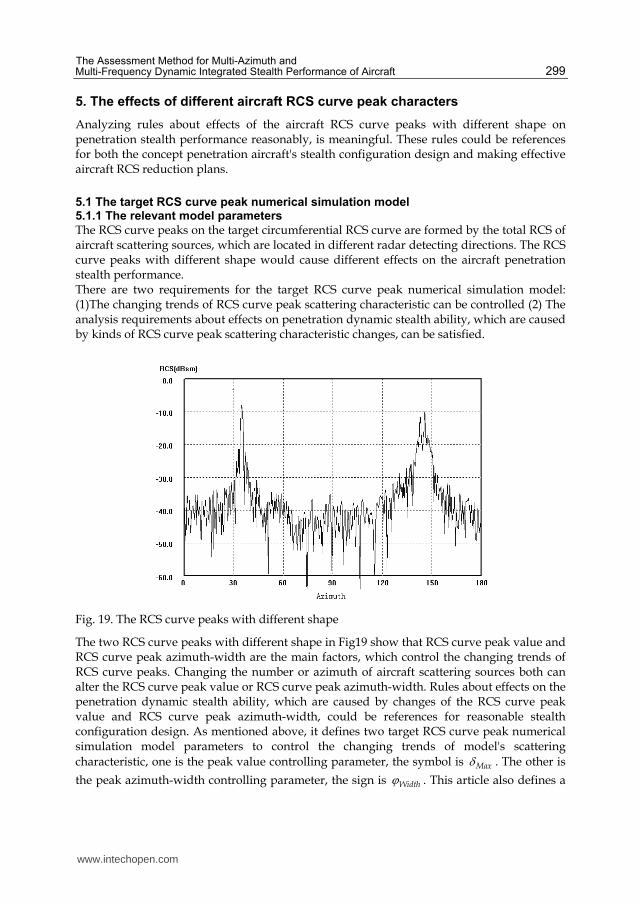
The RCS curve peaks on the target circumferential RCS curve are formed by the total RCS of aircraft scattering sources, which are located in different radar detecting directions. The RCS curve peaks with different shape would cause different effects on the aircraft penetration stealth performance. There are two requirements for the target RCS curve peak numerical simulation model: (1)The changing trends of RCS curve peak scattering characteristic can be controlled (2) The analysis requirements about effects on penetration dynamic stealth ability, which are caused by kinds of RCS curve peak scattering characteristic changes, can be satisfied.
Fig. 19. The RCS curve peaks with different shape
The two RCS curve peaks with different shape in Fig19 show that RCS curve peak value and RCS curve peak azimuth-width are the main factors, which control the changing trends of RCS curve peaks. Changing the number or azimuth of aircraft scattering sources both can alter the RCS curve peak value or RCS curve peak azimuth-width. Rules about effects on the penetration dynamic stealth ability, which are caused by changes of the RCS curve peak value and RCS curve peak azimuth-width, could be references for reasonable stealth configuration design. As mentioned above, it defines two target RCS curve peak numerical simulation model parameters to control the changing trends of model's scattering
characteristic, one is the peak value controlling parameter, the symbol is Max . The other is
the peak azimuth-width controlling parameter, the sign is Width . This article also defines a
www.intechopen.com

Aeronautics and Astronautics
300
set of RCS curve peak location parameters, corresponding signs are i (i=0,1, 2...), the
subscript i represents the sequence of RCS curve peaks, which are located on the target circumferential RCS curve. As analyzing the rules about effects on aircraft penetration stealth ability, which are caused by changes of RCS curve peak scattering characteristic, influences of target scattering characteristic in another aircraft azimuth, should be eliminated. This article sets the RCS value in another model azimuth, as a constant value and less than the RCS peak value. As mentioned above, this article introduces the scattering characteristic controlling parameter, which is corresponding to another model azimuth, the
symbol is .
5.1.2 The model building method
Defining the model parameters according to section 5.1.1, the detailed model building method is told as below: (1) Defining the variable model parameters, according to the analysis requirements about influences on the aircraft penetration stealth ability, which are caused by different RCS curve peak scattering characteristic. For example, the RCS curve peak value would be reduced by the decrease of aircraft scattering sources. For analyzing the corresponding effects on the penetration stealth ability, it can build up a series of models with different RCS curve peak value, by changing the RCS curve peak value controlling
parameters ( )i Max (i=0,1,2...), the subscript i represents the sequence of RCS curve peaks on
the target circumferential RCS curve. Therefore, it can define ( )i Max as the variable model
parameters. (2) Introducing the scattering characteristic controlling parameters and RCS curve peak location parameters into the model, then determining the value of these parameters. For example, according to the case that there are two RCS curve peaks with 6°azimuth-width, which are located on -30°and 30°azimuth of aircraft front area respectively, it can define the RCS curve peak azimuth-width controlling parameter:
( )i Width =6°(i=0,1) and the RCS curve peak location parameters: i (i=0,1), 00 30 ,
01 30 . (3) Fixing up the value of scattering characteristic controlling parameter ( ),
which is corresponding to another model azimuth.
5.2 Examples and discussion
This section builds up a series of target RCS curve peak numerical simulation models with
different peak value or azimuth-width. By testing and analyzing these models, influences of
RCS curve peak value or RCS curve peak azimuth-width on the dynamic stealth ability are
generalized.
5.2.1 Influences of RCS curve peak characters
For evaluating effects on the integrated stealth performance of penetration aircraft, caused by different target RCS curve peak characters. According to Fig.19, this section builds up series of models, with same circumferential RCS characters, but different RCS curve peak characters. The circumferential RCS character controlling parameters of these models are:
ave =-10dBsm, LK =1.0, and the RCS curve peak azimuth-location parameters are: 0 =45°,
1 =135°, 2 =225° and 3 =315°. Table 1.lists another RCS curve peak character controlling
factors.
www.intechopen.com

The Assessment Method for Multi-Azimuth and Multi-Frequency Dynamic Integrated Stealth Performance of Aircraft
301
( )j Max うj=0,1,2,3え
( )j Width うj=0,1,2,3え
Model 1 10 dBsm 2°
Model 2 10 dBsm 4°
Model 3 10 dBsm 6°
Model 4 20 dBsm 2°
Model 5 20 dBsm 4°
Model 6 20 dBsm 6°
Model 7 30 dBsm 2°
Model 8 30 dBsm 4°
Model 9 30 dBsm 6°
Table 5. The RCS curve peak controlling factors
Simulation conditions of this example are: flight condition: flight altitude H=1000 m; flight velocity V=200 m/s, flight azimuth (relative
to enemy base) f = -40, -20, 0, 20 and 40 degrees; distance to penetration destination
L=400Km. condition of radar network : Table 2 lists positions of every ground to air radar (GR) in the network and location of the penetration destination (Basement).
Name Longitude Latitude
GR1 119.6330 23.5667
GR2 121.550 24.0667
GR3 120.4830 22.7
GR4 121.5330 25.0330
GR5 121.6170 24.0167
GR6 121.05 25.0667
GR7 121.9667 24.8
Basement 121.5 25.0
Table 6. Positions of radar and destination
Table7 lists the radar network detecting results of this serial models, corresponding to
f = -20 degree.
From Table7 we find that, Width and Max have different effects on the integrated stealth
performance of penetration aircraft. Firstly, if Width takes a fixed value, with the rise of
Max , FirstT will decrease and target "flashing signal" will weaken ( ( )f FindT increases and
( )l LoseT decreases). Furthermore, when Width has a bigger fixed value, effects caused by
increase of Max would be more obvious. Adversely, if Width takes a small value, namely,
the azimuth-width of target RCS curve peak is narrow, Max has little effect on the
integrated stealth performance of penetration aircraft. Secondly, if Max takes a fixed value,
www.intechopen.com

Aeronautics and Astronautics
302
FirstT will decrease and the target "flashing signal" will weaken, with increase of Width .
Similarly, when Max has a bigger fixed value, effects caused by increase of Width would be
more obvious. Lastly, when one of Max and Width takes a big fixed value, the other
increases, effect on putting off FirstT , caused by increase of Width is more obvious.
FirstT ( )f FindN ( )f FindT ( )l LoseN ( )l LoseT
Model 1 209.4 1 150.5 1 559.1
2 281
Model 2 173.6 1 222.3 1 523.1
2 281
Model 3 173.6 1 258.3 1 475.1
2 293
Model 4 209.4 1 186.5 1 523.1
2 281
Model 5 173.6 1 258.3 1 487.1
2 281
Model 6 137.7 1 330.2 1 427.1
2 305
Model 7 209.4 1 186.5 1 523.1
2 281
Model 8 137.7 1 294.2 1 487.1
2 281
Model 9 101.8 1 366.1 1 427.1
2 305
Table 7. Radar network detecting results of serial models
The rules for reducing aircraft scattering sources and improving integrated stealth
performance of penetration aircraft can be got from above conclusions:
1. reducing Max firstly for putting off FirstT .
2. plan about strengthening target "flashing signal" is: it should reduce Max firstly and
Width secondly, when Max takes a big value. However, when Max is small, it should
reduce Width firstly.
3. there is no need to reduce Max too much, if azimuth-width of RCS curve peak is
narrow.
5.2.2 Influences of superposing RCS curve peaks
Because of the stealth design plan: "parallel leading-edge" and "parallel trailing-edge", the
RCS curve peaks created by wing edges, could be located on the same azimuth. For
evaluating effects of the plan, this section builds up two models, corresponding to "before
superposing" and "after superposing" respectively (see Fig.10 and Fig.11). Circumferential
RCS controlling parameters of these two models are: Max = -20dBsm, LK =1.0, and the RCS
curve peak controlling factors are:
www.intechopen.com

The Assessment Method for Multi-Azimuth and Multi-Frequency Dynamic Integrated Stealth Performance of Aircraft
303
model one: 0 = 057 , 1 = 063 , 2 = 0180 , 3 = 0297 ,
4 = 0303 ; ( )j Width = 02 ; ( )j Max =10dBsm, (j=0,1,2,3,4)
model two: 0 = 060 , 1 = 0180 , 2 = 0300 ; 1( )Max =10dBsm, 0( )Max = 2( )Max =13.01dBsm;
( )j Width = 02 (j=0,1,2).
Simulation conditions are the same as the example in section 5.2.1
Table8 lists the radar network detecting results corresponding to f = 020 , 00 and 020 ,
respectively. These results show that, due to superposing RCS curve peaks, not only FirstT is
reduced a little, but also the target "flashing signal" is strengthened. Namely, the integrated stealth performance of penetration aircraft can be enhanced by superposing RCS curve peaks.
f
FirstT ( )f FindN ( )f FindT ( )l LoseN ( )l LoseT
-20°
Model 1 742.4 1 197.8 1 202.1
2 57.7
Model 2 740 1 195.9 1 243.9
2 20.2
0°
Model 1 284.2 1 435.7 1 67.9
2 196.1 2 92.3 3 123.8
Model 2 230.2 1 363.5 1 218
2 172.2 2 92.3 3 123.8
20°
Model 1 250.1 1 325.8 1 57.5
2 566.6
Model 2 250.1 1 325.8 1 57.5
2 566.6
Table 8. Radar network detecting results of two models
6. Conclusions
The conclusions about integrated stealth performance of penetration aircraft, based on a reasonable assessment method, are meaningful for both new type of stealth penetration aircraft design and efficient penetration tactics making. This paper proposes a new integrated stealth performance assessment method for penetration aircraft, which constitutes of the target RCS numerical simulation model and dynamic assessment model. This method can assesses effects on the integrated stealth performance of penetration aircraft, caused by different target circumferential RCS characters and RCS curve peak characters. As a fruit, three examples in this article show that: 1. The target RCS numerical simulation models, performing different circumferential RCS
characters or RCS curve peak characters, could satisfy various assessment requirements for the integrated stealth performance of aircraft.
2. Better configurations, which can improve integrated stealth performance of penetration aircraft, could be got from the laws for effects of different target RCS characters.
www.intechopen.com
Aeronautics and Astronautics
304
As a new method, it can be applied in the integrated stealth performance of aircraft assessment field. To get more credible assessment conclusions, the more accurate target RCS numerical simulation model and dynamic assessment model should be introduced.
7. References
Knott E.F.(1987). Radar cross section. Beijing: Publishing House of Electronics Industry, pp. 410-416 ISBN 7-5050
Wang Lingxiao, Zhao Deyun.(2009). Effective Path Planning Method for Low Detectable Aircraft. Journal of Systems Engineering and Electronics. Vol.20, No.4, pp.784- 785
John F. Dishman, Edward R. Beadle. SEVR: A LPD Metric for a 3-D Battle Space. 2007 IEEE Millitary Communication Conference. Orlando Oct 2007.
Guo Zhengxin , Jiang Jin. (2003). Computation Model of Radar Detection Probability With Various Distance.Journal of Air Force Radar Academy. Vol17, No4. pp.7-8
Yuan Qilun, Tan Shaoxian.(2002). A method of establishing model of radar detection probability. Morden Defence Technology. Vol.30, No.3, pp.1-3
Zhang Kao, Zhang Yunfei, Ma Dongli.(1997). The aircraft stealth Performance Analysis and Calculating Methods. Beijing: National Defence Industry Press, pp.85- 92. ISBN 7-118-02718-9
Wang Xu, Song Bifeng.(2008). Analytic Model of Aircraft Survivability detection Time for One-to-one Engagement Acta Aeronautical Et Astronautica Sinica. Vol.29, No.4, pp. 915-916.
Paterson J.(1999) Overview of Low Observable Technology and Its Effects on Combat Aircraft Survivability. Journal of Aircraft., Vol. 36, No.2, pp. 380-388.
Pei Y, Song B.(2003). Solving the Combinatorial Explosion ProblemWhen Calculating the Multiple-Hit Vulnerability of Aircraft. Journal of Aircraft, Vol.43, No.4, pp.1190-1194.
Li GuangMing, Tang Yemin, Jiang SuRong.(2006). Performance Evaluation of Radar Network for Counterchecking Stealth Aircraft-Comprehensive Detecting Probability of Radar Network. Modern Radar, Vol.28, No.1.pp.23-25
Li ShouAn, Zhang HengXi, Li ShuLin, Meng Ke.(2005). Research on Aircraft Survability Evaluation and Synthetic Trade off Method. Acta Aeronautical Et Astronautica Sinica, Vol. 26, No.1, pp.23-26.
www.intechopen.com

Aeronautics and AstronauticsEdited by Prof. Max Mulder
ISBN 978-953-307-473-3Hard cover, 610 pagesPublisher InTechPublished online 12, September, 2011Published in print edition September, 2011
InTech EuropeUniversity Campus STeP Ri Slavka Krautzeka 83/A 51000 Rijeka, Croatia Phone: +385 (51) 770 447 Fax: +385 (51) 686 166www.intechopen.com
InTech ChinaUnit 405, Office Block, Hotel Equatorial Shanghai No.65, Yan An Road (West), Shanghai, 200040, China
Phone: +86-21-62489820 Fax: +86-21-62489821
In its first centennial, aerospace has matured from a pioneering activity to an indispensable enabler of ourdaily life activities. In the next twenty to thirty years, aerospace will face a tremendous challenge - thedevelopment of flying objects that do not depend on fossil fuels. The twenty-three chapters in this bookcapture some of the new technologies and methods that are currently being developed to enable sustainableair transport and space flight. It clearly illustrates the multi-disciplinary character of aerospace engineering,and the fact that the challenges of air transportation and space missions continue to call for the mostinnovative solutions and daring concepts.
How to referenceIn order to correctly reference this scholarly work, feel free to copy and paste the following:
Ying Li, Jun Huang, Nanyu Chen and Yang Zhang (2011). The Assessment Method for Multi-Azimuth andMulti-Frequency Dynamic Integrated Stealth Performance of Aircraft, Aeronautics and Astronautics, Prof. MaxMulder (Ed.), ISBN: 978-953-307-473-3, InTech, Available from:http://www.intechopen.com/books/aeronautics-and-astronautics/the-assessment-method-for-multi-azimuth-and-multi-frequency-dynamic-integrated-stealth-performance-o

© 2011 The Author(s). Licensee IntechOpen. This chapter is distributedunder the terms of the Creative Commons Attribution-NonCommercial-ShareAlike-3.0 License, which permits use, distribution and reproduction fornon-commercial purposes, provided the original is properly cited andderivative works building on this content are distributed under the samelicense.