the anatomy of a stock market winner
TRANSCRIPT
CFA Institute
The Anatomy of a Stock Market WinnerAuthor(s): Marc R. ReinganumSource: Financial Analysts Journal, Vol. 44, No. 2 (Mar. - Apr., 1988), pp. 16-28Published by: CFA InstituteStable URL: http://www.jstor.org/stable/4479099 .
Accessed: 13/06/2014 20:02
Your use of the JSTOR archive indicates your acceptance of the Terms & Conditions of Use, available at .http://www.jstor.org/page/info/about/policies/terms.jsp
.JSTOR is a not-for-profit service that helps scholars, researchers, and students discover, use, and build upon a wide range ofcontent in a trusted digital archive. We use information technology and tools to increase productivity and facilitate new formsof scholarship. For more information about JSTOR, please contact [email protected].
.
CFA Institute is collaborating with JSTOR to digitize, preserve and extend access to Financial AnalystsJournal.
http://www.jstor.org
This content downloaded from 91.229.229.49 on Fri, 13 Jun 2014 20:02:10 PMAll use subject to JSTOR Terms and Conditions
by Marc R. Reinganum
The Anatomy of a Stock Market Winner
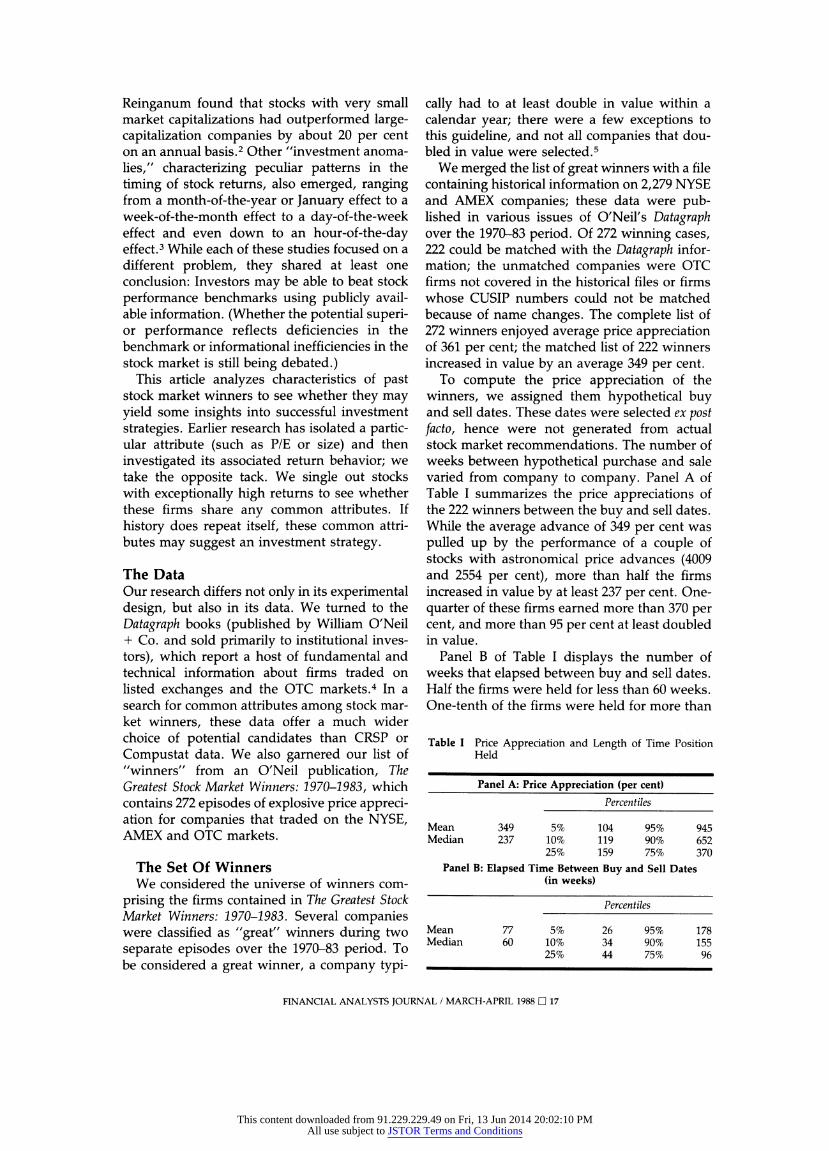
An examination of 222 firms whose stocks at least doubled in price during one year of the 1970-83 period reveals several distinct features shared by the majority of companies. For example, investment advisers on average more than doubled their claims in these winners while stock prices were advancing. Also, the firms' pretax profit margins rose by about 2 per cent during the period of rapid price appreciation, while their growth rates based on five years of quarterly earnings data advanced from an average of 23 per cent to 38.2 per cent. In- deed, changes in earnings growth rates and profit margins probably fueled the price advances.
Of perhaps greater interest are the shared features that revealed themselves prior to the rapid price appreciation. The winners, for example, generally sold at a price less than their book value prior to their substantial price advances. Their quarterly earnings accelerated in the quarters preceding the price rise, and their relative-strength ranks, while already high, increased further.
Nine characteristics common to the 222 stock market winners were used to form the basis of a trading strategy that was applied to 2,057 NYSE and AMEX firms over the 1970-83 period. The trading strategy significantly outperformed the S&P 500 index. After one year, the average holding-period return of the selected firms equaled 30.6 per cent, versus 6.9 per cent for the S&P 500. By the end of two years, the sample firms' average holding-period return was 65.4 per cent, versus 14.7 per cent for the index. These return differentials amount to excess returns for the trading strategy of 23.7 and 50.7 per cent after one and two years, respectively. Thesc results cannot be explained by the firms' historical betas or stock market capitalizations.
M OST ACADEMIC RESEARCH dur- ing the 1960s and early 1970s sup- ported the hypothesis that capital
markets are efficient, hence that investors can- not systematically outperform naive investment strategies such as buying and holding a market
index. Technical and fundamental research based on publicly available information would improve investment performance only margin- ally at best, and probably not at all. Throwing darts to select stocks would be just about as effective.
Serious chinks in this simple view of invest- ment performance began to appear by the late 1970s and early 1980s. Basu, drawing on earlier work by Nicholson, reported that portfolios comprised of stocks with low price/earnings ratios outperformed portfolios with high price/ earnings ratios by about 7 per cent per year, even after adjusting returns for the beta risk of the Capital Asset Pricing Model.1 Banz and
Marc Reinganum is Phillips Professor of Finance at the College of Business Administration of The University of Iowa.
The author thanks Nai-Fu Chen, Charles D'Ambrosio, Kim Dietrich, Wayne Ferson, Larry Harris, Al MacGre- gor, William O'Neil, Jack Treynor, Robert Vishny and Mark Weinstein for their helpful comments.
Partial funding and research support for this study were provided by the William O'Neil Company, the University of Chicago and the University of Southern California. 1. Footnotes appear at end of article.
FINANCIAL ANALYSTS JOURNAL / MARCH-APRIL 1988 D 16
This content downloaded from 91.229.229.49 on Fri, 13 Jun 2014 20:02:10 PMAll use subject to JSTOR Terms and Conditions
Reinganum found that stocks with very small market capitalizations had outperformed large- capitalization companies by about 20 per cent on an annual basis.2 Other "investment anoma- lies," characterizing peculiar patterns in the timing of stock returns, also emerged, ranging from a month-of-the-year or January effect to a week-of-the-month effect to a day-of-the-week effect and even down to an hour-of-the-day effect.3 While each of these studies focused on a different problem, they shared at least one conclusion: Investors may be able to beat stock performance benchmarks using publicly avail- able information. (Whether the potential superi- or performance reflects deficiencies in the benchmark or informational inefficiencies in the stock market is still being debated.)
This article analyzes characteristics of past stock market winners to see whether they may yield some insights into successful investment strategies. Earlier research has isolated a partic- ular attribute (such as P/E or size) and then investigated its associated return behavior; we take the opposite tack. We single out stocks with exceptionally high returns to see whether these firms share any common attributes. If history does repeat itself, these common attri- butes may suggest an investment strategy.
The Data Our research differs not only in its experimental design, but also in its data. We turned to the Datagraph books (published by William O'Neil + Co. and sold primarily to institutional inves- tors), which report a host of fundamental and technical information about firms traded on listed exchanges and the OTC markets.4 In a search for common attributes among stock mar- ket winners, these data offer a much wider choice of potential candidates than CRSP or Compustat data. We also garnered our list of "winners" from an O'Neil publication, The Greatest Stock Market Winners: 1970-1983, which contains 272 episodes of explosive price appreci- ation for companies that traded on the NYSE, AMEX and OTC markets.
The Set Of Winners We considered the universe of winners com-
prising the firms contained in The Greatest Stock Market Winners: 1970-1983. Several companies were classified as "great" winners during two separate episodes over the 1970-83 period. To be considered a great winner, a company typi-
cally had to at least double in value within a calendar year; there were a few exceptions to this guideline, and not all companies that dou- bled in value were selected.5
We merged the list of great winners with a file containing historical information on 2,279 NYSE and AMEX companies; these data were pub- lished in various issues of O'Neil's Datagraph over the 1970-83 period. Of 272 winning cases, 222 could be matched with the Datagraph infor- mation; the unmatched companies were OTC firms not covered in the historical files or firms whose CUSIP numbers could not be matched because of name changes. The complete list of 272 winners enjoyed average price appreciation of 361 per cent; the matched list of 222 winners increased in value by an average 349 per cent.
To compute the price appreciation of the winners, we assigned them hypothetical buy and sell dates. These dates were selected ex post facto, hence were not generated from actual stock market recommendations. The number of weeks between hypothetical purchase and sale varied from company to company. Panel A of Table I summarizes the price appreciations of the 222 winners between the buy and sell dates. While the average advance of 349 per cent was pulled up by the performance of a couple of stocks with astronomical price advances (4009 and 2554 per cent), more than half the firms increased in value by at least 237 per cent. One- quarter of these firms earned more than 370 per cent, and more than 95 per cent at least doubled in value.
Panel B of Table I displays the number of weeks that elapsed between buy and sell dates. Half the firms were held for less than 60 weeks. One-tenth of the firms were held for more than
Table I Price Appreciation and Length of Time Position Held
Panel A: Price Appreciation (per cent)
Percentiles
Mean 349 5% 104 95% 945 Median 237 10% 119 90% 652
25% 159 75% 370 Panel B: Elapsed Time Between Buy and Sell Dates
(in weeks)
Percentiles
Mean 77 5% 26 95% 178 Median 60 10% 34 90% 155
25% 44 75% 96
FINANCIAL ANALYSTS JOURNAL / MARCH-APRIL 1988 C 17
This content downloaded from 91.229.229.49 on Fri, 13 Jun 2014 20:02:10 PMAll use subject to JSTOR Terms and Conditions
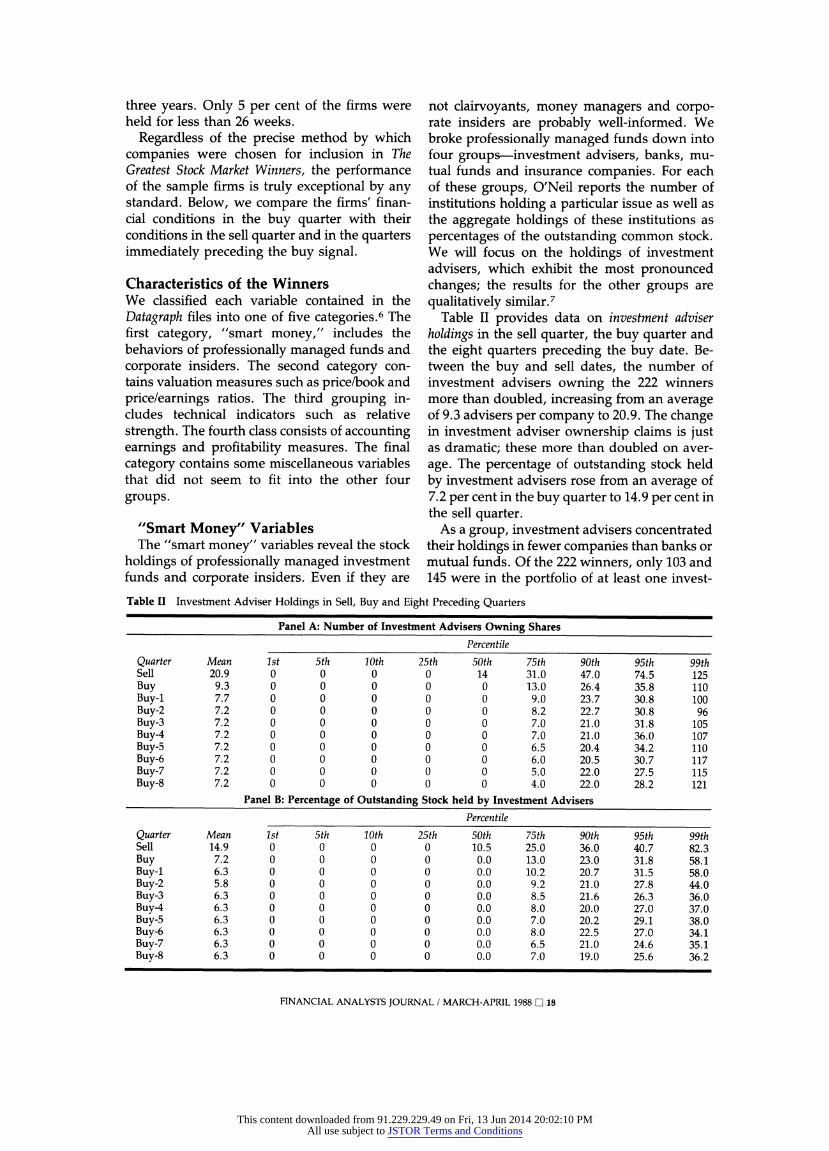
three years. Only 5 per cent of the firms were held for less than 26 weeks.
Regardless of the precise method by which companies were chosen for inclusion in The Greatest Stock Market Winners, the performance of the sample firms is truly exceptional by any standard. Below, we compare the firms' finan- cial conditions in the buy quarter with their conditions in the sell quarter and in the quarters immediately preceding the buy signal.
Characteristics of the Winners We classified each variable contained in the Datagraph files into one of five categories.6 The first category, "smart money," includes the behaviors of professionally managed funds and corporate insiders. The second category con- tains valuation measures such as price/book and price/earnings ratios. The third grouping in- cludes technical indicators such as relative strength. The fourth class consists of accounting earnings and profitability measures. The final category contains some miscellaneous variables that did not seem to fit into the other four groups.
"Smart Money" Variables The "smart money" variables reveal the stock
holdings of professionally managed investment funds and corporate insiders. Even if they are
not clairvoyants, money managers and corpo- rate insiders are probably well-informed. We broke professionally managed funds down into four groups-investment advisers, banks, mu- tual funds and insurance companies. For each of these groups, O'Neil reports the number of institutions holding a particular issue as well as the aggregate holdings of these institutions as percentages of the outstanding common stock. We will focus on the holdings of investment advisers, which exhibit the most pronounced changes; the results for the other groups are qualitatively similar.7
Table II provides data on investment adviser holdings in the sell quarter, the buy quarter and the eight quarters preceding the buy date. Be- tween the buy and sell dates, the number of investment advisers owning the 222 winners more than doubled, increasing from an average of 9.3 advisers per company to 20.9. The change in investment adviser ownership claims is just as dramatic; these more than doubled on aver- age. The percentage of outstanding stock held by investment advisers rose from an average of 7.2 per cent in the buy quarter to 14.9 per cent in the sell quarter.
As a group, investment advisers concentrated their holdings in fewer companies than banks or mutual funds. Of the 222 winners, only 103 and 145 were in the portfolio of at least one invest-
Table II Investment Adviser Holdings in Sell, Buy and Eight Preceding Quarters
Panel A: Number of Investment Advisers Owning Shares Percentile
Quarter Mean 1st 5th 10th 25th 50th 75th 90th 95th 99th Sell 20.9 0 0 0 0 14 31.0 47.0 74.5 125 Buy 9.3 0 0 0 0 0 13.0 26.4 35.8 110 Buy-i 7.7 0 0 0 0 0 9.0 23.7 30.8 100 Buy-2 7.2 0 0 0 0 0 8.2 22.7 30.8 96 Buy-3 7.2 0 0 0 0 0 7.0 21.0 31.8 105 Buy-4 7.2 0 0 0 0 0 7.0 21.0 36.0 107 Buy-5 7.2 0 0 0 0 0 6.5 20.4 34.2 110 Buy-6 7.2 0 0 0 0 0 6.0 20.5 30.7 117 Buy-7 7.2 0 0 0 0 0 5.0 22.0 27.5 115 Buy-8 7.2 0 0 0 0 0 4.0 22.0 28.2 121
Panel B: Percentage of Outstanding Stock held by Investment Advisers Percentile
Quarter Mean 1st 5th 10th 25th 50th 75th 90th 95th 99th Sell 14.9 0 0 0 0 10.5 25.0 36.0 40.7 82.3 Buy 7.2 0 0 0 0 0.0 13.0 23.0 31.8 58.1 Buy-i 6.3 0 0 0 0 0.0 10.2 20.7 31.5 58.0 Buy-2 5.8 0 0 0 0 0.0 9.2 21.0 27.8 44.0 Buy-3 6.3 0 0 0 0 0.0 8.5 21.6 26.3 36.0 Buy-4 6.3 0 0 0 0 0.0 8.0 20.0 27.0 37.0 Buy-5 6.3 0 0 0 0 0.0 7.0 20.2 29.1 38.0 Buy-6 6.3 0 0 0 0 0.0 8.0 22.5 27.0 34.1 Buy-7 6.3 0 0 0 0 0.0 6.5 21.0 24.6 35.1 Buy-8 6.3 0 0 0 0 0.0 7.0 19.0 25.6 36.2
FINANCIAL ANALYSTS JOURNAL / MARCH-APRIL 1988 0 18
This content downloaded from 91.229.229.49 on Fri, 13 Jun 2014 20:02:10 PMAll use subject to JSTOR Terms and Conditions
ment adviser in the buy and sell quarters, respectively. But although investment advisers avoided placing funds in a substantial fraction of the winners, they appear to have been very aggressive with their investments in the compa- nies they did purchase.
Despite the investment advisers' aggressive positioning during the period of major price appreciation, their sponsorship data hold little promise of forecasting the big price change. Although there is a slight increase in sponsor- ship by investment advisers in the quarter or two preceding the buy date, the change is minuscule compared with that observed be- tween the buy and sell dates. While these data do not indicate whether investment advisers jumped on the bandwagon or followed it, they suggest that these institutions cannot serve as the bellwether of stock price surges. The past behavior of investment advisers is not apt to be a good predictor of future stock price move- ments.
We can draw several general observations from the professionally managed funds as a whole. If hindsight were foresight, one would like to know of impending significant increases in the sponsorship of stock held by banks, mutual funds and investment advisers. Be- tween the buy and sell dates, these groups of
professionally managed funds increased their average ownership stakes in the 222 winners by 25, 60 and 107 per cent, respectively. At least at the conclusion of the rapid price advance, these funds were where the action was. Prior to the buy quarter, the ownership claims of these managed funds tended to rise only slightly; the big increase in sponsorship occurred as prices began to escalate sharply. Thus professional money managers may participate in, but do not prophesy, extraordinary price appreciation.
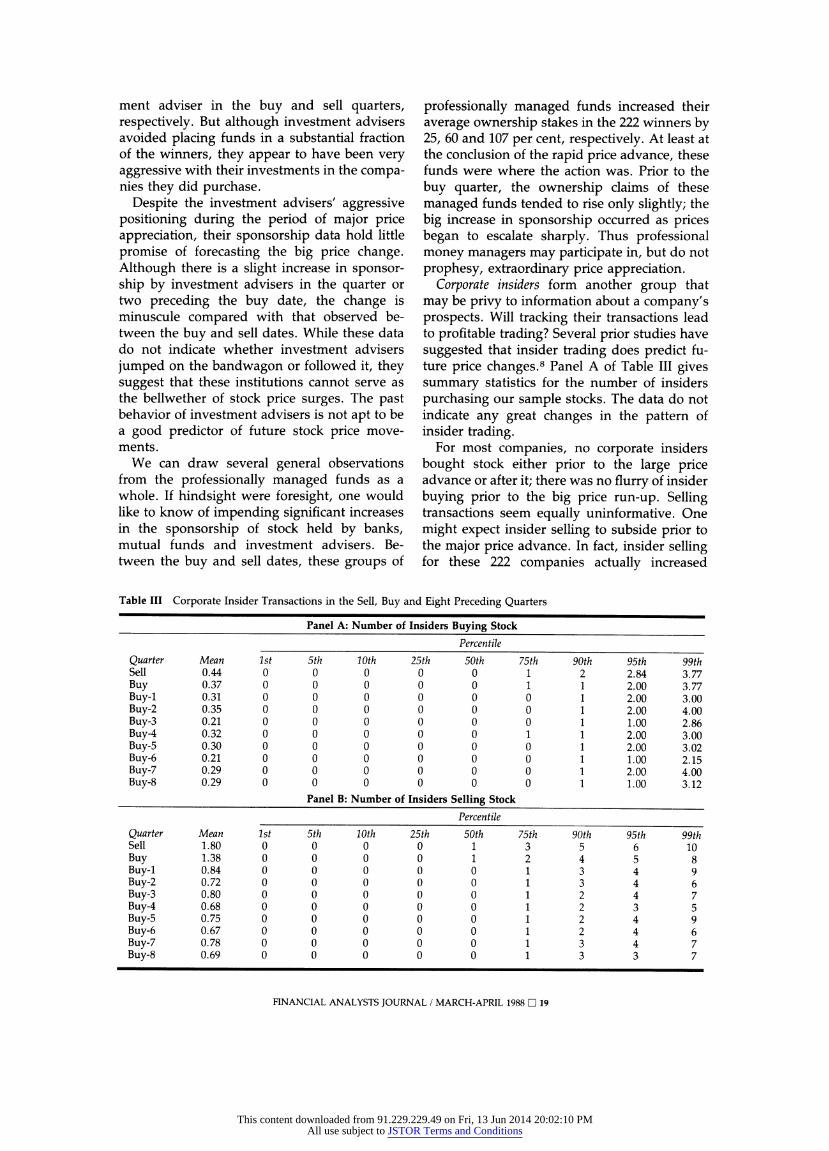
Corporate insiders form another group that may be privy to information about a company's prospects. Will tracking their transactions lead to profitable trading? Several prior studies have suggested that insider trading does predict fu- ture price changes.8 Panel A of Table III gives summary statistics for the number of insiders purchasing our sample stocks. The data do not indicate any great changes in the pattern of insider trading.
For most companies, no corporate insiders bought stock either prior to the large price advance or after it; there was no flurry of insider buying prior to the big price run-up. Selling transactions seem equally uninformative. One might expect insider selling to subside prior to the major price advance. In fact, insider selling for these 222 companies actually increased
Table III Corporate Insider Transactions in the Sell, Buy and Eight Preceding Quarters
Panel A: Number of Insiders Buying Stock Percentile
Quarter Mean 1st 5th 10th 25th 50th 75th 90th 95th 99th Sell 0.44 0 0 0 0 0 1 2 2.84 3.77 Buy 0.37 0 0 0 0 0 1 1 2.00 3.77 Buy-1 0.31 0 0 0 0 0 0 1 2.00 3.00 Buy-2 0.35 0 0 0 0 0 0 1 2.00 4.00 Buy-3 0.21 0 0 0 0 0 0 1 1.00 2.86 Buy-4 0.32 0 0 0 0 0 1 1 2.00 3.00 Buy-5 0.30 0 0 0 0 0 0 1 2.00 3.02 Buy-6 0.21 0 0 0 0 0 0 1 1.00 2.15 Buy-7 0.29 0 0 0 0 0 0 1 2.00 4.00 Buy-8 0.29 0 0 0 0 0 0 1 1.00 3.12
Panel B: Number of Insiders Selling Stock
Percentile Quarter Mean 1st 5th 10th 25th 50th 75th 90th 95th 99th Sell 1.80 0 0 0 0 1 3 5 6 10 Buy 1.38 0 0 0 0 1 2 4 5 8 Buy-1 0.84 0 0 0 0 0 1 3 4 9 Buy-2 0.72 0 0 0 0 0 1 3 4 6 Buy-3 0.80 0 0 0 0 0 1 2 4 7 Buy-4 0.68 0 0 0 0 0 1 2 3 5 Buy-5 0.75 0 0 0 0 0 1 2 4 9 Buy-6 0.67 0 0 0 0 0 1 2 4 6 Buy-7 0.78 0 0 0 0 0 1 3 4 7 Buy-8 0.69 0 0 0 0 0 1 3 3 7
FINANCIAL ANALYSTS JOURNAL / MARCH-APRIL 1988 D 19
This content downloaded from 91.229.229.49 on Fri, 13 Jun 2014 20:02:10 PMAll use subject to JSTOR Terms and Conditions
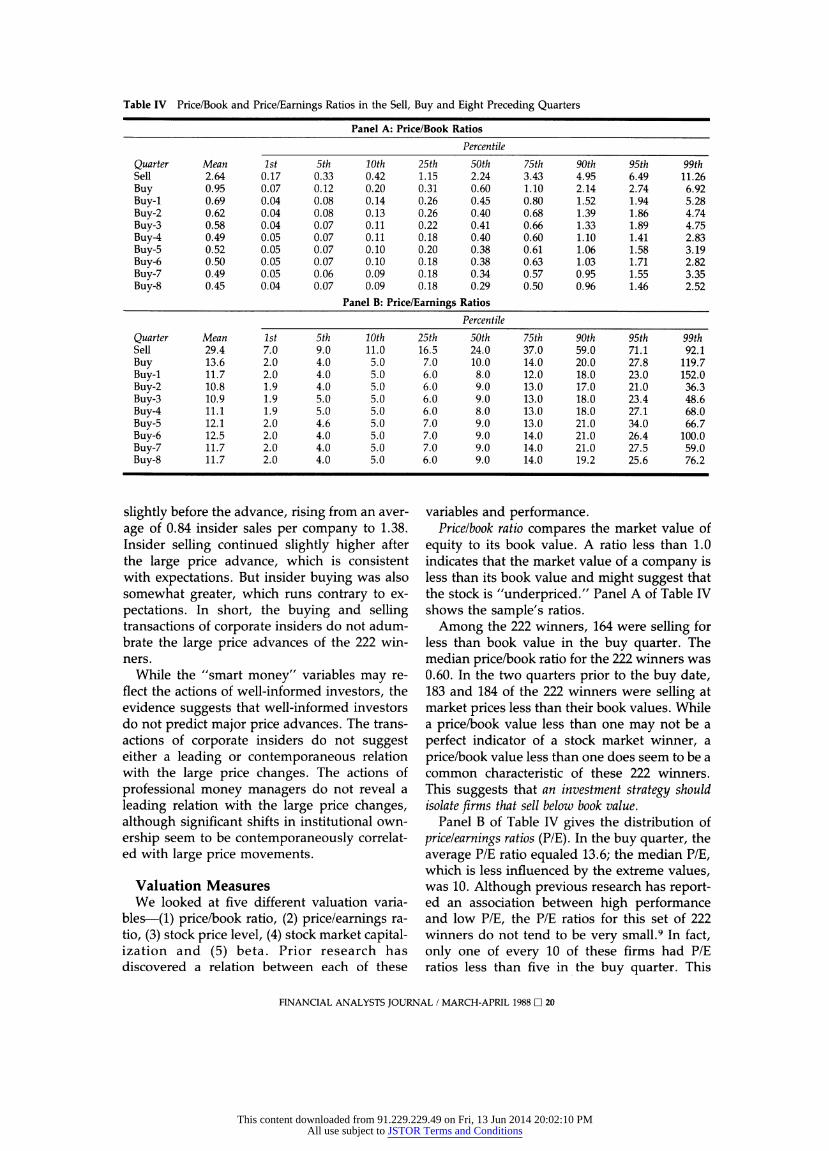
Table IV Price/Book and Price/Earnings Ratios in the Sell, Buy and Eight Preceding Quarters
Panel A: Price/Book Ratios
Percentile
Quarter Mean 1st 5th 10th 25th 50th 75th 90th 95th 99th Sell 2.64 0.17 0.33 0.42 1.15 2.24 3.43 4.95 6.49 11.26 Buy 0.95 0.07 0.12 0.20 0.31 0.60 1.10 2.14 2.74 6.92 Buy-i 0.69 0.04 0.08 0.14 0.26 0.45 0.80 1.52 1.94 5.28 Buy-2 0.62 0.04 0.08 0.13 0.26 0.40 0.68 1.39 1.86 4.74 Buy-3 0.58 0.04 0.07 0.11 0.22 0.41 0.66 1.33 1.89 4.75 Buy-4 0.49 0.05 0.07 0.11 0.18 0.40 0.60 1.10 1.41 2.83 Buy-5 0.52 0.05 0.07 0.10 0.20 0.38 0.61 1.06 1.58 3.19 Buy-6 0.50 0.05 0.07 0.10 0.18 0.38 0.63 1.03 1.71 2.82 Buy-7 0.49 0.05 0.06 0.09 0.18 0.34 0.57 0.95 1.55 3.35 Buy-8 0.45 0.04 0.07 0.09 0.18 0.29 0.50 0.96 1.46 2.52
Panel B: Price/Earnings Ratios
Percentile
Quarter Mean 1st 5th 10th 25th 50th 75th 90th 95th 99th Sell 29.4 7.0 9.0 11.0 16.5 24.0 37.0 59.0 71.1 92.1 Buy 13.6 2.0 4.0 5.0 7.0 10.0 14.0 20.0 27.8 119.7 Buy-i 11.7 2.0 4.0 5.0 6.0 8.0 12.0 18.0 23.0 152.0 Buy-2 10.8 1.9 4.0 5.0 6.0 9.0 13.0 17.0 21.0 36.3 Buy-3 10.9 1.9 5.0 5.0 6.0 9.0 13.0 18.0 23.4 48.6 Buy-4 11.1 1.9 5.0 5.0 6.0 8.0 13.0 18.0 27.1 68.0 Buy-5 12.1 2.0 4.6 5.0 7.0 9.0 13.0 21.0 34.0 66.7 Buy-6 12.5 2.0 4.0 5.0 7.0 9.0 14.0 21.0 26.4 100.0 Buy-7 11.7 2.0 4.0 5.0 7.0 9.0 14.0 21.0 27.5 59.0 Buy-8 11.7 2.0 4.0 5.0 6.0 9.0 14.0 19.2 25.6 76.2
slightly before the advance, rising from an aver- age of 0.84 insider sales per company to 1.38. Insider selling continued slightly higher after the large price advance, which is consistent with expectations. But insider buying was also somewhat greater, which runs contrary to ex- pectations. In short, the buying and selling transactions of corporate insiders do not adum- brate the large price advances of the 222 win- ners.
While the "smart money" variables may re- flect the actions of well-informed investors, the evidence suggests that well-informed investors do not predict major price advances. The trans- actions of corporate insiders do not suggest either a leading or contemporaneous relation with the large price changes. The actions of professional money managers do not reveal a leading relation with the large price changes, although significant shifts in institutional own- ership seem to be contemporaneously correlat- ed with large price movements.
Valuation Measures We looked at five different valuation varia-
bles-(1) price/book ratio, (2) price/earnings ra- tio, (3) stock price level, (4) stock market capital- ization and (5) beta. Prior research has discovered a relation between each of these
variables and performance. Pricelbook ratio compares the market value of
equity to its book value. A ratio less than 1.0 indicates that the market value of a company is less than its book value and might suggest that the stock is "underpriced." Panel A of Table IV shows the sample's ratios.
Among the 222 winners, 164 were selling for less than book value in the buy quarter. The median price/book ratio for the 222 winners was 0.60. In the two quarters prior to the buy date, 183 and 184 of the 222 winners were selling at market prices less than their book values. While a price/book value less than one may not be a perfect indicator of a stock market winner, a price/book value less than one does seem to be a common characteristic of these 222 winners. This suggests that an investment strategy should isolate firms that sell below book value.
Panel B of Table IV gives the distribution of price/earnings ratios (P/E). In the buy quarter, the average P/E ratio equaled 13.6; the median P/E, which is less influenced by the extreme values, was 10. Although previous research has report- ed an association between high performance and low P/E, the P/E ratios for this set of 222 winners do not tend to be very small.9 In fact, only one of every 10 of these firms had P/E ratios less than five in the buy quarter. This
FINANCIAL ANALYSTS JOURNAL / MARCH-APRIL 1988 D 20
This content downloaded from 91.229.229.49 on Fri, 13 Jun 2014 20:02:10 PMAll use subject to JSTOR Terms and Conditions
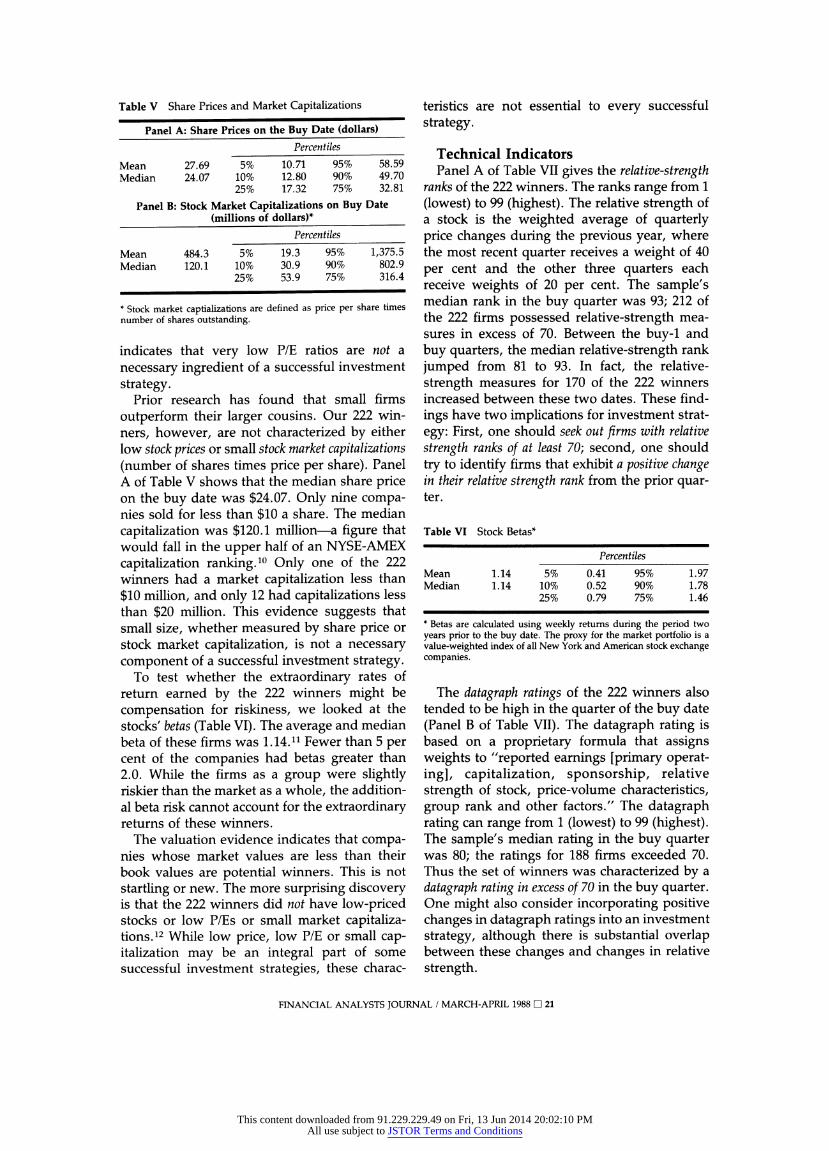
Table V Share Prices and Market Capitalizations
Panel A: Share Prices on the Buy Date (dollars) Percentiles
Mean 27.69 5% 10.71 95% 58.59 Median 24.07 10% 12.80 90% 49.70
25% 17.32 75% 32.81
Panel B: Stock Market Capitalizations on Buy Date (millions of dollars)*
Percentiles
Mean 484.3 5% 19.3 95% 1,375.5 Median 120.1 10% 30.9 90% 802.9
25% 53.9 75% 316.4
* Stock market captializations are defined as price per share times number of shares outstanding.
indicates that very low P/E ratios are not a necessary ingredient of a successful investment strategy.
Prior research has found that small firms outperform their larger cousins. Our 222 win- ners, however, are not characterized by either low stock prices or small stock market capitalizations (number of shares times price per share). Panel A of Table V shows that the median share price on the buy date was $24.07. Only nine compa- nies sold for less than $10 a share. The median capitalization was $120.1 million-a figure that would fall in the upper half of an NYSE-AMEX capitalization ranking.10 Only one of the 222 winners had a market capitalization less than $10 million, and only 12 had capitalizations less than $20 million. This evidence suggests that small size, whether measured by share price or stock market capitalization, is not a necessary component of a successful investment strategy.
To test whether the extraordinary rates of return earned by the 222 winners might be compensation for riskiness, we looked at the stocks' betas (Table VI). The average and median beta of these firms was 1.14.11 Fewer than 5 per cent of the companies had betas greater than 2.0. While the firms as a group were slightly riskier than the market as a whole, the addition- al beta risk cannot account for the extraordinary returns of these winners.
The valuation evidence indicates that compa- nies whose market values are less than their book values are potential winners. This is not startling or new. The more surprising discovery is that the 222 winners did not have low-priced stocks or low P/Es or small market capitaliza- tions.12 While low price, low P/E or small cap- italization may be an integral part of some successful investment strategies, these charac-
teristics are not essential to every successful strategy.
Technical Indicators Panel A of Table VII gives the relative-strength
ranks of the 222 winners. The ranks range from 1 (lowest) to 99 (highest). The relative strength of a stock is the weighted average of quarterly price changes during the previous year, where the most recent quarter receives a weight of 40 per cent and the other three quarters each receive weights of 20 per cent. The sample's median rank in the buy quarter was 93; 212 of the 222 firms possessed relative-strength mea- sures in excess of 70. Between the buy-1 and buy quarters, the median relative-strength rank jumped from 81 to 93. In fact, the relative- strength measures for 170 of the 222 winners increased between these two dates. These find- ings have two implications for investment strat- egy: First, one should seek out firms with relative strength ranks of at least 70; second, one should try to identify firms that exhibit a positive change in their relative strength rank from the prior quar- ter.
Table VI Stock Betas*
Percentiles
Mean 1.14 5% 0.41 95% 1.97 Median 1.14 10% 0.52 90% 1.78
25% 0.79 75% 1.46
* Betas are calculated using weekly returns during the period two years prior to the buy date. The proxy for the market portfolio is a value-weighted index of all New York and American stock exchange companies.
The datagraph ratings of the 222 winners also tended to be high in the quarter of the buy date (Panel B of Table VII). The datagraph rating is based on a proprietary formula that assigns weights to "reported earnings [primary operat- ing], capitalization, sponsorship, relative strength of stock, price-volume characteristics, group rank and other factors." The datagraph rating can range from 1 (lowest) to 99 (highest). The sample's median rating in the buy quarter was 80; the ratings for 188 firms exceeded 70. Thus the set of winners was characterized by a datagraph rating in excess of 70 in the buy quarter. One might also consider incorporating positive changes in datagraph ratings into an investment strategy, although there is substantial overlap between these changes and changes in relative strength.
FINANCIAL ANALYSTS JOURNAL / MARCH-APRIL 1988 rU 21
This content downloaded from 91.229.229.49 on Fri, 13 Jun 2014 20:02:10 PMAll use subject to JSTOR Terms and Conditions
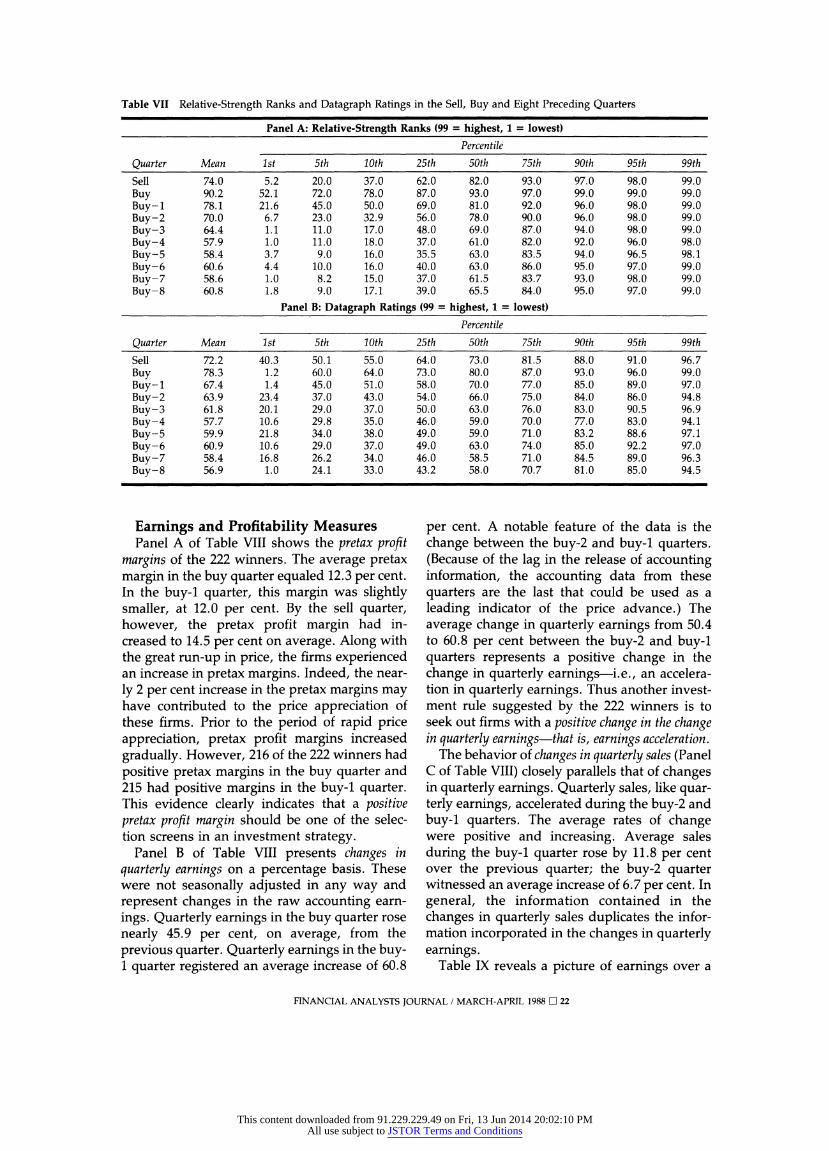
Table VII Relative-Strength Ranks and Datagraph Ratings in the Sell, Buy and Eight Preceding Quarters
Panel A: Relative-Strength Ranks (99 = highest, 1 = lowest)
Percentile
Quarter Mean 1st 5th 10th 25th 50th 75th 90th 95th 99th
Sell 74.0 5.2 20.0 37.0 62.0 82.0 93.0 97.0 98.0 99.0 Buy 90.2 52.1 72.0 78.0 87.0 93.0 97.0 99.0 99.0 99.0 Buy-I 78.1 21.6 45.0 50.0 69.0 81.0 92.0 96.0 98.0 99.0 Buy-2 70.0 6.7 23.0 32.9 56.0 78.0 90.0 96.0 98.0 99.0 Buy-3 64.4 1.1 11.0 17.0 48.0 69.0 87.0 94.0 98.0 99.0 Buy-4 57.9 1.0 11.0 18.0 37.0 61.0 82.0 92.0 96.0 98.0 Buy-5 58.4 3.7 9.0 16.0 35.5 63.0 83.5 94.0 96.5 98.1 Buy-6 60.6 4.4 10.0 16.0 40.0 63.0 86.0 95.0 97.0 99.0 Buy-7 58.6 1.0 8.2 15.0 37.0 61.5 83.7 93.0 98.0 99.0 Buy-8 60.8 1.8 9.0 17.1 39.0 65.5 84.0 95.0 97.0 99.0
Panel B: Datagraph Ratings (99 = highest, 1 = lowest)
Percentile
Quarter Mean 1st 5th 10th 25th 50th 75th 90th 95th 99th
Sell 72.2 40.3 50.1 55.0 64.0 73.0 81.5 88.0 91.0 96.7 Buy 78.3 1.2 60.0 64.0 73.0 80.0 87.0 93.0 96.0 99.0 Buy-1 67.4 1.4 45.0 51.0 58.0 70.0 77.0 85.0 89.0 97.0 Buy-2 63.9 23.4 37.0 43.0 54.0 66.0 75.0 84.0 86.0 94.8 Buy-3 61.8 20.1 29.0 37.0 50.0 63.0 76.0 83.0 90.5 96.9 Buy-4 57.7 10.6 29.8 35.0 46.0 59.0 70.0 77.0 83.0 94.1 Buy-5 59.9 21.8 34.0 38.0 49.0 59.0 71.0 83.2 88.6 97.1 Buy-6 60.9 10.6 29.0 37.0 49.0 63.0 74.0 85.0 92.2 97.0 Buy-7 58.4 16.8 26.2 34.0 46.0 58.5 71.0 84.5 89.0 96.3 Buy-8 56.9 1.0 24.1 33.0 43.2 58.0 70.7 81.0 85.0 94.5
Earnings and Profitability Measures Panel A of Table VIII shows the pretax profit
margins of the 222 winners. The average pretax margin in the buy quarter equaled 12.3 per cent. In the buy-1 quarter, this margin was slightly smaller, at 12.0 per cent. By the sell quarter, however, the pretax profit margin had in- creased to 14.5 per cent on average. Along with the great run-up in price, the firms experienced an increase in pretax margins. Indeed, the near- ly 2 per cent increase in the pretax margins may have contributed to the price appreciation of these firms. Prior to the period of rapid price appreciation, pretax profit margins increased gradually. However, 216 of the 222 winners had positive pretax margins in the buy quarter and 215 had positive margins in the buy-1 quarter. This evidence clearly indicates that a positive pretax profit margin should be one of the selec- tion screens in an investment strategy.
Panel B of Table VIII presents changes in quarterly earnings on a percentage basis. These were not seasonally adjusted in any way and represent changes in the raw accounting earn- ings. Quarterly earnings in the buy quarter rose nearly 45.9 per cent, on average, from the previous quarter. Quarterly earnings in the buy- 1 quarter registered an average increase of 60.8
per cent. A notable feature of the data is the change between the buy-2 and buy-1 quarters. (Because of the lag in the release of accounting information, the accounting data from these quarters are the last that could be used as a leading indicator of the price advance.) The average change in quarterly earnings from 50.4 to 60.8 per cent between the buy-2 and buy-1 quarters represents a positive change in the change in quarterly earnings-i.e., an accelera- tion in quarterly earnings. Thus another invest- ment rule suggested by the 222 winners is to seek out firms with a positive change in the change in quarterly earnings-that is, earnings acceleration.
The behavior of changes in quarterly sales (Panel C of Table VIII) closely parallels that of changes in quarterly earnings. Quarterly sales, like quar- terly earnings, accelerated during the buy-2 and buy-1 quarters. The average rates of change were positive and increasing. Average sales during the buy-1 quarter rose by 11.8 per cent over the previous quarter; the buy-2 quarter witnessed an average increase of 6.7 per cent. In general, the information contained in the changes in quarterly sales duplicates the infor- mation incorporated in the changes in quarterly earnings.
Table IX reveals a picture of earnings over a
FINANCIAL ANALYSTS JOURNAL / MARCH-APRIL 1988 D 22
This content downloaded from 91.229.229.49 on Fri, 13 Jun 2014 20:02:10 PMAll use subject to JSTOR Terms and Conditions
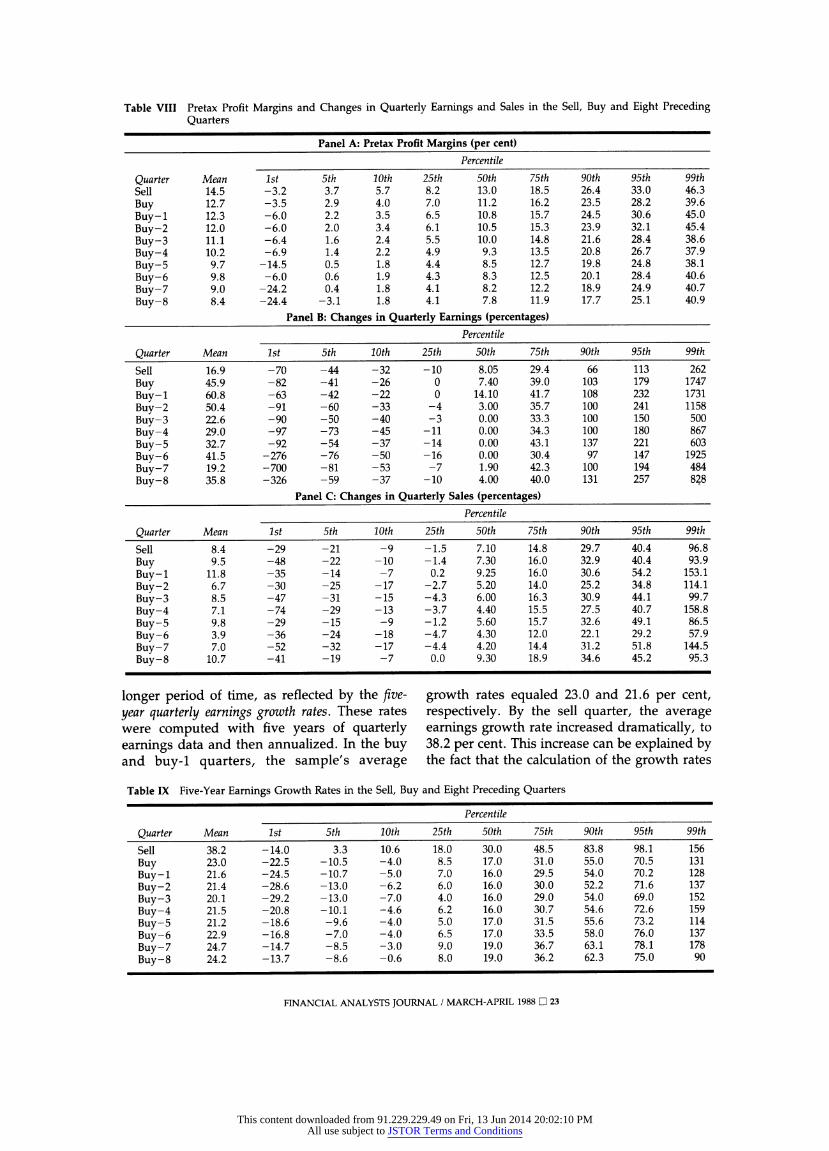
Table VIII Pretax Profit Margins and Changes in Quarterly Earnings and Sales in the Sell, Buy and Eight Preceding Quarters
Panel A: Pretax Profit Margins (per cent)
Percentile
Quarter Mean 1st 5th 10th 25th 50th 75th 90th 95th 99th Sell 14.5 -3.2 3.7 5.7 8.2 13.0 18.5 26.4 33.0 46.3 Buy 12.7 -3.5 2.9 4.0 7.0 11.2 16.2 23.5 28.2 39.6 Buy-1 12.3 -6.0 2.2 3.5 6.5 10.8 15.7 24.5 30.6 45.0 Buy-2 12.0 -6.0 2.0 3.4 6.1 10.5 15.3 23.9 32.1 45.4 Buy-3 11.1 -6.4 1.6 2.4 5.5 10.0 14.8 21.6 28.4 38.6 Buy-4 10.2 -6.9 1.4 2.2 4.9 9.3 13.5 20.8 26.7 37.9 Buy-5 9.7 -14.5 0.5 1.8 4.4 8.5 12.7 19.8 24.8 38.1 Buy-6 9.8 -6.0 0.6 1.9 4.3 8.3 12.5 20.1 28.4 40.6 Buy-7 9.0 -24.2 0.4 1.8 4.1 8.2 12.2 18.9 24.9 40.7 Buy-8 8.4 -24.4 -3.1 1.8 4.1 7.8 11.9 17.7 25.1 40.9
Panel B: Changes in Quarterly Earnings (percentages)
Percentile
Quarter Mean 1st 5th 10th 25th 50th 75th 90th 95th 99th
Sell 16.9 -70 -44 -32 -10 8.05 29.4 66 113 262 Buy 45.9 -82 -41 -26 0 7.40 39.0 103 179 1747 Buy-1 60.8 -63 -42 -22 0 14.10 41.7 108 232 1731 Buy-2 50.4 -91 -60 -33 -4 3.00 35.7 100 241 1158 Buy-3 22.6 -90 -50 -40 -3 0.00 33.3 100 150 500 Buy-4 29.0 -97 -73 -45 -11 0.00 34.3 100 180 867 Buy-5 32.7 -92 -54 -37 -14 0.00 43.1 137 221 603 Buy-6 41.5 -276 -76 -50 -16 0.00 30.4 97 147 1925 Buy-7 19.2 -700 -81 -53 -7 1.90 42.3 100 194 484 Buy-8 35.8 -326 -59 -37 -10 4.00 40.0 131 257 828
Panel C: Changes in Quarterly Sales (percentages)
Percentile
Quarter Mean 1st 5th 10th 25th 50th 75th 90th 95th 99th
Sell 8.4 -29 -21 -9 -1.5 7.10 14.8 29.7 40.4 96.8 Buy 9.5 -48 -22 -10 -1.4 7.30 16.0 32.9 40.4 93.9 Buy-I 11.8 -35 -14 -7 0.2 9.25 16.0 30.6 54.2 153.1 Buy-2 6.7 -30 -25 -17 -2.7 5.20 14.0 25.2 34.8 114.1 Buy-3 8.5 -47 -31 -15 -4.3 6.00 16.3 30.9 44.1 99.7 Buy-4 7.1 -74 -29 -13 -3.7 4.40 15.5 27.5 40.7 158.8 Buy-5 9.8 -29 -15 -9 -1.2 5.60 15.7 32.6 49.1 86.5 Buy-6 3.9 -36 -24 -18 -4.7 4.30 12.0 22.1 29.2 57.9 Buy-7 7.0 -52 -32 -17 -4.4 4.20 14.4 31.2 51.8 144.5 Buy-8 10.7 -41 -19 -7 0.0 9.30 18.9 34.6 45.2 95.3
longer period of time, as reflected by the five- year quarterly earnings growth rates. These rates were computed with five years of quarterly earnings data and then annualized. In the buy and buy-1 quarters, the sample's average
growth rates equaled 23.0 and 21.6 per cent, respectively. By the sell quarter, the average earnings growth rate increased dramatically, to 38.2 per cent. This increase can be explained by the fact that the calculation of the growth rates
Table IX Five-Year Earnings Growth Rates in the Sell, Buy and Eight Preceding Quarters
Percentile
Quarter Mean 1st 5th 10th 25th 50th 75th 90th 95th 99th
Sell 38.2 -14.0 3.3 10.6 18.0 30.0 48.5 83.8 98.1 156 Buy 23.0 -22.5 -10.5 -4.0 8.5 17.0 31.0 55.0 70.5 131 Buy-1 21.6 -24.5 -10.7 -5.0 7.0 16.0 29.5 54.0 70.2 128 Buy-2 21.4 -28.6 -13.0 -6.2 6.0 16.0 30.0 52.2 71.6 137 Buy-3 20.1 -29.2 -13.0 -7.0 4.0 16.0 29.0 54.0 69.0 152 Buy-4 21.5 -20.8 -10.1 -4.6 6.2 16.0 30.7 54.6 72.6 159 Buy-5 21.2 -18.6 -9.6 -4.0 5.0 17.0 31.5 55.6 73.2 114 Buy-6 22.9 -16.8 -7.0 -4.0 6.5 17.0 33.5 58.0 76.0 137 Buy-7 24.7 -14.7 -8.5 -3.0 9.0 19.0 36.7 63.1 78.1 178 Buy-8 24.2 -13.7 -8.6 -0.6 8.0 19.0 36.2 62.3 75.0 90
FINANCIAL ANALYSTS JOURNAL / MARCH-APRIL 1988 0 23
This content downloaded from 91.229.229.49 on Fri, 13 Jun 2014 20:02:10 PMAll use subject to JSTOR Terms and Conditions
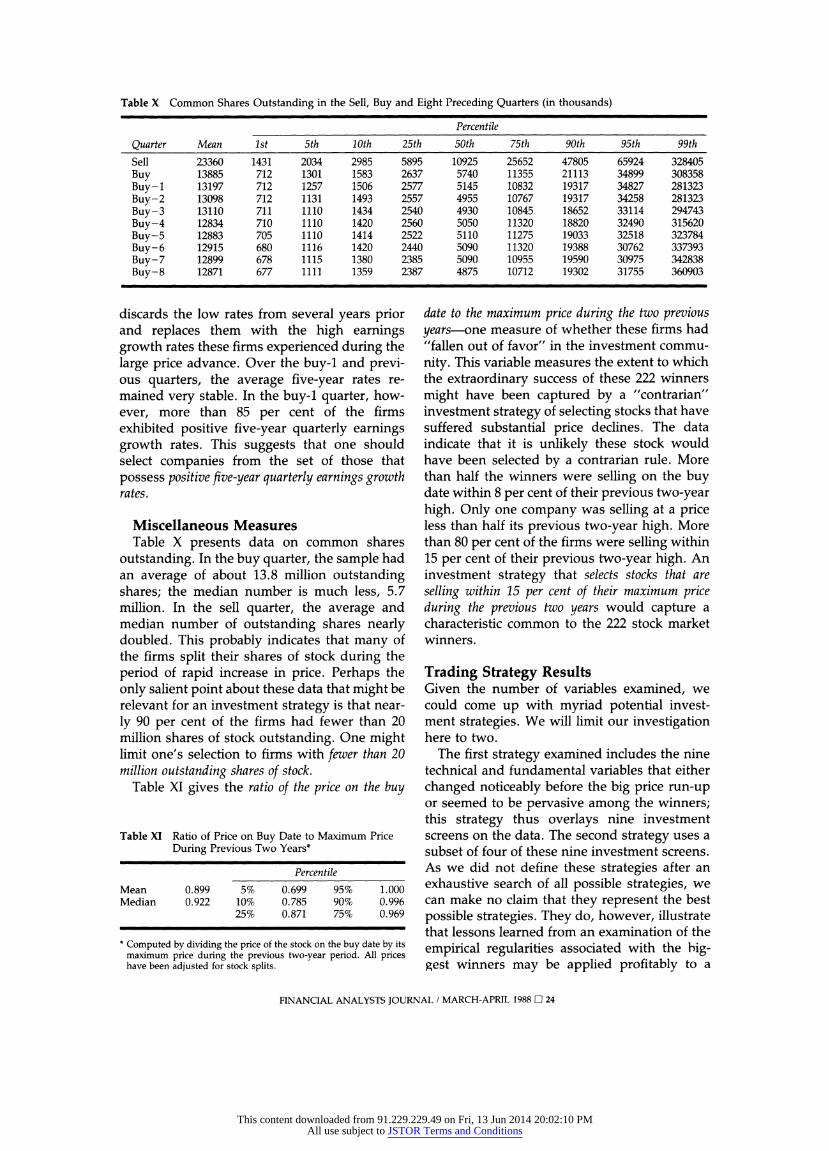
Table X Common Shares Outstanding in the Sell, Buy and Eight Preceding Quarters (in thousands)
Percentile
Quarter Mean 1st 5th 10th 25th 50th 75th 90th 95th 99th
Sell 23360 1431 2034 2985 5895 10925 25652 47805 65924 328405 Buy 13885 712 1301 1583 2637 5740 11355 21113 34899 308358 Buy-1 13197 712 1257 1506 2577 5145 10832 19317 34827 281323 Buy-2 13098 712 1131 1493 2557 4955 10767 19317 34258 281323 Buy-3 13110 711 1110 1434 2540 4930 10845 18652 33114 294743 Buy-4 12834 710 1110 1420 2560 5050 11320 18820 32490 315620 Buy-5 12883 705 1110 1414 2522 5110 11275 19033 32518 323784 Buy-6 12915 680 1116 1420 2440 5090 11320 19388 30762 337393 Buy-7 12899 678 1115 1380 2385 5090 10955 19590 30975 342838 Buy-8 12871 677 1111 1359 2387 4875 10712 19302 31755 360903
discards the low rates from several years prior and replaces them with the high earnings growth rates these firms experienced during the large price advance. Over the buy-1 and previ- ous quarters, the average five-year rates re- mained very stable. In the buy-1 quarter, how- ever, more than 85 per cent of the firms exhibited positive five-year quarterly earnings growth rates. This suggests that one should select companies from the set of those that possess positive five-year quarterly earnings growth rates.
Miscellaneous Measures Table X presents data on common shares
outstanding. In the buy quarter, the sample had an average of about 13.8 million outstanding shares; the median number is much less, 5.7 million. In the sell quarter, the average and median number of outstanding shares nearly doubled. This probably indicates that many of the firms split their shares of stock during the period of rapid increase in price. Perhaps the only salient point about these data that might be relevant for an investment strategy is that near- ly 90 per cent of the firms had fewer than 20 million shares of stock outstanding. One might limit one's selection to firms with fewer than 20 million outstanding shares of stock.
Table XI gives the ratio of the price on the buy
date to the maximum price during the two previous years-one measure of whether these firms had "fallen out of favor" in the investment commu- nity. This variable measures the extent to which the extraordinary success of these 222 winners might have been captured by a "contrarian" investment strategy of selecting stocks that have suffered substantial price declines. The data indicate that it is unlikely these stock would have been selected by a contrarian rule. More than half the winners were selling on the buy date within 8 per cent of their previous two-year high. Only one company was selling at a price less than half its previous two-year high. More than 80 per cent of the firms were selling within 15 per cent of their previous two-year high. An investment strategy that selects stocks that are selling within 15 per cent of their maximum price during the previous two years would capture a characteristic common to the 222 stock market winners.
Trading Strategy Results Given the number of variables examined, we could come up with myriad potential invest- ment strategies. We will limit our investigation here to two.
The first strategy examined includes the nine technical and fundamental variables that either changed noticeably before the big price run-up or seemed to be pervasive among the winners; this strategy thus overlays nine investment screens on the data. The second strategy uses a subset of four of these nine investment screens. As we did not define these strategies after an exhaustive search of all possible strategies, we can make no claim that they represent the best possible strategies. They do, however, illustrate that lessons learned from an examination of the empirical regularities associated with the big- gest winners may be applied profitably to a
Table XI Ratio of Price on Buy Date to Maximum Price During Previous Two Years*
Percentile
Mean 0.899 5% 0.699 95% 1.000 Median 0.922 10% 0.785 90% 0.996
25% 0.871 75% 0.969
* Computed by dividing the price of the stock on the buy date by its maximum price during the previous two-year period. All prices have been adjusted for stock splits.
FINANCIAL ANALYSTS JOURNAL / MARCH-APRIL 1988 D 24
This content downloaded from 91.229.229.49 on Fri, 13 Jun 2014 20:02:10 PMAll use subject to JSTOR Terms and Conditions
broader universe of companies. The rules for each trading strategy were
straightforward. After a buy signal was generat- ed, we waited 63 trading days before assuming a position in the stock; this delay ensured that accounting information assumed known had actually been released. The stock purchased was held for two years; no sell signal, other than the lapse of two years, was investigated. We calculated the cumulative holding-period return through each of the eight quarters. We then compared the cumulative holding-period re- turns of each selected stock with the cumulative returns of the S&P 500 index over the identical time period; the difference was labeled an ex- cess return. In cases where a buy signal for a particular company was generated at different times, we tracked the return for each buy signal separately.
The data employed to generate the buy sig- nals were contained on an O'Neil data tape that gave the fundamental and technical variables for 2,279 NYSE and AMEX firms over the 1970- 83 period. Any firm on our list of 222 winners was excluded from the trading strategy.13 Thus 2,057 companies were considered. The return data for the individual securities and the S&P 500 index were gathered from the files provided by the University of Chicago's Center for Re- search in Security Prices (CRSP).
A Nine-Screen Strategy Under the first trading strategy using nine
investment screens, a firm receives a buy signal when all the following conditions are met:
(1) price-to-book ratio is less than 1.0; (2) five-year growth rate based on quarterly
earnings is positive; (3) quarterly earnings are accelerating (i.e.,
there is a positive change in the percent-
age change in quarterly earnings); (4) pretax profit margins are positive; (5) fewer than 20 million common shares are
outstanding; (6) relative-strength rank is at least 70; (7) relative-strength rank of the stock in the
current quarter is greater than the rank in the previous quarter;
(8) O'Neil datagraph rating is at least 70; and (9) stock is selling within 15 per cent of its
maximum price during the previous two years.
These nine investment screens were not deter- mined from an analysis of the universe of 2,057 firms contained on the large O'Neil tape. Rath- er, these are prespecified conditions based upon the investigation into the common characteris- tics of O'Neil's 222 greatest stock market win- ners.
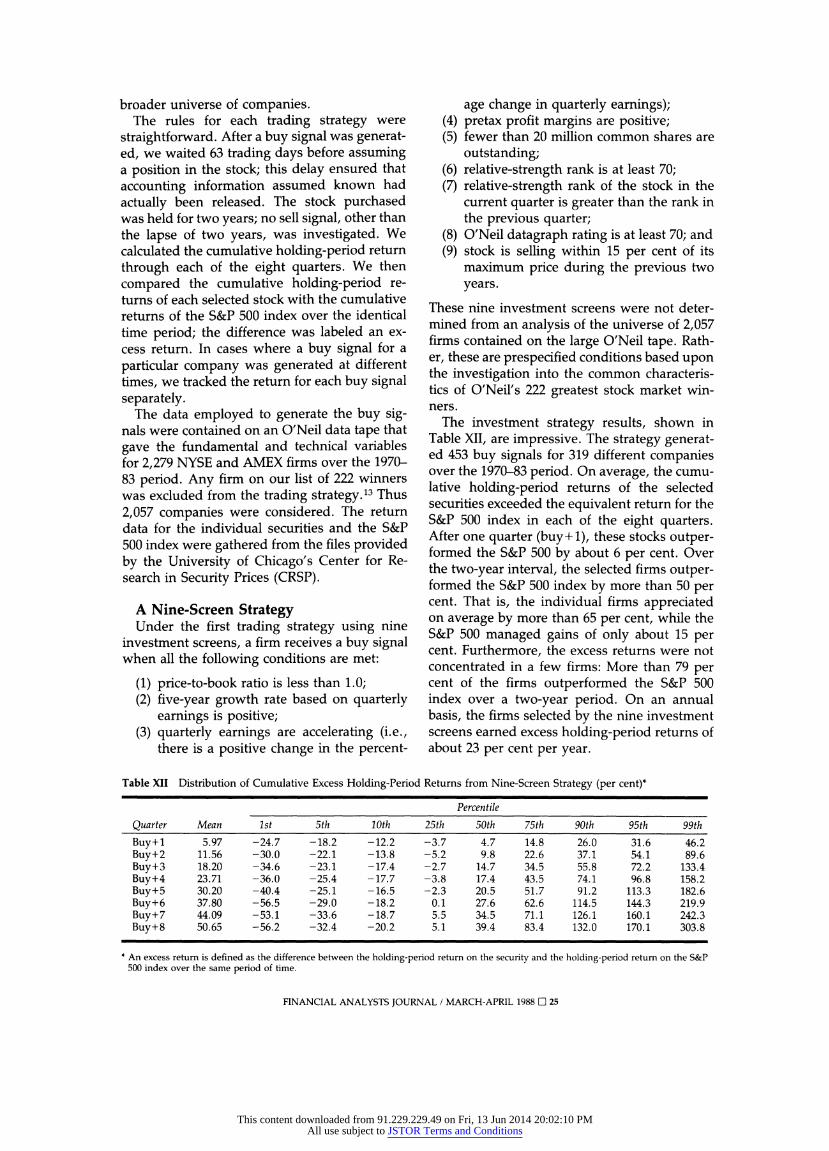
The investment strategy results, shown in Table XII, are impressive. The strategy generat- ed 453 buy signals for 319 different companies over the 1970-83 period. On average, the cumu- lative holding-period returns of the selected securities exceeded the equivalent return for the S&P 500 index in each of the eight quarters. After one quarter (buy+ 1), these stocks outper- formed the S&P 500 by about 6 per cent. Over the two-year interval, the selected firms outper- formed the S&P 500 index by more than 50 per cent. That is, the individual firms appreciated on average by more than 65 per cent, while the S&P 500 managed gains of only about 15 per cent. Furthermore, the excess returns were not concentrated in a few firms: More than 79 per cent of the firms outperformed the S&P 500 index over a two-year period. On an annual basis, the firms selected by the nine investment screens earned excess holding-period returns of about 23 per cent per year.
Table XII Distribution of Cumulative Excess Holding-Period Returns from Nine-Screen Strategy (per cent)*
Percentile
Quarter Mean 1st 5th 10th 25th 50th 75th 90th 95th 99th Buy+1 5.97 -24.7 -18.2 -12.2 -3.7 4.7 14.8 26.0 31.6 46.2 Buy+2 11.56 -30.0 -22.1 -13.8 -5.2 9.8 22.6 37.1 54.1 89.6 Buy+3 18.20 -34.6 -23.1 -17.4 -2.7 14.7 34.5 55.8 72.2 133.4 Buy+4 23.71 -36.0 -25.4 -17.7 -3.8 17.4 43.5 74.1 96.8 158.2 Buy+5 30.20 -40.4 -25.1 -16.5 -2.3 20.5 51.7 91.2 113.3 182.6 Buy+6 37.80 -56.5 -29.0 -18.2 0.1 27.6 62.6 114.5 144.3 219.9 Buy+7 44.09 -53.1 -33.6 -18.7 5.5 34.5 71.1 126.1 160.1 242.3 Buy+8 50.65 -56.2 -32.4 -20.2 5.1 39.4 83.4 132.0 170.1 303.8
* An excess return is defined as the difference between the holding-period return on the security and the holding-period return on the S&P 500 index over the same period of time.
FINANCIAL ANALYSTS JOURNAL / MARCH-APRIL 1988 D 25
This content downloaded from 91.229.229.49 on Fri, 13 Jun 2014 20:02:10 PMAll use subject to JSTOR Terms and Conditions
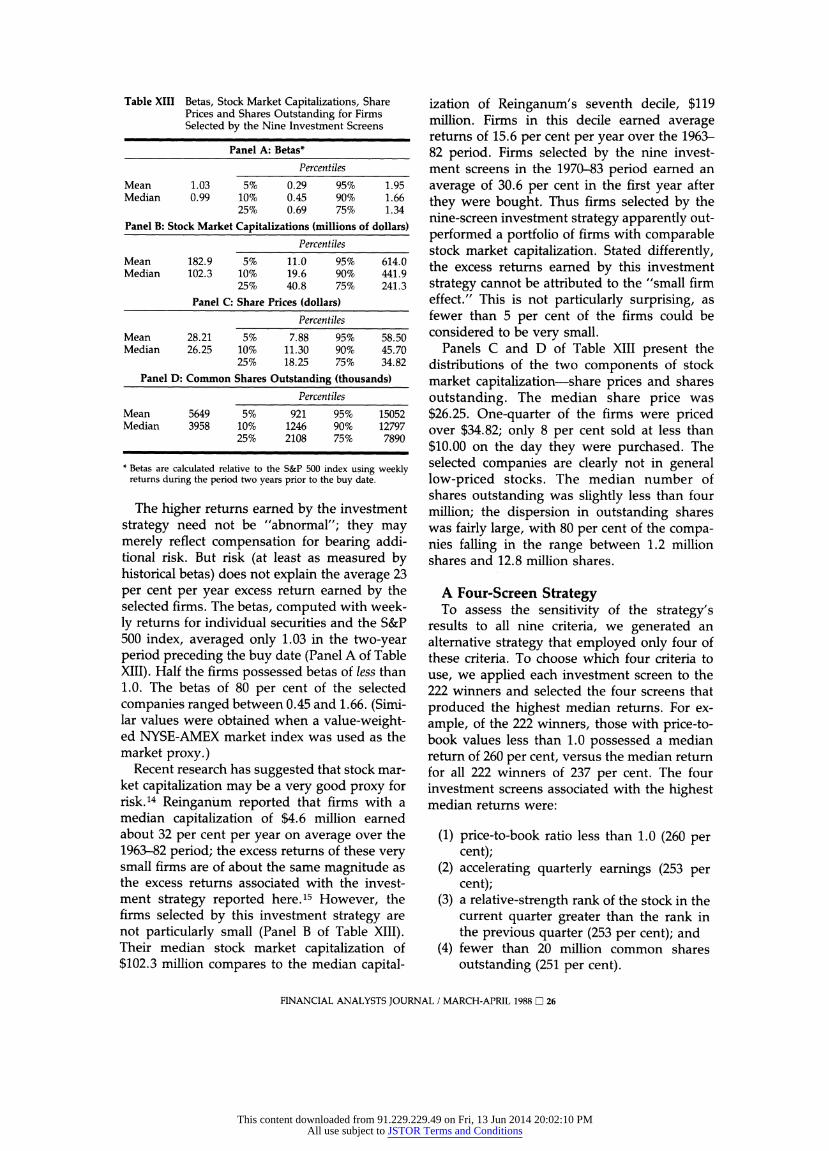
Table XIII Betas, Stock Market Capitalizations, Share Prices and Shares Outstanding for Firms Selected by the Nine Investment Screens
Panel A: Betas*
Percentiles
Mean 1.03 5% 0.29 95% 1.95 Median 0.99 10% 0.45 90% 1.66
25% 0.69 75% 1.34
Panel B: Stock Market Capitalizations (millions of dollars)
Percentiles
Mean 182.9 5% 11.0 95% 614.0 Median 102.3 10% 19.6 90% 441.9
25% 40.8 75% 241.3
Panel C: Share Prices (dollars)
Percentiles
Mean 28.21 5% 7.88 95% 58.50 Median 26.25 10% 11.30 90% 45.70
25% 18.25 75% 34.82
Panel D: Common Shares Outstanding (thousands)
Percentiles
Mean 5649 5% 921 95% 15052 Median 3958 10% 1246 90% 12797
25% 2108 75% 7890
* Betas are calculated relative to the S&P 500 index using weekly returns during the period two years prior to the buy date.
The higher returns earned by the investment strategy need not be "abnormal"; they may merely reflect compensation for bearing addi- tional risk. But risk (at least as measured by historical betas) does not explain the average 23 per cent per year excess return earned by the selected firms. The betas, computed with week- ly returns for individual securities and the S&P 500 index, averaged only 1.03 in the two-year period preceding the buy date (Panel A of Table XIII). Half the firms possessed betas of less than 1.0. The betas of 80 per cent of the selected companies ranged between 0.45 and 1.66. (Simi- lar values were obtained when a value-weight- ed NYSE-AMEX market index was used as the market proxy.)
Recent research has suggested that stock mar- ket capitalization may be a very good proxy for risk.14 Reinganum reported that firms with a median capitalization of $4.6 million earned about 32 per cent per year on average over the 1963-82 period; the excess returns of these very small firms are of about the same magnitude as the excess returns associated with the invest- ment strategy reported here.15 However, the firms selected by this investment strategy are not particularly small (Panel B of Table XIII). Their median stock market capitalization of $102.3 million compares to the median capital-
ization of Reinganum's seventh decile, $119 million. Firms in this decile earned average returns of 15.6 per cent per year over the 1963- 82 period. Firms selected by the nine invest- ment screens in the 1970-83 period earned an average of 30.6 per cent in the first year after they were bought. Thus firms selected by the nine-screen investment strategy apparently out- performed a portfolio of firms with comparable stock market capitalization. Stated differently, the excess returns earned by this investment strategy cannot be attributed to the "small firm effect." This is not particularly surprising, as fewer than 5 per cent of the firms could be considered to be very small.
Panels C and D of Table XIII present the distributions of the two components of stock market capitalization-share prices and shares outstanding. The median share price was $26.25. One-quarter of the firms were priced over $34.82; only 8 per cent sold at less than $10.00 on the day they were purchased. The selected companies are clearly not in general low-priced stocks. The median number of shares outstanding was slightly less than four million; the dispersion in outstanding shares was fairly large, with 80 per cent of the compa- nies falling in the range between 1.2 million shares and 12.8 million shares.
A Four-Screen Strategy To assess the sensitivity of the strategy's
results to all nine criteria, we generated an alternative strategy that employed only four of these criteria. To choose which four criteria to use, we applied each investment screen to the 222 winners and selected the four screens that produced the highest median returns. For ex- ample, of the 222 winners, those with price-to- book values less than 1.0 possessed a median return of 260 per cent, versus the median return for all 222 winners of 237 per cent. The four investment screens associated with the highest median returns were:
(1) price-to-book ratio less than 1.0 (260 per cent);
(2) accelerating quarterly earnings (253 per cent);
(3) a relative-strength rank of the stock in the current quarter greater than the rank in the previous quarter (253 per cent); and
(4) fewer than 20 million common shares outstanding (251 per cent).
FINANCIAL ANALYSTS JOURNAL / MARCH-APRIL 1988 D 26
This content downloaded from 91.229.229.49 on Fri, 13 Jun 2014 20:02:10 PMAll use subject to JSTOR Terms and Conditions
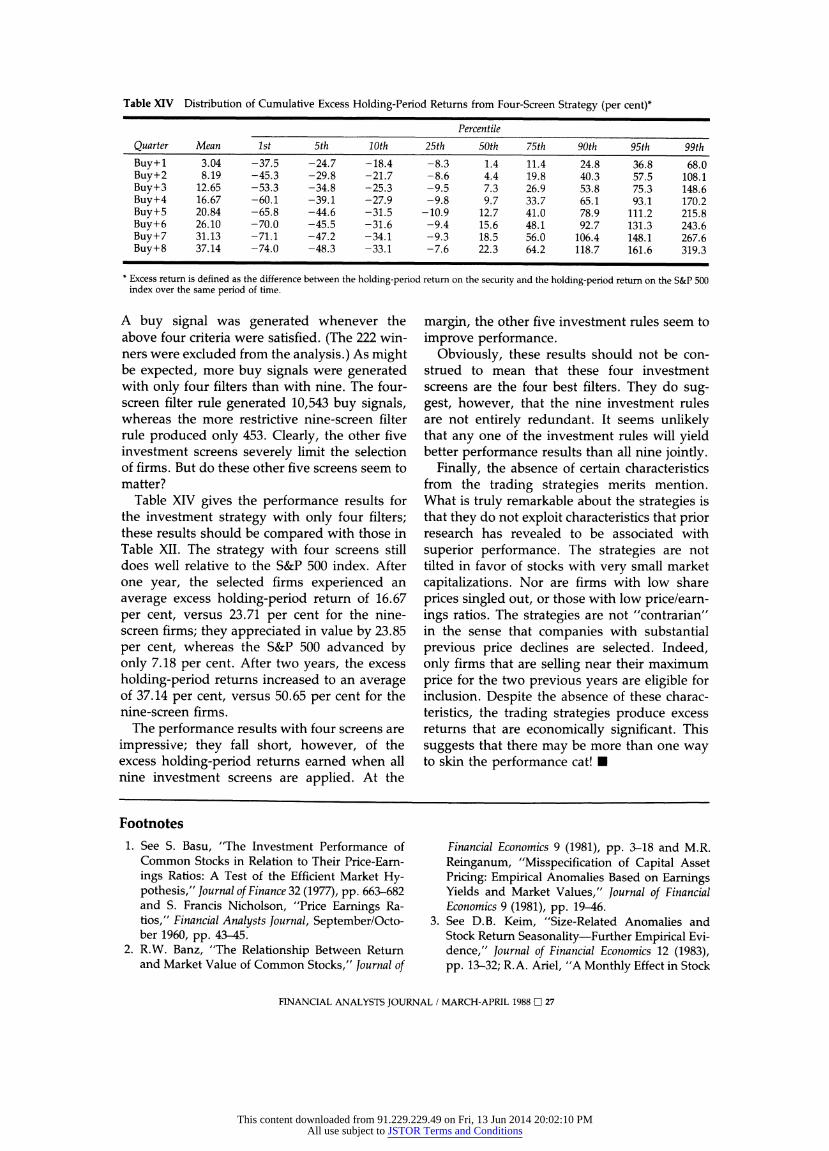
Table XIV Distribution of Cumulative Excess Holding-Period Returns from Four-Screen Strategy (per cent)*
Percentile Quarter Mean 1st 5th 10th 25th 50th 75th 90th 95th 99th Buy+1 3.04 -37.5 -24.7 -18.4 -8.3 1.4 11.4 24.8 36.8 68.0 Buy+2 8.19 -45.3 -29.8 -21.7 -8.6 4.4 19.8 40.3 57.5 108.1 Buy+3 12.65 -53.3 -34.8 -25.3 -9.5 7.3 26.9 53.8 75.3 148.6 Buy+4 16.67 -60.1 -39.1 -27.9 -9.8 9.7 33.7 65.1 93.1 170.2 Buy+5 20.84 -65.8 -44.6 -31.5 -10.9 12.7 41.0 78.9 111.2 215.8 Buy+6 26.10 -70.0 -45.5 -31.6 -9.4 15.6 48.1 92.7 131.3 243.6 Buy+7 31.13 -71.1 -47.2 -34.1 -9.3 18.5 56.0 106.4 148.1 267.6 Buy+8 37.14 -74.0 -48.3 -33.1 -7.6 22.3 64.2 118.7 161.6 319.3
* Excess return is defined as the difference between the holding-period return on the security and the holding-period return on the S&P 500 index over the same period of time.
A buy signal was generated whenever the above four criteria were satisfied. (The 222 win- ners were excluded from the analysis.) As might be expected, more buy signals were generated with only four filters than with nine. The four- screen filter rule generated 10,543 buy signals, whereas the more restrictive nine-screen filter rule produced only 453. Clearly, the other five investment screens severely limit the selection of firms. But do these other five screens seem to matter?
Table XIV gives the performance results for the investment strategy with only four filters; these results should be compared with those in Table XII. The strategy with four screens still does well relative to the S&P 500 index. After one year, the selected firms experienced an average excess holding-period return of 16.67 per cent, versus 23.71 per cent for the nine- screen firms; they appreciated in value by 23.85 per cent, whereas the S&P 500 advanced by only 7.18 per cent. After two years, the excess holding-period returns increased to an average of 37.14 per cent, versus 50.65 per cent for the nine-screen firms.
The performance results with four screens are impressive; they fall short, however, of the excess holding-period returns earned when all nine investment screens are applied. At the
margin, the other five investment rules seem to improve performance.
Obviously, these results should not be con- strued to mean that these four investment screens are the four best filters. They do sug- gest, however, that the nine investment rules are not entirely redundant. It seems unlikely that any one of the investment rules will yield better performance results than all nine jointly.
Finally, the absence of certain characteristics from the trading strategies merits mention. What is truly remarkable about the strategies is that they do not exploit characteristics that prior research has revealed to be associated with superior performance. The strategies are not tilted in favor of stocks with very small market capitalizations. Nor are firms with low share prices singled out, or those with low price/earn- ings ratios. The strategies are not "contrarian" in the sense that companies with substantial previous price declines are selected. Indeed, only firms that are selling near their maximum price for the two previous years are eligible for inclusion. Despite the absence of these charac- teristics, the trading strategies produce excess returns that are economically significant. This suggests that there may be more than one way to skin the performance cat! U
Footnotes
1. See S. Basu, "The Investment Performance of Common Stocks in Relation to Their Price-Earn- ings Ratios: A Test of the Efficient Market Hy- pothesis," Journal of Finance 32 (1977), pp. 663-682 and S. Francis Nicholson, "Price Earnings Ra- tios," Financial Analysts Journal, September/Octo- ber 1960, pp. 43-45.
2. R.W. Banz, "The Relationship Between Return and Market Value of Common Stocks," Journal of
Financial Economics 9 (1981), pp. 3-18 and M.R. Reinganum, "Misspecification of Capital Asset Pricing: Empirical Anomalies Based on Earnings Yields and Market Values," Journal of Financial Economics 9 (1981), pp. 19-46.
3. See D.B. Keim, "Size-Related Anomalies and Stock Return Seasonality-Further Empirical Evi- dence," Journal of Financial Economics 12 (1983), pp. 13-32; R.A. Ariel, "A Monthly Effect in Stock
FINANCIAL ANALYSTS JOURNAL / MARCH-APRIL 1988 LI 27
This content downloaded from 91.229.229.49 on Fri, 13 Jun 2014 20:02:10 PMAll use subject to JSTOR Terms and Conditions
Returns" (Working Paper No. 1629-84, Sloan School, M.I.T., 1984); K. R. French, "Stock Re- turns and the Weekend Effect," Journal of Finan- cial Economics 8 (1980), pp. 55-69; M.R. Gibbons and P. Hess, "Day of the Week Effects and Asset Retums," Journal of Business 54 (1981), pp. 579- 596; and L. Harris, "A Transaction Data Study of Weekly and Intradaily Patterns in Stock Re- turns," Journal of Financial Economics 16 (1986), pp. 99-117.
4. For this research, William O'Neil + Co. provided me with a specially formatted computer tape containing the information on NYSE and AMEX firms from the Datagraph books. This is the first time William O'Neil + Co. has made these pro- prietary data available for an academic study.
5. O'Neil personnel employed criteria other than just price appreciation to choose firms. However, such criteria are not explicitly stated. Based on the University of Chicago's CRSP tapes, there are 4,049 occurrences of a NYSE or AMEX firm doubling in value within a given calendar year during the 1970-83 period. For example, one additional criterion seemingly applied to stocks by O'Neil personnel is related to the price per share of a stock. In O'Neil's universe of 272 firms, fewer than 5 per cent sold at a price less than $10 a share. Of the list of 4,049 firms that doubled, if one eliminated those selling for less than $10, the number would dwindle to 1,311 companies. Giv- en the customer base subscribing to this publica- tion, such a price level screen is not all that surprising. Furthermore, it does not bias this analysis. At worst it might caution one against applying the findings from this research to stocks selling for less than $10.
6. These categories are strictly the author's and are not part of the O'Neil data.
7. Upon request, the author will provide similar
data for the banks, mutual funds and insurance companies.
8. See J.F. Jaffe, "Special Information and Insider Trading," Journal of Business 47 (1974), pp. 410- 428 and H. N. Seyhun, "Insiders' Profits, Costs of Trading, and Market Efficiency," Journal of Financial Economics, June 1986, pp. 189-212.
9. See Basu, "The Investment Performance of Com- mon Stocks," op. cit. and Reinganum, "Misspeci- fication of Capital Asset Pricing," op. cit.
10. See M. R. Reinganum, "The Anomalous Stock Market Behavior of Small Firms in January: Em- pirical Tests for Tax-Los Selling Effects," Journal of Financial Economics, June 1983, pp. 89-104.
11. Betas were calculated using ordinary-least- squares regressions and weekly returns during the two-year period prior to the buy date. The proxy for the market portfolio is a value-weight- ed index of all NYSE and AMEX companies.
12. One cannot rule out the possibility that O'Neil personnel implicitly (it is not stated in the publi- cation) applied some of these criteria to define a great winner. For example, given their institu- tional customers, it might make commercial sense for them to exclude most companies selling at a price less than $10 or whose market capital- izations are smaller than $20 million.
13. To the extent that the samples of 222 winners and other firms are correlated, some subtle biases may remain. Application of the trading strategies in other time periods should eliminate any re- maining biases.
14. See K.C. Chan and N-F. Chen, "Estimation Error of Stock Betas and The Role of Firm Size as an Instrumental Variable for Risk" (CRSP Working Paper No. 179, University of Chicago, 1986).
15. See Reinganum, "Anomalous Stock Market Be- havior," op. cit.
Guest Speaker footnotes, from page 12.
Footnotes 1. The Trust Universe Comparison
Service is a cooperative perform- ance comparison service operated by Wilshire Associates, Santa Mon- ica.
2. Funds Evaluation Report (New York: SEI Corporation, 1987).
3. New York Stock Exchange, 1986. 4. Trading costs include commissions,
market impact, market-maker spreads, clearing costs-the total
(but untraceable) difference be- tween what the buyer pays and what the seller receives.
5. Labor costs are also high because of errors and complications in the clearing process, but that is not the subject of this paper.
6. Remarks by Morton Klevan, Depu- ty Administrator, Office of Pension and Welfare Benefits, Department of Labor, at the Institutional Inves-
tor Conference, January 1987, New York.
7. R. Grinold and A. Rudd, "Incentive Fees: Who Wins? Who Loses?" Fi- nancial Analysts Journal, January/ February 1987.
8. The author wishes to thank Edward Story of Plexus Group and William Lupien and Tibor Fabian of Instinet Corporation for their many helpful comments and suggestions.
FINANCIAL ANALYSTS JOURNAL / MARCH-APRIL 1988 O 28
This content downloaded from 91.229.229.49 on Fri, 13 Jun 2014 20:02:10 PMAll use subject to JSTOR Terms and Conditions