the analysis on disparities of fertility rate of japanese ... · the analysis on disparities of...
TRANSCRIPT
The Analysis on Disparities of Fertility Rate of Japanese Municipalities
Hisakazu KatoMeiji University
Abstract
There are many disparities on fertility rate regarding the Japanese municipalities. In other words, while some municipalities have a high fertility rate, however, the fertility rate of others is very low. Disparity of fertility rate in municipalities is wider than in prefectures. In addition, as to the background of active discussion about vanishing rural regions in recent years, there is the fact that urban areas, including the Tokyo metropolitan area, have a low fertility rate, relatively. The purpose of this paper is to explore the factors underlying the regional disparity in the fertility rate and examine the relationship between the fertility rate and the population density.
Although there are many complicated factors of disparity of fertility rate by regions, it could be said that the low fertility rate in urban areas is occurring due to compatibility with child rearing and female labor supply, resources for child rearing, and housing space, etc. Direct cost of having children and the possibility of compatibility with child rearing and female labor supply are affected by the location of residence. We treat population density as a proxy variable of these factors. Until now, there have not been many theoretical studies which examine the relationship between fertility rate and population density, and few empirical studies exist with respect to Japan. Therefore, premising that the optimal number of children in rural areas is more than in urban areas from the conclusion of our model under certain conditions, we measured the relationship between them in municipalities in Japan. As for total fertility rate by municipalities, we used the Specified Report of Vital Statistics prepared by the Ministry of Health, Labour and Welfare, which adopts Bayesian estimation to obtain stable data for small regions.
Firstly, we examined whether population density or other socio - economic variables have affected the statistically significant effect on total fertility rate by municipalities using a sample of 1,890 which is from the above statistics. As a result, it was observed that municipalities with higher population density show a lower total fertility rate, and municipalities with a higher female labor participation rate have a higher total fertility rate. In addition, we obtained the result that a higher net immigration rate brought a higher fertility rate in municipalities. Furthermore, when we measured the relation between fertility rate and variables related to policies to improve low fertility such as capacity of day care centers or expenditure for child welfare using 1,742 samples for which data was available, we obtained positive coefficients that were statistically significant. It should be noted that it was difficult to explain the causal effect between them because we used cross - sectional data at one point
Policy Research Institute, Ministry of Finance, Japan, Public Policy Review, Vol.14, No.1, February 2018 1

in time.Next, we measured changes of total fertility rate from 2005 to 2010. To compare total
fertility rate in both years by municipalities, we should select municipalities whose administrative areas did not change during the period due to municipal mergers. Among 1,601 municipalities which satisfy the above criterion, total fertility rate has increased in 2010 compared to in 2005 at 1,187 municipalities; on the other hand, total fertility rate has decreased in 352 municipalities. Based on these data and municipalities, we regressed total fertility rate in 2010 on total fertility rate in 2005, and estimated the influence of population density to total fertility rate using panel data at two points in time. From these regression results, we obtained a negative coefficient of population density and positive coefficient of female labor participation rate in all cases. We also estimated how a rise in the population density affected the fertility rate by comparing municipalities whose fertility rate increased between 2005 and 2010 and those whose fertility rate did not rise. As a result, we discovered the fact that although the average total fertility rate in municipalities whose population density increased declined 0.091 points, the decline was 0.05 points if the average causal effect was taken into consideration.
Keywords: total fertility rate, population density, female labor participation rateJEL Classification: Classification: J13, J21
I. Introduction
There are many disparities on fertility rate regarding the Japanese municipalities. In other words, while some municipalities have a high fertility rate, however, the fertility rate of others is very low. For example, as for fertility rate of Japanese prefectures in 2015, Okinawa prefecture had the highest rate at 1.94; on the other hand, the fertility rate of Tokyo Metropolis was only 1.17, hence the difference between the two prefectures was 0.77. Furthermore, the disparities of fertility rate among municipalities were much larger than at the prefectural level. The purpose of this paper is to analyze and find the factors of these disparities of fertility rate, and to examine the relationship between fertility rate and population density.
Though we know there are many factors which affect fertility rate, in particular, the direct cost of fostering children and the possibility of compatibility of child care and the employment of married women are the most influential factors to determine fertility rate. For these two factors much depends on the residential area, and we can treat the variable of population density as a proxy variable of residential areas.
The remainder of this paper is organized as follows. In Section Two we show the hypothesis and factors about generating the disparity of fertility rate from the view of regional characteristics, and survey the related existing literature. Furthermore, we explain the model and hypothesis which we will apply for empirical analysis. In Section Three we try to explain the difference of fertility rate among 1,893 Japanese municipalities in 2010, and we put
2 H Kato / Public Policy Review
particular emphasis on the relation between fertility rate and population density. In addition, we consider the influence of performance of policies for low fertility such as nursery care maintenance to fertility rate of municipalities. In Section Four we try to find the factors of time series change between 2005 and 2010 for 1,601 municipalities. From the above empirical analysis, we conclude that there is a robust relationship that municipalities with high population density have a relatively low fertility rate. Though we should note that we cannot identify the causal relationship from our simple cross - section analysis, we hope that the results of this paper will be reference for future investigation about fertility analysis at the regional level.
II. The relation between fertility rate and population density
In this chapter, for explaining the background of empirical analysis below, we organized the situation of regional disparity of fertility rate and consider some factors which affect the difference of fertility rate.
II-1. The Disparity of fertility rate by region and the discussion about “Region Vanishing”
Total fertility rate in Japan decreased below 2.0 in 1975, and had reached 1.26 in 2005; this level was the lowest after the end of World War II. After that, the rate increased to 1.46 in 2015, however, the level was far below the rate which could maintain the current population.
There are large disparities of the demographic situation of birth and the level of total fertility rate by regions. In general, the birth rate in urban areas is lower than in local areas. Considering this fertility disparity by regions, there is the view that the migration of youth population from local areas to urban areas has induced lower fertility indirectly nationwide. Based on the report by The Japan Policy Council (2014), which is a private think tank, the discussion occurred about the relation between migrations of youth population to urban areas and the decreasing birth rate. That is, population movement of youth who contribute to fertility from relatively high birth areas to low birth areas, the Tokyo area (Tokyo Metropolitan District, Saitama, Chiba, and Kanagawa Prefecture) in particular, reduced fertility nationwide. In addition, decreased youth population by migration to urban areas was the main cause of decrease of a number of births, and this led to the difficulty of reproduction of population in local areas. The argument of “Region Vanishing” led by Masuda (2014) means that youth female population of 20 -39 years old in many local municipalities will be halved and that will create rapid population decrease, and there will be the possibility of the vanishing of those municipalities in the future. From the simulation results by The Japan Policy Council (2014), 896 municipalities are facing the vanishing risk at present. As the background to this argument of “Region Vanishing”, the fact is that the fertility rate in Tokyo area is extremely low. As for fertility rate in 2015, 1.17 in Tokyo Metropolitan District, is the lowest level of 47 prefectures, and 1.34 in Kanagawa and Saitama Prefecture, 1.35 in Chiba prefecture, and
Policy Research Institute, Ministry of Finance, Japan, Public Policy Review, Vol.14, No.1, February 2018 3
those levels were lower compared to other prefectures. What factors cause those disparities of regional fertility rate? To analyze the decrease of fertility, there would be two approaches. One is the discussion about connection with birth and marriage. In Japan, we have a strong connection with birth and marriage affected by traditional culture, so late marriage and the absence of marriage are the main causes of a low birth rate. It is clear that the proportion of spouses among youth affect birth behavior. For example, in Tokyo Metropolitan District, the unmarried rate of females in 25 -29 year old range was 68.3% in 2015, and this rate was highest among the prefectures. In addition, the rate was 64.7% in Kanagawa, 63.2% in Saitama, and 62.5% in Chiba Prefecture, and those were a high level compared to 61.3% in the average of all prefectures (according to “2015 Population Census” by Statistics Bureau, the Ministry of Internal Affairs and Communications). It is mentioned that this relatively high level of unmarred rate is the main cause of low fertility in Tokyo area. However, if the marriage situation would be the determinant, then we should analyze the factors that affect the unmarried situation, otherwise the problems are only replaced from low birth to late marriage.
Another approach is that the socio - economic factors determine the birth behavior. Those are, rise of cost of children, difficulty of compatibility with child rearing and labor supply of females, employment environment of youth such as unemployment or job status, and so on. Furthermore, related with employment environment and support for compatibility, the resources of child rearing such as supply of day care centers also affect birth behavior. Besides, the high land price in urban areas constrains the residential space of families, and this influences the decision of number of children that young parents will have in the future.
The purpose of this article is to explain and to analyze low fertility and the disparity in regions from the factors of socio - economic situations. Although there are complicated factors of disparity of regional fertility, we take the position that low fertility in urban areas is generated from problems of difficulty of compatibility with child rearing and labor supply of females, scarce nursery resources such as day care centers or kindergartens, and constraints of residential space, etc.
II-2. The relation between fertility rate and population density – Observation of prefecture level
There are various factors to influence fertility rate, and some of those, such as difficulty of compatibility with child rearing and labor supply or nursery resources in the region, are hard to measure as objective data. However, the population density would be the proxy variable of those factors. As we showed, many demographers claim that the change of marriage situations is a major factor of low fertility. Although it may be the important factor of determining the level of fertility rate, we consider that the decision of marriage and of having children is done simultaneously; that is, the decision of marriage includes the decision
4 H Kato / Public Policy Review
of having children, so marriage and birth behavior are inseparable from each other1. Therefore, it is essential to consider having children as socio - economic phenomenon.
From the view points above, the factors of low fertility are classified as follows. Firstly, rise of cost of having children. The direct cost of children such as food, clothing, education, and so on put pressure on having children. Secondly, deficiency of compatible environment between child rearing and work of young parents, in particular female workers, is a major factor to create a low birth rate. If there would be a deficiency of compatible environment, then that forces a young wife to choose working or having children, and this increases the opportunity cost of children. Thirdly, economic resources such as family income are important for having children. In particular, expectation in the future is a key factor to have children or not for a young family. As the relative income hypothesis explains, if young parents would expect a bright future, then they might have more children.
Fourthly, employment and conditions of the labor market are also important factors to affect fertility rate. If a young person does not have a stable status in the labor market, then there will be the possibility of them giving up having children. It should be noted that the change of values of marriage and having children affect the change of birth behavior, however, those are difficult to measure as empirical variables, so we will not treat those in this analysis.
Among the above factors affecting fertility rate, both a child’s direct cost and compatibility with child rearing and work are normally determined by the residential places. To clarify the disparity of fertility rate by regions, one should focus to analyze these factors. However, the concrete variables related to those factors are quite various and complicated, so much research has chosen variables of the factors by trial and error.
Population density is the proxy variable of the above two factors. Compared with urban and local areas, the labor force or capital is concentrated in urban areas, so urban areas have higher efficiency and productivity, and then those lead to higher incomes. These situations are identified as agglomeration economies or positive externality of economy. Hence, population density can be understood as the degree of agglomeration. On other hand, areas with higher population density have a higher land price or rent, and a higher cost of residence for young families. In addition, higher cost of land price constrains the spaces of residential areas, and this could constrain the number of children that a young family would have in the future.
Urban areas with high population density are disadvantageous for compatibility with child rearing and work for women. More concretely, high residential cost generates suburbanization of residence and long -distance commuting, and it is necessary to use land in urban areas more effectively. As a result, nursery resources or parks for children would have a shortage in urban areas. Related to that, as for commuting time, the median nationwide was
1 Matsuda, etc. (2015) stressed that marriage motivation by unmarried persons and desire for having children are determined simultaneous, and Kato (2016) discussed the same thing from the fact that there is little correlation between total fertility rate and the first child birth age in OECD countries.
Policy Research Institute, Ministry of Finance, Japan, Public Policy Review, Vol.14, No.1, February 2018 5
27.6 minutes, however, it was 44.9 minutes in Kanto Metropolitan area2. Furthermore, the ratio of head of household whose commuting time was over one hour was 14.7% on average, but 29.0% in Kanto Metropolitan area (according to “2013 Housing and Land Survey” by Statistics Bureau, the Ministry of Internal Affairs and Communications).
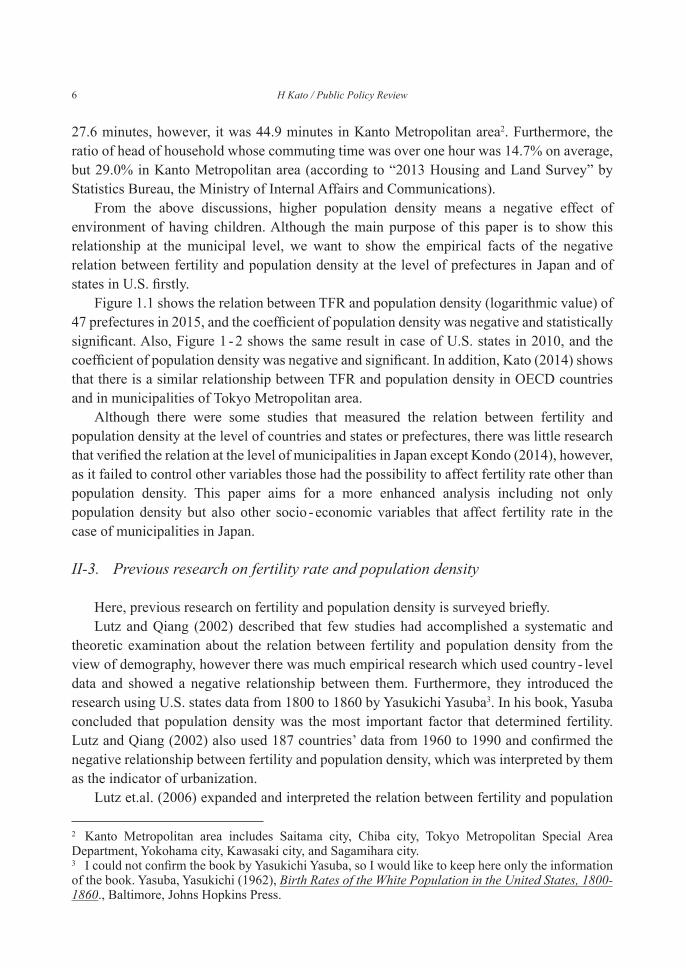
From the above discussions, higher population density means a negative effect of environment of having children. Although the main purpose of this paper is to show this relationship at the municipal level, we want to show the empirical facts of the negative relation between fertility and population density at the level of prefectures in Japan and of states in U.S. firstly.
Figure 1.1 shows the relation between TFR and population density (logarithmic value) of 47 prefectures in 2015, and the coefficient of population density was negative and statistically significant. Also, Figure 1 -2 shows the same result in case of U.S. states in 2010, and the coefficient of population density was negative and significant. In addition, Kato (2014) shows that there is a similar relationship between TFR and population density in OECD countries and in municipalities of Tokyo Metropolitan area.
Although there were some studies that measured the relation between fertility and population density at the level of countries and states or prefectures, there was little research that verified the relation at the level of municipalities in Japan except Kondo (2014), however, as it failed to control other variables those had the possibility to affect fertility rate other than population density. This paper aims for a more enhanced analysis including not only population density but also other socio - economic variables that affect fertility rate in the case of municipalities in Japan.
II-3. Previous research on fertility rate and population density
Here, previous research on fertility and population density is surveyed briefly.Lutz and Qiang (2002) described that few studies had accomplished a systematic and
theoretic examination about the relation between fertility and population density from the view of demography, however there was much empirical research which used country - level data and showed a negative relationship between them. Furthermore, they introduced the research using U.S. states data from 1800 to 1860 by Yasukichi Yasuba3. In his book, Yasuba concluded that population density was the most important factor that determined fertility. Lutz and Qiang (2002) also used 187 countries’ data from 1960 to 1990 and confirmed the negative relationship between fertility and population density, which was interpreted by them as the indicator of urbanization.
Lutz et.al. (2006) expanded and interpreted the relation between fertility and population
2 Kanto Metropolitan area includes Saitama city, Chiba city, Tokyo Metropolitan Special Area Department, Yokohama city, Kawasaki city, and Sagamihara city.3 I could not confirm the book by Yasukichi Yasuba, so I would like to keep here only the information of the book. Yasuba, Yasukichi (1962), Birth Rates of the White Population in the United States, 1800-1860., Baltimore, Johns Hopkins Press.
6 H Kato / Public Policy Review
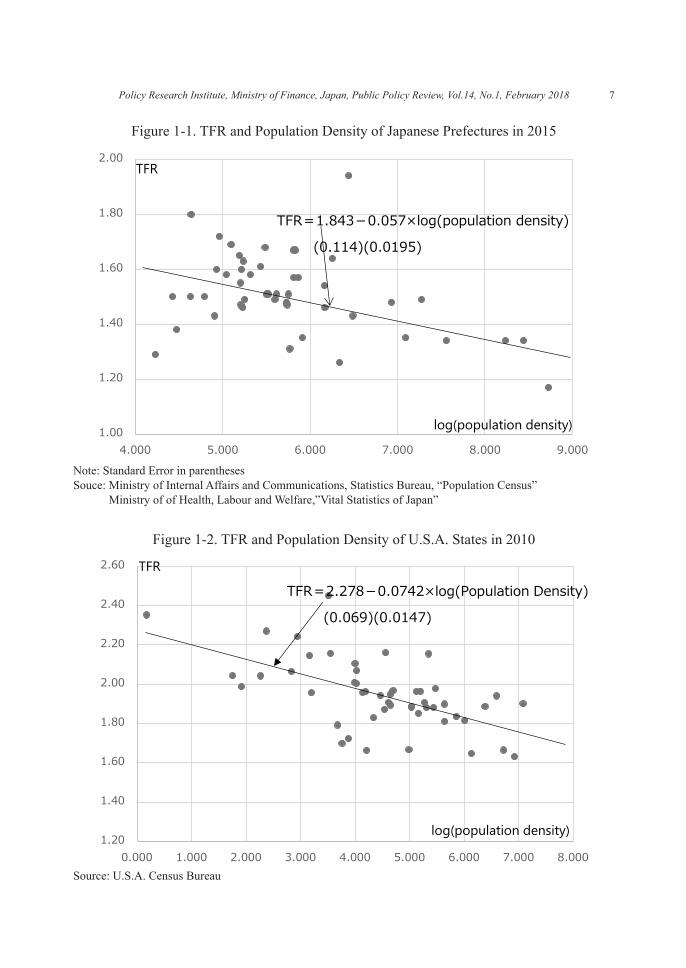
Figure 1-1. TFR and Population Density of Japanese Prefectures in 2015
= - ×
TFR
log(population density)
Note: Standard Error in parenthesesSouce: Ministry of Internal Affairs and Communications, Statistics Bureau, “Population Census”
Ministry of of Health, Labour and Welfare,”Vital Statistics of Japan”
Figure 1-2. TFR and Population Density of U.S.A. States in 2010
= - ×TFR
log(population density)
Source: U.S.A. Census Bureau
Policy Research Institute, Ministry of Finance, Japan, Public Policy Review, Vol.14, No.1, February 2018 7
density from humankind to general animals, and described that the relation between population density and rate of population increase was the core concept of population biology. In addition, Lutz et.al. (2006) returned to research of humankind, using the average value of panel data of 145 countries including developing countries for every 5 years from 1960 to 2000, and they reported the statistically significant negative relation between fertility and population density.
Sato (2007) tried to verify the relation between fertility and population movement introducing the agglomeration economy and congestion phenomenon in urban areas using an over-generation model of two periods. In his paper, he gave a theoretical interpretation that the agglomeration economy had influence to birth rate from both an income and substitute effect; the former had a positive effect and the latter had a negative effect. He also estimated the negative relationship between fertility and population density considering the effect from the agglomeration economy using data from 47 Japanese prefectures in 2000. Furthermore, Ishida et.al. (2015) explained the relation between fertility and population density theoretically using an overlapping generational model.
Croix and Gobbi (2016) investigated the relation between fertility and population density back to Malthus’s population theory, and they described that agricultural income in areas of high population density was low and the people who inhabited that area often delayed marriage as a result, and they discussed that this brought the negative relation between fertility and population density. From the modern view, income is higher in areas that exit the agglomeration economy and birth rate is lower in high income areas, so that a negative relation is observed between fertility and income. In addition, they discussed that the people who had a relatively weak preference for children would inhabit urban areas, conversely, the people who had a relatively strong preference for children would inhabit rural areas, so this tendency brought the negative relation between fertility and population density. That is, they concluded that population density was not only a determinant of fertility, but it affected the place where people would live.
In addition to the above studies, population density was often used as a proxy variable of urbanization and it was one of the major determinants of regional disparity of fertility (referred by Lutz and Qiang (2002)). However, the studies that use population density as an indicator of the cost of children or environment of female labor supply are limited at present. From these points of view, this paper has an original perspective such as treating population density as an indicator of the cost of having children, or estimating data at the municipal level, not the country or prefectural level.
II-4. Model connected population density with fertility
As for the relation between fertility and population density, although there are many empirical studies that treat population density as a proxy variable of urbanization, there are few studies that discuss the relation between fertility and population density from a theoretical view.
8 H Kato / Public Policy Review
The following model is modified for making it suitable to the purpose of this paper from the model of Croix and Gobbi (2016). We assume that an individual obtains utility from consumption and children. For simplicity, we consider only quantity of children, not quality of children. In addition, income is spent for consumption of general goods and cost of children, then, the optimal problem for a rational individual is shown as;
max u=ln c+γ ln(n) (1)s.t. y=c+δn
In the above problem, c is consumption per capita, n is quantity of children, y is income per capita, γ measures preference to children, and δ is rearing cost for one child. δ is able to express as a function of per capita income and population density. That is,
δ=λpαy. (2)
It is considered that the area which has a high population density p shows a high land price, and, hence, the cost of supply of child rearing resources or cost of inhabitation (housing rent or living space) is high compared to a low population density area. λ means the parameter which connects between population density and income or rearing cost of children, and this parameter is constant in all areas.
Compare the cost of rearing children at two areas of U and R, U means urban area and R
means rural area, from equation (2), we get
9
It is considered that the area which has a high population density p shows a high land price,
and, hence, the cost of supply of child rearing resources or cost of inhabitation (housing rent
or living space) is high compared to a low population density area. means the parameter
which connects between population density and income or rearing cost of children, and this
parameter is constant in all areas.
Compare the cost of rearing children at two areas of U and R, U means urban area and R
means rural area, from equation (2), we get R
U
R
U
R
U
yy
pp
. If we assume 1
R
U
pp
, then
R
U
R
U
yy
is derived.
Next, solving the simple static optimal problem described equation (1), the solution
for demand for quantity of children is,
yn)1(
*
. (3)
The demand for quantity of children in urban areas is Un , and in rural areas is Rn , then we
can obtain the next relation from comparing them.
U
U
R
RUR
yynn
1
**
Furthermore, R
U
R
U
yy
is satisfied, so we can conclude
**UR nn . (4)
From the above logical development, the claim that optimal demand for quantity
of children in rural areas is more than in urban areas is confirmed. Hence, an individual who
lives in a high population density area has lower demand for children, so we can introduce
the negative relation between fertility and population density, which has been discussed
above.
Ⅲ.The analysis of total fertility rate at municipalities
In this chapter, we verify the determinants of total fertility rate including population density
at Japan’s municipalities in recent years. Firstly, data using in this analysis are explained and
If we assume
9
It is considered that the area which has a high population density p shows a high land price,
and, hence, the cost of supply of child rearing resources or cost of inhabitation (housing rent
or living space) is high compared to a low population density area. means the parameter
which connects between population density and income or rearing cost of children, and this
parameter is constant in all areas.
Compare the cost of rearing children at two areas of U and R, U means urban area and R
means rural area, from equation (2), we get R
U
R
U
R
U
yy
pp
. If we assume 1
R
U
pp
, then
R
U
R
U
yy
is derived.
Next, solving the simple static optimal problem described equation (1), the solution
for demand for quantity of children is,
yn)1(
*
. (3)
The demand for quantity of children in urban areas is Un , and in rural areas is Rn , then we
can obtain the next relation from comparing them.
U
U
R
RUR
yynn
1
**
Furthermore, R
U
R
U
yy
is satisfied, so we can conclude
**UR nn . (4)
From the above logical development, the claim that optimal demand for quantity
of children in rural areas is more than in urban areas is confirmed. Hence, an individual who
lives in a high population density area has lower demand for children, so we can introduce
the negative relation between fertility and population density, which has been discussed
above.
Ⅲ.The analysis of total fertility rate at municipalities
In this chapter, we verify the determinants of total fertility rate including population density
at Japan’s municipalities in recent years. Firstly, data using in this analysis are explained and
>1, then
9
It is considered that the area which has a high population density p shows a high land price,
and, hence, the cost of supply of child rearing resources or cost of inhabitation (housing rent
or living space) is high compared to a low population density area. means the parameter
which connects between population density and income or rearing cost of children, and this
parameter is constant in all areas.
Compare the cost of rearing children at two areas of U and R, U means urban area and R
means rural area, from equation (2), we get R
U
R
U
R
U
yy
pp
. If we assume 1
R
U
pp
, then
R
U
R
U
yy
is derived.
Next, solving the simple static optimal problem described equation (1), the solution
for demand for quantity of children is,
yn)1(
*
. (3)
The demand for quantity of children in urban areas is Un , and in rural areas is Rn , then we
can obtain the next relation from comparing them.
U
U
R
RUR
yynn
1
**
Furthermore, R
U
R
U
yy
is satisfied, so we can conclude
**UR nn . (4)
From the above logical development, the claim that optimal demand for quantity
of children in rural areas is more than in urban areas is confirmed. Hence, an individual who
lives in a high population density area has lower demand for children, so we can introduce
the negative relation between fertility and population density, which has been discussed
above.
Ⅲ.The analysis of total fertility rate at municipalities
In this chapter, we verify the determinants of total fertility rate including population density
at Japan’s municipalities in recent years. Firstly, data using in this analysis are explained and
is derived.
Next, solving the simple static optimal problem described equation (1), the solution for demand for quantity of children is,
9
It is considered that the area which has a high population density p shows a high land price,
and, hence, the cost of supply of child rearing resources or cost of inhabitation (housing rent
or living space) is high compared to a low population density area. means the parameter
which connects between population density and income or rearing cost of children, and this
parameter is constant in all areas.
Compare the cost of rearing children at two areas of U and R, U means urban area and R
means rural area, from equation (2), we get R
U
R
U
R
U
yy
pp
. If we assume 1
R
U
pp
, then
R
U
R
U
yy
is derived.
Next, solving the simple static optimal problem described equation (1), the solution
for demand for quantity of children is,
yn)1(
*
. (3)
The demand for quantity of children in urban areas is Un , and in rural areas is Rn , then we
can obtain the next relation from comparing them.
U
U
R
RUR
yynn
1
**
Furthermore, R
U
R
U
yy
is satisfied, so we can conclude
**UR nn . (4)
From the above logical development, the claim that optimal demand for quantity
of children in rural areas is more than in urban areas is confirmed. Hence, an individual who
lives in a high population density area has lower demand for children, so we can introduce
the negative relation between fertility and population density, which has been discussed
above.
Ⅲ.The analysis of total fertility rate at municipalities
In this chapter, we verify the determinants of total fertility rate including population density
at Japan’s municipalities in recent years. Firstly, data using in this analysis are explained and
(3)
The demand for quantity of children in urban areas is nU , and in rural areas is nR , then we can obtain the next relation from comparing them.
9
It is considered that the area which has a high population density p shows a high land price,
and, hence, the cost of supply of child rearing resources or cost of inhabitation (housing rent
or living space) is high compared to a low population density area. means the parameter
which connects between population density and income or rearing cost of children, and this
parameter is constant in all areas.
Compare the cost of rearing children at two areas of U and R, U means urban area and R
means rural area, from equation (2), we get R
U
R
U
R
U
yy
pp
. If we assume 1
R
U
pp
, then
R
U
R
U
yy
is derived.
Next, solving the simple static optimal problem described equation (1), the solution
for demand for quantity of children is,
yn)1(
*
. (3)
The demand for quantity of children in urban areas is Un , and in rural areas is Rn , then we
can obtain the next relation from comparing them.
U
U
R
RUR
yynn
1
**
Furthermore, R
U
R
U
yy
is satisfied, so we can conclude
**UR nn . (4)
From the above logical development, the claim that optimal demand for quantity
of children in rural areas is more than in urban areas is confirmed. Hence, an individual who
lives in a high population density area has lower demand for children, so we can introduce
the negative relation between fertility and population density, which has been discussed
above.
Ⅲ.The analysis of total fertility rate at municipalities
In this chapter, we verify the determinants of total fertility rate including population density
at Japan’s municipalities in recent years. Firstly, data using in this analysis are explained and
Furthermore,
9
It is considered that the area which has a high population density p shows a high land price,
and, hence, the cost of supply of child rearing resources or cost of inhabitation (housing rent
or living space) is high compared to a low population density area. means the parameter
which connects between population density and income or rearing cost of children, and this
parameter is constant in all areas.
Compare the cost of rearing children at two areas of U and R, U means urban area and R
means rural area, from equation (2), we get R
U
R
U
R
U
yy
pp
. If we assume 1
R
U
pp
, then
R
U
R
U
yy
is derived.
Next, solving the simple static optimal problem described equation (1), the solution
for demand for quantity of children is,
yn)1(
*
. (3)
The demand for quantity of children in urban areas is Un , and in rural areas is Rn , then we
can obtain the next relation from comparing them.
U
U
R
RUR
yynn
1
**
Furthermore, R
U
R
U
yy
is satisfied, so we can conclude
**UR nn . (4)
From the above logical development, the claim that optimal demand for quantity
of children in rural areas is more than in urban areas is confirmed. Hence, an individual who
lives in a high population density area has lower demand for children, so we can introduce
the negative relation between fertility and population density, which has been discussed
above.
Ⅲ.The analysis of total fertility rate at municipalities
In this chapter, we verify the determinants of total fertility rate including population density
at Japan’s municipalities in recent years. Firstly, data using in this analysis are explained and
is satisfied, so we can conclude
9
It is considered that the area which has a high population density p shows a high land price,
and, hence, the cost of supply of child rearing resources or cost of inhabitation (housing rent
or living space) is high compared to a low population density area. means the parameter
which connects between population density and income or rearing cost of children, and this
parameter is constant in all areas.
Compare the cost of rearing children at two areas of U and R, U means urban area and R
means rural area, from equation (2), we get R
U
R
U
R
U
yy
pp
. If we assume 1
R
U
pp
, then
R
U
R
U
yy
is derived.
Next, solving the simple static optimal problem described equation (1), the solution
for demand for quantity of children is,
yn)1(
*
. (3)
The demand for quantity of children in urban areas is Un , and in rural areas is Rn , then we
can obtain the next relation from comparing them.
U
U
R
RUR
yynn
1
**
Furthermore, R
U
R
U
yy
is satisfied, so we can conclude
**UR nn . (4)
From the above logical development, the claim that optimal demand for quantity
of children in rural areas is more than in urban areas is confirmed. Hence, an individual who
lives in a high population density area has lower demand for children, so we can introduce
the negative relation between fertility and population density, which has been discussed
above.
Ⅲ.The analysis of total fertility rate at municipalities
In this chapter, we verify the determinants of total fertility rate including population density
at Japan’s municipalities in recent years. Firstly, data using in this analysis are explained and
(4)
Policy Research Institute, Ministry of Finance, Japan, Public Policy Review, Vol.14, No.1, February 2018 9
From the above logical development, the claim that optimal demand for quantity of children in rural areas is more than in urban areas is confirmed. Hence, an individual who lives in a high population density area has lower demand for children, so we can introduce the negative relation between fertility and population density, which has been discussed above.
III. The analysis of total fertility rate at municipalities
In this chapter, we verify the determinants of total fertility rate including population density at Japan’s municipalities in recent years. Firstly, data using in this analysis are explained and distribution of fertility rate at municipalities is shown. Next, the determinants of fertility of each municipality are analyzed.
III-1. Availability of fertility rate data and Bayes estimation.
As for total fertility rate by municipality in Japan, the Ministry of Health, Labour and Welfare publishes an estimated value in “Vital Statistics in JAPAN, Special Report, Statistics by Public Health Center / Municipality”. As a definition, total fertility rate is calculated as the sum of female birth rate of those aged from 15 -49 years old. In general, it is said to be difficult to calculate total fertility rate in small regions, because the probability of occurrence of events such as birth are unstable as region size becomes smaller. Hence, the above Special Report of Vital Statistics adopts a unique estimation. Firstly, the female birth rate by 5 -year age groups from 15 -49 years old in each municipality over a period of 5 years including Population Census year is estimated by the Bayesian method, and an estimated total fertility rate is obtained by the above summation results multiplied by five. In this analysis, we use total fertility data from 2008 to 2012. Number of population of female of every aged group data is based on the calculation of birth rate is from “2010 Population Census” by Statistics Bureau, the Ministry of Internal Affairs and Communications”.
Because the birth rate in a small region is unstable as explained above, in order to obtain stable data of total fertility rate, the Special Report of Vital Statistics adopts the Bayesian estimation4. The overview of method of estimation by the Special Report of Vital Statistics is as follows;
1) Collect data of number of births and population by 5 -year age groups of females in every municipality, and calculate the average birth rate of 5 years. Also, calculate number of births and population by 5 -year age groups of females in the prefecture that the municipality belongs to.
2) Using the female population by 5 -year age groups in every municipality as a weight, we obtain the weighted mean value and variance of birth rate by 5 -year age groups of females in the prefecture that the municipality belongs to. From this value of average
4 For details, see Fujita (2015).
10 H Kato / Public Policy Review
birth rate of the prefecture, the estimated value of total fertility rate in the prefecture is able to be obtained by multiplying the above birth rate by 5.
3) Using this weighted mean value of birth rate in the prefecture from 2), we can calculate the estimated total fertility rate by the Bayesian method. Assuming that the birth rate by 5 -year age groups that is calculated above is followed in the Beta distribution, we can obtain parameters of Beta distribution from a weighted average and variance of birth rate in the prefecture. If these parameters are α and β, then Beta distribution is described as Be(α,β), and expected value is α/(α+β ). This is the prior distribution of Bayesian estimation.
4) Lastly, from the concept of Bayesian update, using the birth rate (r) and population (n) by 5 -year age groups in every municipality that are derived from 1), estimated birth rate (b) by the Bayesian method can be calculated as;
11
),( Be , and expected value is )/( . This is the prior distribution of Bayesian
estimation.
4) Lastly, from the concept of Bayesian update, using the birth rate (r) and population (n) by
5-year age groups in every municipality that are derived from 1), estimated birth rate (b) by
the Bayesian method can be calculated as;
nrb
, (5)
and we can obtain the estimation of total fertility rate of every municipality.
As seen below, we treat the estimated total fertility rate for 2008 to 2012 which is
calculated by the Bayesian method as total fertility rate for 2010.
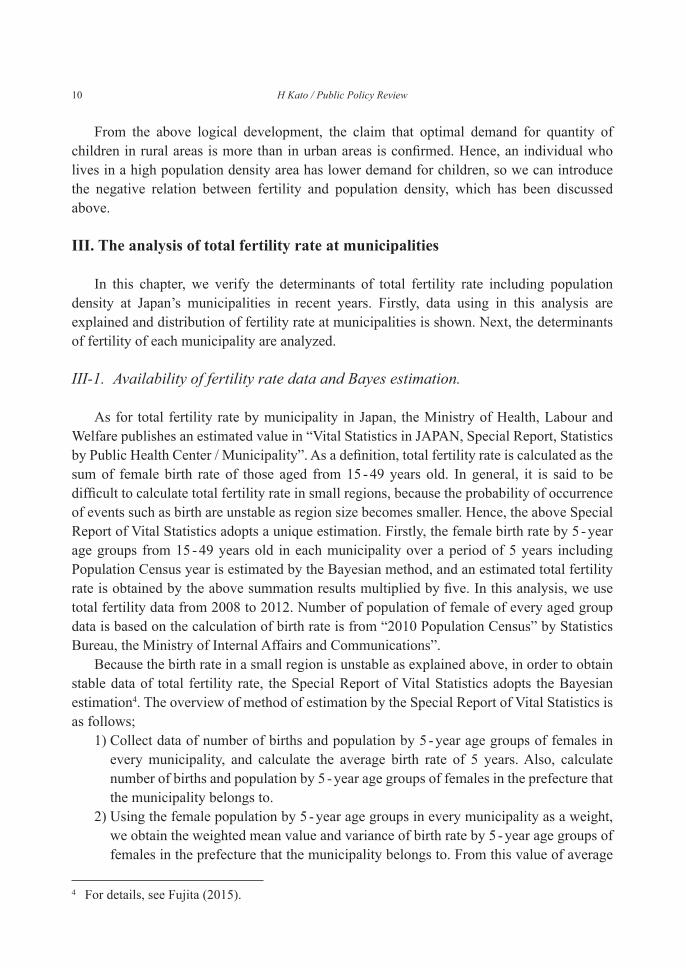
Ⅲ-2. Distribution of total fertility rate by municipality
Figure 2 shows the distribution of total fertility rate of 1,893 municipalities (including 23
wards of the Tokyo Metropolitan Ward and separate administrative districts in
ordinance-designated cities5) in 2010 from the Special Report of Vital Statistics which is
already explained in the above section, and Table 1 shows their basic statistics.
The average of total fertility rate of municipalities in 2010 was 1.47. This value was
somewhat higher than the nationwide value of total fertility rate of 1.39. This difference was
caused from a low value of total fertility rate in urban areas, which have a relatively large
population compared to rural areas. The highest total fertility rate out of all 1,893
municipalities was 2.81 at Isen-cho in Kagoshima prefecture. The next was 2.31 at
Kumejima-cho in Okinawa prefecture, 2.27 at Miyakojima-shi in Okinawa prefecture, 2.20 at
Ginoza-son in Okinawa prefecture, and 2.18 at Tsushima-shi in Nagasaki prefecture and
Tokunosima-cho in Kagoshima prefecture. Fertility rate in municipalities which belongs to
islands of Kagoshima and Okinawa prefectures was relatively high. Furthermore, in
municipalities except the Kyushu region, Ritto-shi in Shiga prefecture had the highest fertility
rate which was 1.99, and the next highest fertility rate was 1.96 in Fukuchiyama-shi in Kyoto
prefecture and 1.94 in Ooi-cho in Fukui prefecture. Conversely, among the 1,893
municipalities, the lowest total fertility rate was 0.77 at Higashiyama Ward in Kyoto
prefecture. Following Higashiyama Ward, the lowest fertility rate was 0.81 at Toshima Ward
in Tokyo Metropolitan district, 0.82 in Toyono-shi in Osaka prefecture, and 0.85 at Nakano
Ward and Shinjuku Ward in Tokyo Metropolitan district, etc.
5 Sagamihara-city in Kanagawa prefecture, Okayama-city in Okayama prefecture, and Kumamoto-city in Kumamoto prefecture published only city-wide fertility rate.
(5)
and we can obtain the estimation of total fertility rate of every municipality.As seen below, we treat the estimated total fertility rate for 2008 to 2012 which is
calculated by the Bayesian method as total fertility rate for 2010.
III-2. Distribution of total fertility rate by municipality
Figure 2 shows the distribution of total fertility rate of 1,893 municipalities (including 23 wards of the Tokyo Metropolitan Ward and separate administrative districts in ordinance -
Figure 2. Distribution of TFR (Municipalities)
TFR
Number of Appearance
Source: Ministry of of Health, Labour and Welfare, “Vital Statistics of Japan, Statistics of Municipalities”
Policy Research Institute, Ministry of Finance, Japan, Public Policy Review, Vol.14, No.1, February 2018 11
designated cities5) in 2010 from the Special Report of Vital Statistics which is already explained in the above section, and Table 1 shows their basic statistics.
The average of total fertility rate of municipalities in 2010 was 1.47. This value was somewhat higher than the nationwide value of total fertility rate of 1.39. This difference was caused from a low value of total fertility rate in urban areas, which have a relatively large population compared to rural areas. The highest total fertility rate out of all 1,893 municipalities was 2.81 at Isen -cho in Kagoshima prefecture. The next was 2.31 at Kumejima-cho in Okinawa prefecture, 2.27 at Miyakojima- shi in Okinawa prefecture, 2.20 at Ginoza - son in Okinawa prefecture, and 2.18 at Tsushima- shi in Nagasaki prefecture and Tokunosima-cho in Kagoshima prefecture. Fertility rate in municipalities which belongs to islands of Kagoshima and Okinawa prefectures was relatively high. Furthermore, in municipalities except the Kyushu region, Ritto - shi in Shiga prefecture had the highest fertility rate which was 1.99, and the next highest fertility rate was 1.96 in Fukuchiyama- shi in Kyoto prefecture and 1.94 in Ooi - cho in Fukui prefecture. Conversely, among the 1,893 municipalities, the lowest total fertility rate was 0.77 at Higashiyama Ward in Kyoto prefecture. Following Higashiyama Ward, the lowest fertility rate was 0.81 at Toshima Ward in Tokyo Metropolitan district, 0.82 in Toyono - shi in Osaka prefecture, and 0.85 at Nakano Ward and Shinjuku Ward in Tokyo Metropolitan district, etc.
III-3. Factors that affect fertility rate
In this section, we analyze factors that affect fertility rate at municipalities.There were many studies that analyzed fertility rate using regional data, however, the
study which targeted municipality data was limited, such as Abe and Harada (2008), Miyamoto and Arawata (2013), or Kondo (2014) which was shown in the above section.
Abe and Harada (2008) analyzed fertility behavior targeting 3,234 municipalities and they obtained the results that income and wage of females in the region affected negatively to total fertility rate at the region, and rent also had a negative effect on the fertility rate. Miyamoto and Arawata (2013) verified the effect of income support to total fertility rate using municipality - level data. However, both studies did not consider the effect of population density to fertility rate. On the other hand, Kondo (2014) measured the correlation between
5 Sagamihara-city in Kanagawa prefecture, Okayama-city in Okayama prefecture, and Kumamoto-city in Kumamoto prefecture published only city-wide fertility rate.
Table 1. Basic Statistics of TFR Distribution (Municipalities)
Min.0.77 1.34 1.47 1.59 2.81 1.47 0.39 4.58 0.207
Note: Q1:the First Quartile, Q3: The Third Quartile, S.D.:Standard Deviation
12 H Kato / Public Policy Review
fertility rate and population density, but other determinants that might affect fertility rate are not considered at all. At the same time, there were many studies that analyzed fertility rate using prefecture - level data (mainly cross - sectional or panel data) and tried to verify the relationship of female employment and fertility rate.
Although the main purpose of this article is to examine the relation between fertility rate and population density, fertility rate is influenced by many social - economic factors, so control variables should be prepared. The three main variables will be introduced to this analysis.
Firstly, we verify the relationship between female employment and fertility rate. There are many empirical studies that claim a positive correlation between them using prefecture -level data (see Unayama(2009) and others). Interpreting this correlation, it would be said that if female workers could be in a better environment for employment conditions, then it could be considered that they could achieve availability of compatible environment between child rearing and work. However, some objections exist about it. One of such objections points out that a female worker at the primary sector of industry can obtain much help from other family members for child rearing, hence there is the possibility that the presence of primary sector of industry to total industry could be one of determinants of fertility. From this view, we should control the structure of industry of prefecture - level. In particular, there is the possibility that some municipalities specialize in the primary sector of industry, so we should consider the structure of industry in order in analyzing fertility rate.
Secondly, population move or migration might be an important factor for determining fertility rate. In general, population migration is commonly seen from twenties to thirties; the main cause of migration is finding employment or going on to higher education. Why there are many migrants into a specific municipality means that there are many firms or universities that draw young people to that municipality, therefore, there are many young persons who are now in the family - forming period in that municipality. However, we already pointed out that although many young people move to the Tokyo area, in particular the Tokyo Metropolitan District, the fertility rate there is relatively low compared to other prefectures. It should be verified whether such tendency is general or not.
Thirdly, variables with respect to improvement of child - rearing environment should be discussed. Since the beginning of the 1990’s, the Government has created various policies for raising the low fertility rate and improving the environment of child rearing such as providing day care centers, etc. Although the childcare environment has been improved by these policies, there are still many children on waiting lists for day care centers at many municipalities in urban areas. At any rate, it is important to verify that difference of the environment for childcare among municipalities that affects disparities of fertility rate.
Incidentally, as for the data set which is used in this analysis, we should note as follows. Child welfare expenses or number of children on waiting lists which are a proxy variable of an environment of childcare are not compiled at separate administrative districts in ordinance -designated cities, therefore we prepare two kinds of dataset; dataset1 that includes separate administrative districts in ordinance -designated cities, and dataset2 that treats ordinance -
Policy Research Institute, Ministry of Finance, Japan, Public Policy Review, Vol.14, No.1, February 2018 13
designated cities as one administrative area and excludes some municipalities with many missing values. A number sample of dataset1 is 1,893, and of dataset2 is 1,742. For this reason, in case of estimating the effect of an environment to fertility rate, dataset2 is available.
III-4. Estimation Results (1)- the effect of population density to total fertility rate
Is population density or other socio - economic variables that affect the fertility rate statistically significant? First of all, we should clarify this.
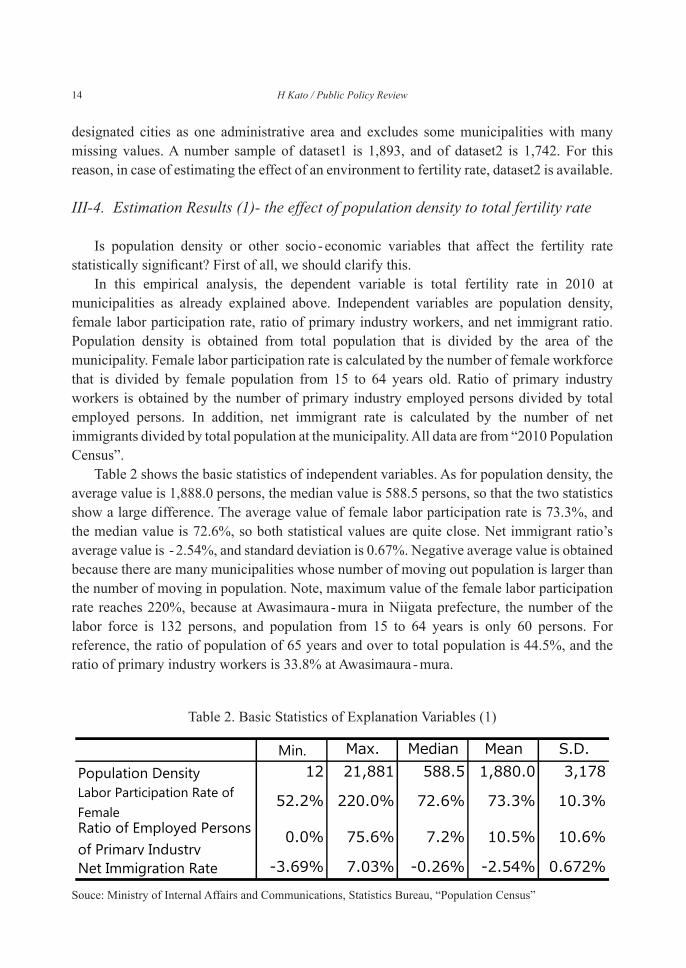
In this empirical analysis, the dependent variable is total fertility rate in 2010 at municipalities as already explained above. Independent variables are population density, female labor participation rate, ratio of primary industry workers, and net immigrant ratio. Population density is obtained from total population that is divided by the area of the municipality. Female labor participation rate is calculated by the number of female workforce that is divided by female population from 15 to 64 years old. Ratio of primary industry workers is obtained by the number of primary industry employed persons divided by total employed persons. In addition, net immigrant rate is calculated by the number of net immigrants divided by total population at the municipality. All data are from “2010 Population Census”.
Table 2 shows the basic statistics of independent variables. As for population density, the average value is 1,888.0 persons, the median value is 588.5 persons, so that the two statistics show a large difference. The average value of female labor participation rate is 73.3%, and the median value is 72.6%, so both statistical values are quite close. Net immigrant ratio’s average value is - 2.54%, and standard deviation is 0.67%. Negative average value is obtained because there are many municipalities whose number of moving out population is larger than the number of moving in population. Note, maximum value of the female labor participation rate reaches 220%, because at Awasimaura -mura in Niigata prefecture, the number of the labor force is 132 persons, and population from 15 to 64 years is only 60 persons. For reference, the ratio of population of 65 years and over to total population is 44.5%, and the ratio of primary industry workers is 33.8% at Awasimaura -mura.
Table 2. Basic Statistics of Explanation Variables (1)
Min.Population DensityLabor Participation Rate ofFemaleRatio of Employed Personsof Primary IndustryNet Immigration Rate
Souce: Ministry of Internal Affairs and Communications, Statistics Bureau, “Population Census”
14 H Kato / Public Policy Review
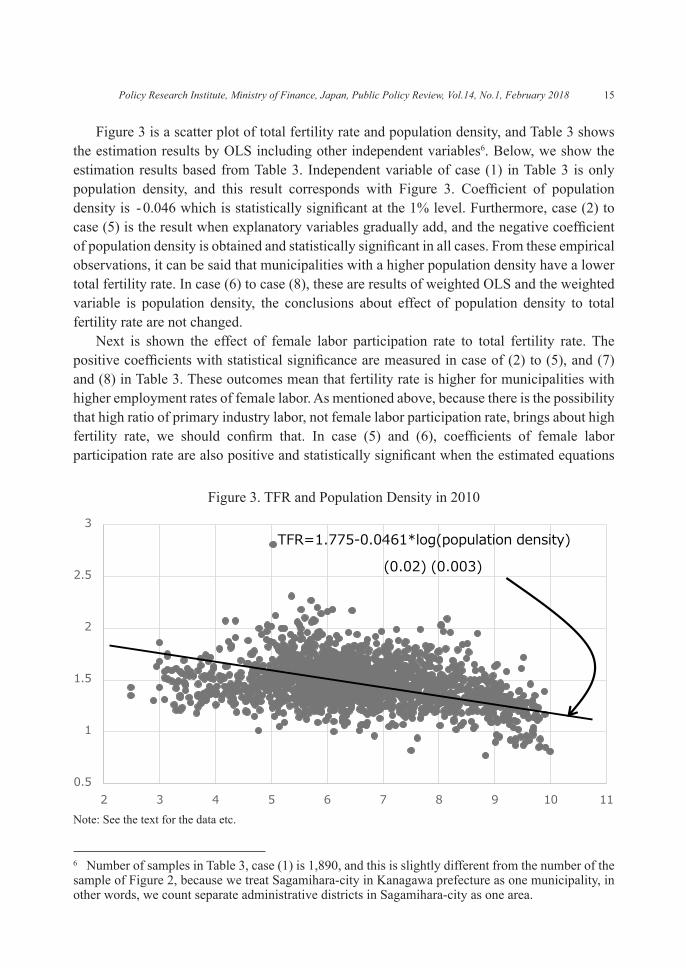
Figure 3 is a scatter plot of total fertility rate and population density, and Table 3 shows the estimation results by OLS including other independent variables6. Below, we show the estimation results based from Table 3. Independent variable of case (1) in Table 3 is only population density, and this result corresponds with Figure 3. Coefficient of population density is - 0.046 which is statistically significant at the 1% level. Furthermore, case (2) to case (5) is the result when explanatory variables gradually add, and the negative coefficient of population density is obtained and statistically significant in all cases. From these empirical observations, it can be said that municipalities with a higher population density have a lower total fertility rate. In case (6) to case (8), these are results of weighted OLS and the weighted variable is population density, the conclusions about effect of population density to total fertility rate are not changed.
Next is shown the effect of female labor participation rate to total fertility rate. The positive coefficients with statistical significance are measured in case of (2) to (5), and (7) and (8) in Table 3. These outcomes mean that fertility rate is higher for municipalities with higher employment rates of female labor. As mentioned above, because there is the possibility that high ratio of primary industry labor, not female labor participation rate, brings about high fertility rate, we should confirm that. In case (5) and (6), coefficients of female labor participation rate are also positive and statistically significant when the estimated equations
6 Number of samples in Table 3, case (1) is 1,890, and this is slightly different from the number of the sample of Figure 2, because we treat Sagamihara-city in Kanagawa prefecture as one municipality, in other words, we count separate administrative districts in Sagamihara-city as one area.
Figure 3. TFR and Population Density in 2010
Note: See the text for the data etc.
Policy Research Institute, Ministry of Finance, Japan, Public Policy Review, Vol.14, No.1, February 2018 15
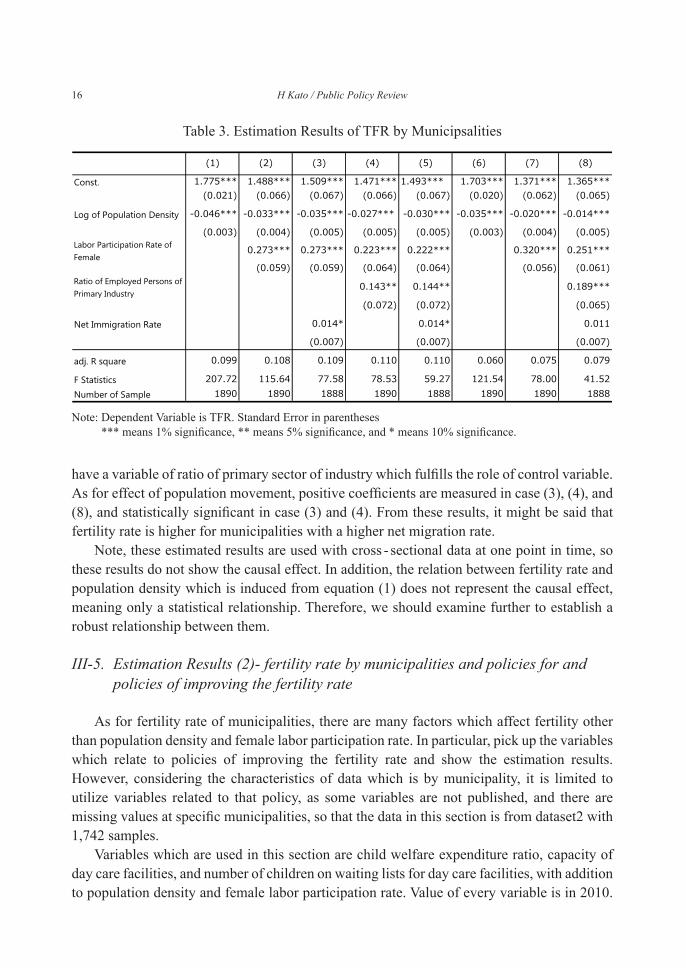
have a variable of ratio of primary sector of industry which fulfills the role of control variable. As for effect of population movement, positive coefficients are measured in case (3), (4), and (8), and statistically significant in case (3) and (4). From these results, it might be said that fertility rate is higher for municipalities with a higher net migration rate.
Note, these estimated results are used with cross - sectional data at one point in time, so these results do not show the causal effect. In addition, the relation between fertility rate and population density which is induced from equation (1) does not represent the causal effect, meaning only a statistical relationship. Therefore, we should examine further to establish a robust relationship between them.
III-5. Estimation Results (2)- fertility rate by municipalities and policies for and policies of improving the fertility rate
As for fertility rate of municipalities, there are many factors which affect fertility other than population density and female labor participation rate. In particular, pick up the variables which relate to policies of improving the fertility rate and show the estimation results. However, considering the characteristics of data which is by municipality, it is limited to utilize variables related to that policy, as some variables are not published, and there are missing values at specific municipalities, so that the data in this section is from dataset2 with 1,742 samples.
Variables which are used in this section are child welfare expenditure ratio, capacity of day care facilities, and number of children on waiting lists for day care facilities, with addition to population density and female labor participation rate. Value of every variable is in 2010.
Table 3. Estimation Results of TFR by Municipsalities
Const.
Log of Population Density
Labor Participation Rate ofFemale
Ratio of Employed Persons ofPrimary Industry
Net Immigration Rate
adj. R square
F StatisticsNumber of Sample
Note: Dependent Variable is TFR. Standard Error in parentheses *** means 1% significance, ** means 5% significance, and * means 10% significance.
16 H Kato / Public Policy Review
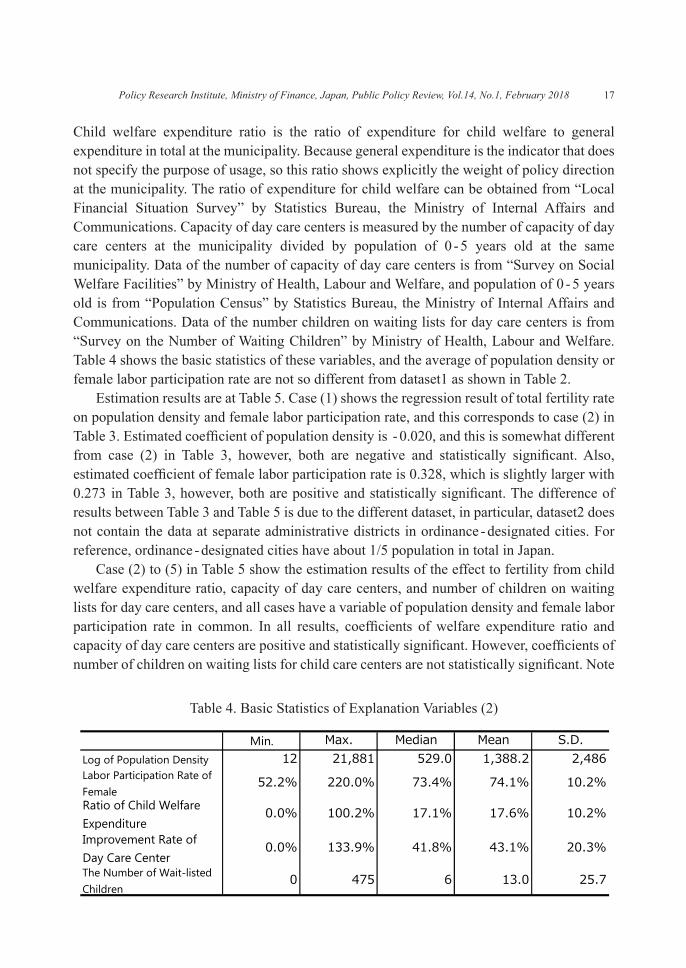
Child welfare expenditure ratio is the ratio of expenditure for child welfare to general expenditure in total at the municipality. Because general expenditure is the indicator that does not specify the purpose of usage, so this ratio shows explicitly the weight of policy direction at the municipality. The ratio of expenditure for child welfare can be obtained from “Local Financial Situation Survey” by Statistics Bureau, the Ministry of Internal Affairs and Communications. Capacity of day care centers is measured by the number of capacity of day care centers at the municipality divided by population of 0 -5 years old at the same municipality. Data of the number of capacity of day care centers is from “Survey on Social Welfare Facilities” by Ministry of Health, Labour and Welfare, and population of 0 -5 years old is from “Population Census” by Statistics Bureau, the Ministry of Internal Affairs and Communications. Data of the number children on waiting lists for day care centers is from “Survey on the Number of Waiting Children” by Ministry of Health, Labour and Welfare. Table 4 shows the basic statistics of these variables, and the average of population density or female labor participation rate are not so different from dataset1 as shown in Table 2.
Estimation results are at Table 5. Case (1) shows the regression result of total fertility rate on population density and female labor participation rate, and this corresponds to case (2) in Table 3. Estimated coefficient of population density is - 0.020, and this is somewhat different from case (2) in Table 3, however, both are negative and statistically significant. Also, estimated coefficient of female labor participation rate is 0.328, which is slightly larger with 0.273 in Table 3, however, both are positive and statistically significant. The difference of results between Table 3 and Table 5 is due to the different dataset, in particular, dataset2 does not contain the data at separate administrative districts in ordinance - designated cities. For reference, ordinance -designated cities have about 1/5 population in total in Japan.
Case (2) to (5) in Table 5 show the estimation results of the effect to fertility from child welfare expenditure ratio, capacity of day care centers, and number of children on waiting lists for day care centers, and all cases have a variable of population density and female labor participation rate in common. In all results, coefficients of welfare expenditure ratio and capacity of day care centers are positive and statistically significant. However, coefficients of number of children on waiting lists for child care centers are not statistically significant. Note
Table 4. Basic Statistics of Explanation Variables (2)
Min.Log of Population DensityLabor Participation Rate ofFemaleRatio of Child WelfareExpenditureImprovement Rate ofDay Care CenterThe Number of Wait-listedChildren
Policy Research Institute, Ministry of Finance, Japan, Public Policy Review, Vol.14, No.1, February 2018 17
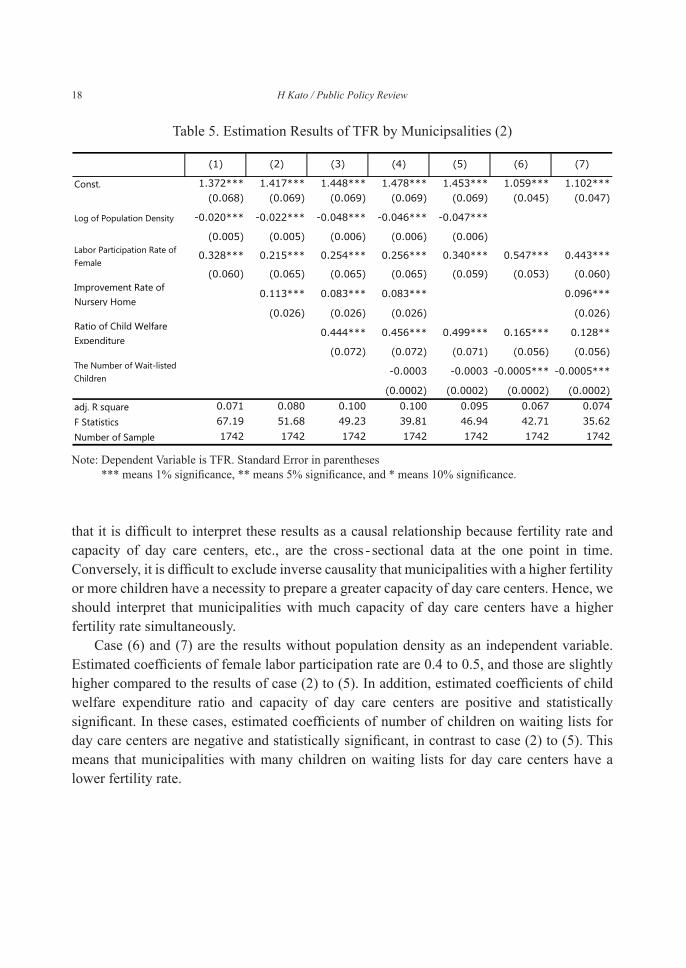
that it is difficult to interpret these results as a causal relationship because fertility rate and capacity of day care centers, etc., are the cross - sectional data at the one point in time. Conversely, it is difficult to exclude inverse causality that municipalities with a higher fertility or more children have a necessity to prepare a greater capacity of day care centers. Hence, we should interpret that municipalities with much capacity of day care centers have a higher fertility rate simultaneously.
Case (6) and (7) are the results without population density as an independent variable. Estimated coefficients of female labor participation rate are 0.4 to 0.5, and those are slightly higher compared to the results of case (2) to (5). In addition, estimated coefficients of child welfare expenditure ratio and capacity of day care centers are positive and statistically significant. In these cases, estimated coefficients of number of children on waiting lists for day care centers are negative and statistically significant, in contrast to case (2) to (5). This means that municipalities with many children on waiting lists for day care centers have a lower fertility rate.
Table 5. Estimation Results of TFR by Municipsalities (2)
Const.
Log of Population Density
Labor Participation Rate ofFemale
Improvement Rate ofNursery Home
Ratio of Child WelfareExpenditure
The Number of Wait-listedChildren
adj. R squareF StatisticsNumber of Sample
Note: Dependent Variable is TFR. Standard Error in parentheses *** means 1% significance, ** means 5% significance, and * means 10% significance.
18 H Kato / Public Policy Review
IV. Changes in total fertility rate between two points in time
Total fertility rate at municipalities in 2010 is lower with higher population density. However, this is from cross - sectional data at one point in time and we did not consider a factor with time series changes, so the results in the previous section should be interpreted as correlation facts. In this chapter, we examine changes in total fertility rate between 2005 and in 2010, and discuss the transition in the fertility rate with time.
IV-1. Data set and total fertility rate between two points in time
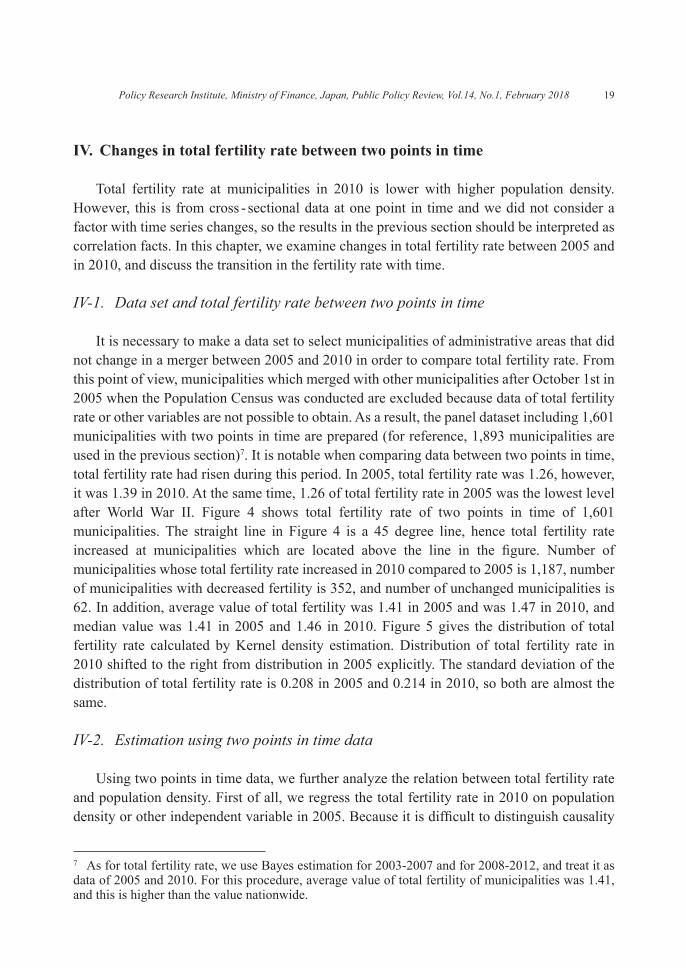
It is necessary to make a data set to select municipalities of administrative areas that did not change in a merger between 2005 and 2010 in order to compare total fertility rate. From this point of view, municipalities which merged with other municipalities after October 1st in 2005 when the Population Census was conducted are excluded because data of total fertility rate or other variables are not possible to obtain. As a result, the panel dataset including 1,601 municipalities with two points in time are prepared (for reference, 1,893 municipalities are used in the previous section)7. It is notable when comparing data between two points in time, total fertility rate had risen during this period. In 2005, total fertility rate was 1.26, however, it was 1.39 in 2010. At the same time, 1.26 of total fertility rate in 2005 was the lowest level after World War II. Figure 4 shows total fertility rate of two points in time of 1,601 municipalities. The straight line in Figure 4 is a 45 degree line, hence total fertility rate increased at municipalities which are located above the line in the figure. Number of municipalities whose total fertility rate increased in 2010 compared to 2005 is 1,187, number of municipalities with decreased fertility is 352, and number of unchanged municipalities is 62. In addition, average value of total fertility was 1.41 in 2005 and was 1.47 in 2010, and median value was 1.41 in 2005 and 1.46 in 2010. Figure 5 gives the distribution of total fertility rate calculated by Kernel density estimation. Distribution of total fertility rate in 2010 shifted to the right from distribution in 2005 explicitly. The standard deviation of the distribution of total fertility rate is 0.208 in 2005 and 0.214 in 2010, so both are almost the same.
IV-2. Estimation using two points in time data
Using two points in time data, we further analyze the relation between total fertility rate and population density. First of all, we regress the total fertility rate in 2010 on population density or other independent variable in 2005. Because it is difficult to distinguish causality
7 As for total fertility rate, we use Bayes estimation for 2003-2007 and for 2008-2012, and treat it as data of 2005 and 2010. For this procedure, average value of total fertility of municipalities was 1.41, and this is higher than the value nationwide.
Policy Research Institute, Ministry of Finance, Japan, Public Policy Review, Vol.14, No.1, February 2018 19
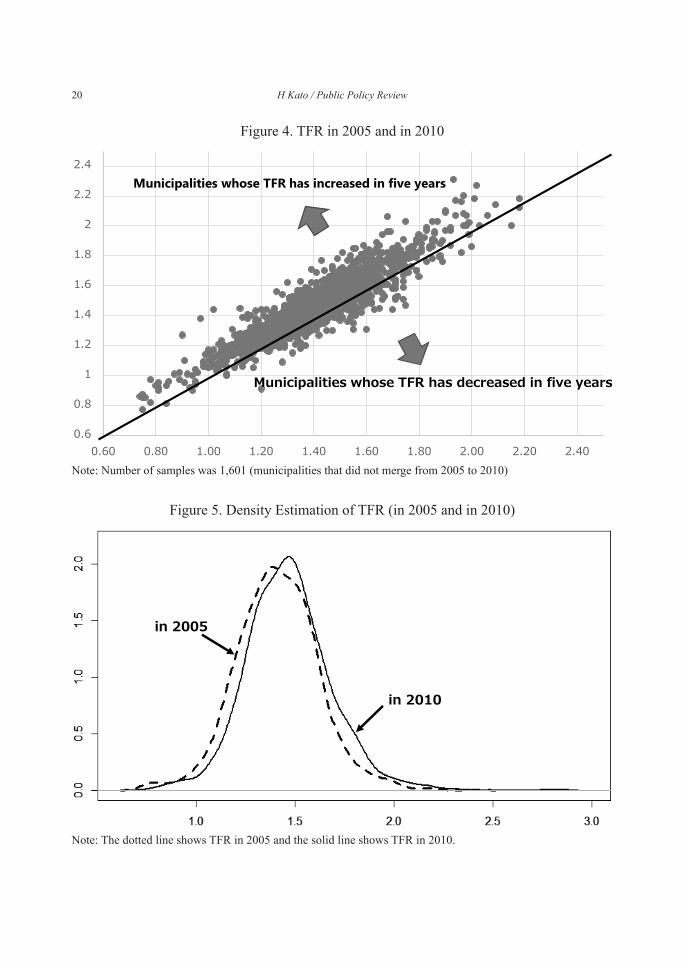
Figure 5. Density Estimation of TFR (in 2005 and in 2010)
Municipalities whose TFR has increased in five years
Note: The dotted line shows TFR in 2005 and the solid line shows TFR in 2010.
Figure 4. TFR in 2005 and in 2010
Municipalities whose TFR has increased in five years
Note: Number of samples was 1,601 (municipalities that did not merge from 2005 to 2010)
20 H Kato / Public Policy Review
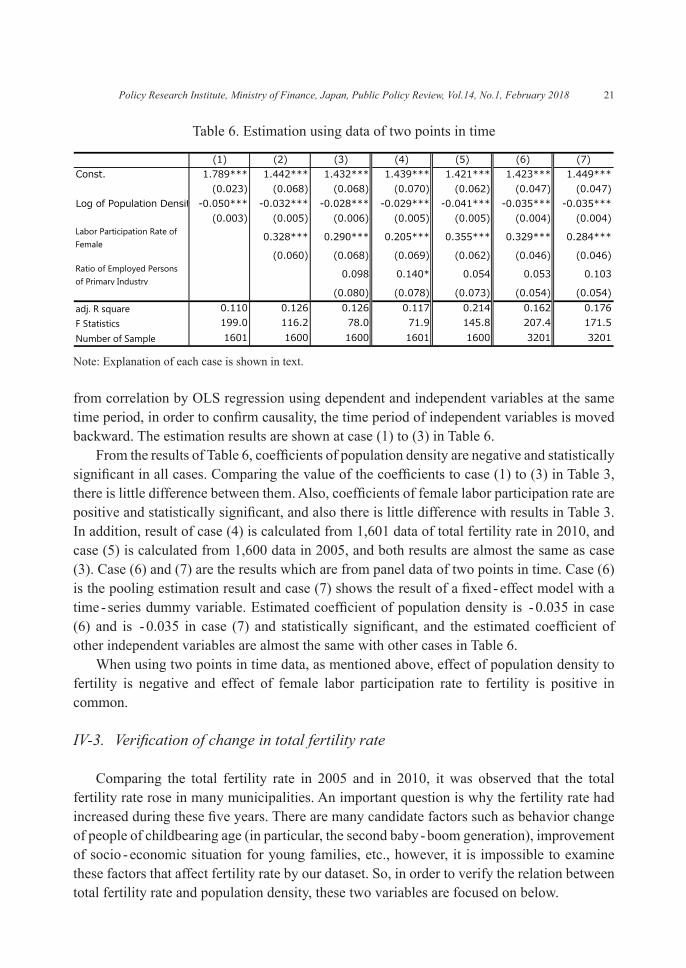
from correlation by OLS regression using dependent and independent variables at the same time period, in order to confirm causality, the time period of independent variables is moved backward. The estimation results are shown at case (1) to (3) in Table 6.
From the results of Table 6, coefficients of population density are negative and statistically significant in all cases. Comparing the value of the coefficients to case (1) to (3) in Table 3, there is little difference between them. Also, coefficients of female labor participation rate are positive and statistically significant, and also there is little difference with results in Table 3. In addition, result of case (4) is calculated from 1,601 data of total fertility rate in 2010, and case (5) is calculated from 1,600 data in 2005, and both results are almost the same as case (3). Case (6) and (7) are the results which are from panel data of two points in time. Case (6) is the pooling estimation result and case (7) shows the result of a fixed -effect model with a time - series dummy variable. Estimated coefficient of population density is - 0.035 in case (6) and is - 0.035 in case (7) and statistically significant, and the estimated coefficient of other independent variables are almost the same with other cases in Table 6.
When using two points in time data, as mentioned above, effect of population density to fertility is negative and effect of female labor participation rate to fertility is positive in common.
IV-3. Verificationofchangeintotalfertilityrate
Comparing the total fertility rate in 2005 and in 2010, it was observed that the total fertility rate rose in many municipalities. An important question is why the fertility rate had increased during these five years. There are many candidate factors such as behavior change of people of childbearing age (in particular, the second baby - boom generation), improvement of socio - economic situation for young families, etc., however, it is impossible to examine these factors that affect fertility rate by our dataset. So, in order to verify the relation between total fertility rate and population density, these two variables are focused on below.
Table 6. Estimation using data of two points in time
Labor Participation Rate ofFemale
Ratio of Employed Personsof Primary Industry
adj. R squareF StatisticsNumber of Sample
Note: Explanation of each case is shown in text.
Policy Research Institute, Ministry of Finance, Japan, Public Policy Review, Vol.14, No.1, February 2018 21
Equation (6) is the regression result using the first differenced variables. In this equation, TFR is total fertility rate, POPDEN is population density, ⊿ means time difference in the first order, and the figure in parenthesis is standard error of estimated coefficient.
ΔTFR=-0.0811×ΔPOPDEN(0.029) (6)
Coefficient of different value of population density is negative and statistically significant. From this, it might be said that municipalities where the population density is increasing tend to decrease their fertility rate.
Next, we want to confirm that an increase of population density makes fertility lower using a difference - in -differences method. Originally, the difference - in -differences method is used to measure the effect of policy by dividing two groups, one is targeted by the policy, and another is not targeted by the policy. In this, municipalities are divided into two groups; one has the experience of increase of population density, and another does not have such experience. Applying the difference - in -differences method, and using the two groups, we want to confirm whether an increase of population density makes fertility lower or not.
Equation (7) shows the estimation result using the difference - in -differences method. CD is a dummy variable of municipalities, and when population density increases at 2010, then this dummy variable takes one, otherwise takes zero. Furthermore, T is also a dummy variable, when the data is in 2010, T takes one, otherwise, T takes 0. The coefficient of interaction term of CD and T shows the average treatment effect.
TFR=1.438-0.091×CD+0.043×T+0.041×(CD×T ) (7)(0.006)(0.011) (0.008) (0.016)
From this result, although the total fertility rate of municipalities where population density increases from 2005 to 2010 decreases 0.091 points on average, the degree of decrease of total fertility rate stays at only 0.05 considering the average treatment effect. Because we divided municipalities into two groups by criterion of increase of population density or not, this is not a standard usage of the difference - in -differences method. Hence, please note that interpreting the result of equation (7) is slightly difficult. In addition, the parallel trends assumption and common shocks assumption are needed for the difference - in -differences method, and these assumptions should be noted. As for the parallel trends assumption, this means that when population density would not change, then the total fertility rate increases in the same way from 2005 to 2010 for all municipalities. Common shocks assumption means that factors that affect the total fertility rate except population density have the same effect in all municipalities. It has the possibility that the common shocks assumption could not hold in a real case because there are many factors that affect the total fertility rate. This might show the limit to the use of data of municipalities.
22 H Kato / Public Policy Review
V. Concluding Remarks
A quarter of a century has already passed since the 1.57 shock occurred in 1990, and the low- fertility problem has been recognized widely. What we can find by accumulation of studies until now is that low fertility has been occurring due to many and complicated factors within society, and it is not easy to solve the problem. On the other hand, as explained at the beginning of this paper, it could be said that excessive concentration of population in Tokyo area prompt low fertility as pointed out by The Japan Policy Council. As a result, a new point of view of the low fertility problem has been generated from analysis of population density. So, we try to confirm this view at the municipality level, and this becomes the purpose of this paper.
We made a dataset of municipalities in Japan in 2010, and measured the relation between total fertility rate and population density, and then we learned that municipalities with a higher population density recorded lower total fertility. This outcome was consistent with the hypothesis as explained above, and this hypothesis became one of the reasons that explained low fertility in high population density areas such as Tokyo Metropolitan area. In addition, we confirmed the recent discussion in which there is a positive relationship between female labor participation and fertility rate, and we could make clear that capacity of child care center or child welfare expenditure related with policies to improve low fertility was an appropriate and effective method. Furthermore, as for changes of total fertility rate from 2005 to 2010, we also confirmed that an increase of population density created a total fertility rate lower for municipalities from our dataset which contained municipalities which had no experience of merger after 2005.
We know there are many remaining problems. Firstly, cross - sectional data at one point in time are used mainly in this study, and the characteristics of such a dataset means that it is quite difficult to specify the causal relationship. Hence, we cannot point out that population density is one of causes of low fertility. Secondly, trying to analyze the changes of the total fertility rate between two points in time, however, it remains difficult to explain it because independent variables such as population density are not controlled. Thirdly, in order to confirm whether population density is an influential factor of low fertility or not, we need to use longer time series data. Fourthly, we could not implement the relation between population movement and total fertility rate explicitly into a model. As shown in the above section, we selected population movement as an independent variable, but we could not obtain a statistically significant result. Lastly, it is necessary to use more various and precise data related to policies to improve low fertility in the empirical model. Hereafter, it might be an idea to measure fertility of municipalities which is divided by two groups; one group spending more resources for child welfare, and another group not doing so.
The relationship between fertility rate and population density might have been discussed without empirical evidence. We hope that this paper contributes to such discussions from the point of view of the empirical aspect.
Policy Research Institute, Ministry of Finance, Japan, Public Policy Review, Vol.14, No.1, February 2018 23
References
Abe, K. and Y. Harada (2008), “Effects of Policies of Child Care Support on Birth Rate: Analysis of Municipalities”, Audit Study Research, Vol.38. (in Japanese)
Unayama, S. (2009), “Policies for Aging and Low Fertility and Female Labor Participation – From Prefectures Data”, RIETI Discussion Paper Series 10 - J004. (in Japanese)
Kato, H. (2016), Shock of 80 Million Society, Shoden - sha Sinsho, Shodensha. (in Japanese)Kondo, K. (2014), “Are Growth Strategy by Accumulation Economy and Recovery of Birth
Rate Contradict?” RIETI Special Report. (in Japanese)http://www.rieti.go.jp/jp/special/special_report/074.html
Japan Policy Council, Subcommittee of Study on Population Decline Issues (2014), “Stop Low Fertility and Vital Strategy of Rural Areas”,http://www.policycouncil.jp/pdf/prop03/prop03.pdf (in Japanese)
Fujita, K. and Forward Network (2015), Find Out What We Cannot See - It Is Bayes, Ohmsha. (in Japanese)
Matsuda, S., N. Sasaki, S. Takamura, A. Osawa, S. Onoda, M. Fujisawa, H. Uemura, and A. Ishida (2015), “Low Fertility and Analysis of Life Environment of Unmarried Women”, ESRI Discussion Paper Series, No.323. (in Japanese)
Masuda, H. (2014), Vanishing Rural Japan, Chuko -Sinsho, Chuo -Koron Shinsha. (in Japanese)
Miyamoto, Y. and R. Arawata (2013), “Comparison of Effects of Income and Non Income Support on Birth Rate”, Japan Economic Research, Vol.68. (in Japanese)
Croix, D. and P. Gobbi (2016), “Population Density, Fertility, and Demographic Convergence in Developing Countries”, IRES Discussion Papers, No.3, Université Catholique de Louvain.
Ishida, R, K. Oguro, and M. Yasuoka (2015), “Population Density, Fertility, and Childcare Services from the Perspective of a Two -Region Overlapping Generations Model”, RIETI Discussion Paper Series 15 -E-093.
Kato, H. (2014).”Declining Population and the Revitalization of Local Regions in Japan”, Meiji Journal of Political Science and Economics, Vol.3.
Lutz, W. and R. Qiang (2002), “Determinants of human population growth”, Philosophical Transactions of the Royal Society B, Vol.357.
Lutz, W., M. Testa, and D. Penn (2006), “Population Density is a Key Factor in Declining Human Fertility”, Population Environment, Vol.28.
Sato, Y. (2007), “Economic Geography, Fertility and Migration”, Journal of Urban Economics Vol. 61
24 H Kato / Public Policy Review