the analysis of mammalian tissue into lipid and lipid-free fractions using x and gamma radiation
TRANSCRIPT
IEEE Tuznaction on NuCteoAv Science, Vo1.NS-23, No.1, Feb'uaty 1976
THIE ANALYSIS OF MAMMALIAN TISSUE INTO LIPID AND LIPID-FREE
FRACTIONS USING X AND GAMMA RADIATION
L. E. Preuss, F. P. Bolin, C. K. BugenisDepartment of Physics & Biophysics
Edsel B. Ford Institute for Medical ResearchDetroit, Michigan 48202
SUMMARY
The fat and fat-free (muscle) constituents ofsoft tissue have mass absorption coefficients whichare sufficiently separated in the 10-100 keV rangeas to allow the relative proportions of each of thesecomponents to be non-destructively determined byphoton absorptiometry. The use of a dual photonbeam eliminates variations due to sample densityand thickness, thus making the method suitable forin vivo as well as in vitro work.
THEORY
The basis for this study is the simple expon-ential absorption law:
ln (I I) = A p x (1)
where I and I are, respectively, the incident andtransmiRted intensities of a monochromatic beam,p the density, x the sample thickness, and A thetotal mass absorption coefficient of the sample. Byusing beams of two diffeient energies, the followingratio can be established:
grative scanning technique to ascertain the averageproportions of fat and lean in the sample. The scan-ning method we have employed require that data beaccumulated at a number of points separated by dis-crete spatial intervals. The R value is then calcu-lated as follows:
ln (Iol/Il) i
(6)R =
Iln (I02/I2) i
The numbers 1 and 2 refer to the two different energybeams while the subscript i refers to the individualdata points. A second method for calculating the Rvalue involves plotting the data points, measuring thetwo areas, and dividing to get the R value. Equation(5) then yields the fraction of muscle. The compo-sition of the absc'ber determines the best choice ofphoton energies. For tissue thickn83 ranging upto 10 cm. our choice of radiation is Cd whichprovides an 88 keV gamma ray and a 22 keV x ray.In additlojto having its photons in the proper energyrange, Cd offers the advantages of stable outputand compactness; also, the gamma is monochromaticand the x ray can be made n9ly s82 filteyw.
Gder ,sible sources are Xe, Am, I and
ln(01 1)Rl= (I /2I)ln 02 2
-4l x 4= =
i2 p x 42(2)
Assume the two components to be muscle and fat andlet the fractional proportions be P and Pf respec-tively. The mass absorption coefhcients in (1) canthen be written as
"ml Pm,
fl Pf 3
'2m2 Pm +f2 Pf (4)
Letting P + Pf 1 and substituting into (3) and (4)we obtainm
R ((ml :f 1) mf2) PM +f2
It is at once seen that since the A Is can be determinedfrom the elemental composition of fat and muscle, Pcan be determined from an experimental determina- mtion of R (see equation (2) ).
When working on in vivo samples it frequentlyhappens that the distribution of lipid material is non-uniform. If this occurs one may resort to an inte-
INSTRUMENTATION
Electronics
The electronic system includes a preamp, lin-ear amplifier, two single-channel analyzers, twoscalers, a timer, and a paper print-out. Occasion-ally the system amplification may drift or the spec-trum may be distorted by ambient temperaturechanges. To monitor this possibility we have amulti-channel analyzer and oscilloscope connectedinto the system.
Source
The source holder and detector;sembly pro-vide collimation and alignment. The Cd is elec-troplated onto a one cm. silver disc. The size ofthe deposit is 3 mm. and the amount of cadmium isapproximately 6 micrograms. The silver disc isfixed to the top of a brass cylinder which is in turnmounted into a source shield. The cylinder can bepositioned at various distances from the aperture ofthe shield to control the collimator angle. A filterof 4 mil Pd eliminates most of the K radiation andleaves the K x ray of about 22 keV. The filter is
549
positioned at the source shield aperture.
Scanning System
The source-detector configuration is rigidlylinked together to provide a constant collimation angleand to preserve alignment. This configuration restson a platform which is driven by a worm gear andstepping motor allowing it to scan across the samplein fixed distance increments or in continuous motion.A second track and motor provide for motion in aperpendicular direction. A prototype arm-supportplatform has been fabricated to allow scans over thetriceps region of the arm. The platform is so con-structed as to allow accurate repositioning of the armat a later date.
RE SULTS
Our ultimate aim is to develop an accuratemethod of measuring tissue lipid content in vivo.Unfortunately, there is no accurate means to verifythe in vivo results against. For this reason we mustrely on data derived from in vitro experiments forverification of the accuracy of this method.
Bovine tissue
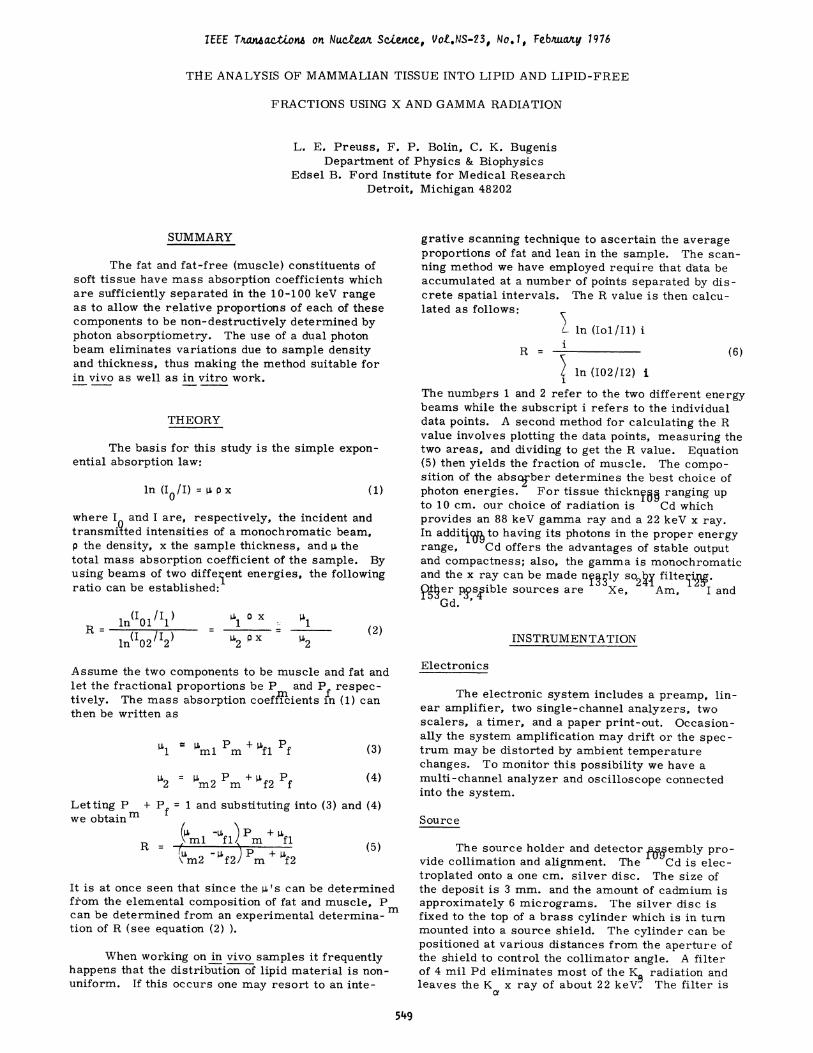
The most significant in vitro studies were doneon beef tissue. Beef muscle and fat were mixedtogether in varying proportions, and homogenizedwith a laboratory blender. The resultant mixture wasanalyzed first by the dual photon method and subse-quently by ether extraction of the fat. Table Ipresents a sampling of results.
TABLE I
ANALYSIS OF BEEF MUSCLE
Sample
123456
Fat Fraction(from R)
.098
.225
.338
.443
.7641. 005
Fat Fraction(from Extraction)
.097
.224
.332
.448
.7621.000
Table I. Experimentail determined fat fractions ofanimal tissue using a Cd source are comparedwith fat fractions determined from chemical analy-sis.
The good correlation shown in Table I implies thattissue samples can be measured accurately to withinabout 1%.
Human Tissue
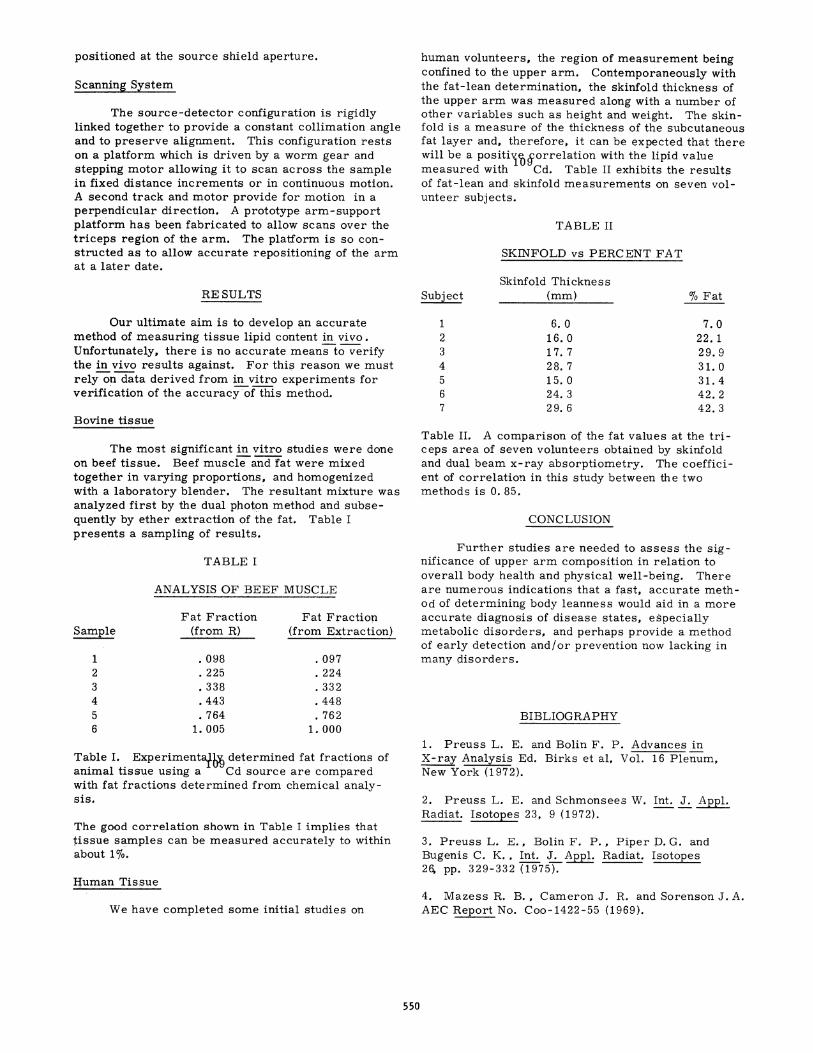
We have completed some initial studies on
human volunteers, the region of measurement beingconfined to the upper arm. Contemporaneously withthe fat-lean determination, the skinfold thickness ofthe upper arm was measured along with a number ofother variables such as height and weight. The skin-fold is a measure of the thickness of the subcutaneousfat layer and, therefore, it can be expected that therewill be a positi$6correlation with the lipid valuemeasured with Cd. Table II exhibits the resultsof fat-lean and skinfold measurements on seven vol-unteer subjects.
TABLE II
SKINFOLD vs PERCENT FAT
Subj ectSkinfold Thickness
(mm)
1234567
% Fat
6. 016. 017.728. 715.024. 329. 6
7. 022. 12 9. 93 1. 031. 442. 242. 3
Table II. A comparison of the fat values at the tri-ceps area of seven volunteers obtained by skinfoldand dual beam x-ray absorptiometry. The coeffici-ent of correlation in this study between the twomethods is 0. 85.
CONCLUSION
Further studies are needed to assess the sig-nificance of upper arm composition in relation tooverall body health and physical well-being. Thereare numerous indications that a fast, accurate meth-od of determining body leanness would aid in a moreaccurate diagnosis of disease states, especiallymetabolic disorders, and perhaps provide a methodof early detection and/or prevention now lacking inmany disorders.
BIBLIOGRAPHY
1. Preuss L. E. and Bolin F. P. Advances inX-ray Analysis Ed. Birks et al, Vol. 16 Plenum,New York (1972).
2. Preuss L. E. and Schmonsees W. Int. J. Appl.Radiat. Isotopes 23, 9 (1972).
3. Preuss L. E., Bolin F. P., Piper D. G. andBugenis C. K., Int. J. Appl. Radiat. Isotopes26, pp. 329-332 (1975).
4. Mazess R. B., Cameron J. R. and Sorenson J. A.AEC Report No. Coo-1422-55 (1969).
550