the ad-as model macro created: sept 2007 by jim luke. understanding the ad-as model: aggregate...
TRANSCRIPT

Created:Sept 2007
by Jim Luke.
The AD-AS ModelMACRO
Understanding the AD-AS Model:Aggregate Demand-Aggregate Supply
(actually it’s AD-SRAS-LRAS)It is the foundation of real-sector
models of macroeconomics, including the Classical Theory and Keynesian
Theory.

Created:Sept 2007
by Jim Luke.
The AD-AS ModelMACRO
AD-AS Basics
In the AD-AS model, the economy’s performance is plotted as a point. The point represents the current Price Level and the level of real output (Real GDP) the economy is experiencing.
W e will start by looking at the basics of the graph of the model -- what the axes represent and how changes in the economy are represented.

Created:Sept 2007
by Jim Luke.
The AD-AS ModelMACRO
Q Real Output
(amount of real goods & services produced)
PPrice Level(price index)
Start with the basics: What space is the graph describing?Two Axes: Price Level vs. Real GDPOur objective is to map the economy: How do changes in the price level (inflation or deflation) relate to growth or shrinkage of Real GDP? Does the economy grow or shrink when inflation happens?

Created:Sept 2007
by Jim Luke.
The AD-AS ModelMACRO
Q Real Output
(amount of real goods & services produced)
PPrice Level(price index)
Start
Real GDP@start
Price Index @start
Imagine the Economy is at some starting point.

Created:Sept 2007
by Jim Luke.
The AD-AS ModelMACRO
Next, to check your understanding of the graph, let’s examine some some changes to an economy and how it would show up on the graph.

Created:Sept 2007
by Jim Luke.
The AD-AS ModelMACRO
Q Real Output
(amount of real goods & services produced)
PPrice Level(price index)
start (now)
Real GDP@start
Price Index @start
after
after real growth in GDP, but no inflation or deflation
Real GDPafter
If Economy Grows, then it shifts right.

Created:Sept 2007
by Jim Luke.
The AD-AS ModelMACRO
Q Real Output
(amount of real goods & services produced)
PPrice Level(price index)
Start
Real GDP@start
Price Index @start
after decline in real GDPunemployment has increasedbecause fewer resources are employed
after
Real GDPafter
If economy shrinks (recession), it moves to left.

Created:Sept 2007
by Jim Luke.
The AD-AS ModelMACRO
Q Real Output
(amount of real goods & services produced)
PPrice Level(price index)
Start
Real GDP@start
Price Index @start
afterPrice Index after inflation
Inflation
If the inflation happens, then the economy shifts to a point higher on graph.

Created:Sept 2007
by Jim Luke.
The AD-AS ModelMACRO
Q Real Output
(amount of real goods & services produced)
PPrice Level(price index)
Start
Real GDP@start
Price Index @start
afterPrice Index after deflation
deflation
Deflation causes a shift downward.

Created:Sept 2007
by Jim Luke.
The AD-AS ModelMACRO
Q Real Output
(amount of real goods & services produced)
PPrice Level
(price index)
Start
Real GDP@start
Price Index @start
afterPrice Index after inflation
Inflation
Of course in real life, the both the price level and real GDP change at the same time. Now let’s suppose there’s a simultaneous change in both the price level (an increase) and real output (decrease in Real GDP) .
Real GDPafter

Created:Sept 2007
by Jim Luke.
The AD-AS ModelMACRO
Q Real Output
(amount of real goods & services produced)
PPrice Level
(price index)
Start
Real GDP@start
Price Index @start
afterPrice Index after inflation
Inflation
Suppose, though, that real output increases while the Price Level increases. The point representing the economy now moves to the right and up.
Real GDPafter

Created:Sept 2007
by Jim Luke.
The AD-AS ModelMACRO
You can figure out what would happen in the other two possible cases:
Price index decline w/ real GDP increase– the economy moves down and to the right
Price index decline w/ real GDP decrease– the economy moves down and to the left
Created:Sept 2007
by Jim Luke.
The AD-AS ModelMACRO
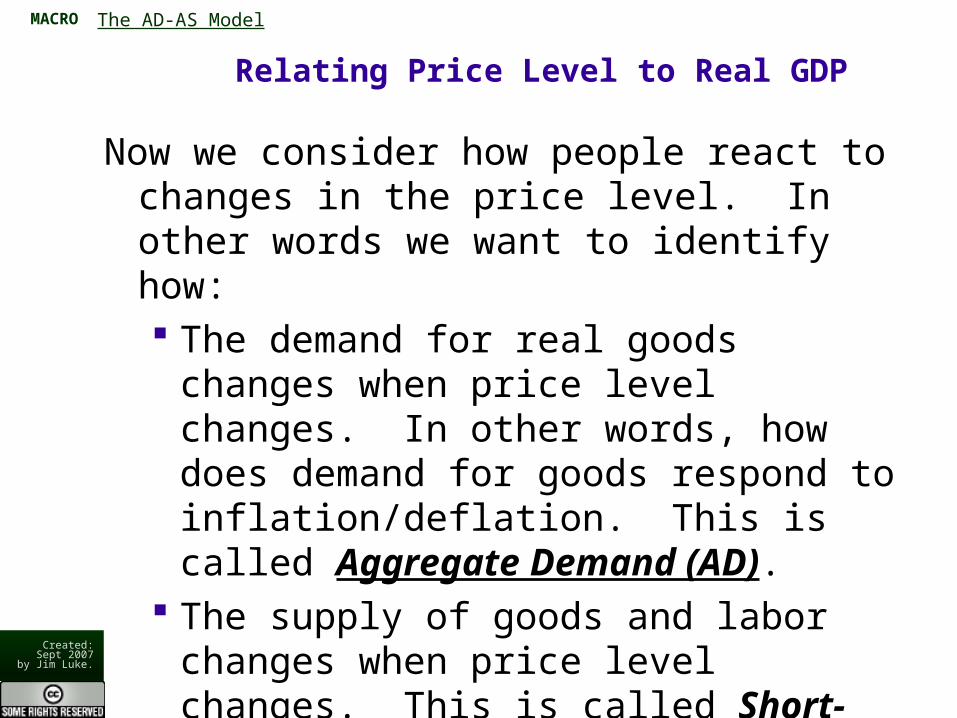
Relating Price Level to Real GDP
Now we consider how people react to changes in the price level. In other words we want to identify how: The demand for real goods changes when price level
changes. In other words, how does demand for goods respond to inflation/deflation. This is called Aggregate Demand (AD).
The supply of goods and labor changes when price level changes. This is called Short-Run Aggregate Supply (SRAS).

Created:Sept 2007
by Jim Luke.
The AD-AS ModelMACRO
Consider Aggregate DemandAggregate Demand (AD) is shows that Real GDP is inversely related to Price
Level. In other words, when Price Level goes up, real GDP demanded by people goes down. Why? Wealth Effect: most consumption spending is done from income – money
earned from selling labor. When inflation happens, the price of labor goes up also, allowing people to keep buying the same amount of real goods. But some people finance their consumption by spending their wealth (paying out of their savings account or pension). These incomes stay fixed inflation, forcing people to buy fewer real goods.
Interest Rate Effect: inflation causes interest rates to increase, which causes firms to borrow less and spend less on investment.
Int’l. Trade Effect: Higher prices for domestic goods (the inflation) causes imports to be more relatively attractive and exports less attractive. X-M decreases, reducing real GDP.
Now let’s look at this in the graph……..

Created:Sept 2007
by Jim Luke.
The AD-AS ModelMACRO
Q Real Output
(amount of real goods & services produced)
PPrice Level
(price index)
Start
Real GDP@start
Price Index @start
Consider Demand for Real Goods: If inflation happens, then some people cannot buy as many goods (because of wealth effect, interest rate effect, & int’l trade effects)

Created:Sept 2007
by Jim Luke.
The AD-AS ModelMACRO
Q Real Output
(amount of real goods & services produced)
PPrice Level
(price index)
Start
Real GDP@start
Price Index @start
Similarly, Deflation (lower prices of everything) allows people to buy more real goods.

Created:Sept 2007
by Jim Luke.
The AD-AS ModelMACRO
Q Real Output
(amount of real goods & services produced)
PPrice Level
(price index)
Start
Real GDP@start
Price Index @start
This relationship between Price Level and Real GDP that people can afford to buy is called Aggregate Demand, or the AD Curve: Demand for real goods responds to inflation/deflation by moving in these directions

Created:Sept 2007
by Jim Luke.
The AD-AS ModelMACRO
Now let’s look at producers.
Now consider producers, both firms making products and households deciding to sell labor. In the short-run, when inflation happens (price level rises) producers get “fooled”. They see that the price of their product or labor has increased. They believe this to be a real price increase for their product or service relative to other goods. What they don’t see immediately, is that all goods are going up in price. Believing it is real price increase, they are willing to produce and sell more real goods.
But, in reality all prices have higher prices, including the inputs (costs) for the firm and the goods the worker hopes to buy. In the short-run, this means that a rise in all prices (inflation) can initially cause producers to offer more goods/services for sale. We call this short-run relationship SRAS, or Short-Run Aggregate Supply.

Created:Sept 2007
by Jim Luke.
The AD-AS ModelMACRO
Q Real Output
(amount of real goods & services produced)
PPrice Level
(price index)
Start
Real GDP@start
Price Index @start
SRAS: Consider a producer. When the price of product increases, firm wants to supply (sell) more product. Firm doesn’t realize that all prices have increased (inflation).

Created:Sept 2007
by Jim Luke.
The AD-AS ModelMACRO
Q Real Output
(amount of real goods & services produced)
PPrice Level
(price index)
Start
Real GDP@start
Price Index @start
When firms’ price goes down, firm is willing to sell less, thinking it less profitable. They don’t realize costs are also declining if it is truly deflation.

Created:Sept 2007
by Jim Luke.
The AD-AS ModelMACRO
Q Real Output
(amount of real goods & services produced)
PPrice Level
(price index)
Start
Real GDP@start
Price Index @start
Thus we have the SRAS curve. It shows the short-run reaction by firms & workers to inflation/deflation. They will initially offer to sell more/less real goods in short-run.

Created:Sept 2007
by Jim Luke.
The AD-AS ModelMACRO
In the short-run, the economy must always be where SRAS=AD. This is because the quantity of Real GDP we buy
must equal the amount we sell.
PPrice Level
(price index)
Real GDP@start
Price Index @start start
SR-AS
AD
A Short-Run Equilibrium exists when offers to sell equal offers to buy: Purchases = Sales. In other words, a short-run equilibrium exists where AD intersects SRAS.

Created:Sept 2007
by Jim Luke.
The AD-AS ModelMACRO
Next: Shifts in the AD curve
The AD and SRAS curves only show how Real GDP changes when only the Price Level goes up or down. Next, let’s suppose factors other than the Price Level change. Other factors changing will move the curves to the right or to the left. Factors that shift AD are: Changes in people’s expectations about future economic
conditions. More optimism shifts right, more pessimism shifts left.
Economic growth in other countries boosts demand exports. Government budget decisions to change T or G

Created:Sept 2007
by Jim Luke.
The AD-AS ModelMACRO
Q Real Output
(amount of real goods & services produced)
PPrice Level
(price index)
Start
Real GDP@start
Price Index @start
This shift in AD could represent: - increased optimism among households & firms- increased government spending- decreased taxes- foreigners choosing to buy more exportsReverse these changes and AD shifts the other way.
AD before
AD after

Created:Sept 2007
by Jim Luke.
The AD-AS ModelMACRO
Next: Shifts in SRAS curve.
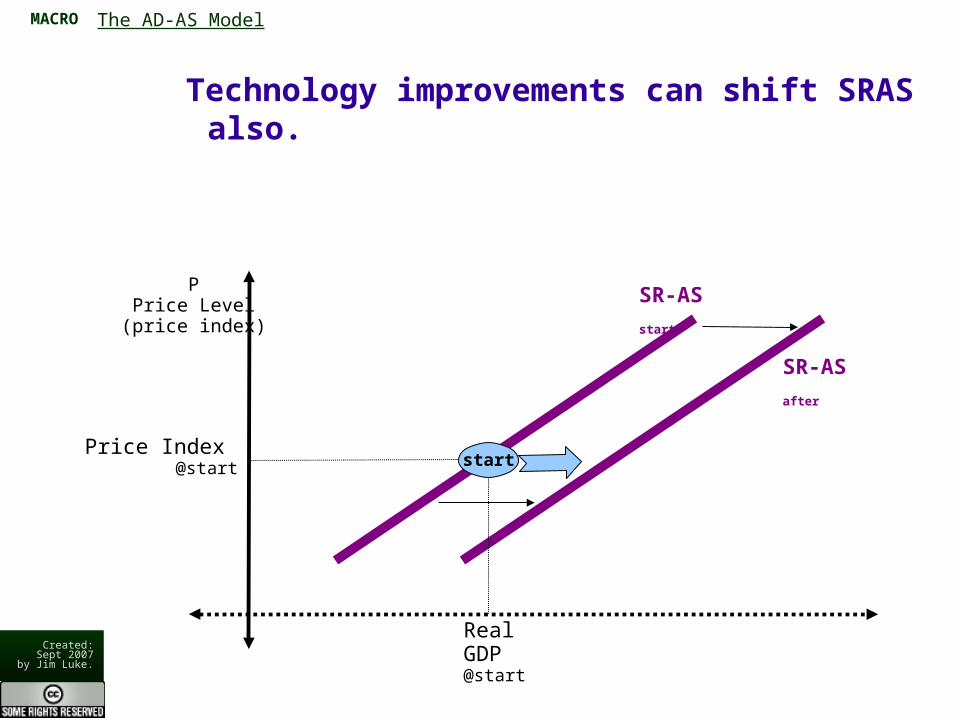
The SRAS curve only shows how Real GDP changes when the Price Level goes up or down. Next, let’s suppose factors other than the Price Level change. Factors that cause SRAS to shift left or right are: Changes in expectations about future economic conditions. Technology improves resulting in better profitability. Cost increases: Firms realize that resource prices have risen
but they cannot pass the increase on to customers.

Created:Sept 2007
by Jim Luke.
The AD-AS ModelMACRO
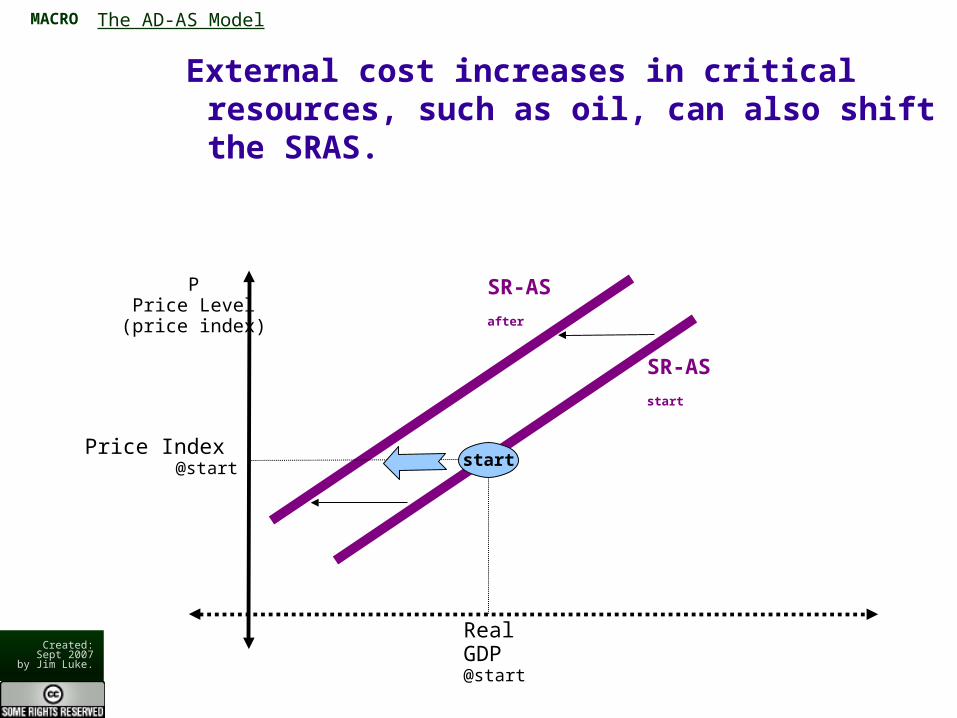
Cost increases shift the SRAS curve.
Earlier we said that SRAS is upward sloped because firms/workers get “fooled”. They see the price of what they are selling go up and respond by producing more – they move up the SRAS curve.
But this movement up the SRAS is only temporary. Once the firms realize that not only has their product price gone up, but the prices of all the inputs (resources) they are buying are also increasing, the firms respond by cutting back production the previous real quantities. Except now, the price level has increased. So this realization of higher costs shows up as a shift backward in the SRAS as shown on the next slide.

Created:Sept 2007
by Jim Luke.
The AD-AS ModelMACRO
PPrice Level
(price index)
Real GDP@start
Price Index @start start
SR-AS start
Firms reacting to realization that inflation has raised all prices, not just the price of their product.
Initial reaction
Price Index after inflation
Finalreaction
SR-AS after
Created:Sept 2007
by Jim Luke.
The AD-AS ModelMACRO
PPrice Level
(price index)
Real GDP@start
Price Index @start start
SR-AS start
Technology improvements can shift SRAS also.
SR-AS after
Created:Sept 2007
by Jim Luke.
The AD-AS ModelMACRO
PPrice Level
(price index)
Real GDP@start
Price Index @start start
SR-AS start
External cost increases in critical resources, such as oil, can also shift the SRAS.
SR-AS after

Created:Sept 2007
by Jim Luke.
The AD-AS ModelMACRO
Long-Run Supply: The Question of Capacity & Resources
So far our model has two parts: AD, representing the demand for real goods, and SRAS representing the short-run reaction of firms/workers to price changes.
There’s one missing piece: capacity and resources. As the Production Possibilities Curve model (see micro economics) shows, a society’s ability to produce is limited by the availability of resources and technology.
Next, we show how society’s long-run ability to produce, given existing resources and technology, can be shown in the model.

Created:Sept 2007
by Jim Luke.
The AD-AS ModelMACRO
Q Real Output
(amount of real goods & services produced)
PPrice Level
(price index)
LRAS:long-run aggregate supply(“capacity of economy” or “sustainable production rate” when all resources are employed)
Production Possibilities are determined by available resources and technology --- not by the Price Level.
Capacity is represented by the Long-Run Aggregate Supply curve (LRAS). LRAS is vertical because it says that long-run, our ability to produce is limited by the amount of resources and technology we have, not what money price we put on those resources.

Created:Sept 2007
by Jim Luke.
The AD-AS ModelMACRO
Q Real Output
(amount of real goods & services produced)
PPrice Level
(price index)
LRAS1
Long run growth is a shift in LRAS.
Long run growth happens when the economy gains more resources and better technology. This shows as a shift to the right in LRAS.
A shift to the left means the economy has lost resources – likely the result of war or disasters..
LRAS2

Created:Sept 2007
by Jim Luke.
The AD-AS ModelMACRO
Q Real Output
(amount of real goods & services produced)
PPrice Level
(price index)
LRAS:long-run aggregate supply
attempting to produce more than capacity, only possible for short run, actually draws down inventory
What if firms and workers attempt to produce more than we have the capacity to produce?
In a market economy, there is no central plan – there are only the individual plans of many firms and households. It is possible that the sum of all these plans will be an amount of real GDP that is not feasible because it requires more total resources than the society possesses.
If this happens, shortages of resources will develop.

Created:Sept 2007
by Jim Luke.
The AD-AS ModelMACRO
Q Real Output
(amount of real goods & services produced)
PPrice Level
(price index)
LRAS:long-run aggregate supply
any point in this region indicates the economy is not using all resources --- unemployment exists
If economy is to left of LRAS unemployment exists since not all resources are being used.
On the other hand, if the total of everybody’s plans requires less than the resources available, then unused resource exists.
Typically, the unused resource is labor. In other words, too little production and unemployment results.

Created:Sept 2007
by Jim Luke.
The AD-AS ModelMACRO
Q Real Output
(amount of real goods & services produced)
PPrice Level
(price index)
LRAS:long-run aggregate supply
Amount of unemployment
The Unemployment gap.
If the economy is to the left of LRAS, then the distance between where the economy is and LRAS represents an “Unemployment gap”. The longer the distance, the more unemployment must exist because resources aren’t being used fully.

Created:Sept 2007
by Jim Luke.
The AD-AS ModelMACRO
Putting them altogether.
We’re now ready to put all three curves together.The economy is initially at some short-run equilibrium – the
intersection of AD and SRAS. What is immediately important is where this short-run
equilibrium, this intersection, is relative to LRAS. Is the intersection of AD and SRAS on, to the left, or to the right of LRAS?
There are 3 possibilities……

Created:Sept 2007
by Jim Luke.
The AD-AS ModelMACRO
IF the economy’s short-run equilibrium happens to be on LRAS (all three curves intersect together), then we are at a
full-employment long-run equilibrium. Everybody is working, we produce to capacity, we sell all of our production, and we
buy all of our production. “life is good in a macro-sense”
PPrice Level(price index)
Real GDP@start
Price Index @start
start
LRAS
SR-AS
AD
Long-Run Full Employment Equilibrium

Created:Sept 2007
by Jim Luke.
The AD-AS ModelMACRO
If economy happens to be this situation, then recessionary gap exists. Unemployment exists and there is gap between
actual production and potential production.
PPrice Level(price index)
Real GDP@start
Price Index @start
start
LRAS
SR-AS
AD
Recessionary Gap (also known as “contractionary gap”)
Real GDPif we had full employment
Gap represents amount of
unemployment

Created:Sept 2007
by Jim Luke.
The AD-AS ModelMACRO
If economy is in this situation, then Inflationary (Expansionary) Gap exists. We are actually selling and buying more goods
than we are capable of producing. Of course we can only do this by drawing down (selling) inventory. This can only
happen for a relatively short period of time.
PPrice Level(price index)
Real GDP@start
Price Index @start
start
LRAS
SR-AS
AD
Inflationary Gap (also known as Expansionary Gap)

Created:Sept 2007
by Jim Luke.
The AD-AS ModelMACRO
That’s it.
Our AD-AS model is now complete. Of course, we should Our AD-AS model is now complete. Of course, we should call it a AD-SRAS-LRAS model, but it’s customary in call it a AD-SRAS-LRAS model, but it’s customary in economics to just call it AD-AS, or Aggregate Demand-economics to just call it AD-AS, or Aggregate Demand-Aggregate Supply.Aggregate Supply.
The model, as we have developed it so far, is just a way to The model, as we have developed it so far, is just a way to “map”:“map”:
The current levels of real GDP & price level.The current levels of real GDP & price level.How buyers and producers will likely react to How buyers and producers will likely react to
changes in price levels.changes in price levels.What the capacity, or full-employment output level, What the capacity, or full-employment output level,
of the economy is.of the economy is.