the 2015 refugee crisis through statistics - refugee statistics compilation - 17 oct... · the 2015...
TRANSCRIPT
THE 2015 REFUGEE CRISIS THROUGH STATISTICS
A compilation for politicians, journalists
and other concerned citizens
17 October 2015
Syrian refugees © Freedom House
2
Contents
UNHCR: Global displaced population in 2014 ...................................................................... 3
UNHCR: Top 10 nationalities of refugees in 2014 ................................................................. 4
UNHCR: Top 10 countries hosting refugees at the end of 2014 ............................................. 5
UNHCR: Top 10 countries by number of hosted refugees per inhabitants in 2014 ................. 5
UNHCR: Top 10 countries receiving asylum claims in 2014 ................................................. 6
UNHCR: Top 10 industrialised countries receiving asylum claims in 2014 ............................ 7
UNHCR: Asylum recognition rates in the top 10 industrialised countries in 2013 .................. 8
EU: Detections of illegal border crossings into the EU 2007-2015, by year ............................ 9
EU: Arrivals and deaths in the Mediterranean 2015 ..............................................................10
Greece: Arrivals on Greek islands between Jan. and Aug. 2015 ............................................11
Greece: Nationalities of migrants detected in Greece between Jan. and Aug. 2015 ................12
Greece: Nationalities of migrants detected in Greece 2010 to 2015, by year..........................13
EU: Asylum claims & recognition rates in the EU 2008 to 2015, by year ..............................14
EU: Asylum claims in the EU 2008 to 2014, by country and year .........................................15
EU: Asylum claims in the EU Jan.-July 2015, by country and month ....................................16
EU: Top 28 nationalities claiming asylum in the EU in 2014 and their recognition rates .......17
EU: Recognition rate for Syrian asylum claims in the EU in 2014, by country ......................18
EU: Refugees resettled in the EU 2008-2014, by country and year .......................................19
On refugee resettlement ....................................................................................................20
Annex: Terminology concerning international protection in the EU ......................................21

3
UNHCR: Global displaced population in 20141
Global displaced population in 2014: 59.5 million
38.2 million internally displaced persons inside their home countries (source: IDMC2)
5.1 million Palestinian refugees inside and outside Palestinian territories registered with
the UN Relief and Works Agency for Palestine Refugees in the Near East (UNRWA)
1.8 million individuals outside their home countries whose asylum applications had not
yet been adjudicated by the end of 2014
14.4 million refugees outside their home countries under UNHCR’s mandate
UNHCR definition of “refugee” (14.4 million) for statistical purposes:
“Refugees include individuals recognized under the 1951 Convention relating to the Status
of Refugees, its 1967 Protocol, the 1969 Organization of African Unity (OAU) Convention Governing the Specific Aspects of Refugee Problems in Africa, those recognized in
accordance with the UNHCR Statute, individuals granted complementary forms of
protection, and those enjoying temporary protection. The refugee population also includes
persons in refugee-like situations.”3
“In the absence of Government figures, UNHCR has estimated the refugee population in
many industrialized countries based on 10 years of individual asylum-seeker recognition.”4
1 UNHCR, Global Trends. Forced Displacement in 2014, updated as of 12 May 2015. 2 Internal Displacement Monitoring Centre (IDMC) of the Norwegian Refugee Council (NRC). 3 UNHCR, Global Trends. Forced Displacement in 2014, updated as of 12 May 2015, p. 56. 4 UNHCR, Global Trends. Forced Displacement in 2014, updated as of 12 May 2015, p. 48, footnote 2.

4
UNHCR: Top 10 nationalities of refugees in 2014
Source: UNHCR5
Country No. of refugees
1. Syria 3.88 million
2. Afghanistan 2.59 million
3. Somalia 1.11 million
4. Sudan 666,000
5. South Sudan 616,200
6. D.R. Congo 516,800
7. Myanmar/Burma 479,000
8. Central African Rep. 412,000
9. Iraq 369,900
10. Eritrea 363,100
The UNHCR’s ranking does not include 5.1 million Palestinian refugees, who are registered
with the UN United Nations Relief and Works Agency for Palestine Refugees in the Near East
(UNRWA). They have been the largest group of refugees for decades.
The numbers above also do not include people internally displaced in these countries (such as
7.6 million displaced Syrians in Syria).
5 UNHCR, Global Trends. Forced Displacement in 2014, updated as of 12 May 2015, pp. 13-15.
5
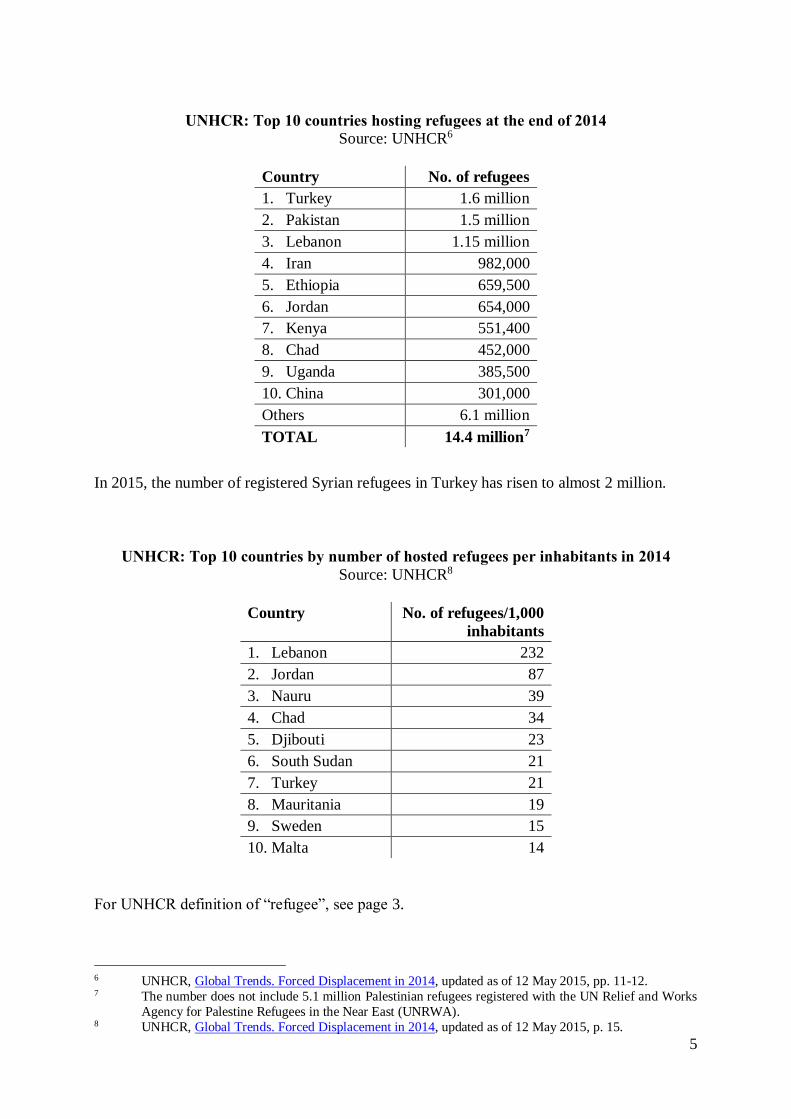
UNHCR: Top 10 countries hosting refugees at the end of 2014
Source: UNHCR6
Country No. of refugees
1. Turkey 1.6 million
2. Pakistan 1.5 million
3. Lebanon 1.15 million
4. Iran 982,000
5. Ethiopia 659,500
6. Jordan 654,000
7. Kenya 551,400
8. Chad 452,000
9. Uganda 385,500
10. China 301,000
Others 6.1 million
TOTAL 14.4 million7
In 2015, the number of registered Syrian refugees in Turkey has risen to almost 2 million.
UNHCR: Top 10 countries by number of hosted refugees per inhabitants in 2014
Source: UNHCR8
Country No. of refugees/1,000
inhabitants
1. Lebanon 232
2. Jordan 87
3. Nauru 39
4. Chad 34
5. Djibouti 23
6. South Sudan 21
7. Turkey 21
8. Mauritania 19
9. Sweden 15
10. Malta 14
For UNHCR definition of “refugee”, see page 3.
6 UNHCR, Global Trends. Forced Displacement in 2014, updated as of 12 May 2015, pp. 11-12. 7 The number does not include 5.1 million Palestinian refugees registered with the UN Relief and Works
Agency for Palestine Refugees in the Near East (UNRWA). 8 UNHCR, Global Trends. Forced Displacement in 2014, updated as of 12 May 2015, p. 15.
6
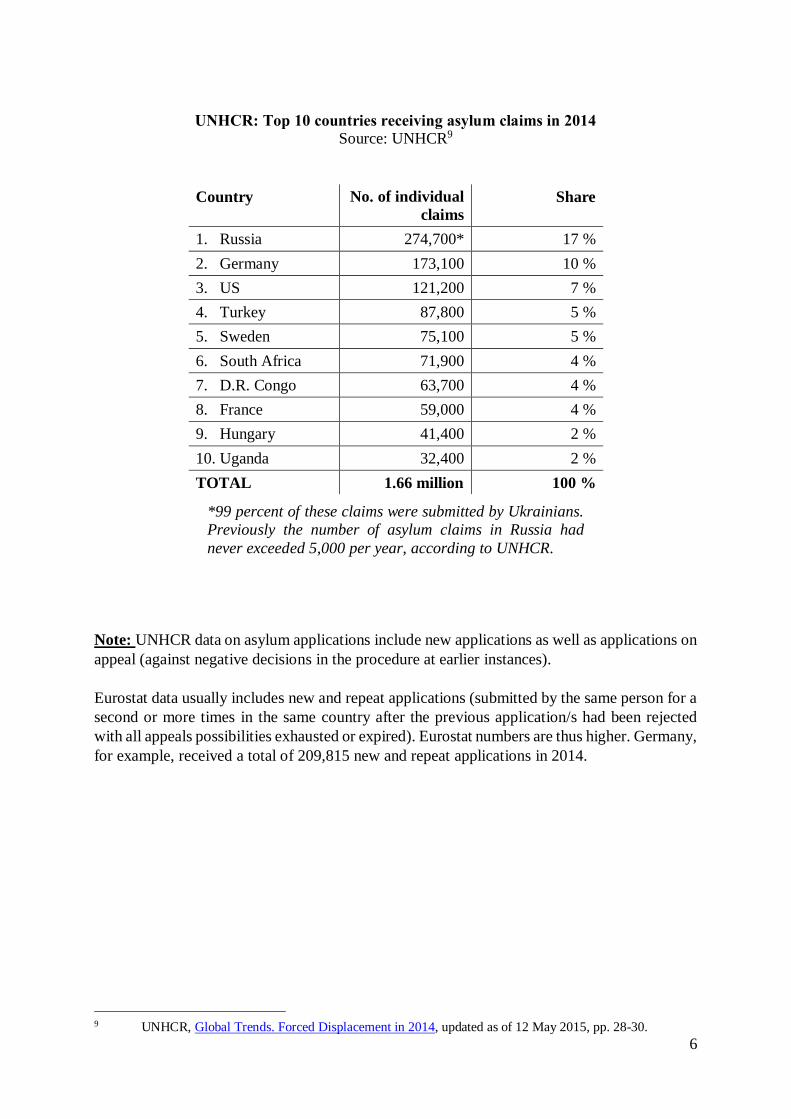
UNHCR: Top 10 countries receiving asylum claims in 2014
Source: UNHCR9
Country No. of individual
claims
Share
1. Russia 274,700* 17 %
2. Germany 173,100 10 %
3. US 121,200 7 %
4. Turkey 87,800 5 %
5. Sweden 75,100 5 %
6. South Africa 71,900 4 %
7. D.R. Congo 63,700 4 %
8. France 59,000 4 %
9. Hungary 41,400 2 %
10. Uganda 32,400 2 %
TOTAL 1.66 million 100 %
*99 percent of these claims were submitted by Ukrainians.
Previously the number of asylum claims in Russia had
never exceeded 5,000 per year, according to UNHCR.
Note: UNHCR data on asylum applications include new applications as well as applications on
appeal (against negative decisions in the procedure at earlier instances).
Eurostat data usually includes new and repeat applications (submitted by the same person for a
second or more times in the same country after the previous application/s had been rejected
with all appeals possibilities exhausted or expired). Eurostat numbers are thus higher. Germany,
for example, received a total of 209,815 new and repeat applications in 2014.
9 UNHCR, Global Trends. Forced Displacement in 2014, updated as of 12 May 2015, pp. 28-30.
7
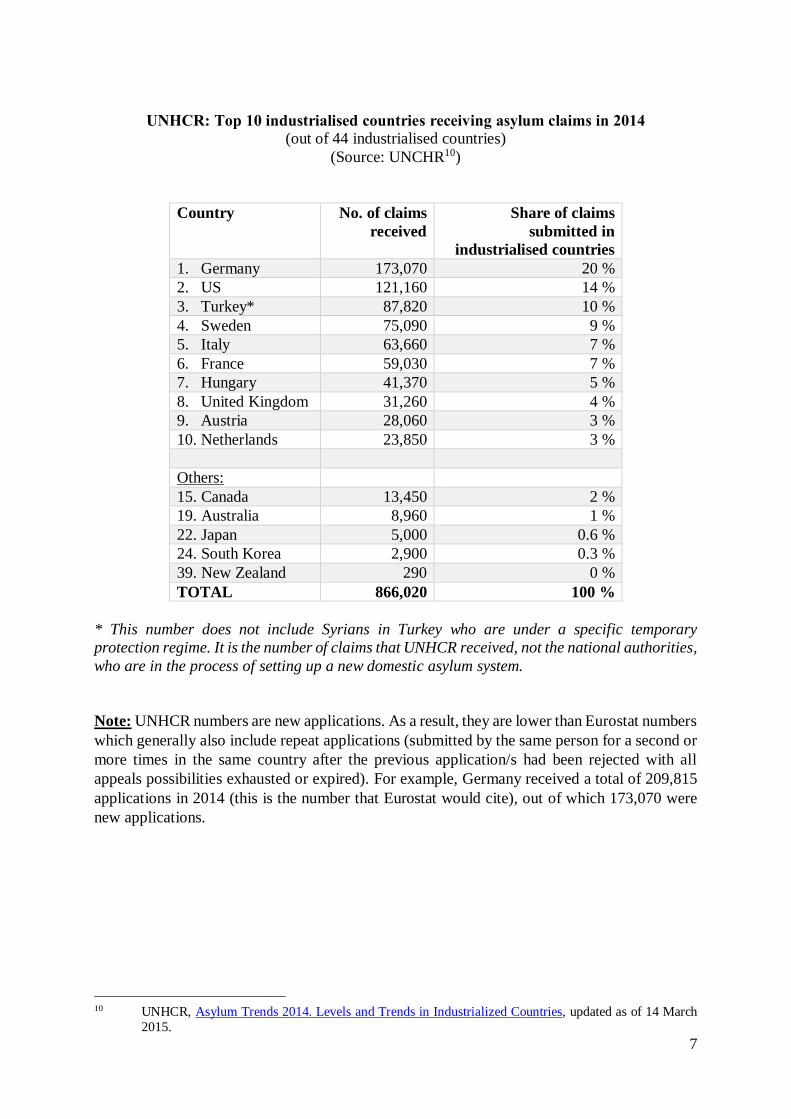
UNHCR: Top 10 industrialised countries receiving asylum claims in 2014
(out of 44 industrialised countries)
(Source: UNCHR10)
Country No. of claims
received
Share of claims
submitted in
industrialised countries
1. Germany 173,070 20 %
2. US 121,160 14 %
3. Turkey* 87,820 10 %
4. Sweden 75,090 9 %
5. Italy 63,660 7 %
6. France 59,030 7 %
7. Hungary 41,370 5 %
8. United Kingdom 31,260 4 %
9. Austria 28,060 3 %
10. Netherlands 23,850 3 %
Others:
15. Canada 13,450 2 %
19. Australia 8,960 1 %
22. Japan 5,000 0.6 %
24. South Korea 2,900 0.3 %
39. New Zealand 290 0 %
TOTAL 866,020 100 %
* This number does not include Syrians in Turkey who are under a specific temporary
protection regime. It is the number of claims that UNHCR received, not the national authorities,
who are in the process of setting up a new domestic asylum system.
Note: UNHCR numbers are new applications. As a result, they are lower than Eurostat numbers
which generally also include repeat applications (submitted by the same person for a second or
more times in the same country after the previous application/s had been rejected with all
appeals possibilities exhausted or expired). For example, Germany received a total of 209,815
applications in 2014 (this is the number that Eurostat would cite), out of which 173,070 were
new applications.
10 UNHCR, Asylum Trends 2014. Levels and Trends in Industrialized Countries, updated as of 14 March
2015.
8
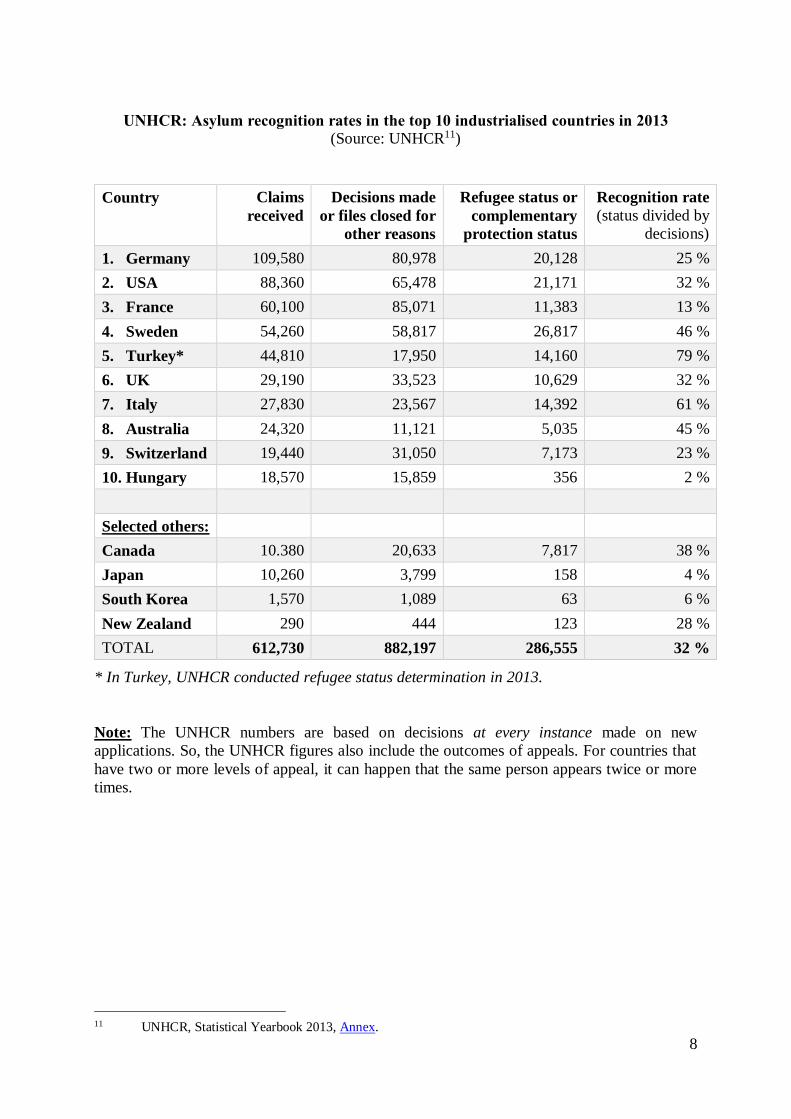
UNHCR: Asylum recognition rates in the top 10 industrialised countries in 2013
(Source: UNHCR11)
Country Claims
received
Decisions made
or files closed for
other reasons
Refugee status or
complementary
protection status
Recognition rate
(status divided by
decisions)
1. Germany 109,580 80,978 20,128 25 %
2. USA 88,360 65,478 21,171 32 %
3. France 60,100 85,071 11,383 13 %
4. Sweden 54,260 58,817 26,817 46 %
5. Turkey* 44,810 17,950 14,160 79 %
6. UK 29,190 33,523 10,629 32 %
7. Italy 27,830 23,567 14,392 61 %
8. Australia 24,320 11,121 5,035 45 %
9. Switzerland 19,440 31,050 7,173 23 %
10. Hungary 18,570 15,859 356 2 %
Selected others:
Canada 10.380 20,633 7,817 38 %
Japan 10,260 3,799 158 4 %
South Korea 1,570 1,089 63 6 %
New Zealand 290 444 123 28 %
TOTAL 612,730 882,197 286,555 32 %
* In Turkey, UNHCR conducted refugee status determination in 2013.
Note: The UNHCR numbers are based on decisions at every instance made on new
applications. So, the UNHCR figures also include the outcomes of appeals. For countries that
have two or more levels of appeal, it can happen that the same person appears twice or more
times.
11 UNHCR, Statistical Yearbook 2013, Annex.
9
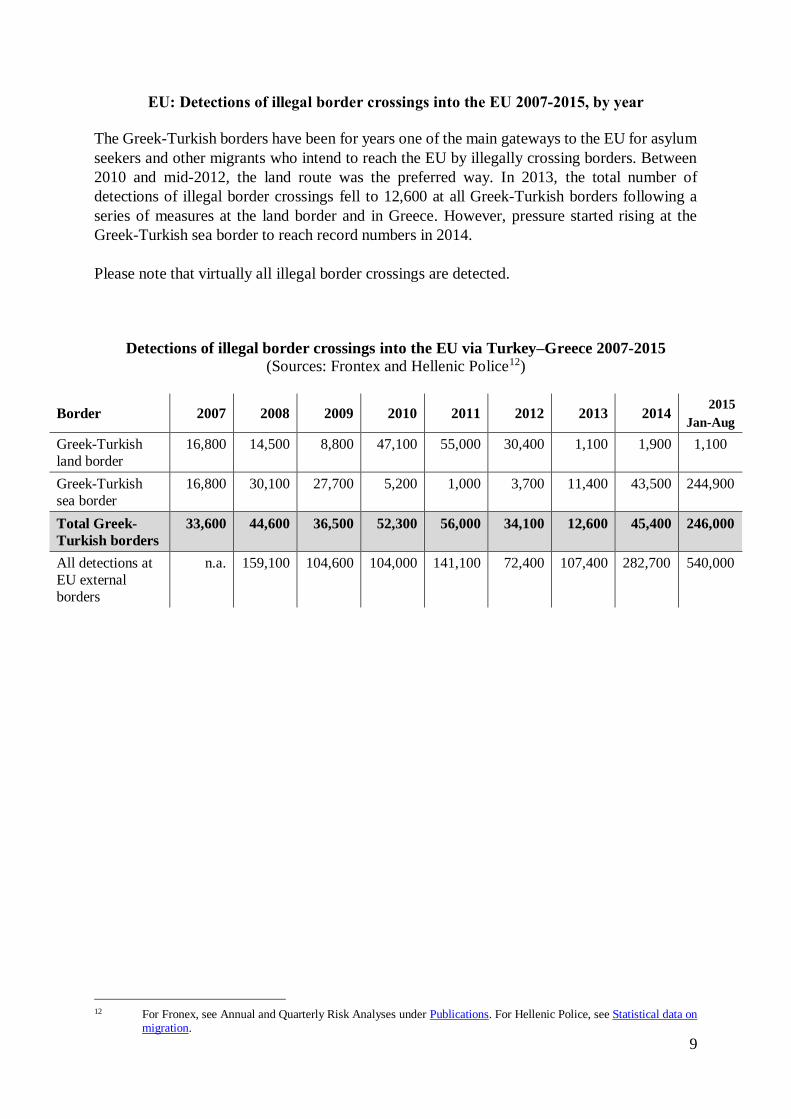
EU: Detections of illegal border crossings into the EU 2007-2015, by year
The Greek-Turkish borders have been for years one of the main gateways to the EU for asylum
seekers and other migrants who intend to reach the EU by illegally crossing borders. Between
2010 and mid-2012, the land route was the preferred way. In 2013, the total number of
detections of illegal border crossings fell to 12,600 at all Greek-Turkish borders following a
series of measures at the land border and in Greece. However, pressure started rising at the
Greek-Turkish sea border to reach record numbers in 2014.
Please note that virtually all illegal border crossings are detected.
Detections of illegal border crossings into the EU via Turkey–Greece 2007-2015
(Sources: Frontex and Hellenic Police12)
Border 2007 2008 2009 2010 2011 2012 2013 2014 2015
Jan-Aug
Greek-Turkish
land border 16,800 14,500 8,800 47,100 55,000 30,400 1,100 1,900 1,100
Greek-Turkish
sea border 16,800 30,100 27,700 5,200 1,000 3,700 11,400 43,500 244,900
Total Greek-
Turkish borders 33,600 44,600 36,500 52,300 56,000 34,100 12,600 45,400 246,000
All detections at
EU external
borders
n.a. 159,100 104,600 104,000 141,100 72,400 107,400 282,700 540,000
12 For Fronex, see Annual and Quarterly Risk Analyses under Publications. For Hellenic Police, see Statistical data on
migration.
10
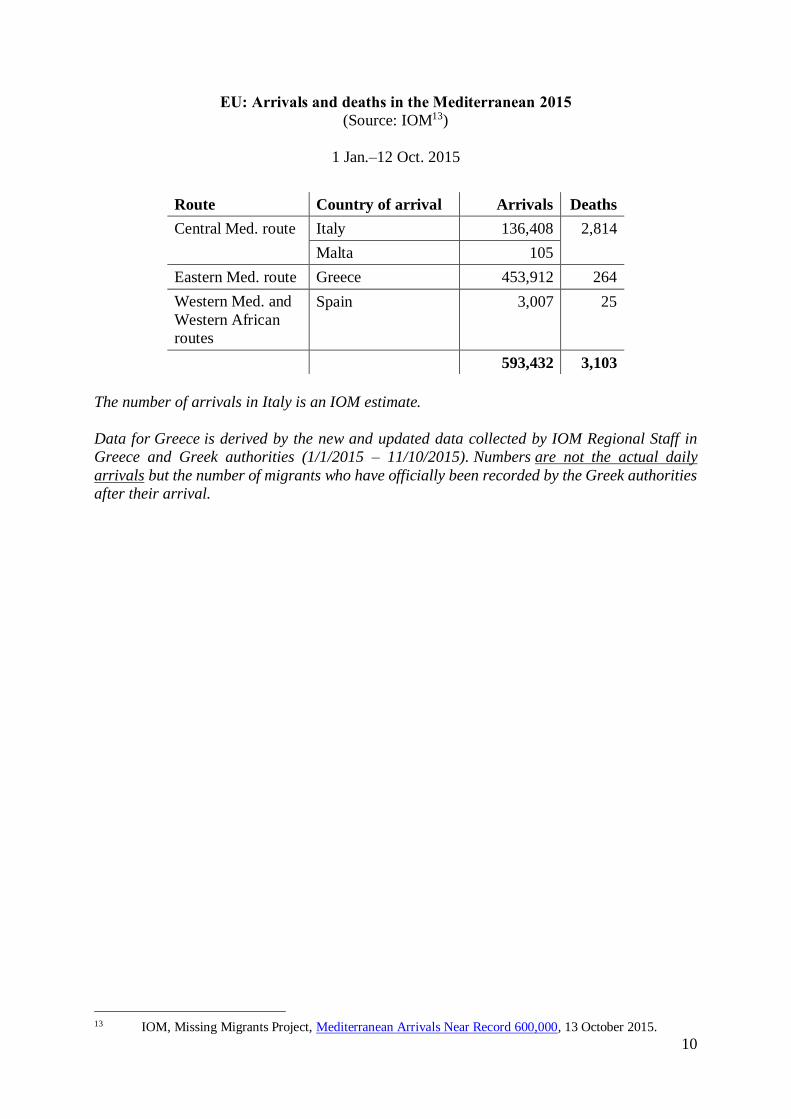
EU: Arrivals and deaths in the Mediterranean 2015
(Source: IOM13)
1 Jan.–12 Oct. 2015
Route Country of arrival Arrivals Deaths
Central Med. route Italy 136,408 2,814
Malta 105
Eastern Med. route Greece 453,912 264
Western Med. and
Western African
routes
Spain 3,007 25
593,432 3,103
The number of arrivals in Italy is an IOM estimate.
Data for Greece is derived by the new and updated data collected by IOM Regional Staff in
Greece and Greek authorities (1/1/2015 – 11/10/2015). Numbers are not the actual daily
arrivals but the number of migrants who have officially been recorded by the Greek authorities
after their arrival.
13 IOM, Missing Migrants Project, Mediterranean Arrivals Near Record 600,000, 13 October 2015.
11
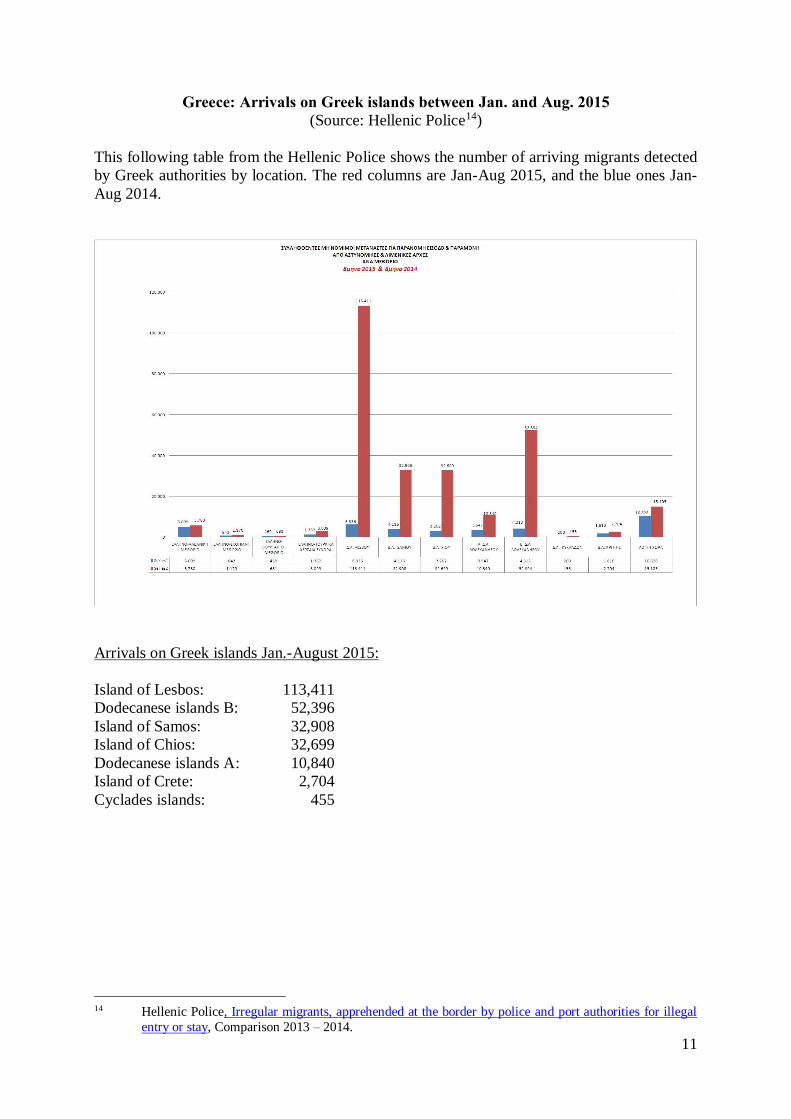
Greece: Arrivals on Greek islands between Jan. and Aug. 2015
(Source: Hellenic Police14)
This following table from the Hellenic Police shows the number of arriving migrants detected
by Greek authorities by location. The red columns are Jan-Aug 2015, and the blue ones Jan-
Aug 2014.
Arrivals on Greek islands Jan.-August 2015:
Island of Lesbos: 113,411
Dodecanese islands B: 52,396
Island of Samos: 32,908
Island of Chios: 32,699
Dodecanese islands A : 10,840
Island of Crete: 2,704
Cyclades islands: 455
14 Hellenic Police, Irregular migrants, apprehended at the border by police and port authorities for illegal
entry or stay, Comparison 2013 – 2014.
12
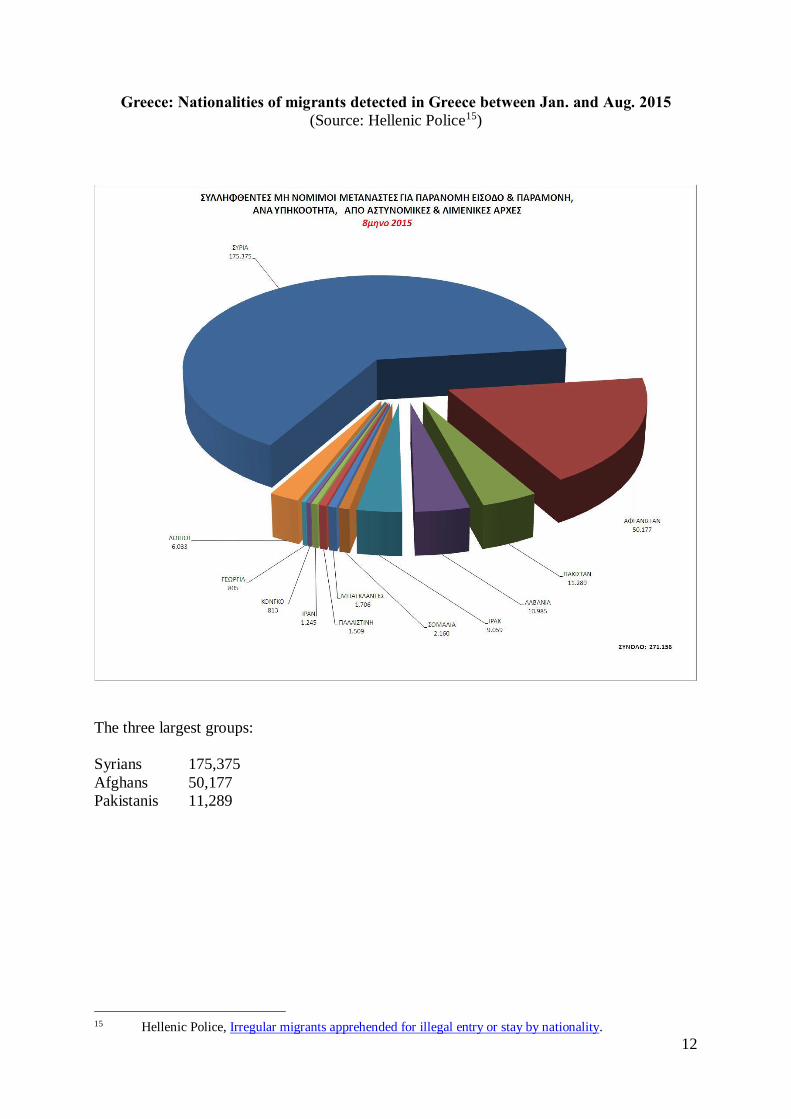
Greece: Nationalities of migrants detected in Greece between Jan. and Aug. 2015
(Source: Hellenic Police15)
The three largest groups:
Syrians 175,375
Afghans 50,177
Pakistanis 11,289
15 Hellenic Police, Irregular migrants apprehended for illegal entry or stay by nationality.
13
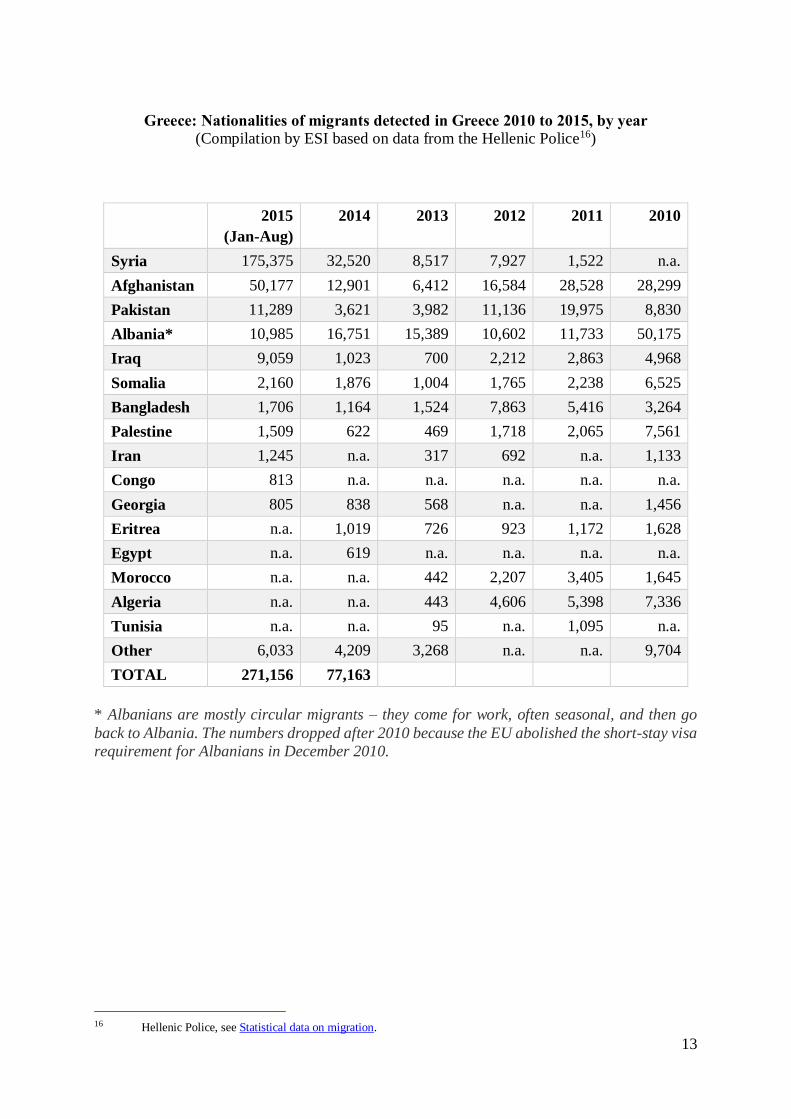
Greece: Nationalities of migrants detected in Greece 2010 to 2015, by year
(Compilation by ESI based on data from the Hellenic Police16)
2015
(Jan-Aug)
2014 2013 2012 2011 2010
Syria 175,375 32,520 8,517 7,927 1,522 n.a.
Afghanistan 50,177 12,901 6,412 16,584 28,528 28,299
Pakistan 11,289 3,621 3,982 11,136 19,975 8,830
Albania* 10,985 16,751 15,389 10,602 11,733 50,175
Iraq 9,059 1,023 700 2,212 2,863 4,968
Somalia 2,160 1,876 1,004 1,765 2,238 6,525
Bangladesh 1,706 1,164 1,524 7,863 5,416 3,264
Palestine 1,509 622 469 1,718 2,065 7,561
Iran 1,245 n.a. 317 692 n.a. 1,133
Congo 813 n.a. n.a. n.a. n.a. n.a.
Georgia 805 838 568 n.a. n.a. 1,456
Eritrea n.a. 1,019 726 923 1,172 1,628
Egypt n.a. 619 n.a. n.a. n.a. n.a.
Morocco n.a. n.a. 442 2,207 3,405 1,645
Algeria n.a. n.a. 443 4,606 5,398 7,336
Tunisia n.a. n.a. 95 n.a. 1,095 n.a.
Other 6,033 4,209 3,268 n.a. n.a. 9,704
TOTAL 271,156 77,163
* Albanians are mostly circular migrants – they come for work, often seasonal, and then go
back to Albania. The numbers dropped after 2010 because the EU abolished the short-stay visa
requirement for Albanians in December 2010.
16 Hellenic Police, see Statistical data on migration.

14
EU: Asylum claims & recognition rates in the EU 2008 to 2015, by year
(Source: Eurostat17)
Year Claims
received
Decisions
made
Recognition
rate
2008 226,000 213,925 27 %
2009 265,000 230,815 27 %
2010 261,000 222,410 25 %
2011 310,000 237,390 25 %
2012 336,000 288,505 32 %
2013 436,000 323,290 33 %
2014 626,820 357,445 45 %
Jan-June 2015 449,105 239,715 46 %
2015 will set a record in asylum claims in the EU, surpassing the previous record of 692,000
claims in 1992 in the EU15.18
The recognition rate has been rising due to the increasing number of asylum seekers who qualify
for protection, primarily Syrians.
Note: The claims include both new and repeat claims ((submitted by the same person for a
second or more times after the previous application/s had been rejected with all appeals
possibilities exhausted or expired).
The recognition rate covers refugee status in line with the Refugee Convention, subsidiary
protection and different forms of humanitarian protection, which is not granted due to
persecution or the threat of serious harm, but for humanitarian reasons. See explanation of the
terms in the Annex.
17 Eurostat interactive database, Asylum and new asylum applicants by citizenship, age and sex, Annual
aggregated data (rounded), code [migr_asyappctza]; Asylum and first time asylum applicants by
citizenship, age and sex, Monthly data (rounded), code [migr_asyappctzm]; First instance decisions on
applications by citizenship, age and sex, Annual aggregated data (rounded), code [migr_asydcfsta]; and
First instance decisions on applications by citizenship, age and sex, Quarterly data (rounded), code
[migr_asydcfstq]. 18 Eurostat, Statistics Explained, Asylum Statistics.
15
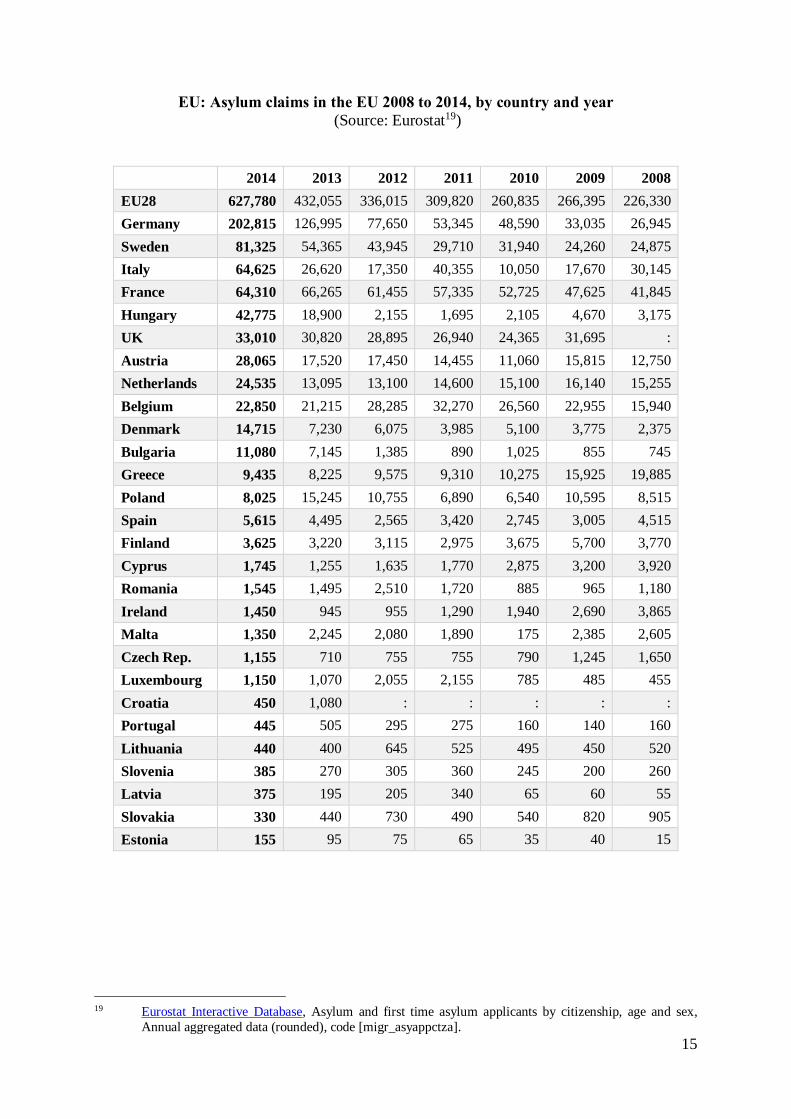
EU: Asylum claims in the EU 2008 to 2014, by country and year
(Source: Eurostat19)
2014 2013 2012 2011 2010 2009 2008
EU28 627,780 432,055 336,015 309,820 260,835 266,395 226,330
Germany 202,815 126,995 77,650 53,345 48,590 33,035 26,945
Sweden 81,325 54,365 43,945 29,710 31,940 24,260 24,875
Italy 64,625 26,620 17,350 40,355 10,050 17,670 30,145
France 64,310 66,265 61,455 57,335 52,725 47,625 41,845
Hungary 42,775 18,900 2,155 1,695 2,105 4,670 3,175
UK 33,010 30,820 28,895 26,940 24,365 31,695 :
Austria 28,065 17,520 17,450 14,455 11,060 15,815 12,750
Netherlands 24,535 13,095 13,100 14,600 15,100 16,140 15,255
Belgium 22,850 21,215 28,285 32,270 26,560 22,955 15,940
Denmark 14,715 7,230 6,075 3,985 5,100 3,775 2,375
Bulgaria 11,080 7,145 1,385 890 1,025 855 745
Greece 9,435 8,225 9,575 9,310 10,275 15,925 19,885
Poland 8,025 15,245 10,755 6,890 6,540 10,595 8,515
Spain 5,615 4,495 2,565 3,420 2,745 3,005 4,515
Finland 3,625 3,220 3,115 2,975 3,675 5,700 3,770
Cyprus 1,745 1,255 1,635 1,770 2,875 3,200 3,920
Romania 1,545 1,495 2,510 1,720 885 965 1,180
Ireland 1,450 945 955 1,290 1,940 2,690 3,865
Malta 1,350 2,245 2,080 1,890 175 2,385 2,605
Czech Rep. 1,155 710 755 755 790 1,245 1,650
Luxembourg 1,150 1,070 2,055 2,155 785 485 455
Croatia 450 1,080 : : : : :
Portugal 445 505 295 275 160 140 160
Lithuania 440 400 645 525 495 450 520
Slovenia 385 270 305 360 245 200 260
Latvia 375 195 205 340 65 60 55
Slovakia 330 440 730 490 540 820 905
Estonia 155 95 75 65 35 40 15
19 Eurostat Interactive Database, Asylum and first time asylum applicants by citizenship, age and sex,
Annual aggregated data (rounded), code [migr_asyappctza].
16
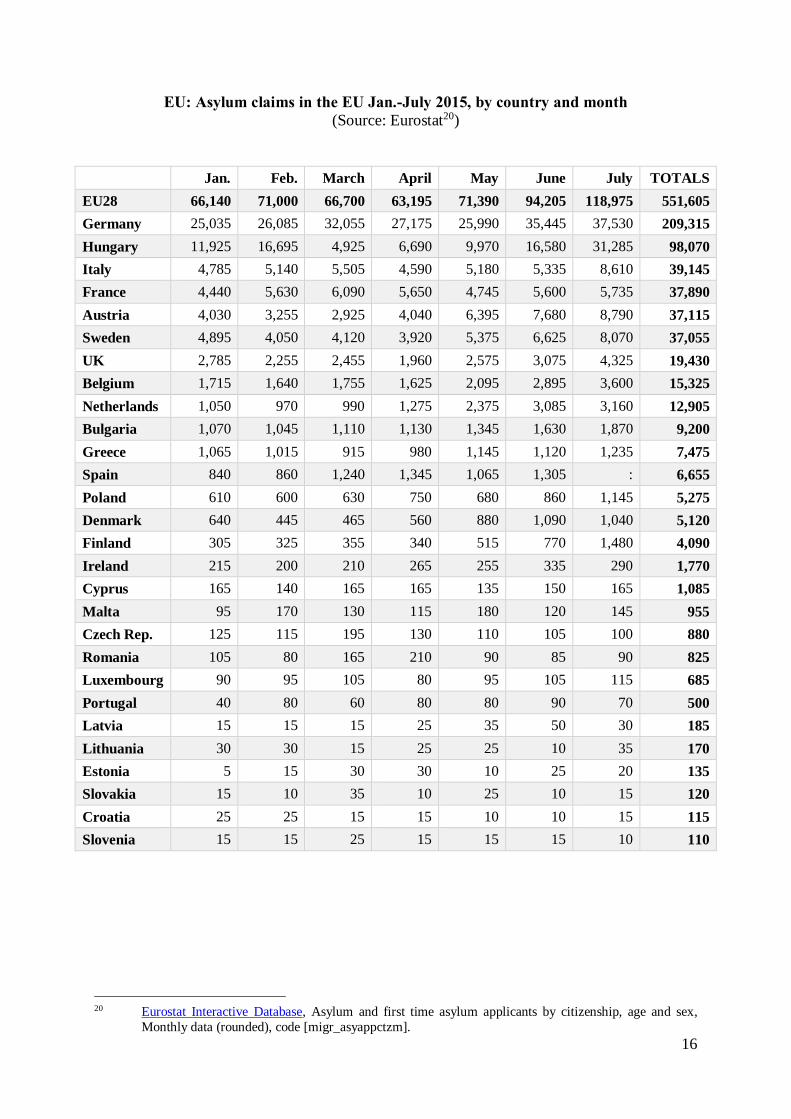
EU: Asylum claims in the EU Jan.-July 2015, by country and month
(Source: Eurostat20)
Jan. Feb. March April May June July TOTALS
EU28 66,140 71,000 66,700 63,195 71,390 94,205 118,975 551,605
Germany 25,035 26,085 32,055 27,175 25,990 35,445 37,530 209,315
Hungary 11,925 16,695 4,925 6,690 9,970 16,580 31,285 98,070
Italy 4,785 5,140 5,505 4,590 5,180 5,335 8,610 39,145
France 4,440 5,630 6,090 5,650 4,745 5,600 5,735 37,890
Austria 4,030 3,255 2,925 4,040 6,395 7,680 8,790 37,115
Sweden 4,895 4,050 4,120 3,920 5,375 6,625 8,070 37,055
UK 2,785 2,255 2,455 1,960 2,575 3,075 4,325 19,430
Belgium 1,715 1,640 1,755 1,625 2,095 2,895 3,600 15,325
Netherlands 1,050 970 990 1,275 2,375 3,085 3,160 12,905
Bulgaria 1,070 1,045 1,110 1,130 1,345 1,630 1,870 9,200
Greece 1,065 1,015 915 980 1,145 1,120 1,235 7,475
Spain 840 860 1,240 1,345 1,065 1,305 : 6,655
Poland 610 600 630 750 680 860 1,145 5,275
Denmark 640 445 465 560 880 1,090 1,040 5,120
Finland 305 325 355 340 515 770 1,480 4,090
Ireland 215 200 210 265 255 335 290 1,770
Cyprus 165 140 165 165 135 150 165 1,085
Malta 95 170 130 115 180 120 145 955
Czech Rep. 125 115 195 130 110 105 100 880
Romania 105 80 165 210 90 85 90 825
Luxembourg 90 95 105 80 95 105 115 685
Portugal 40 80 60 80 80 90 70 500
Latvia 15 15 15 25 35 50 30 185
Lithuania 30 30 15 25 25 10 35 170
Estonia 5 15 30 30 10 25 20 135
Slovakia 15 10 35 10 25 10 15 120
Croatia 25 25 15 15 10 10 15 115
Slovenia 15 15 25 15 15 15 10 110
20 Eurostat Interactive Database, Asylum and first time asylum applicants by citizenship, age and sex,
Monthly data (rounded), code [migr_asyappctzm].
17
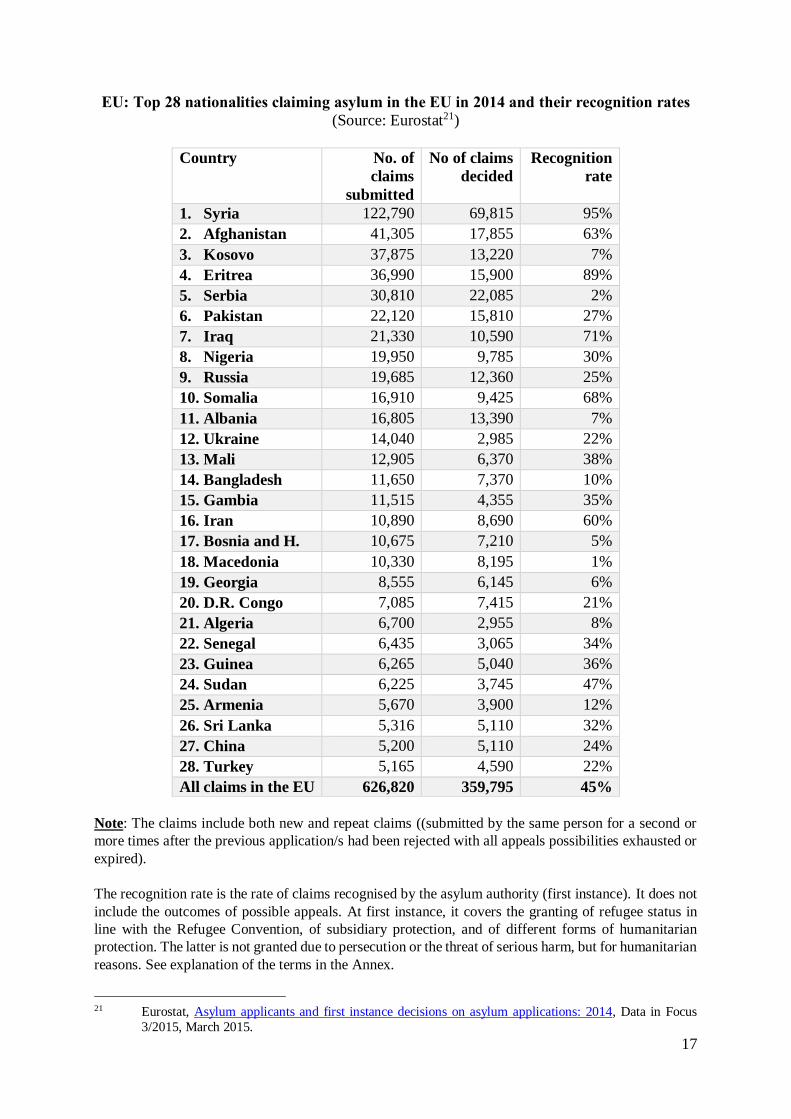
EU: Top 28 nationalities claiming asylum in the EU in 2014 and their recognition rates
(Source: Eurostat21)
Country No. of
claims
submitted
No of claims
decided
Recognition
rate
1. Syria 122,790 69,815 95%
2. Afghanistan 41,305 17,855 63%
3. Kosovo 37,875 13,220 7%
4. Eritrea 36,990 15,900 89%
5. Serbia 30,810 22,085 2%
6. Pakistan 22,120 15,810 27%
7. Iraq 21,330 10,590 71%
8. Nigeria 19,950 9,785 30%
9. Russia 19,685 12,360 25%
10. Somalia 16,910 9,425 68%
11. Albania 16,805 13,390 7%
12. Ukraine 14,040 2,985 22%
13. Mali 12,905 6,370 38%
14. Bangladesh 11,650 7,370 10%
15. Gambia 11,515 4,355 35%
16. Iran 10,890 8,690 60%
17. Bosnia and H. 10,675 7,210 5%
18. Macedonia 10,330 8,195 1%
19. Georgia 8,555 6,145 6%
20. D.R. Congo 7,085 7,415 21%
21. Algeria 6,700 2,955 8%
22. Senegal 6,435 3,065 34%
23. Guinea 6,265 5,040 36%
24. Sudan 6,225 3,745 47%
25. Armenia 5,670 3,900 12%
26. Sri Lanka 5,316 5,110 32%
27. China 5,200 5,110 24%
28. Turkey 5,165 4,590 22%
All claims in the EU 626,820 359,795 45%
Note: The claims include both new and repeat claims ((submitted by the same person for a second or
more times after the previous application/s had been rejected with all appeals possibilities exhausted or
expired).
The recognition rate is the rate of claims recognised by the asylum authority (first instance). It does not
include the outcomes of possible appeals. At first instance, it covers the granting of refugee status in
line with the Refugee Convention, of subsidiary protection, and of different forms of humanitarian
protection. The latter is not granted due to persecution or the threat of serious harm, but for humanitarian
reasons. See explanation of the terms in the Annex.
21 Eurostat, Asylum applicants and first instance decisions on asylum applications: 2014, Data in Focus
3/2015, March 2015.
18
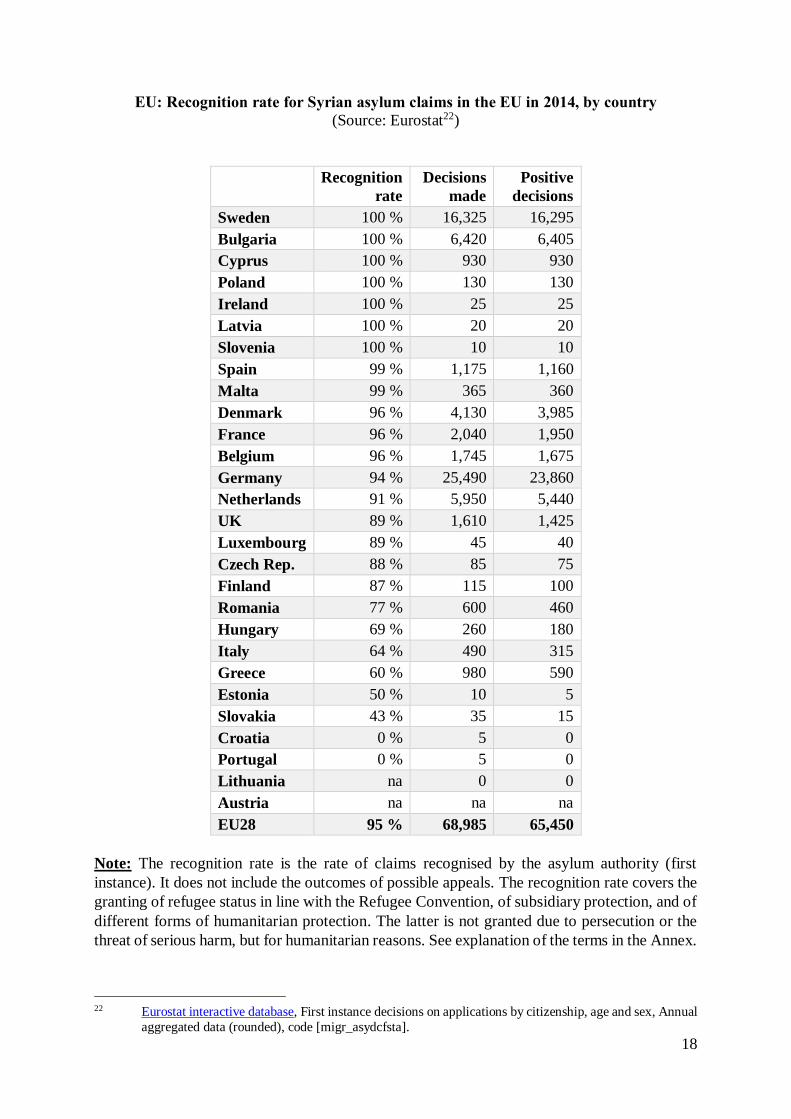
EU: Recognition rate for Syrian asylum claims in the EU in 2014, by country
(Source: Eurostat22)
Recognition
rate
Decisions
made
Positive
decisions
Sweden 100 % 16,325 16,295
Bulgaria 100 % 6,420 6,405
Cyprus 100 % 930 930
Poland 100 % 130 130
Ireland 100 % 25 25
Latvia 100 % 20 20
Slovenia 100 % 10 10
Spain 99 % 1,175 1,160
Malta 99 % 365 360
Denmark 96 % 4,130 3,985
France 96 % 2,040 1,950
Belgium 96 % 1,745 1,675
Germany 94 % 25,490 23,860
Netherlands 91 % 5,950 5,440
UK 89 % 1,610 1,425
Luxembourg 89 % 45 40
Czech Rep. 88 % 85 75
Finland 87 % 115 100
Romania 77 % 600 460
Hungary 69 % 260 180
Italy 64 % 490 315
Greece 60 % 980 590
Estonia 50 % 10 5
Slovakia 43 % 35 15
Croatia 0 % 5 0
Portugal 0 % 5 0
Lithuania na 0 0
Austria na na na
EU28 95 % 68,985 65,450
Note: The recognition rate is the rate of claims recognised by the asylum authority (first
instance). It does not include the outcomes of possible appeals. The recognition rate covers the
granting of refugee status in line with the Refugee Convention, of subsidiary protection, and of
different forms of humanitarian protection. The latter is not granted due to persecution or the
threat of serious harm, but for humanitarian reasons. See explanation of the terms in the Annex.
22 Eurostat interactive database, First instance decisions on applications by citizenship, age and sex, Annual
aggregated data (rounded), code [migr_asydcfsta].
19
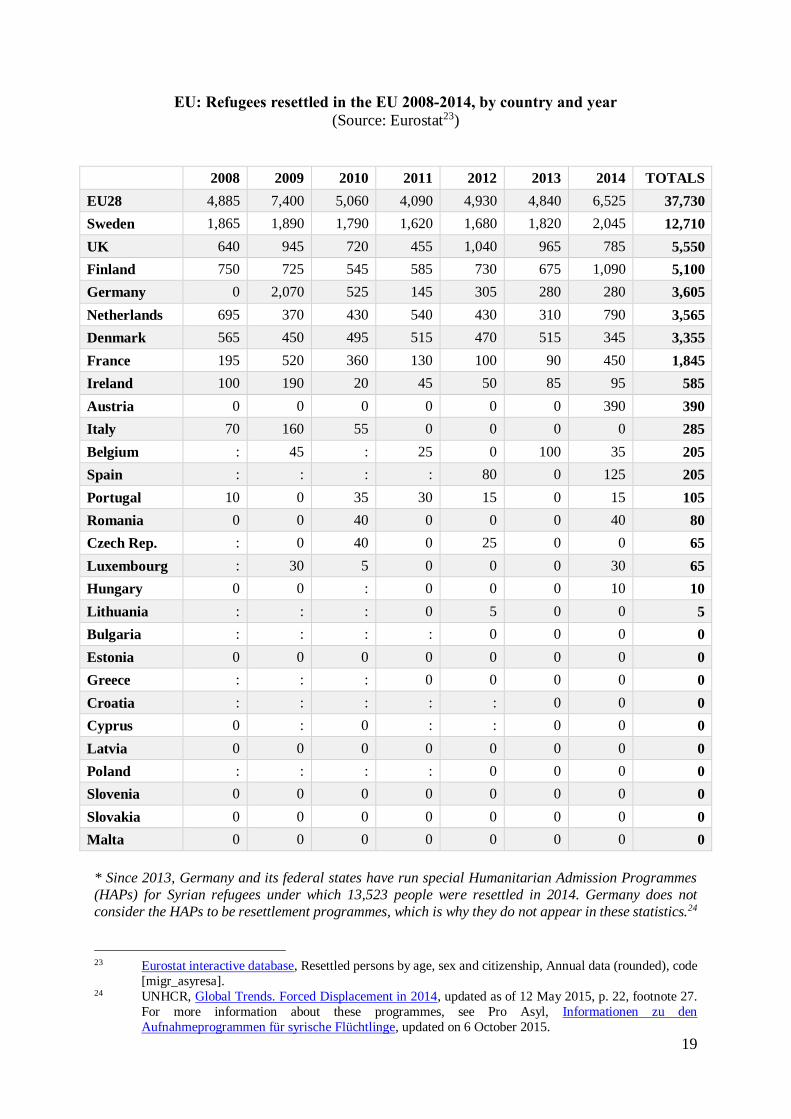
EU: Refugees resettled in the EU 2008-2014, by country and year
(Source: Eurostat23)
2008 2009 2010 2011 2012 2013 2014 TOTALS
EU28 4,885 7,400 5,060 4,090 4,930 4,840 6,525 37,730
Sweden 1,865 1,890 1,790 1,620 1,680 1,820 2,045 12,710
UK 640 945 720 455 1,040 965 785 5,550
Finland 750 725 545 585 730 675 1,090 5,100
Germany 0 2,070 525 145 305 280 280 3,605
Netherlands 695 370 430 540 430 310 790 3,565
Denmark 565 450 495 515 470 515 345 3,355
France 195 520 360 130 100 90 450 1,845
Ireland 100 190 20 45 50 85 95 585
Austria 0 0 0 0 0 0 390 390
Italy 70 160 55 0 0 0 0 285
Belgium : 45 : 25 0 100 35 205
Spain : : : : 80 0 125 205
Portugal 10 0 35 30 15 0 15 105
Romania 0 0 40 0 0 0 40 80
Czech Rep. : 0 40 0 25 0 0 65
Luxembourg : 30 5 0 0 0 30 65
Hungary 0 0 : 0 0 0 10 10
Lithuania : : : 0 5 0 0 5
Bulgaria : : : : 0 0 0 0
Estonia 0 0 0 0 0 0 0 0
Greece : : : 0 0 0 0 0
Croatia : : : : : 0 0 0
Cyprus 0 : 0 : : 0 0 0
Latvia 0 0 0 0 0 0 0 0
Poland : : : : 0 0 0 0
Slovenia 0 0 0 0 0 0 0 0
Slovakia 0 0 0 0 0 0 0 0
Malta 0 0 0 0 0 0 0 0
* Since 2013, Germany and its federal states have run special Humanitarian Admission Programmes
(HAPs) for Syrian refugees under which 13,523 people were resettled in 2014. Germany does not
consider the HAPs to be resettlement programmes, which is why they do not appear in these statistics.24
23 Eurostat interactive database, Resettled persons by age, sex and citizenship, Annual data (rounded), code
[migr_asyresa]. 24 UNHCR, Global Trends. Forced Displacement in 2014, updated as of 12 May 2015, p. 22, footnote 27.
For more information about these programmes, see Pro Asyl, Informationen zu den
Aufnahmeprogrammen für syrische Flüchtlinge, updated on 6 October 2015.

20
On refugee resettlement
As one of the durable solutions for highly vulnerable refugees, UNHCR pursues their relocation
to countries that offer them permanent resettlement and integration. Currently 27 countries
participate globally in the UNHCR-facilitated resettlement programme. In 2014, 105,200
refugees were admitted. The EU share of 6,525 resettled persons accounted for only 16 percent.
The top six countries admitting resettled refugees in 2014 were:
1. US 73,000
2. Canada 12,300
3. Australia 11,600
4. Sweden 2,000
5. Norway 1,300
6. Finland 1,100
Among the resettled refugees were 25,800 Iraqis; 17,900 citizens of Myanmar/Burma; 11,900
Somalis; 8,200 Bhutanese; 7,100 citizens of the Democratic Republic of Congo; and 6,400
Syrians.
Over the past decade (2005-2014), UNHCR has succeeded in resettling 900,000 refugees,
which is almost the same number as during the previous 1995-2004 decade (923,000 refugees).
UNHCR has many more candidates for resettlement, but adjusts its requests to available offers.
It continues to advocate for more countries to offer resettlement places, and for more places to
be offered.25
In July 2015, EU member states agreed to increase the number of refugees they resettle from
UNHCR to 18,415 over two years, and to share them between 27 member states (all member
states except Hungary).26 For this, they will receive financial support from the EU budget.
While the commitment represents an annual increase by more than 40 percent, in absolute
numbers it is just an additional 2,680 people per year. (In addition the four Schengen-associated
countries Iceland, Liechtenstein, Norway and Switzerland have pledged to resettle 4,090 people
during this period, with Norway alone offering 3,500 places.)
Several German federal states will continue their Humanitarian Admission Programmes (HAP)
for Syrian refugees outside this scheme, while the federal HAP is running out in 2015. Two
other EU countries have announced national measures outside this scheme: the UK intends to
resettle up to 20,000 Syrian refugees until the end of the current UK Parliament in 2020, and
Ireland has committed to accept 2,900 people through UNHCR or from other EU countries.27
25 All information and data on resettlement until here is from UNHCR, Global Trends. Forced Displacement
in 2014, updated as of 12 May 2015, pp. 22-23. 26 Council of the EU, Conclusions of the Representatives of the Governments of the Member States meeting
within the Council on resettling through multilateral and national schemes 20,000 persons in clear need
of international protection, 22 July 2015. 27 European Commission Communication, Managing the refugee crisis: immediate operational, budgetary
and legal measures under the European Agenda on Migration, 29 September 2015, p. 4, footnote 2.
21
Annex: Terminology concerning international protection in the EU
Refugee status (in response to persecution) is the highest form of international protection.
Under EU asylum legislation, which is based on the 1951 UN Geneva Convention relating to
the Status of Refugees and its 1967 Protocol, EU member states are committed to offering
refugee status to foreign nationals that have "a well-founded fear of being persecuted for
reasons of race, religion, nationality, political opinion or membership of a particular social
group" in their home country”.28
Subsidiary protection (in response to risks of serious harm) is accorded to people who face
"risks of serious harm" in their home countries, but who do not meet the UN definition of
refugee. The relevant EU Directive defines "serious harm" as "(a) death penalty or execution;
or (b) torture or inhuman or degrading treatment or punishment of an applicant in the country
of origin; or (c) serious and individual threat to a civilian's life or person by reason of
indiscriminate violence in situations of international or internal armed conflict."29
Humanitarian shelter: Some asylum seekers are allowed to remain in an EU country "for
reasons not due to a need for international protection, but on a discretionary basis on
compassionate or humanitarian grounds"30. As it is at the discretion of EU member states to
grant this status, it is regulated by national legislation. Most often it is offered to people with
medical problems that cannot be treated in their home country. Eurostat does not have complete
data on it since not all member states offer this type of protection or because it is granted by
authorities other than the asylum authorities.31
At first instance, asylum claims are decided by administrative bodies, that is the asylum
authorities. Some EU countries offer the possibility of an administrative review if a rejected
asylum seeker wishes to pursue it. All rejected asylum seekers also have a right of appeal before
a court, so this is the next instance. In some EU countries, this is the final instance, while others
offer the possibility of one or more appeal against the first court decision, depending on their
judicial systems.
28 Directive 2011/95/EU of the European Parliament and of the Council of 13 December 2011 on standards
for the qualification of third-country nationals or stateless persons as beneficiaries of international
protection, for a uniform status for refugees or for persons eligible for subsidiary protection, and for the
content of the protection granted. 29 Ibid. 30 Ibid. 31 There is no data on humanitarian protection from Austria, Belgium, Bulgaria, Croatia, France, Ireland,
Latvia, Lithuania, Luxembourg, Portugal and Slovenia.