thailand’s experience on emission measurement and ... · thailand’s experience on emission...
TRANSCRIPT
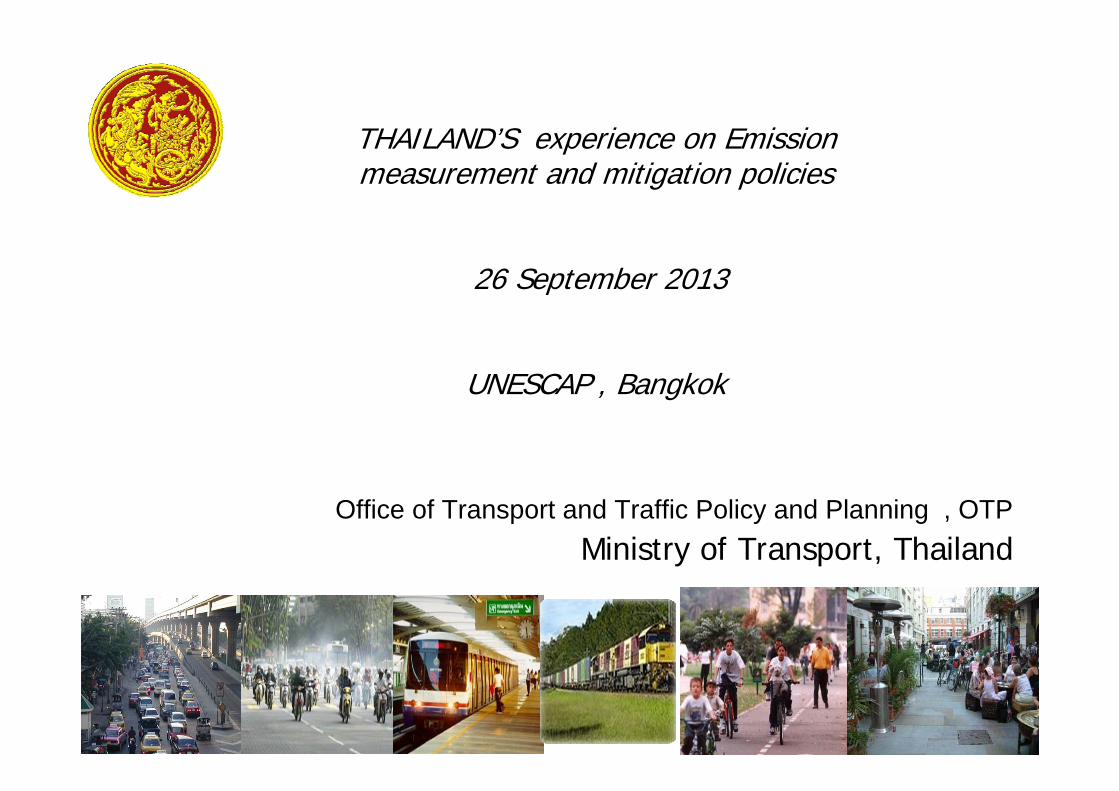
THAILAND’S experience on Emission measurement and mitigation policies
26 September 2013
UNESCAP , Bangkok
Office of Transport and Traffic Policy and Planning , OTP Ministry of Transport, Thailand

TOPIC
• Current situations
• Environmental Sustainable Transport Master Plan

BangkokMetropolitan
Panorama
Bangkok Metropolitan Region , BMRBangkok Metropolitan Region , BMRPOPULATION : 17.5 millionsPOPULATION : 17.5 millionsAREA : 7,760 sq.km.AREA : 7,760 sq.km.GDP 68 % of National GDPGDP 68 % of National GDP
Ministry of TransportMinistry of Transport

19882002
Bangkok’s Land Use (Urban Sprawl)

Bangkok situationBangkok situation

0500000
1000000150000020000002500000300000035000004000000
2003 2004 2005 2006 2007 2008 2009 2010 2011 2012
Bangkok
Thailand
Number of Vehicle registration :Number of Vehicle registration :20032003 -- 20122012
YearsNu
mbe
r of
Veh
icle
(M
illio
n)
Source: Department of Land Transport
Bangkok
Thailand

0%
20%
40%
60%
80%
100%
Ratio of Air Emissions (Pollutants) In Bangkok
% Mobile sources% Mobile sources(Motor Vehicle)(Motor Vehicle)
NONOxx SOSOxx COCO PMPM HCHC
% Area source% Area source% Point source% Point source
87%87%80%80% 54%54%75%75%
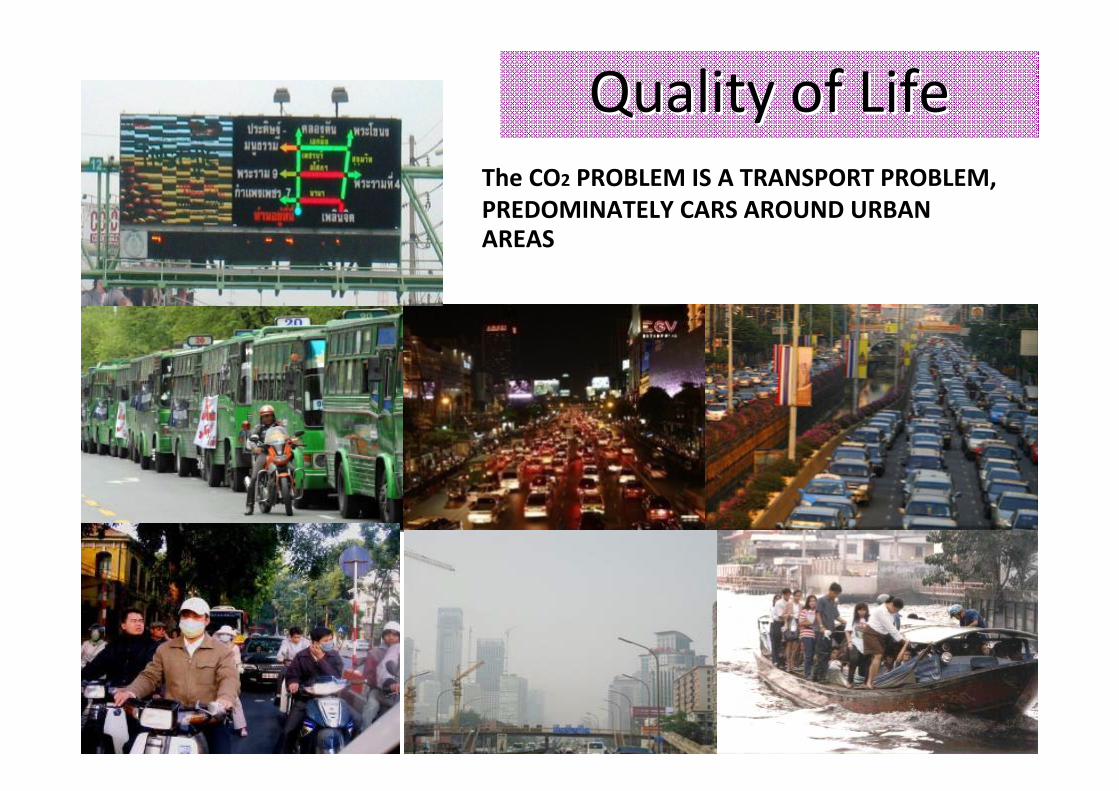
Quality of LifeQuality of LifeThe CO2 PROBLEM IS A TRANSPORT PROBLEM, PREDOMINATELY CARS AROUND URBAN AREAS

• Health Impact
• Air pollution from transport sector (Bangkok)
‐ 75% of CO‐ 80% of NOx‐ 54% of PM
Air PollutionAir Pollution
9

• Road
Accident
• Injuries
• Death
• Stress
Social ImpactSocial Impact

unit 1,000 ton CO2
GHGs Emission by Sector : 2011GHGs Emission by Sector : 2011
Source: Thailand Energy Statistic 2012

Road Mode 96.84%
Air Mode 2.06%
Rail Mode 0.68%
Water Mode 0.42%
Source: National Greenhouse Gas listing
Volumes of Greenhouse gas released by
Thailand’s Transport Sector
Volumes of Greenhouse gas released by
Thailand’s Transport Sector

11th Thailand National Economic and Social Development Plan11th Thailand National Economic and Social Development Plan
(Transport(Transport Sector During Year 2010Sector During Year 2010--2015) 2015)
International Trade
Agreement
Climate Change
Aging
Society
Energy
• Change to Alternative Energy , Green Energy and Efficiency use in Energy
• Road and Rail integrated Network around country and Neighboring Country
• Improve Multi-modal Transportation• Improve Transport System, Efficiency , Effectiveness, Accessibility,
Safety ,Transport for all, (Aging people and Handicap) • More Public Private Participation(PPP) Investment
Sub – regional
Corporation

Environment
Economic
SocialSocial
International Driving Force : EST forum,Rio+20, UNFCCC
Internal Driving force
Internal Driving force
Master Plan DevelopmentMaster Plan Development
Environmental Environmental Sustainable Sustainable Transport Transport MasterplanMasterplan

Economic prosperity Decrease economic loss
(VOT, VOC)Increase Competitiveness
Environmental friendlyEnergy saving, Energy efficiency
Reduce air emission& GHGs reduction
Social & Quality of lifeSafety, Accessibility,Equity, Sufficiency
Sustainable Sustainable
TransportTransport
Ministry of Transport
Vision : Toward Sustainable Transport
Transport and Traffic Development Master Plan 2011 ‐ 2020

SUSTAINABLE TRANSPORT MASTER PLAN
Bangkok DeclarationBangkok DeclarationEST 2010 EST 2010 -- 20202020
Avoid Avoid Shift Shift ImproveImprove

STRATEGY
Strategy 1:Upgrade capability of agencies and personnel for the development of an environmentally sustainable transport system.
Strategy 2:Establish appropriate plans and mechanisms for interfacing and monitoring of transport and traffic work plans/measures/projects; and to move them forward to implementation.
Strategy 3:Establish comprehensive and inter-connected transport infrastructure.
Strategy 4: Efficient transport management for sustainability and greenhouse gas reduction.
Strategy 5: Promote transport R&D and adoption of environment-friendly innovations and technologies.
Strategy 6:Promote public awareness of the environment.


1. การเตรียมรถตวัอยาง
2. การนํารถขึ้นแทนทดสอบ 3. การเตรียมขอมูลรถทดสอบและรูปแบบการขับขี่
4. การเตรียมเครื่องมือและระบบทดสอบ
5. การเตรียมกระดาษกรองในกรณีทดสอบรถยนตดีเซล
6. การดําเนินการทดสอบมลพิษจากรถยนต7. การวเิคราะหขอมูล
8. การประมวลผลขอมูล
Emission Test (Laboratory Test)
1122 33
44
55
6677
88
20

21
Mode share
Load factor
Land-use patterns
Network design
Carbon content of fuel
Fuel efficiency
Behaviour Design Technology
Emissions per mode (CO2-eq.)
Number of vehicles
Distance travelled
Emissions per vehicle-distance travelled
= x x
Mode share
Load factor
Land-use patterns
Network design
Carbon content of fuel
Fuel efficiency
Behaviour Design Technology
Emissions per mode (CO2-eq.)
Number of vehicles
Distance travelled
Emissions per vehicle-distance travelled
= x x
ปริมาณมลพิษ = จํานวนเที่ยวการเดินทาง X ระยะทางที่เดินทาง X ตัวคูณการปลอยมลพิษปริมาณมลพิษ = จํานวนเที่ยวการเดินทาง X ระยะทางที่เดินทาง X ตัวคูณการปลอยมลพิษ
GHGs Analysis by project/programme
1. คํานวณการลดการปลอยกาซเรือนกระจก (%) ในพื้นทีอ่ทิธิพลของโครงการโดยใชสมมตฐิานการเปลี่ยนแปลงการเดินทางในสมการ Equation - ASI

22
Transport Model : Transport Model :
YearGrowth
Rate
CO2
NAM2553 34.84
2554 2.41% 36.43
2560 3.20% 43.99
2573 3.20% 62.30
YearGrowth
Rate
CO2
e‐BUM2553 18.05
2554 3.20% 18.21
2560 3.20% 24.35
2573 3.20% 35.90
Nationally
NAM
BMR
e-BUM
**Energy Consumption
CO2
Energy24,594 57.07
25,186 58.44
30,425 70.60
46,810 108.62
** Energy Consumption
CO2
Energy 11,347 25.22
11,710 26.03
14,146 30.47
21,305 37.98
ผลตาง
22.23
22.01
26.61
46.32
ผลตาง
7.17
7.82
6.12
2.08
*ปริมาณกาซ CO2 หนวยเปน ลานตัน
**การใชพลังงานในภาคขนสง หนวย ktoe

GHGs emission from Transport sector

Potential GHGs reduction in Transportation Sector
Year GHGs at BAU(Million tons CO2 e)
Potential of GHGs reduction
(Million tons CO2 e)
%
2005 57.52 - -
2017 67.53 11 - 13 16 - 19
2020 74.02 15 - 16 20 - 22
2030 102.82 27 - 30 26 - 29

Thailand’s EST Master Plan 120projects/plans/policies
• Safety :Decade of road safety
•Climate Change•Awareness
Most difficult
Implementing
Largely Implemented
Largely Implemented
Not yet