text syllabus api-209 fall 2016 - fv
TRANSCRIPT
1
Advanced Quantitative Methods I (API-209) Harvard Kennedy School
Course Syllabus – Fall 2017
Aug 8 Version
Faculty: Dan Levy Faculty Assistant: Evan Abramsky
Office: Rubenstein 136 (R136) Office: Rubenstein 311F
Phone: (617) 496-4281 E-mail: [email protected]
E-mail: [email protected]
Key people:
Teaching Fellow: Jason Goldrosen: [email protected]
Course Assistants: Astrid Pineda: [email protected]
Erich Nussbaumer: [email protected]
Layla O’Kane: [email protected]
Course Description:
The goal of this course is to prepare you to analyze public policy issues using statistics. Key topics in the
course are in the areas of probability theory, sampling, estimation, hypothesis testing, and regression
analysis. While many students taking this class will have already taken courses in statistical inference and
regression analysis, this course will place a much stronger emphasis than typical courses on conceptually
understanding the underlying methods. Since the course is targeted to first-year students in the MPA-ID
program, we will not shy away from using mathematical tools, but the emphasis of the course will be on
the conceptual understanding and application of the tools rather than on the math or the mechanics behind
the tools. So for example, when studying hypothesis testing, we will place a heavier emphasis on what the
test is doing, when to use it and how to interpret its results, than on mathematical proofs underpinning the
test or on mechanical repetitions of the calculations involved in conducting the test.
The ultimate goal is that by the end of this course you will be able to:
1. Conceptually understand the statistical methods studied in the course and be able to apply them to
a wide range of public policy issues.
2. Interpret the results of statistical analyses and think critically about the potential issues that arise
when trying to draw conclusions from such results.
3. Conduct statistical analyses using Excel and a statistical package called Stata.
Class Meetings: Classes: Tuesdays and Thursdays, 11:45 am – 1:00 pm, Starr
Review sessions: Session #1: Fr 1:15-2:30, Starr
Session #2: Fr 2:45-4:00, Starr
[You only need to attend one session]
Office Hours:
Fridays, 2:30 – 5:00, R136. (Sign-up sheet posted on office door)
Office hours for TF and CAs will be posted on the Canvas course website.
2
Prerequisites:
The main prerequisite for this course is an understanding of calculus at the level of a typical
undergraduate calculus course. However, as far as mathematics goes, the most important prerequisite is a
certain level of “mathematical sophistication,” i.e. comfort in dealing with mathematical constructs and
arguments. Experience with computer programming is helpful. Target Students:
This course is required for first-year students in the MPA/ID program. Students not in the MPA/ID
program will be admitted only with permission of the instructor. Familiarity with the concepts indicated
in the background section of the schedule (last column of table below) will be assumed. Students looking
for a more mathematical course should consider EC2110 and EC2140 (offered by the Economics
Department at the Faculty of Arts and Sciences). Students looking for a less mathematical course should
consider API-201 and API-205 (both offered here at HKS).
Note: In general, I strive to welcome to the class non-MPA/ID students for whom API-209 is the best
option. But unfortunately, I can only accept a limited number of students. Hence, unless you have
compelling reasons to take this particular course, I suggest you consider taking another course. A list of
many courses related to statistics offered at Harvard can be found here.
Texts and Other Course Materials:
Key Recommended Textbook:
Introductory Econometrics: A Modern Approach, by Jeffrey Wooldridge, South-Western, Fourth
Edition, 2009. [W]. This textbook will be used mainly for regression analysis, and may be a useful
book to have for API-210. This book is available for purchase at the Harvard Coop.
Background Textbooks:
Mathematical Statistics with Applications, by Wackerly, Mendenhall and Scheaffer, Duxbury,
Seventh Edition, 2008. [WMS]. This textbook is mainly for the first half of the course. Recommended
if you do not already have a good mathematical statistics textbook.
Probability and Statistics, by DeGroot and Schervish, Addison Wesley, Fourth Edition, 2012: This
textbook is similar to WMS both in style and mathematical sophistication, but is organized slightly
differently.
Mind on Statistics, by Utts and Heckard, Thomson, Fourth Edition, 2012. This book is at a much
lower mathematical level than WMS but provides more examples of the use of statistics in everyday
life.
Note: All the textbooks listed above are on reserve at the library and available at the Harvard Coop.
Stata: Completing most problem sets will require the use of a statistical package called Stata. The version you
need is Intercooled Stata or better; Small Stata will not be adequate for this course. If you don’t have easy
access to a computer with Stata or don’t want to do all your Stata work in computer labs, you may want to
consider purchasing this software package from Stata directly (details here:
http://www.stata.com/order/new/edu/gradplans/student-pricing/).
Handouts:
Handouts will be distributed throughout the course. The main objective of the handouts is to facilitate the
process of taking notes so that you can fully engage in class. They are not meant to substitute for class
attendance or for studying the assigned reading material. Handouts will contain blank spaces for you to
fill in during class, usually in response to questions.
Course website:
Course materials will be posted on the Canvas course website for API-209. The link is here:
https://canvas.harvard.edu/courses/33321.
3
Grading:
The class grade will be based on the following criteria:
10% - Problem sets
15% - Class participation and engagement
15% - Final Exercise
25% - Midterm exam
35% - Final exam
Problem Sets (10%)
Problem sets will be assigned almost every week. They will give you hands-on experience with the
analytic techniques introduced in class. You should plan to spend approximately 8-10 hours on each
problem set. Problem sets will be posted on the course website, as will suggested answers. They will be
graded on a three-point scale:
3 points = check-plus
2 points = check
1 point = check-minus
Problem sets not received by the deadline will be considered late. There will be no credit for late
assignments. The lowest problem set grade will be dropped when calculating the average grade for the
problem sets.
Under the Harvard Kennedy School Academic Code, the problem sets for this course are “Type II”
assignments unless indicated otherwise. You are encouraged to work in a study group, but must submit
your own solutions. Examples of assignments that are not in accordance with the HKS academic code
include reprints of substantially identical assignments, printouts of substantially identical Excel tables or
stata log files, and copies of solutions from previous years. Violations of the Academic Code are a serious
violation of academic and professional standards and can lead to a failing grade in the course, failure to
graduate, and even expulsion from the University. I take this issue seriously. If you have questions about
the degree of collaboration allowed or about any other aspect of the Academic Code, please come to see
me. The Kennedy School Academic Code is available at: http://www.hks.harvard.edu/var/ezp_site/storage/fckeditor/file/pdfs/degree-programs/registrar/academic_code.pdf
Instructions for submitting problem sets:
Turn them in electronically via the Canvas course page.
Submit them by 10:00 am on the day they are due. Assignments submitted after class begins will be
considered late.
Indicate on the cover page the names of the classmates you worked with.
Class participation and engagement (15%)
This component of the grade is meant to reward the things you do to contribute to your own learning and
to the learning of your classmates. Below are some of the key vehicles for doing so in this course. For all
these, both quantity and quality will count.
Engagement in class: I strongly believe that student participation can substantially enrich the
learning experience for both the students and the instructor. In this spirit, you are encouraged to
ask questions and to share with the class any relevant insights you may have from your work
experience or from previous exposure to the topic at hand. Effective class participation requires
that you come prepared for class, and that you think about how your comment or question may
enrich the learning experience of your classmates. I also ask that the questions and comments be
brief and related to the topic being discussed. Given that this is a large class, I will sometimes
need to defer questions for a future class or office hours. A strong engagement in class also means
attending class regularly and punctually, engaging actively in both classwide and small group
activities, and in general contributing to a positive learning atmosphere in the classroom.
4
Engagement outside of class: A key goal of the course is to help you use statistical tools in the
real world. Hence, I encourage you to make connections between the tools we study in class and
things you encounter outside of the classroom using the discussion board of the course website.
We will also make Twitter (#api209) an option for course participation. Examples of such
postings include references to news articles, a report that you worked on before coming to the
Kennedy School, reflections on connections with things you have studied in your other core
courses, or perhaps some event or controversy in which statistics is playing a key role. You can
contribute both by starting a discussion and by moving it forward. Finally, you are encouraged to
challenge one another’s thinking and to debate conflicting perspectives.
Final Exercise (15%)
The final exercise will require applying some of the statistical tools learned in class using a real data set.
More details will be provided later in the course.
Midterm Exam (25%):
Please note that midterm exam will be held on Friday, Oct 6, from 8:00 AM to 10:00 AM. It will be a
two-stage exam (see details below).
Final Exam (35%):
Please note that final exam will be held on Wednesday, Dec 6, from 9:00 AM to 12:00 PM. It will also be
a two-stage exam (see details below).
Two-stage exams: The midterm and final exams will be two-stage exams. During Stage 1, you will be
asked to complete the exam individually. This stage will take about 2/3 of the total exam time and will be
worth 90% of your exam grade. After Stage 1, the exams will be collected and you will be given a second
exam that will contain mostly a subset of the questions from the original exam. During Stage 2, you will
be asked to work with a group, reach consensus answers, and submit one copy of the exam for the whole
group. This portion of the exam represents 10% of the grade. If your group grade is lower than your
individual grade, we will use your individual grade as your Stage 2 grade. In other words, your Stage 2
grade can increase your overall exam score, but it cannot lower it.
The main reason we conduct a second stage of the exam is to allow you to learn more during the exam.
Traditional exams tend to be summative rather than formative, and two-stage exams represent an
opportunity to redress this imbalance. The process of discussing your answers with your teammates is a
significant learning opportunity and supports the kind of collaborative learning that we encourage.
Regrade Policy
Requests for reconsideration of grades on exams are not encouraged, and will be accepted only in writing,
with a clear statement of what has been incorrectly graded, and within one week of receiving your graded
exam. Please submit your full exam so grading on all questions can be reconsidered.
All course activities, including class meetings, problem sets, and exams are subject to the HKS Academic
Code and Code of Conduct.
Letter Grades
Grades for each exam and for each component of the course (problem sets, final exercise, and class
participation and engagement) will be standardized (i.e. curved) and then an overall score for the course
will be calculated for each student. This overall score will be translated into a final course letter grade
using the Dean’s Recommended Grade Distribution (available at
http://www.hks.harvard.edu/degrees/registrar/faculty/exams-and-grading/grades)
5
Other items:
Recording Classes
Classes will be video-recorded, and recordings will be available for two purposes. First, to provide you
with the option of reviewing the class so you can clarify or deepen your understanding of a particular
concept. Second, to help me improve my teaching. The recordings will be kept in a protected page that is
accessible to you only via the course site. As a member of our learning community and to stimulate risk-
taking and vigorous debate in class, you are expected to never make any recordings available outside of
our learning community. If you are uncomfortable with classes being recorded, please come and speak
with me.
Use of Data
Data will be collected in various forms in this course. Some forms of data collection will be obvious to
you (such as when responding to a question on a survey) but others might not be (such as someone from
our teaching team recording class participation or the Canvas course website system recording activity
while you are logged in). Whatever the form of data collection, I pledge to use the data to help improve
my teaching and ultimately your learning. This includes using your responses to online quizzes to tailor a
class better to the backgrounds and learning needs of students in the class, conducting research about the
effectiveness of a particular teaching approach, etc. I also pledge to keep your data confidential so that it
can only be used for the purposes of improving teaching and learning or to help you and other students
connect with future professional opportunities. The university-wide policy on use of Canvas data can be
found here.
Tentative Schedule:
Tentative schedule is attached. Adjustments may need to be made and will be communicated as soon as
they are available. W refers to readings from Wooldridge. For a refresher on the concepts indicated in the
background section of the schedule (last column of table below), see Deb Hughes Hallett's excellent
handouts (click on "Math Camp" link here: https://canvas.harvard.edu/courses/5553).
READINGS
Orr, Larry L. 1999. Social Experiments: Evaluating Public Programs with Experimental Methods (Thousand
Oaks, CA: Sage Publications), pp. 103-115.
Oster, Emily. 2014. “Are Mammograms Worth It?” Five ThirtyEight.
Shadish, William R., Thomas D. Cook, and Donald T. Campbell. 2002.” Statistical Conclusion Validity and
Internal Validity,” and “Construct Validity and External Validity.” Chapters 1, 2, and 3 in Experimental and
Quasi-Experimental Designs for Generalized Causal Inference (Boston: Houghton Mifflin). pp. 33-47, 53-
55, 83-96.
Stokey and Zeckhauser, A Primer for Policy Analysis, Chapter 12
The Economist, “Signifying Nothing?” January 31, 2004
The New York Times "Panel Reasserts Mammogram Advice That Triggered Breast Cancer Debate". By Denise
Gradyjan. Jan. 11, 2016
CASES
Case 1903.0: Designing Impact Evaluations: Assessing Jamaica’s PATH Program
Case 2011.0: Providing Pensions for the Poor: Targeting Cash Transfers for the Elderly in Mexico
Case 2043.0: Devil in the Details: Designing a Social Impact Bond Agreement in Medellin.
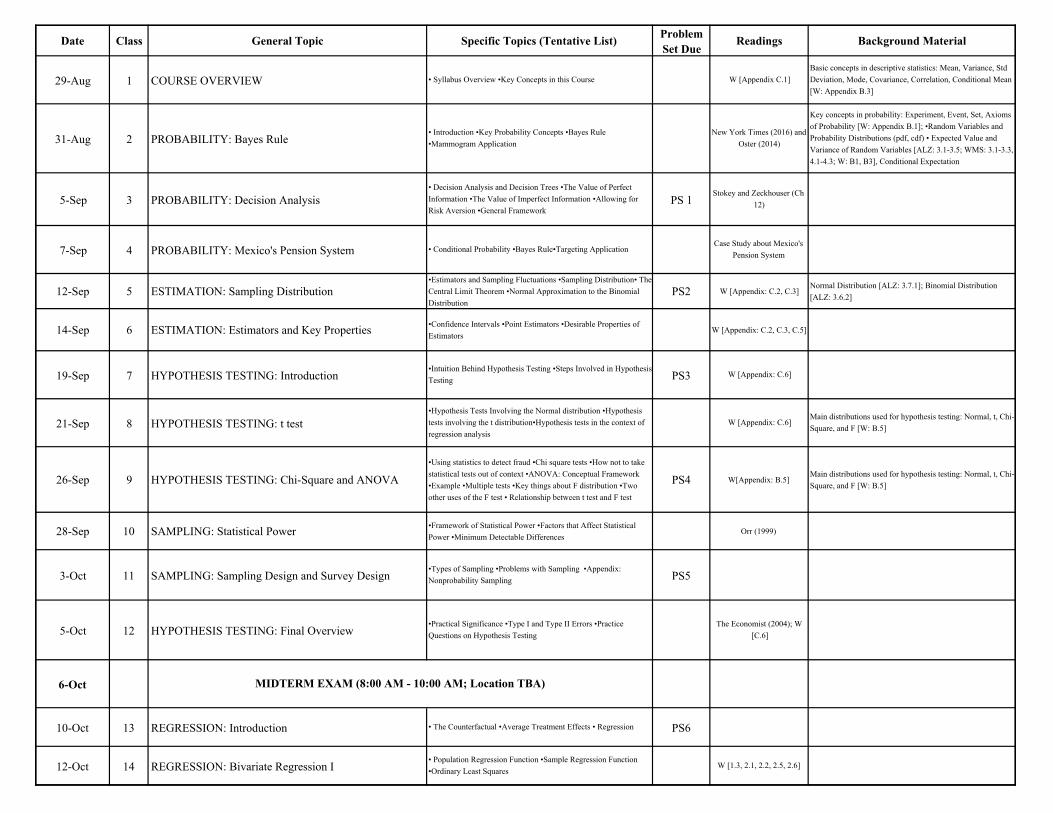
Date Class General Topic Specific Topics (Tentative List) Problem Set Due
Readings Background Material
29-Aug 1 COURSE OVERVIEW • Syllabus Overview •Key Concepts in this Course W [Appendix C.1]Basic concepts in descriptive statistics: Mean, Variance, Std Deviation, Mode, Covariance, Correlation, Conditional Mean [W: Appendix B.3]
31-Aug 2 PROBABILITY: Bayes Rule• Introduction •Key Probability Concepts •Bayes Rule •Mammogram Application
New York Times (2016) and Oster (2014)
Key concepts in probability: Experiment, Event, Set, Axioms of Probability [W: Appendix B.1]; •Random Variables and Probability Distributions (pdf, cdf) • Expected Value and Variance of Random Variables [ALZ: 3.1-3.5; WMS: 3.1-3.3, 4.1-4.3; W: B1, B3], Conditional Expectation
5-Sep 3 PROBABILITY: Decision Analysis• Decision Analysis and Decision Trees •The Value of Perfect Information •The Value of Imperfect Information •Allowing for Risk Aversion •General Framework
PS 1Stokey and Zeckhouser (Ch
12)
7-Sep 4 PROBABILITY: Mexico's Pension System • Conditional Probability •Bayes Rule•Targeting ApplicationCase Study about Mexico's
Pension System
12-Sep 5 ESTIMATION: Sampling Distribution•Estimators and Sampling Fluctuations •Sampling Distribution• The Central Limit Theorem •Normal Approximation to the Binomial Distribution
PS2 W [Appendix: C.2, C.3]Normal Distribution [ALZ: 3.7.1]; Binomial Distribution [ALZ: 3.6.2]
14-Sep 6 ESTIMATION: Estimators and Key Properties •Confidence Intervals •Point Estimators •Desirable Properties of Estimators
W [Appendix: C.2, C.3, C.5]
19-Sep 7 HYPOTHESIS TESTING: Introduction•Intuition Behind Hypothesis Testing •Steps Involved in Hypothesis Testing PS3 W [Appendix: C.6]
21-Sep 8 HYPOTHESIS TESTING: t test•Hypothesis Tests Involving the Normal distribution •Hypothesis tests involving the t distribution•Hypothesis tests in the context of regression analysis
W [Appendix: C.6]Main distributions used for hypothesis testing: Normal, t, Chi-Square, and F [W: B.5]
26-Sep 9 HYPOTHESIS TESTING: Chi-Square and ANOVA•Using statistics to detect fraud •Chi square tests •How not to take statistical tests out of context •ANOVA: Conceptual Framework •Example •Multiple tests •Key things about F distribution •Two other uses of the F test • Relationship between t test and F test
PS4 W[Appendix: B.5]Main distributions used for hypothesis testing: Normal, t, Chi-Square, and F [W: B.5]
28-Sep 10 SAMPLING: Statistical Power •Framework of Statistical Power •Factors that Affect Statistical Power •Minimum Detectable Differences
Orr (1999)
3-Oct 11 SAMPLING: Sampling Design and Survey Design•Types of Sampling •Problems with Sampling •Appendix: Nonprobability Sampling PS5
5-Oct 12 HYPOTHESIS TESTING: Final Overview•Practical Significance •Type I and Type II Errors •Practice Questions on Hypothesis Testing
The Economist (2004); W [C.6]
6-Oct
10-Oct 13 REGRESSION: Introduction • The Counterfactual •Average Treatment Effects • Regression PS6
12-Oct 14 REGRESSION: Bivariate Regression I• Population Regression Function •Sample Regression Function •Ordinary Least Squares
W [1.3, 2.1, 2.2, 2.5, 2.6]
MIDTERM EXAM (8:00 AM - 10:00 AM; Location TBA)
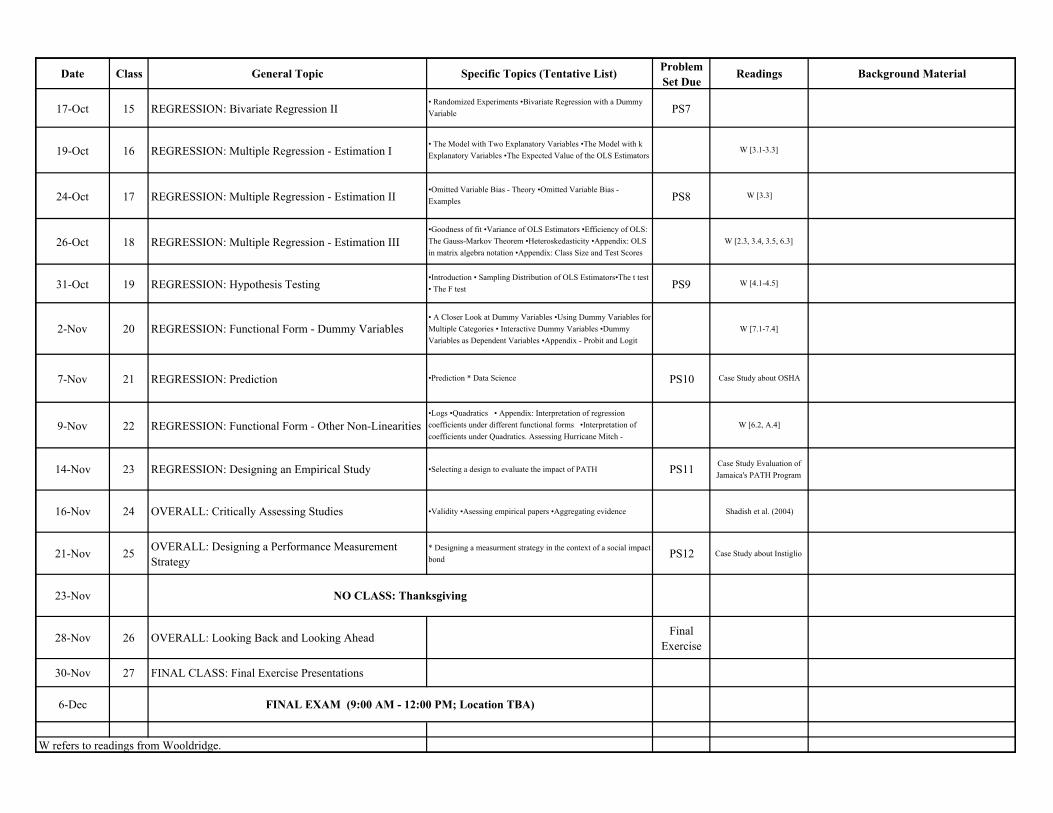
Date Class General Topic Specific Topics (Tentative List) Problem Set Due
Readings Background Material
17-Oct 15 REGRESSION: Bivariate Regression II• Randomized Experiments •Bivariate Regression with a Dummy Variable PS7
19-Oct 16 REGRESSION: Multiple Regression - Estimation I• The Model with Two Explanatory Variables •The Model with k Explanatory Variables •The Expected Value of the OLS Estimators
W [3.1-3.3]
24-Oct 17 REGRESSION: Multiple Regression - Estimation II•Omitted Variable Bias - Theory •Omitted Variable Bias - Examples PS8 W [3.3]
26-Oct 18 REGRESSION: Multiple Regression - Estimation III•Goodness of fit •Variance of OLS Estimators •Efficiency of OLS: The Gauss-Markov Theorem •Heteroskedasticity •Appendix: OLS in matrix algebra notation •Appendix: Class Size and Test Scores
W [2.3, 3.4, 3.5, 6.3]
31-Oct 19 REGRESSION: Hypothesis Testing•Introduction • Sampling Distribution of OLS Estimators•The t test • The F test PS9 W [4.1-4.5]
2-Nov 20 REGRESSION: Functional Form - Dummy Variables• A Closer Look at Dummy Variables •Using Dummy Variables for Multiple Categories • Interactive Dummy Variables •Dummy Variables as Dependent Variables •Appendix - Probit and Logit
W [7.1-7.4]
7-Nov 21 REGRESSION: Prediction •Prediction * Data Science PS10 Case Study about OSHA
9-Nov 22 REGRESSION: Functional Form - Other Non-Linearities•Logs •Quadratics • Appendix: Interpretation of regression coefficients under different functional forms •Interpretation of coefficients under Quadratics. Assessing Hurricane Mitch -
W [6.2, A.4]
14-Nov 23 REGRESSION: Designing an Empirical Study •Selecting a design to evaluate the impact of PATH PS11 Case Study Evaluation of Jamaica's PATH Program
16-Nov 24 OVERALL: Critically Assessing Studies •Validity •Asessing empirical papers •Aggregating evidence Shadish et al. (2004)
21-Nov 25 OVERALL: Designing a Performance Measurement Strategy
* Designing a measurment strategy in the context of a social impact bond PS12 Case Study about Instiglio
23-Nov
28-Nov 26 OVERALL: Looking Back and Looking Ahead Final Exercise
30-Nov 27 FINAL CLASS: Final Exercise Presentations
6-Dec
W refers to readings from Wooldridge.
NO CLASS: Thanksgiving
FINAL EXAM (9:00 AM - 12:00 PM; Location TBA)