texas transportation needs summary · texas transportation needs summary ... lane-miles that are...
TRANSCRIPT
Texas Transportation Needs Summary
About the 2030 CommitteeIn May 2008, Texas Transportation Commission Chair Deirdre Delisi, at the request of Texas Governor Rick Perry, appointed a volunteer committee of 12 experienced and respected business leaders designated as the 2030 Committee. The Committee’s charge was to provide an independent, authoritative assessment of the state’s transportation infrastructure and mobility needs from 2009 to 2030.
The Committee developed goals for the report, as follows:
• Preserveandenhancethevalueofthestate’senormousinvestmentintransportationinfrastructure.
• PreserveandenhanceurbanandruralmobilityandtheirvaluetotheeconomiccompetitivenessofTexas.
• EnhancethesafetyofTexas’travelingpublic.• Initiate a discussion on strategic rebalancing of transportation
investments among infrastructure, mobility and non-highwaymodestoanticipatefutureneeds.
The 2030 Committee provided guidance and direction to a nationally renowned research team of transportation experts at the Texas Transportation Institute (TTI) at The Texas A&M University System; the Center for Transportation Research at The University of Texas at Austin; and the University of Texas at San Antonio. Staff at the Texas Department of Transportation (TxDOT) and the state’s metropolitan planning organizations provided input and support for the research team. More detailed information regarding the Committee’s study is found in the complete 2030CommitteeTexasTransportationNeedsReport.
The 2030 Committee’s work was conducted in a short timeframe of six months. The Committee used several mechanisms to solicit public input to assist in making its recommendations.
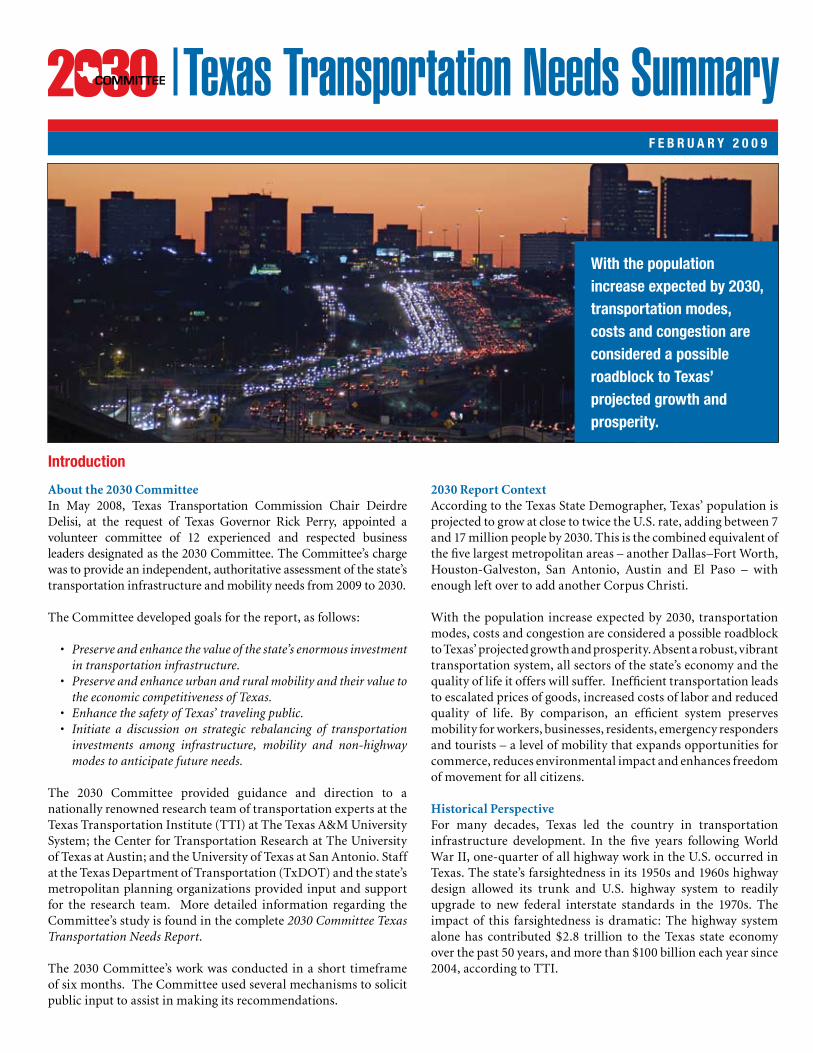
2030 Report Context According to the Texas State Demographer, Texas’ population is projected to grow at close to twice the U.S. rate, adding between 7 and 17 million people by 2030. This is the combined equivalent of the five largest metropolitan areas – another Dallas–Fort Worth, Houston-Galveston, San Antonio, Austin and El Paso – with enough left over to add another Corpus Christi.
With the population increase expected by 2030, transportation modes, costs and congestion are considered a possible roadblock to Texas’ projected growth and prosperity. Absent a robust, vibrant transportation system, all sectors of the state’s economy and the quality of life it offers will suffer. Inefficient transportation leads to escalated prices of goods, increased costs of labor and reduced quality of life. By comparison, an efficient system preserves mobility for workers, businesses, residents, emergency responders and tourists – a level of mobility that expands opportunities for commerce, reduces environmental impact and enhances freedom of movement for all citizens.
Historical PerspectiveFor many decades, Texas led the country in transportation infrastructure development. In the five years following World War II, one-quarter of all highway work in the U.S. occurred in Texas. The state’s farsightedness in its 1950s and 1960s highway design allowed its trunk and U.S. highway system to readily upgrade to new federal interstate standards in the 1970s. The impact of this farsightedness is dramatic: The highway system alone has contributed $2.8 trillion to the Texas state economy over the past 50 years, and more than $100 billion each year since 2004, according to TTI.
With the population increase expected by 2030, transportation modes, costs and congestion are considered a possible roadblock to Texas’ projected growth and prosperity.
F E B R U a R y 2 0 0 9
Introduction
2
Texas Transportation TodayWith its expanding population, Texas has experienced 30 years of increasing highway congestion, both in magnitude and geography. Traffic delay in urban areas has increased more than 500 percent in the last two decades. Many of the quiet rural roads of the 1970s are now part of major urban highway networks. For the past 15 years, construction of highway miles in Texas has greatly lagged behind population growth and vehicle miles traveled in the state’s five largest metropolitan areas. Not coincidentally, travel time delay has increased substantially within the same time period and bumper-to-bumper traffic can even be seen in the middle of the day in some cities. Mobility challenges in rural areas show up through not only increasing congestion, but also through inadequate connecting routes, safety concerns and during hurricane evacuations.
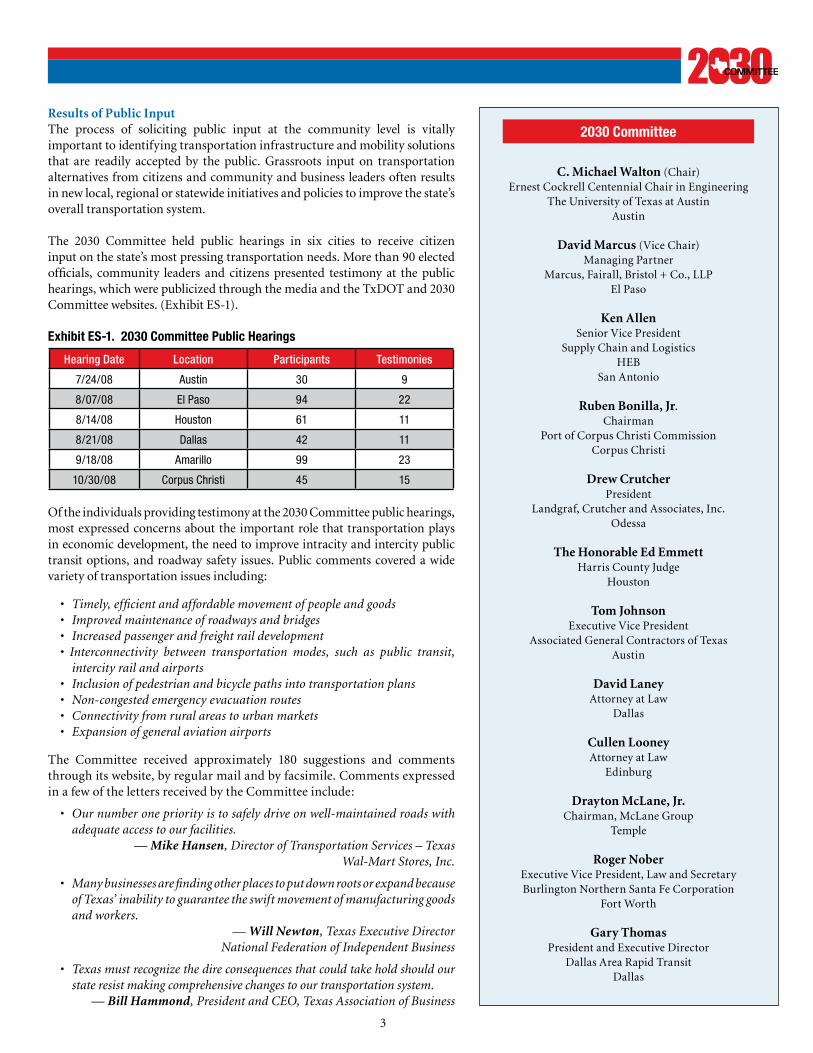
As a result of use and age, Texas’ highway infrastructure is showing signs of deterioration. According to Federal Highway Administration data, passenger vehicle traffic in the United States is expected to increase by more than 30 percent by 2020, with large truck traffic estimated to increase by almost 40 percent. As indicated by the Texas Department of Transportation, a fully loaded tractor-trailer truck damages the highway almost 10,000 times more than a passenger vehicle. Vehicle roadway damage affects smoothness of ride and causes ruts, potholes and cracks in the roadway. Driving on roads that are in disrepair accelerates vehicle deterioration, escalates roadway maintenance costs and increases fuel consumption.
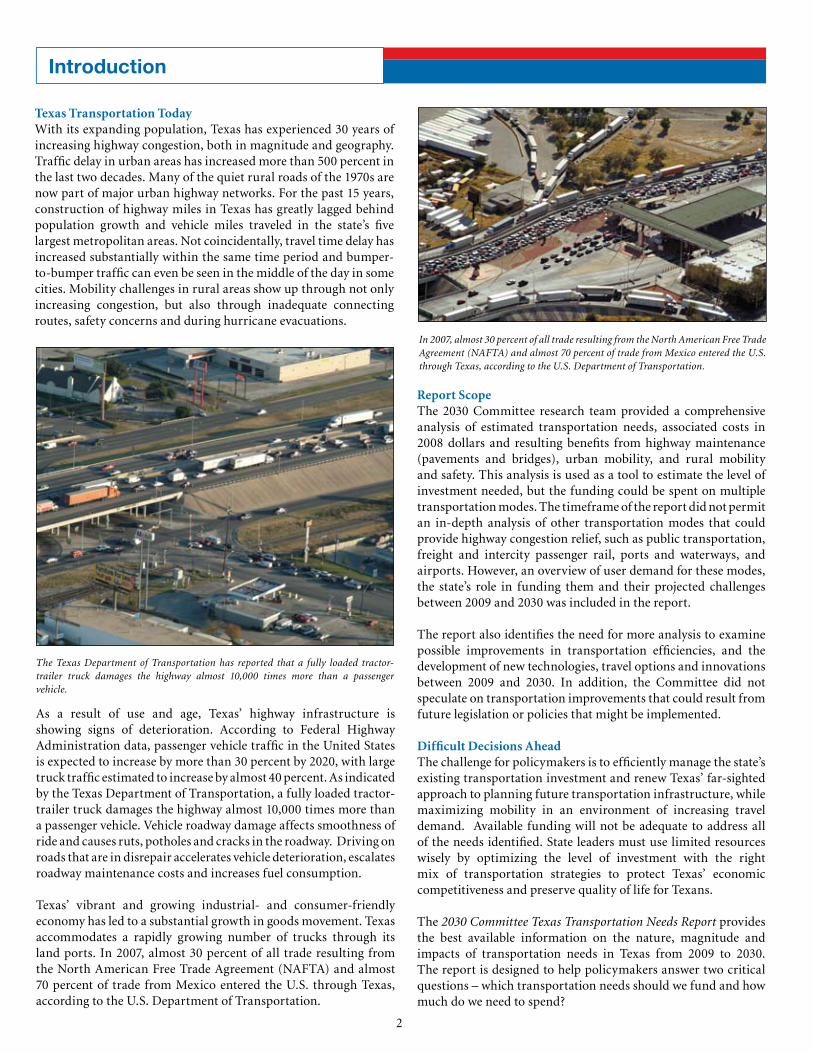
Texas’ vibrant and growing industrial- and consumer-friendly economy has led to a substantial growth in goods movement. Texas accommodates a rapidly growing number of trucks through its land ports. In 2007, almost 30 percent of all trade resulting from the North American Free Trade Agreement (NAFTA) and almost 70 percent of trade from Mexico entered the U.S. through Texas, according to the U.S. Department of Transportation.
Report ScopeThe 2030 Committee research team provided a comprehensive analysis of estimated transportation needs, associated costs in 2008 dollars and resulting benefits from highway maintenance (pavements and bridges), urban mobility, and rural mobility and safety. This analysis is used as a tool to estimate the level of investment needed, but the funding could be spent on multiple transportation modes. The timeframe of the report did not permit an in-depth analysis of other transportation modes that could provide highway congestion relief, such as public transportation, freight and intercity passenger rail, ports and waterways, and airports. However, an overview of user demand for these modes, the state’s role in funding them and their projected challenges between 2009 and 2030 was included in the report.
The report also identifies the need for more analysis to examine possible improvements in transportation efficiencies, and the development of new technologies, travel options and innovations between 2009 and 2030. In addition, the Committee did not speculate on transportation improvements that could result from future legislation or policies that might be implemented.
Difficult Decisions AheadThe challenge for policymakers is to efficiently manage the state’s existing transportation investment and renew Texas’ far-sighted approach to planning future transportation infrastructure, while maximizing mobility in an environment of increasing travel demand. Available funding will not be adequate to address all of the needs identified. State leaders must use limited resources wisely by optimizing the level of investment with the right mix of transportation strategies to protect Texas’ economic competitiveness and preserve quality of life for Texans.
The 2030CommitteeTexasTransportationNeedsReport provides the best available information on the nature, magnitude and impacts of transportation needs in Texas from 2009 to 2030. The report is designed to help policymakers answer two critical questions – which transportation needs should we fund and how much do we need to spend?
In2007,almost30percentofalltraderesultingfromtheNorthAmericanFreeTradeAgreement(NAFTA)andalmost70percentoftradefromMexicoenteredtheU.S.throughTexas,accordingtotheU.S.DepartmentofTransportation.
The Texas Department of Transportation has reported that a fully loaded tractor-trailer truck damages the highway almost 10,000 times more than a passengervehicle.
Introduction
3
Results of Public InputThe process of soliciting public input at the community level is vitally important to identifying transportation infrastructure and mobility solutions that are readily accepted by the public. Grassroots input on transportation alternatives from citizens and community and business leaders often results in new local, regional or statewide initiatives and policies to improve the state’s overall transportation system.
The 2030 Committee held public hearings in six cities to receive citizen input on the state’s most pressing transportation needs. More than 90 elected officials, community leaders and citizens presented testimony at the public hearings, which were publicized through the media and the TxDOT and 2030 Committee websites. (Exhibit ES-1).
Exhibit ES-1. 2030 Committee Public Hearings
Hearing Date Location Participants Testimonies
7/24/08 Austin 30 9
8/07/08 El Paso 94 22
8/14/08 Houston 61 11
8/21/08 Dallas 42 11
9/18/08 Amarillo 99 23
10/30/08 Corpus Christi 45 15
C. Michael Walton (Chair)Ernest Cockrell Centennial Chair in Engineering
The University of Texas at AustinAustin
David Marcus (Vice Chair)Managing Partner
Marcus, Fairall, Bristol + Co., LLPEl Paso
Ken AllenSenior Vice President
Supply Chain and LogisticsHEB
San Antonio
Ruben Bonilla, Jr.Chairman
Port of Corpus Christi CommissionCorpus Christi
Drew CrutcherPresident
Landgraf, Crutcher and Associates, Inc.Odessa
The Honorable Ed EmmettHarris County Judge
Houston
Tom JohnsonExecutive Vice President
Associated General Contractors of TexasAustin
David LaneyAttorney at Law
Dallas
Cullen LooneyAttorney at Law
Edinburg
Drayton McLane, Jr.Chairman, McLane Group
Temple
Roger NoberExecutive Vice President, Law and SecretaryBurlington Northern Santa Fe Corporation
Fort Worth
Gary ThomasPresident and Executive Director
Dallas Area Rapid TransitDallas
2030 Committee
Of the individuals providing testimony at the 2030 Committee public hearings, most expressed concerns about the important role that transportation plays in economic development, the need to improve intracity and intercity public transit options, and roadway safety issues. Public comments covered a wide variety of transportation issues including:
• Timely,efficientandaffordablemovementofpeopleandgoods• Improvedmaintenanceofroadwaysandbridges• Increasedpassengerandfreightraildevelopment• Interconnectivity between transportation modes, such as public transit,
intercityrailandairports• Inclusionofpedestrianandbicyclepathsintotransportationplans• Non-congestedemergencyevacuationroutes• Connectivityfromruralareastourbanmarkets• Expansionofgeneralaviationairports
The Committee received approximately 180 suggestions and comments through its website, by regular mail and by facsimile. Comments expressed in a few of the letters received by the Committee include:
• Ournumberonepriorityistosafelydriveonwell-maintainedroadswithadequateaccesstoourfacilities.
—Mike Hansen,DirectorofTransportationServices–TexasWal-MartStores,Inc.
• ManybusinessesarefindingotherplacestoputdownrootsorexpandbecauseofTexas’inabilitytoguaranteetheswiftmovementofmanufacturinggoodsandworkers.
—Will Newton,TexasExecutiveDirectorNationalFederationofIndependentBusiness
• Texasmustrecognizethedireconsequencesthatcouldtakeholdshouldourstateresistmakingcomprehensivechangestoourtransportationsystem.
—Bill Hammond,PresidentandCEO,TexasAssociationofBusiness
4
Pavement Maintenance
Texas Leads in Paved Lane-Miles
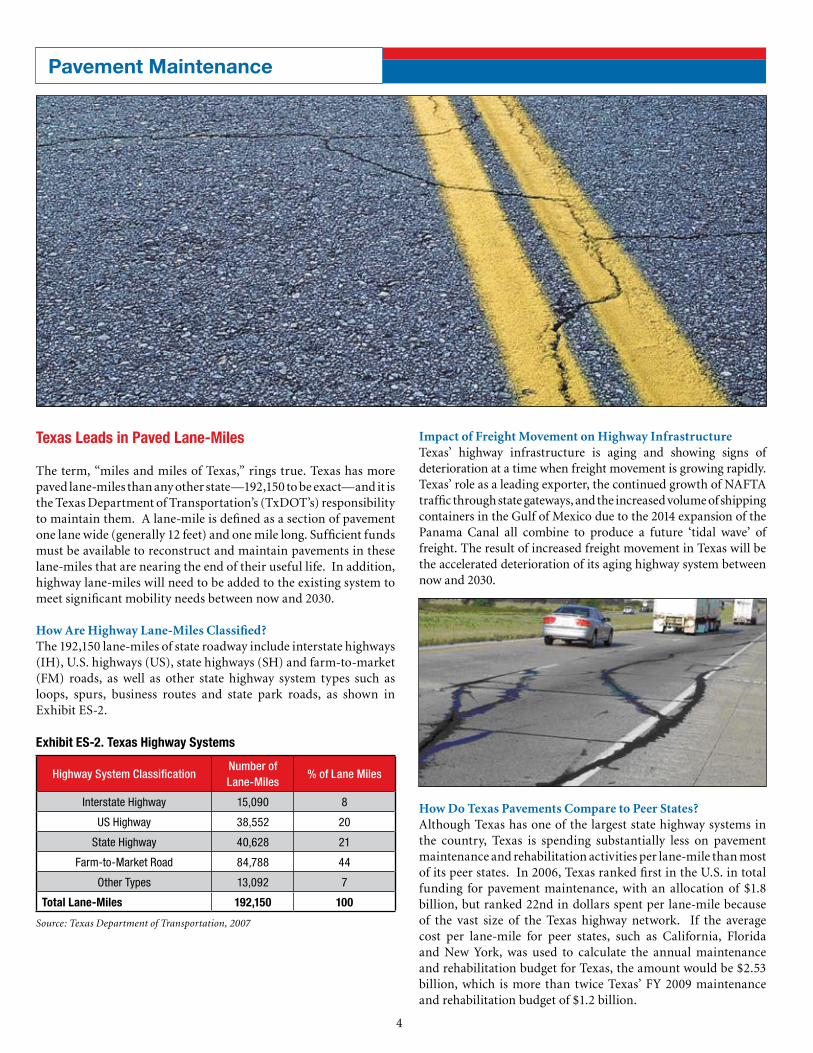
The term, “miles and miles of Texas,” rings true. Texas has more paved lane-miles than any other state—192,150 to be exact—and it is the Texas Department of Transportation’s (TxDOT’s) responsibility to maintain them. A lane-mile is defined as a section of pavement one lane wide (generally 12 feet) and one mile long. Sufficient funds must be available to reconstruct and maintain pavements in these lane-miles that are nearing the end of their useful life. In addition, highway lane-miles will need to be added to the existing system to meet significant mobility needs between now and 2030.
How Are Highway Lane-Miles Classified?The 192,150 lane-miles of state roadway include interstate highways (IH), U.S. highways (US), state highways (SH) and farm-to-market (FM) roads, as well as other state highway system types such as loops, spurs, business routes and state park roads, as shown in Exhibit ES-2.
Impact of Freight Movement on Highway InfrastructureTexas’ highway infrastructure is aging and showing signs of deterioration at a time when freight movement is growing rapidly. Texas’ role as a leading exporter, the continued growth of NAFTA traffic through state gateways, and the increased volume of shipping containers in the Gulf of Mexico due to the 2014 expansion of the Panama Canal all combine to produce a future ‘tidal wave’ of freight. The result of increased freight movement in Texas will be the accelerated deterioration of its aging highway system between now and 2030.
Highway System ClassificationNumber of Lane-Miles
% of Lane Miles
Interstate Highway 15,090 8
US Highway 38,552 20
State Highway 40,628 21
Farm-to-Market Road 84,788 44
Other Types 13,092 7
Total Lane-Miles 192,150 100
Exhibit ES-2. Texas Highway Systems
Source:TexasDepartmentofTransportation,2007
How Do Texas Pavements Compare to Peer States?Although Texas has one of the largest state highway systems in the country, Texas is spending substantially less on pavement maintenance and rehabilitation activities per lane-mile than most of its peer states. In 2006, Texas ranked first in the U.S. in total funding for pavement maintenance, with an allocation of $1.8 billion, but ranked 22nd in dollars spent per lane-mile because of the vast size of the Texas highway network. If the average cost per lane-mile for peer states, such as California, Florida and New York, was used to calculate the annual maintenance and rehabilitation budget for Texas, the amount would be $2.53 billion, which is more than twice Texas’ FY 2009 maintenance and rehabilitation budget of $1.2 billion.
5
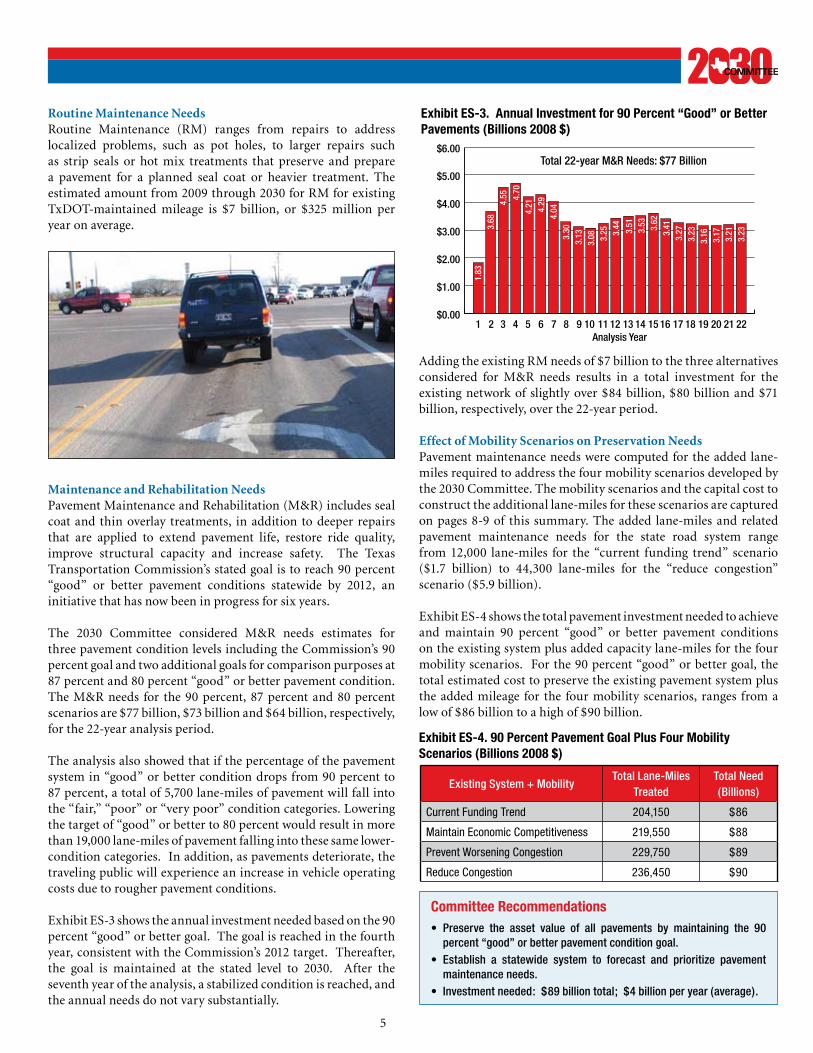
Routine Maintenance NeedsRoutine Maintenance (RM) ranges from repairs to address localized problems, such as pot holes, to larger repairs such as strip seals or hot mix treatments that preserve and prepare a pavement for a planned seal coat or heavier treatment. The estimated amount from 2009 through 2030 for RM for existing TxDOT-maintained mileage is $7 billion, or $325 million per year on average.
Adding the existing RM needs of $7 billion to the three alternatives considered for M&R needs results in a total investment for the existing network of slightly over $84 billion, $80 billion and $71 billion, respectively, over the 22-year period.
Effect of Mobility Scenarios on Preservation NeedsPavement maintenance needs were computed for the added lane-miles required to address the four mobility scenarios developed by the 2030 Committee. The mobility scenarios and the capital cost to construct the additional lane-miles for these scenarios are captured on pages 8-9 of this summary. The added lane-miles and related pavement maintenance needs for the state road system range from 12,000 lane-miles for the “current funding trend” scenario ($1.7 billion) to 44,300 lane-miles for the “reduce congestion” scenario ($5.9 billion).
Exhibit ES-4 shows the total pavement investment needed to achieve and maintain 90 percent “good” or better pavement conditions on the existing system plus added capacity lane-miles for the four mobility scenarios. For the 90 percent “good” or better goal, the total estimated cost to preserve the existing pavement system plus the added mileage for the four mobility scenarios, ranges from a low of $86 billion to a high of $90 billion.
Committee Recommendations• Preserve the asset value of all pavements by maintaining the 90
percent“good”orbetterpavementconditiongoal.• Establish a statewide system to forecast and prioritize pavement
maintenanceneeds.• Investmentneeded:$89billiontotal;$4billionperyear(average).
ExistingSystem+MobilityTotal Lane-Miles
TreatedTotal Need (Billions)
Current Funding Trend 204,150 $86
Maintain Economic Competitiveness 219,550 $88
Prevent Worsening Congestion 229,750 $89
Reduce Congestion 236,450 $90
Exhibit ES-4. 90 Percent Pavement Goal Plus Four Mobility Scenarios (Billions 2008 $)
$0.00
$1.00
$2.00
$3.00
$4.00
$5.00
$6.00Total 22-year M&R Needs: $77 Billion
1 2 3 4 5 6 7 8 9 10 11 12 13 14 15 16 17 18 19 20 21 22Analysis Year
1.83
3.68
4.55 4.
704.
21 4.29
4.04
3.30
3.13
3.08 3.
25 3.44 3.51
3.53 3.62
3.41
3.27
3.23
3.16
3.17
3.21
3.23
Exhibit ES-3. annual Investment for 90 Percent “Good” or Better Pavements (Billions 2008 $)
Maintenance and Rehabilitation Needs Pavement Maintenance and Rehabilitation (M&R) includes seal coat and thin overlay treatments, in addition to deeper repairs that are applied to extend pavement life, restore ride quality, improve structural capacity and increase safety. The Texas Transportation Commission’s stated goal is to reach 90 percent “good” or better pavement conditions statewide by 2012, an initiative that has now been in progress for six years.
The 2030 Committee considered M&R needs estimates for three pavement condition levels including the Commission’s 90 percent goal and two additional goals for comparison purposes at 87 percent and 80 percent “good” or better pavement condition. The M&R needs for the 90 percent, 87 percent and 80 percent scenarios are $77 billion, $73 billion and $64 billion, respectively, for the 22-year analysis period.
The analysis also showed that if the percentage of the pavement system in “good” or better condition drops from 90 percent to 87 percent, a total of 5,700 lane-miles of pavement will fall into the “fair,” “poor” or “very poor” condition categories. Lowering the target of “good” or better to 80 percent would result in more than 19,000 lane-miles of pavement falling into these same lower-condition categories. In addition, as pavements deteriorate, the traveling public will experience an increase in vehicle operating costs due to rougher pavement conditions.
Exhibit ES-3 shows the annual investment needed based on the 90 percent “good” or better goal. The goal is reached in the fourth year, consistent with the Commission’s 2012 target. Thereafter, the goal is maintained at the stated level to 2030. After the seventh year of the analysis, a stabilized condition is reached, and the annual needs do not vary substantially.
6
Texas’ Extensive Bridge Network
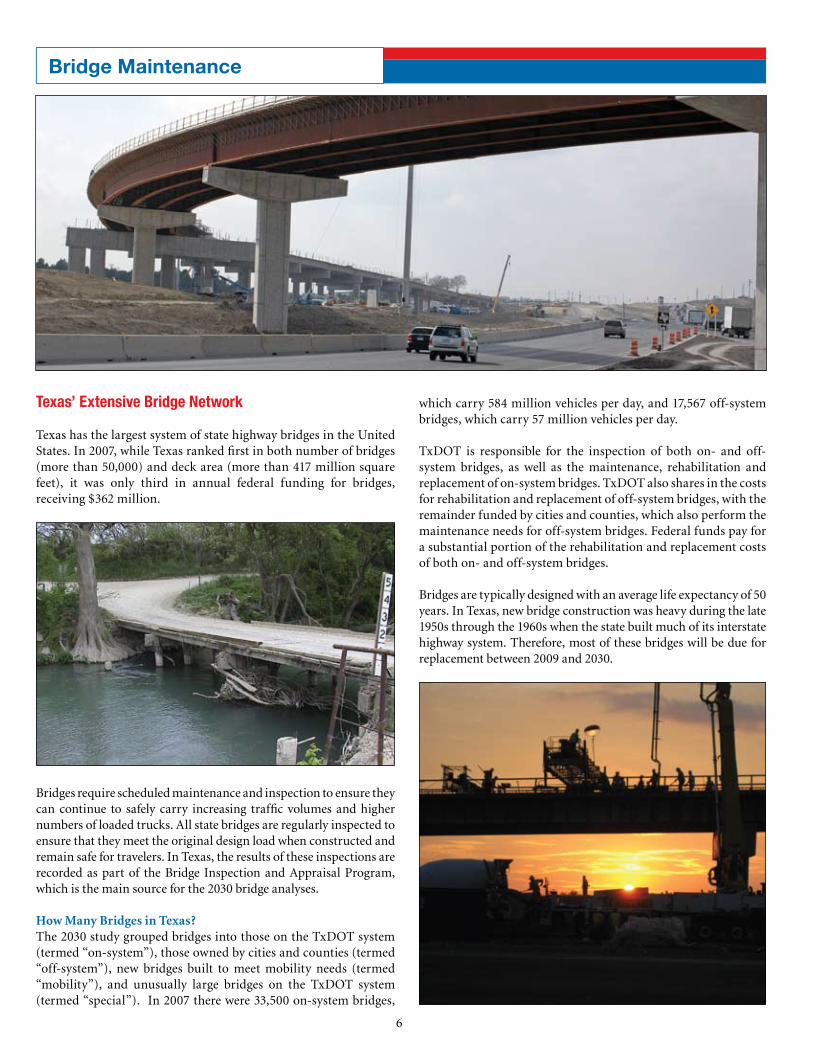
Texas has the largest system of state highway bridges in the United States. In 2007, while Texas ranked first in both number of bridges (more than 50,000) and deck area (more than 417 million square feet), it was only third in annual federal funding for bridges, receiving $362 million.
which carry 584 million vehicles per day, and 17,567 off-system bridges, which carry 57 million vehicles per day.
TxDOT is responsible for the inspection of both on- and off-system bridges, as well as the maintenance, rehabilitation and replacement of on-system bridges. TxDOT also shares in the costs for rehabilitation and replacement of off-system bridges, with the remainder funded by cities and counties, which also perform the maintenance needs for off-system bridges. Federal funds pay for a substantial portion of the rehabilitation and replacement costs of both on- and off-system bridges.
Bridges are typically designed with an average life expectancy of 50 years. In Texas, new bridge construction was heavy during the late 1950s through the 1960s when the state built much of its interstate highway system. Therefore, most of these bridges will be due for replacement between 2009 and 2030.
Bridges require scheduled maintenance and inspection to ensure they can continue to safely carry increasing traffic volumes and higher numbers of loaded trucks. All state bridges are regularly inspected to ensure that they meet the original design load when constructed and remain safe for travelers. In Texas, the results of these inspections are recorded as part of the Bridge Inspection and Appraisal Program, which is the main source for the 2030 bridge analyses.
How Many Bridges in Texas?The 2030 study grouped bridges into those on the TxDOT system (termed “on-system”), those owned by cities and counties (termed “off-system”), new bridges built to meet mobility needs (termed “mobility”), and unusually large bridges on the TxDOT system (termed “special”). In 2007 there were 33,500 on-system bridges,
Bridge Maintenance
7
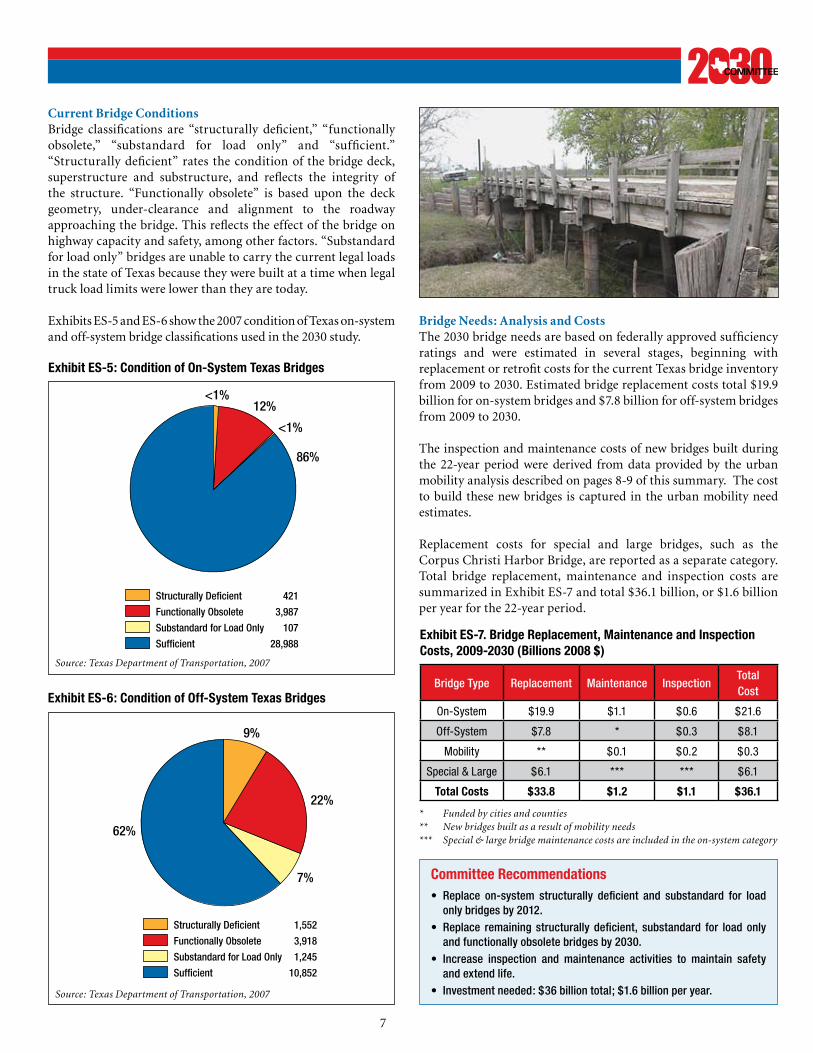
Current Bridge ConditionsBridge classifications are “structurally deficient,” “functionally obsolete,” “substandard for load only” and “sufficient.” “Structurally deficient” rates the condition of the bridge deck, superstructure and substructure, and reflects the integrity of the structure. “Functionally obsolete” is based upon the deck geometry, under-clearance and alignment to the roadway approaching the bridge. This reflects the effect of the bridge on highway capacity and safety, among other factors. “Substandard for load only” bridges are unable to carry the current legal loads in the state of Texas because they were built at a time when legal truck load limits were lower than they are today.
Exhibits ES-5 and ES-6 show the 2007 condition of Texas on-system and off-system bridge classifications used in the 2030 study.
Structurally Deficient 421
Functionally Obsolete 3,987
Substandard for Load Only 107
Sufficient 28,988
86%
12%
<1%
<1%
Exhibit ES-5: Condition of On-System Texas Bridges
Source:TexasDepartmentofTransportation,2007
Bridge Needs: Analysis and CostsThe 2030 bridge needs are based on federally approved sufficiency ratings and were estimated in several stages, beginning with replacement or retrofit costs for the current Texas bridge inventory from 2009 to 2030. Estimated bridge replacement costs total $19.9 billion for on-system bridges and $7.8 billion for off-system bridges from 2009 to 2030.
The inspection and maintenance costs of new bridges built during the 22-year period were derived from data provided by the urban mobility analysis described on pages 8-9 of this summary. The cost to build these new bridges is captured in the urban mobility need estimates.
Replacement costs for special and large bridges, such as the Corpus Christi Harbor Bridge, are reported as a separate category. Total bridge replacement, maintenance and inspection costs are summarized in Exhibit ES-7 and total $36.1 billion, or $1.6 billion per year for the 22-year period.
Structurally Deficient 1,552
Functionally Obsolete 3,918
Substandard for Load Only 1,245
Sufficient 10,852
62%
9%
22%
7%
Exhibit ES-6: Condition of Off-System Texas Bridges
Committee Recommendations• Replace on-system structurally deficient and substandard for load
onlybridgesby2012.• Replace remaining structurally deficient, substandard for load only
andfunctionallyobsoletebridgesby2030.• Increase inspection and maintenance activities to maintain safety
andextendlife.• Investmentneeded:$36billiontotal;$1.6billionperyear.
Exhibit ES-7. Bridge Replacement, Maintenance and Inspection Costs, 2009-2030 (Billions 2008 $)
BridgeType Replacement Maintenance InspectionTotal Cost
On-System $19.9 $1.1 $0.6 $21.6
Off-System $7.8 * $0.3 $8.1
Mobility ** $0.1 $0.2 $0.3
Special & Large $6.1 *** *** $6.1
Total Costs $33.8 $1.2 $1.1 $36.1
* Fundedbycitiesandcounties** Newbridgesbuiltasaresultofmobilityneeds*** Special&largebridgemaintenancecostsareincludedintheon-systemcategory
Source:TexasDepartmentofTransportation,2007
8
Traffic Congestion on the Increase
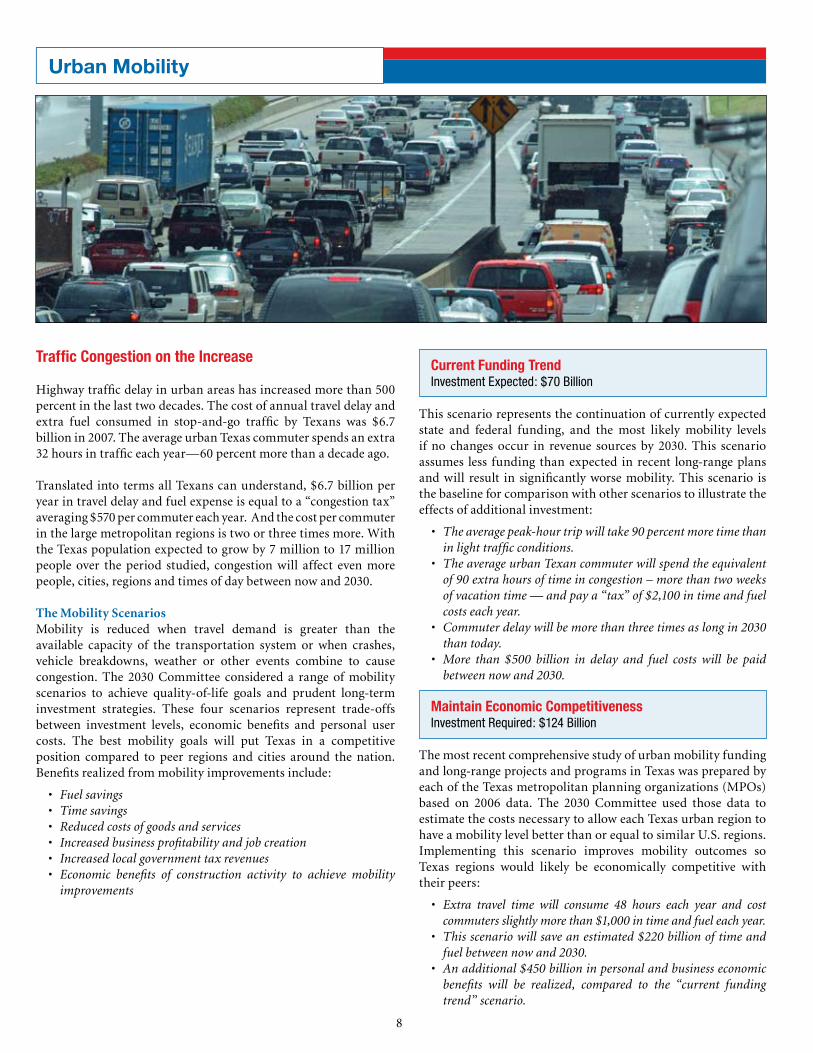
Highway traffic delay in urban areas has increased more than 500 percent in the last two decades. The cost of annual travel delay and extra fuel consumed in stop-and-go traffic by Texans was $6.7 billion in 2007. The average urban Texas commuter spends an extra 32 hours in traffic each year—60 percent more than a decade ago.
Translated into terms all Texans can understand, $6.7 billion per year in travel delay and fuel expense is equal to a “congestion tax” averaging $570 per commuter each year. And the cost per commuter in the large metropolitan regions is two or three times more. With the Texas population expected to grow by 7 million to 17 million people over the period studied, congestion will affect even more people, cities, regions and times of day between now and 2030.
The Mobility ScenariosMobility is reduced when travel demand is greater than the available capacity of the transportation system or when crashes, vehicle breakdowns, weather or other events combine to cause congestion. The 2030 Committee considered a range of mobility scenarios to achieve quality-of-life goals and prudent long-term investment strategies. These four scenarios represent trade-offs between investment levels, economic benefits and personal user costs. The best mobility goals will put Texas in a competitive position compared to peer regions and cities around the nation. Benefits realized from mobility improvements include:
• Fuelsavings• Timesavings• Reducedcostsofgoodsandservices• Increasedbusinessprofitabilityandjobcreation• Increasedlocalgovernmenttaxrevenues• Economic benefits of construction activity to achieve mobility
improvements
Current Funding TrendInvestment Expected: $70 Billion
This scenario represents the continuation of currently expected state and federal funding, and the most likely mobility levels if no changes occur in revenue sources by 2030. This scenario assumes less funding than expected in recent long-range plans and will result in significantly worse mobility. This scenario is the baseline for comparison with other scenarios to illustrate the effects of additional investment:
• Theaveragepeak-hourtripwilltake90percentmoretimethaninlighttrafficconditions.
• TheaverageurbanTexancommuterwillspendtheequivalentof90extrahoursoftimeincongestion–morethantwoweeksofvacationtime—andpaya“tax”of$2,100intimeandfuelcostseachyear.
• Commuterdelaywillbemorethanthreetimesaslongin2030thantoday.
• More than $500 billion in delay and fuel costs will be paidbetweennowand2030.
Maintain Economic Competitiveness Investment Required: $124 Billion
The most recent comprehensive study of urban mobility funding and long-range projects and programs in Texas was prepared by each of the Texas metropolitan planning organizations (MPOs) based on 2006 data. The 2030 Committee used those data to estimate the costs necessary to allow each Texas urban region to have a mobility level better than or equal to similar U.S. regions. Implementing this scenario improves mobility outcomes so Texas regions would likely be economically competitive with their peers:
• Extra travel time will consume 48 hours each year and costcommutersslightlymorethan$1,000intimeandfueleachyear.
• Thisscenariowillsaveanestimated$220billionoftimeandfuelbetweennowand2030.
• Anadditional$450billioninpersonalandbusinesseconomicbenefits will be realized, compared to the “current fundingtrend”scenario.
Urban Mobility
9
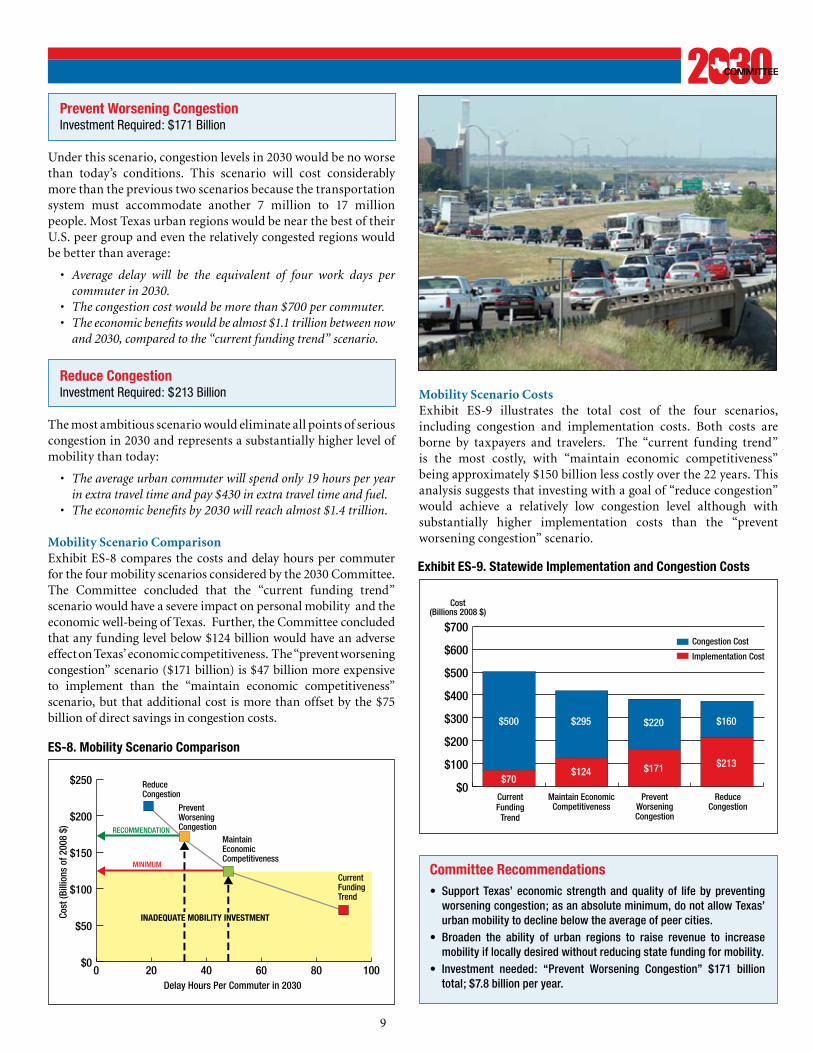
Prevent Worsening Congestion Investment Required: $171 Billion
Under this scenario, congestion levels in 2030 would be no worse than today’s conditions. This scenario will cost considerably more than the previous two scenarios because the transportation system must accommodate another 7 million to 17 million people. Most Texas urban regions would be near the best of their U.S. peer group and even the relatively congested regions would be better than average:
• Average delay will be the equivalent of four work days percommuterin2030.
• Thecongestioncostwouldbemorethan$700percommuter.• Theeconomicbenefitswouldbealmost$1.1trillionbetweennow
and2030,comparedtothe“currentfundingtrend”scenario.
Reduce Congestion Investment Required: $213 Billion
The most ambitious scenario would eliminate all points of serious congestion in 2030 and represents a substantially higher level of mobility than today:
• Theaverageurbancommuterwillspendonly19hoursperyearinextratraveltimeandpay$430inextratraveltimeandfuel.
• Theeconomicbenefitsby2030willreachalmost$1.4trillion.
Mobility Scenario ComparisonExhibit ES-8 compares the costs and delay hours per commuter for the four mobility scenarios considered by the 2030 Committee. The Committee concluded that the “current funding trend” scenario would have a severe impact on personal mobility and the economic well-being of Texas. Further, the Committee concluded that any funding level below $124 billion would have an adverse effect on Texas’ economic competitiveness. The “prevent worsening congestion” scenario ($171 billion) is $47 billion more expensive to implement than the “maintain economic competitiveness” scenario, but that additional cost is more than offset by the $75 billion of direct savings in congestion costs.
Mobility Scenario CostsExhibit ES-9 illustrates the total cost of the four scenarios, including congestion and implementation costs. Both costs are borne by taxpayers and travelers. The “current funding trend” is the most costly, with “maintain economic competitiveness” being approximately $150 billion less costly over the 22 years. This analysis suggests that investing with a goal of “reduce congestion” would achieve a relatively low congestion level although with substantially higher implementation costs than the “prevent worsening congestion” scenario.
Committee Recommendations• Support Texas’ economic strength and quality of life by preventing
worseningcongestion;asanabsoluteminimum,donotallowTexas’urbanmobilitytodeclinebelowtheaverageofpeercities.
• Broaden the ability of urban regions to raise revenue to increasemobilityiflocallydesiredwithoutreducingstatefundingformobility.
• Investment needed: “Prevent Worsening Congestion” $171 billiontotal;$7.8billionperyear.
Exhibit ES-9. Statewide Implementation and Congestion Costs
Congestion Cost
Implementation Cost
Cost(Billions 2008 $)
CurrentFunding
Trend
Maintain EconomicCompetitiveness
PreventWorseningCongestion
ReduceCongestion
$0
$100
$200
$300
$400
$500
$600
$700
$500 $295 $220 $160
$124 $171 $213
$70
0 20 40 60 80 100$0
$50
$100
$150
$200
$250
Delay Hours Per Commuter in 2030
Cost
(Bill
ions
of 2
008
$)
CurrentFundingTrend
ReduceCongestion
PreventWorseningCongestion
MaintainEconomicCompetitiveness
RECOMMENDATION
MINIMUM
INADEQUATE MOBILITY INVESTMENT
ES-8. Mobility Scenario Comparison
10
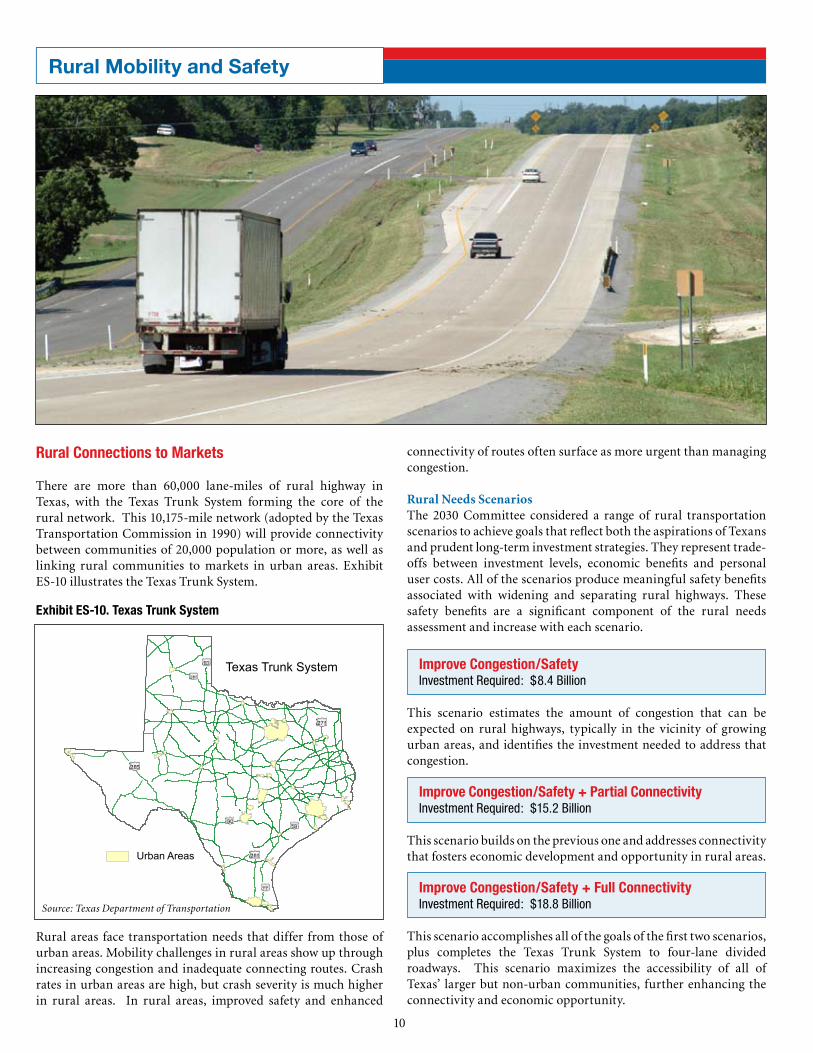
Rural Connections to Markets
There are more than 60,000 lane-miles of rural highway in Texas, with the Texas Trunk System forming the core of the rural network. This 10,175-mile network (adopted by the Texas Transportation Commission in 1990) will provide connectivity between communities of 20,000 population or more, as well as linking rural communities to markets in urban areas. Exhibit ES-10 illustrates the Texas Trunk System.
connectivity of routes often surface as more urgent than managing congestion.
Rural Needs ScenariosThe 2030 Committee considered a range of rural transportation scenarios to achieve goals that reflect both the aspirations of Texans and prudent long-term investment strategies. They represent trade-offs between investment levels, economic benefits and personal user costs. All of the scenarios produce meaningful safety benefits associated with widening and separating rural highways. These safety benefits are a significant component of the rural needs assessment and increase with each scenario.
Improve Congestion/SafetyInvestment Required: $8.4 Billion
This scenario estimates the amount of congestion that can be expected on rural highways, typically in the vicinity of growing urban areas, and identifies the investment needed to address that congestion.
Improve Congestion/Safety + Partial ConnectivityInvestment Required: $15.2 Billion
This scenario builds on the previous one and addresses connectivity that fosters economic development and opportunity in rural areas.
Improve Congestion/Safety + Full ConnectivityInvestment Required: $18.8 Billion
This scenario accomplishes all of the goals of the first two scenarios, plus completes the Texas Trunk System to four-lane divided roadways. This scenario maximizes the accessibility of all of Texas’ larger but non-urban communities, further enhancing the connectivity and economic opportunity.
Rural areas face transportation needs that differ from those of urban areas. Mobility challenges in rural areas show up through increasing congestion and inadequate connecting routes. Crash rates in urban areas are high, but crash severity is much higher in rural areas. In rural areas, improved safety and enhanced
Exhibit ES-10. Texas Trunk System
Urban Areas
Texas Trunk System
Source:TexasDepartmentofTransportation
Rural Mobility and Safety
11
Benefits of InvestmentMobility Benefits
• Fuelsavings• Timesavings• Reducedcostsofgoodsandservices• Increasedbusinessprofitabilityandjobcreation• Increasedlocalgovernmenttaxrevenues• Economic benefits of construction activity to achieve mobility
improvements
Connectivity Benefits• Economicgrowth• Catalystfordevelopment,businessrelocationandexpansion• Increasedjobcreation• Increasedannualincome• Increasedlocalgovernmenttaxrevenues
Safety BenefitsSafety benefits result from widening and separating roads to accomplish rural mobility and connectivity goals. Exhibit ES-11 estimates the reduction in crash fatalities, injuries and possible injuries associated with each of the three rural needs scenarios.
DeathsandInjuriesAvoidedinYear2030
RuralScenarios FatalitiesSevereInjuries
Minor Injuries
Possible Injuries
Improve Congestion/Safety 53 219 714 1,364
Improve Congestion/Safety +Partial Connectivity
113 406 1,259 2,062
Improve Congestion/Safety +Full Connectivity
137 473 1,415 2,212
The resulting 22-year safety benefits added to the previous mobility and connectivity benefits are shown in Exhibit ES-12.
RuralScenariosFuel and
Time Savings
ReducedCostofDoingBusiness(DirectSavings)
EconomicImpactofBusinessSavings(IndirectSavings)
Local Government
TaxRevenues
EconomicImpactof
Construction Activity
Safety*Total
Benefits**
Congestion/Safety $260 $9,700 $1,100 $360 $31,100 $3,600 $46,100
Congestion/Safety +Partial Connectivity
$770 $19,200 $2,200 $660 $56,200 $7,100 $86,100
Congestion/Safety +Full Connectivity
$1,000 $23,700 $2,700 $810 $69,400 $8,400 $106,000
*NationalSafetyCouncilcombinedsocietalcosts.**Roundedtonearest$100million.
Exhibit ES-11. Estimated annual Safety Improvements Resulting from Each Scenario
Exhibit ES-12. Summary of Estimated Benefits in 2030 for Rural Scenarios (Millions 2008 $)
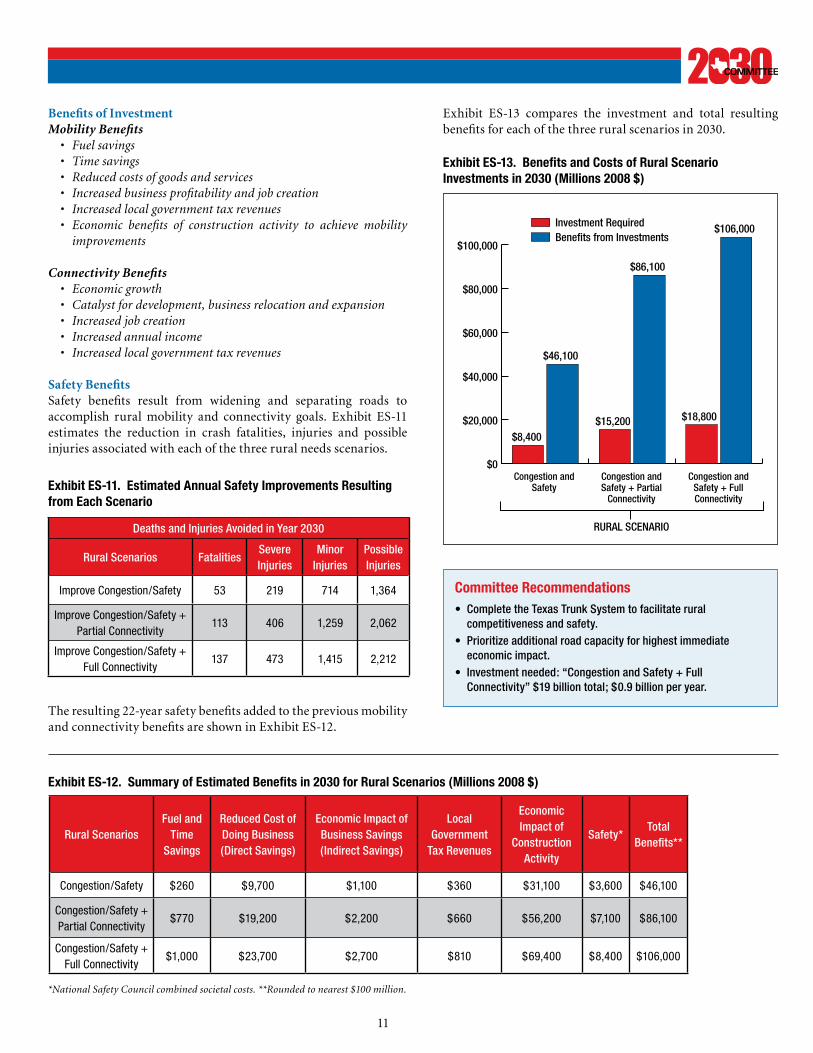
Exhibit ES-13 compares the investment and total resulting benefits for each of the three rural scenarios in 2030.
$0
$20,000
$40,000
$60,000
$80,000
$100,000
Investment RequiredBenefits from Investments
Congestion andSafety
Congestion andSafety + Partial
Connectivity
Congestion andSafety + FullConnectivity
RURAL SCENARIO
$8,400
$46,100
$15,200
$86,100
$18,800
$106,000
Exhibit ES-13. Benefits and Costs of Rural Scenario Investments in 2030 (Millions 2008 $)
Committee Recommendations• CompletetheTexasTrunkSystemtofacilitaterural
competitivenessandsafety.• Prioritizeadditionalroadcapacityforhighestimmediate
economicimpact.• Investmentneeded:“CongestionandSafety+Full
Connectivity”$19billiontotal;$0.9billionperyear.
12
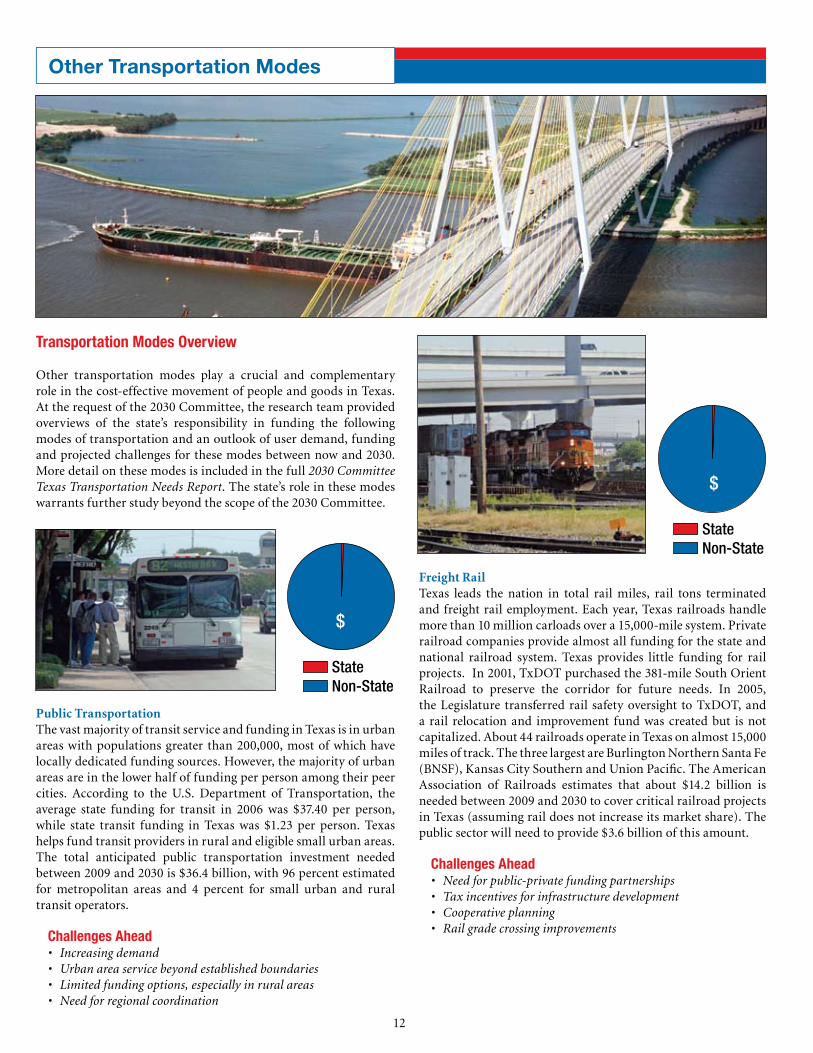
Transportation Modes Overview
Other transportation modes play a crucial and complementary role in the cost-effective movement of people and goods in Texas. At the request of the 2030 Committee, the research team provided overviews of the state’s responsibility in funding the following modes of transportation and an outlook of user demand, funding and projected challenges for these modes between now and 2030. More detail on these modes is included in the full 2030CommitteeTexasTransportationNeedsReport. The state’s role in these modes warrants further study beyond the scope of the 2030 Committee.
Freight RailTexas leads the nation in total rail miles, rail tons terminated and freight rail employment. Each year, Texas railroads handle more than 10 million carloads over a 15,000-mile system. Private railroad companies provide almost all funding for the state and national railroad system. Texas provides little funding for rail projects. In 2001, TxDOT purchased the 381-mile South Orient Railroad to preserve the corridor for future needs. In 2005, the Legislature transferred rail safety oversight to TxDOT, and a rail relocation and improvement fund was created but is not capitalized. About 44 railroads operate in Texas on almost 15,000 miles of track. The three largest are Burlington Northern Santa Fe (BNSF), Kansas City Southern and Union Pacific. The American Association of Railroads estimates that about $14.2 billion is needed between 2009 and 2030 to cover critical railroad projects in Texas (assuming rail does not increase its market share). The public sector will need to provide $3.6 billion of this amount.
Challenges ahead• Needforpublic-privatefundingpartnerships• Taxincentivesforinfrastructuredevelopment• Cooperativeplanning• Railgradecrossingimprovements
Public TransportationThe vast majority of transit service and funding in Texas is in urban areas with populations greater than 200,000, most of which have locally dedicated funding sources. However, the majority of urban areas are in the lower half of funding per person among their peer cities. According to the U.S. Department of Transportation, the average state funding for transit in 2006 was $37.40 per person, while state transit funding in Texas was $1.23 per person. Texas helps fund transit providers in rural and eligible small urban areas. The total anticipated public transportation investment needed between 2009 and 2030 is $36.4 billion, with 96 percent estimated for metropolitan areas and 4 percent for small urban and rural transit operators.
Challenges ahead• Increasingdemand• Urbanareaservicebeyondestablishedboundaries• Limitedfundingoptions,especiallyinruralareas• Needforregionalcoordination
StateNon-State
$
StateNon-State
$
Other Transportation Modes
13
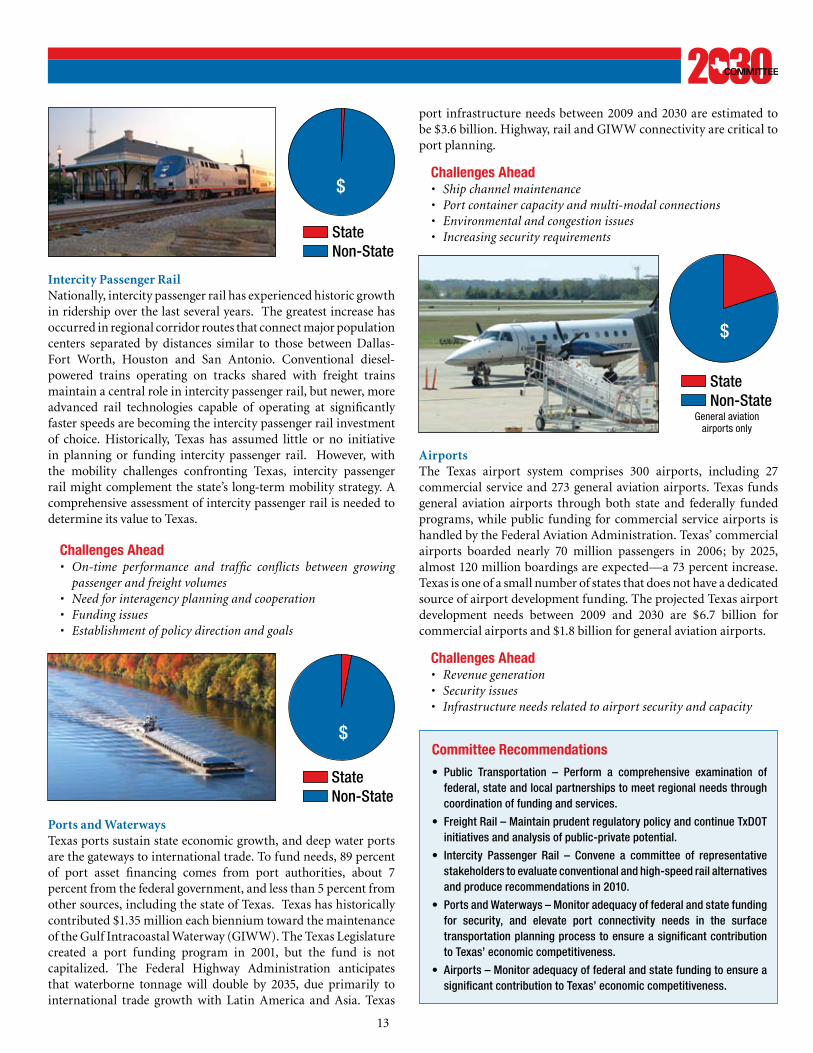
Intercity Passenger Rail Nationally, intercity passenger rail has experienced historic growth in ridership over the last several years. The greatest increase has occurred in regional corridor routes that connect major population centers separated by distances similar to those between Dallas-Fort Worth, Houston and San Antonio. Conventional diesel-powered trains operating on tracks shared with freight trains maintain a central role in intercity passenger rail, but newer, more advanced rail technologies capable of operating at significantly faster speeds are becoming the intercity passenger rail investment of choice. Historically, Texas has assumed little or no initiative in planning or funding intercity passenger rail. However, with the mobility challenges confronting Texas, intercity passenger rail might complement the state’s long-term mobility strategy. A comprehensive assessment of intercity passenger rail is needed to determine its value to Texas.
Challenges ahead• On-time performance and traffic conflicts between growing
passengerandfreightvolumes• Needforinteragencyplanningandcooperation• Fundingissues• Establishmentofpolicydirectionandgoals
port infrastructure needs between 2009 and 2030 are estimated to be $3.6 billion. Highway, rail and GIWW connectivity are critical to port planning.
Challenges ahead• Shipchannelmaintenance• Portcontainercapacityandmulti-modalconnections• Environmentalandcongestionissues• Increasingsecurityrequirements
Ports and WaterwaysTexas ports sustain state economic growth, and deep water ports are the gateways to international trade. To fund needs, 89 percent of port asset financing comes from port authorities, about 7 percent from the federal government, and less than 5 percent from other sources, including the state of Texas. Texas has historically contributed $1.35 million each biennium toward the maintenance of the Gulf Intracoastal Waterway (GIWW). The Texas Legislature created a port funding program in 2001, but the fund is not capitalized. The Federal Highway Administration anticipates that waterborne tonnage will double by 2035, due primarily to international trade growth with Latin America and Asia. Texas
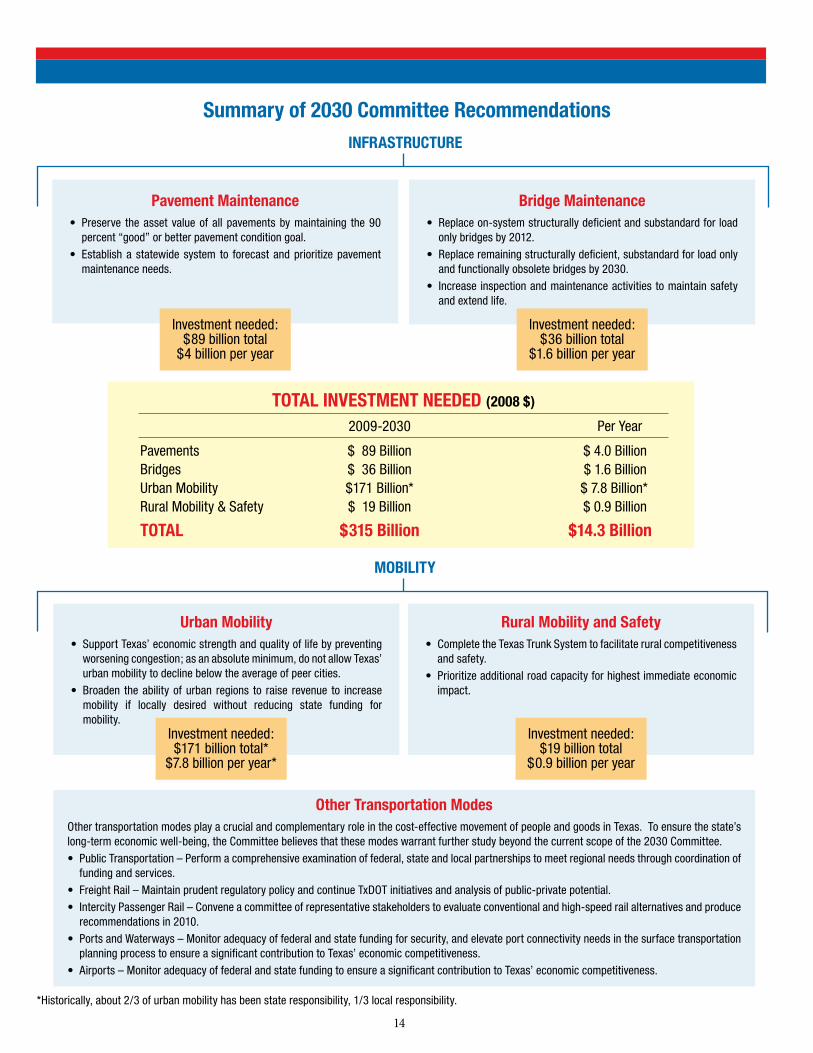
AirportsThe Texas airport system comprises 300 airports, including 27 commercial service and 273 general aviation airports. Texas funds general aviation airports through both state and federally funded programs, while public funding for commercial service airports is handled by the Federal Aviation Administration. Texas’ commercial airports boarded nearly 70 million passengers in 2006; by 2025, almost 120 million boardings are expected—a 73 percent increase. Texas is one of a small number of states that does not have a dedicated source of airport development funding. The projected Texas airport development needs between 2009 and 2030 are $6.7 billion for commercial airports and $1.8 billion for general aviation airports.
Challenges ahead• Revenuegeneration• Securityissues• Infrastructureneedsrelatedtoairportsecurityandcapacity
StateNon-State
$
StateNon-State
$Committee Recommendations
• Public Transportation – Perform a comprehensive examination offederal,stateandlocalpartnershipstomeetregionalneedsthroughcoordinationoffundingandservices.
• FreightRail–MaintainprudentregulatorypolicyandcontinueTxDOTinitiativesandanalysisofpublic-privatepotential.
• Intercity Passenger Rail – Convene a committee of representativestakeholderstoevaluateconventionalandhigh-speedrailalternativesandproducerecommendationsin2010.
• PortsandWaterways–Monitoradequacyoffederalandstatefundingfor security, and elevate port connectivity needs in the surfacetransportation planning process to ensure a significant contribution toTexas’economiccompetitiveness.
• Airports–MonitoradequacyoffederalandstatefundingtoensureasignificantcontributiontoTexas’economiccompetitiveness.
StateNon-State
$
General aviation airports only
14
Summary of 2030 Committee Recommendations
Pavement Maintenance• Preserve theasset valueof all pavementsbymaintaining the90
percent “good” or better pavement condition goal. • Establish a statewide system to forecast andprioritizepavement
maintenance needs.
Bridge Maintenance• Replaceon-systemstructurallydeficientandsubstandardforload
only bridges by 2012. • Replaceremainingstructurallydeficient,substandardforloadonly
and functionally obsolete bridges by 2030. • Increaseinspectionandmaintenanceactivitiestomaintainsafety
and extend life.
TOTaL INVESTMENT NEEDED (2008 $)
2009-2030 Per Year
Pavements $ 89 Billion $ 4.0 BillionBridges $ 36 Billion $ 1.6 BillionUrban Mobility $171 Billion* $ 7.8 Billion*Rural Mobility & Safety $ 19 Billion $ 0.9 Billion
TOTaL $315 Billion $14.3 Billion
Urban Mobility• SupportTexas’economicstrengthandqualityoflifebypreventing
worseningcongestion;asanabsoluteminimum,donotallowTexas’urban mobility to decline below the average of peer cities.
• Broaden theability ofurban regions to raise revenue to increasemobility if locally desired without reducing state funding for mobility.
Rural Mobility and Safety• CompletetheTexasTrunkSystemtofacilitateruralcompetitiveness
and safety.• Prioritizeadditionalroadcapacityforhighestimmediateeconomic
impact.
Other Transportation ModesOthertransportationmodesplayacrucialandcomplementaryroleinthecost-effectivemovementofpeopleandgoodsinTexas.Toensurethestate’slong-term economic well-being, the Committee believes that these modes warrant further study beyond the current scope of the 2030 Committee.• PublicTransportation–Performacomprehensiveexaminationoffederal,stateandlocalpartnershipstomeetregionalneedsthroughcoordinationof
funding and services. • FreightRail–MaintainprudentregulatorypolicyandcontinueTxDOTinitiativesandanalysisofpublic-privatepotential.• IntercityPassengerRail–Conveneacommitteeofrepresentativestakeholderstoevaluateconventionalandhigh-speedrailalternativesandproduce
recommendations in 2010. • PortsandWaterways–Monitoradequacyoffederalandstatefundingforsecurity,andelevateportconnectivityneedsinthesurfacetransportation
planningprocesstoensureasignificantcontributiontoTexas’economiccompetitiveness.• Airports–MonitoradequacyoffederalandstatefundingtoensureasignificantcontributiontoTexas’economiccompetitiveness.
INFRaSTRUCTURE
MOBILITy
Investment needed: $89 billion total
$4 billion per year
Investment needed: $36 billion total
$1.6 billion per year
Investment needed: $19 billion total
$0.9 billion per year
Investment needed: $171 billion total*
$7.8 billion per year*
*Historically, about 2/3 of urban mobility has been state responsibility, 1/3 local responsibility.
15
2030 Research Team
Rob Harrison, Senior Research Scientist and Deputy Director
Mike Murphy, Research Fellow
Karl H. Frank, Warren S. Bellows Centennial Professor in Civil Engineering
Zhanmin Zhang, Associate Professor, Civil, Architectural and Environmental Engineering
Jose Weissmann, Associate Professor, Department of Civil and Environmental Engineering
William R. Stockton, Research Engineer and Executive Associate Agency Director
Timothy J. Lomax, Regents Fellow and Research Engineer, Mobility Analysis
David Ellis, Research Scientist, Mobility Analysis
Terri Parker, Director of Agency Relations and Marketing
Curtis Morgan, Assistant Research Scientist and Program Manager, Rail Research
Jeffrey Arndt, Research Scientist, Transit Mobility
Jeffrey D. Borowiec, Associate Research Scientist, System Planning, Policy and Environment
Linda Cherrington, Research Scientist, Transit Mobility
Jim Kruse, Director, Center for Ports and Waterways
David Ungemah, Associate Research Scientist, System Planning, Policy and Environment
Communications Support: Rhonda Brinkmann, John Henry, Michelle Hoelscher, Jim Lyle, Shanna Yates
Meeting Support: Mary Cearley, Becca Simons
A Member of The Texas A&M University System
Center for Transportation ResearchThe University of Texas at Austin
UTSAThe University of Texas at San Antonio
Photos:JimLyle,TTI;CTR;TexasEagleMarketingandPerformanceOrganization
Web: texas2030committee.tamu.edu