texas quarterly · texas quarterly college station-bryan msa first quarter 2018. compared to same...
TRANSCRIPT

Compared to same quarter last year
$224,500
Up 5.7%
Price Distribution$0 - $99,999 9.3%
$100,000 - $199,999 32.0%$200,000 - $299,999 29.7%$300,000 - $399,999 14.4%$400,000 - $499,999 6.8%$500,000 - $749,999 5.2%$750,000 - $999,999 1.4%
$1,000,000+ 1.3%
Down 2.9%
93,151 in 2018 Q1
Up 2.2%
70,292 in 2018 Q1
Days on market 66Days to close 33
Total 99
Unchanged from 2017 Q1
3.3 Compared to 3.5 in 2017 Q1
Texas Quarterly StatewideFirst quarter 2018

Compared to same quarter last year
$154,000
Up 1.3%
Price Distribution$0 - $99,999 24.9%
$100,000 - $199,999 49.1%$200,000 - $299,999 18.5%$300,000 - $399,999 5.7%$400,000 - $499,999 0.7%$500,000 - $749,999 1.1%$750,000 - $999,999 0.0%
$1,000,000+ 0.0%
Down 7.9%
599 in 2018 Q1
Down 6.5%
459 in 2018 Q1
Days on market 60Days to close 38
Total 98
7 days less than 2017 Q1
3.1 Compared to 3.5 in 2017 Q1
Texas Quarterly Abilene MSAFirst quarter 2018

Compared to same quarter last year
$160,000
Up 3.2%
Price Distribution$0 - $99,999 19.7%
$100,000 - $199,999 46.7%$200,000 - $299,999 22.2%$300,000 - $399,999 6.4%$400,000 - $499,999 1.9%$500,000 - $749,999 2.6%$750,000 - $999,999 0.3%
$1,000,000+ 0.2%
Up 2.5%
953 in 2018 Q1
Down 6%
622 in 2018 Q1
Days on market 57Days to close 34
Total 91
2 days more than 2017 Q1
3.6 Compared to 3.4 in 2017 Q1
Texas Quarterly Amarillo MSAFirst quarter 2018

Compared to same quarter last year
$295,000
Up 3.5%
Price Distribution$0 - $99,999 0.7%
$100,000 - $199,999 11.8%$200,000 - $299,999 38.9%$300,000 - $399,999 21.3%$400,000 - $499,999 11.9%$500,000 - $749,999 10.1%$750,000 - $999,999 2.7%
$1,000,000+ 2.6%
Down 2.8%
6,414 in 2018 Q1
Up 7.7%
7,115 in 2018 Q1
Days on market 66Days to close 36
Total 102
5 days more than 2017 Q1
2.2 Compared to 2.4 in 2017 Q1
Texas Quarterly Austin-Round Rock MSAFirst quarter 2018

Compared to same quarter last year
$137,500
Up 1.9%
Price Distribution$0 - $99,999 34.0%
$100,000 - $199,999 37.3%$200,000 - $299,999 17.1%$300,000 - $399,999 7.8%$400,000 - $499,999 2.5%$500,000 - $749,999 1.2%$750,000 - $999,999 0.1%
$1,000,000+ 0.0%
Down 33.3%
832 in 2018 Q1
Up 5.1%
811 in 2018 Q1
Days on market 83Days to close 13
Total 96
8 days less than 2017 Q1
2.6 Compared to 4.4 in 2017 Q1
Texas Quarterly Beaumont-Port Arthur MSAFirst quarter 2018

Compared to same quarter last year
$140,000
Up 14.8%
Price Distribution$0 - $99,999 28.6%
$100,000 - $199,999 46.8%$200,000 - $299,999 15.4%$300,000 - $399,999 5.8%$400,000 - $499,999 2.0%$500,000 - $749,999 0.7%$750,000 - $999,999 0.5%
$1,000,000+ 0.2%
Down 10.8%
1,643 in 2018 Q1
Down 3.8%
479 in 2018 Q1
Days on market 126Days to close 29
Total 155
7 days less than 2017 Q1
9.0 Compared to 10.1 in 2017 Q1
Texas Quarterly Brownsville-Harlingen MSAFirst quarter 2018

Compared to same quarter last year
$215,950
Up 4.8%
Price Distribution$0 - $99,999 6.9%
$100,000 - $199,999 34.1%$200,000 - $299,999 31.5%$300,000 - $399,999 14.1%$400,000 - $499,999 6.4%$500,000 - $749,999 5.2%$750,000 - $999,999 1.5%
$1,000,000+ 0.3%
Up 37.4%
1,160 in 2018 Q1
Down 9.2%
671 in 2018 Q1
Days on market 65Days to close 31
Total 96
5 days more than 2017 Q1
4.2 Compared to 3.0 in 2017 Q1
Texas Quarterly College Station-Bryan MSAFirst quarter 2018

Compared to same quarter last year
$186,700
Down 0.2%
Price Distribution$0 - $99,999 13.9%
$100,000 - $199,999 42.6%$200,000 - $299,999 30.4%$300,000 - $399,999 8.2%$400,000 - $499,999 2.6%$500,000 - $749,999 1.4%$750,000 - $999,999 0.7%
$1,000,000+ 0.2%
Down 20.4%
2,348 in 2018 Q1
Up 3.9%
1,179 in 2018 Q1
Days on market 92Days to close 37
Total 129
3 days more than 2017 Q1
5.4 Compared to 6.6 in 2017 Q1
Texas Quarterly Corpus Christi MSAFirst quarter 2018

Compared to same quarter last year
$258,000
Up 6.2%
Price Distribution$0 - $99,999 3.5%
$100,000 - $199,999 25.2%$200,000 - $299,999 33.9%$300,000 - $399,999 18.7%$400,000 - $499,999 8.9%$500,000 - $749,999 6.6%$750,000 - $999,999 1.7%
$1,000,000+ 1.6%
Up 2.6%
18,269 in 2018 Q1
Up 0.7%
20,660 in 2018 Q1
Days on market 48Days to close 32
Total 80
3 days more than 2017 Q1
2.1 Compared to 2.2 in 2017 Q1
Texas Quarterly Dallas-Fort Worth-Arlington MSA
First quarter 2018

Compared to same quarter last year
$147,000
Up 1.4%
Price Distribution$0 - $99,999 18.5%
$100,000 - $199,999 61.9%$200,000 - $299,999 14.5%$300,000 - $399,999 3.3%$400,000 - $499,999 1.1%$500,000 - $749,999 0.6%$750,000 - $999,999 0.1%
$1,000,000+ 0.1%
Down 5.3%
3,233 in 2018 Q1
Up 5.8%
1,709 in 2018 Q1
Days on market 99Days to close 35
Total 134
10 days less than 2017 Q1
4.9 Compared to 5.6 in 2017 Q1
Texas Quarterly El Paso MSAFirst quarter 2018

Compared to same quarter last year
$225,000
Up 2.3%
Price Distribution$0 - $99,999 6.8%
$100,000 - $199,999 33.4%$200,000 - $299,999 29.9%$300,000 - $399,999 15.0%$400,000 - $499,999 6.6%$500,000 - $749,999 5.2%$750,000 - $999,999 1.6%
$1,000,000+ 1.5%
Down 1.2%
24,491 in 2018 Q1
Up 1.7%
17,652 in 2018 Q1
Days on market 64Days to close 35
Total 99
1 day more than 2017 Q1
3.5 Compared to 3.6 in 2017 Q1
© 2018 Houston Realtors Information Service, Inc. - Certain information contained herein is derived from information which is the licensed property of, and copyrighted by, Houston Realtors Information Service, Inc.
Texas Quarterly Houston-The Woodlands-Sugar Land MSA
First quarter 2018

Compared to same quarter last year
$150,000
Up 4%
Price Distribution$0 - $99,999 21.0%
$100,000 - $199,999 53.9%$200,000 - $299,999 17.7%$300,000 - $399,999 5.0%$400,000 - $499,999 0.8%$500,000 - $749,999 1.3%$750,000 - $999,999 0.2%
$1,000,000+ 0.1%
Down 14%
1,610 in 2018 Q1
Down 2.6%
1,254 in 2018 Q1
Days on market 69Days to close 33
Total 102
9 days less than 2017 Q1
3.1 Compared to 3.6 in 2017 Q1
Texas Quarterly Killeen-Temple MSAFirst quarter 2018

Compared to same quarter last year
$158,000
Up 2.1%
Price Distribution$0 - $99,999 11.4%
$100,000 - $199,999 59.3%$200,000 - $299,999 21.6%$300,000 - $399,999 5.5%$400,000 - $499,999 0.4%$500,000 - $749,999 1.3%$750,000 - $999,999 0.0%
$1,000,000+ 0.4%
Up 10.8%
535 in 2018 Q1
Down 6%
253 in 2018 Q1
Days on market 67Days to close 39
Total 106
3 days less than 2017 Q1
5.2 Compared to 4.5 in 2017 Q1
Texas Quarterly Laredo MSAFirst quarter 2018
Compared to same quarter last year
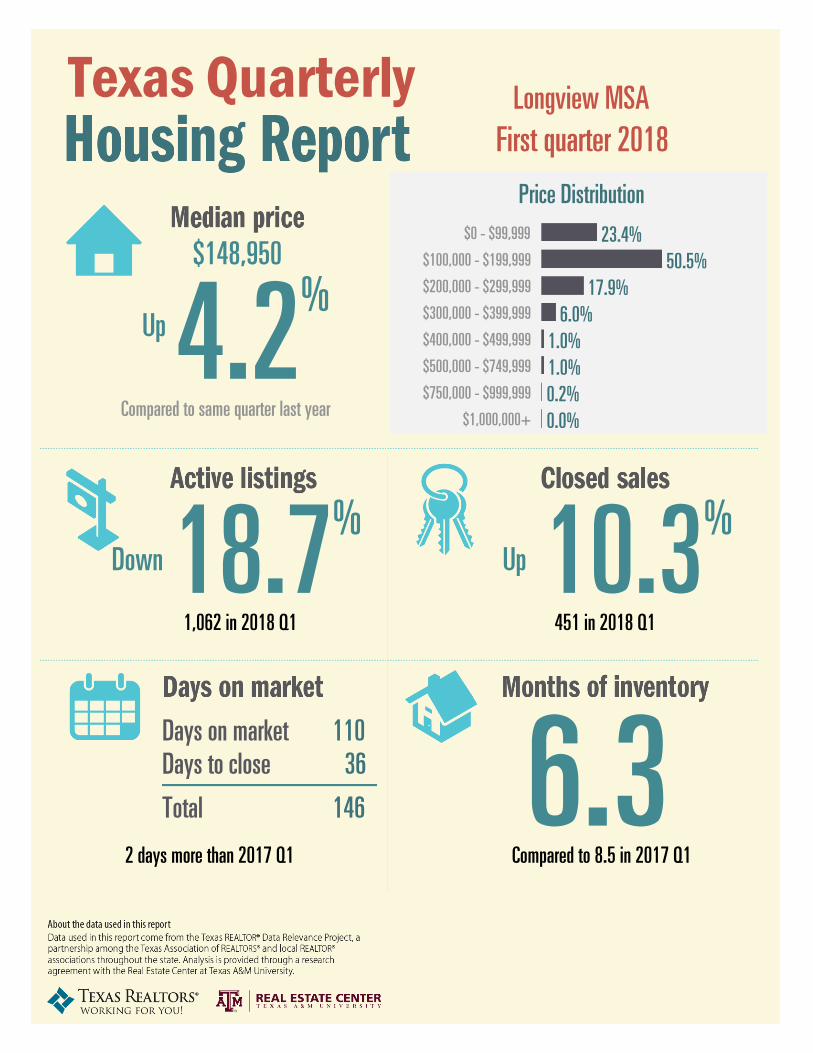
$148,950
Up 4.2%
Price Distribution$0 - $99,999 23.4%
$100,000 - $199,999 50.5%$200,000 - $299,999 17.9%$300,000 - $399,999 6.0%$400,000 - $499,999 1.0%$500,000 - $749,999 1.0%$750,000 - $999,999 0.2%
$1,000,000+ 0.0%
Down 18.7%
1,062 in 2018 Q1
Up 10.3%
451 in 2018 Q1
Days on market 110Days to close 36
Total 146
2 days more than 2017 Q1
6.3 Compared to 8.5 in 2017 Q1
Texas Quarterly Longview MSAFirst quarter 2018
Compared to same quarter last year
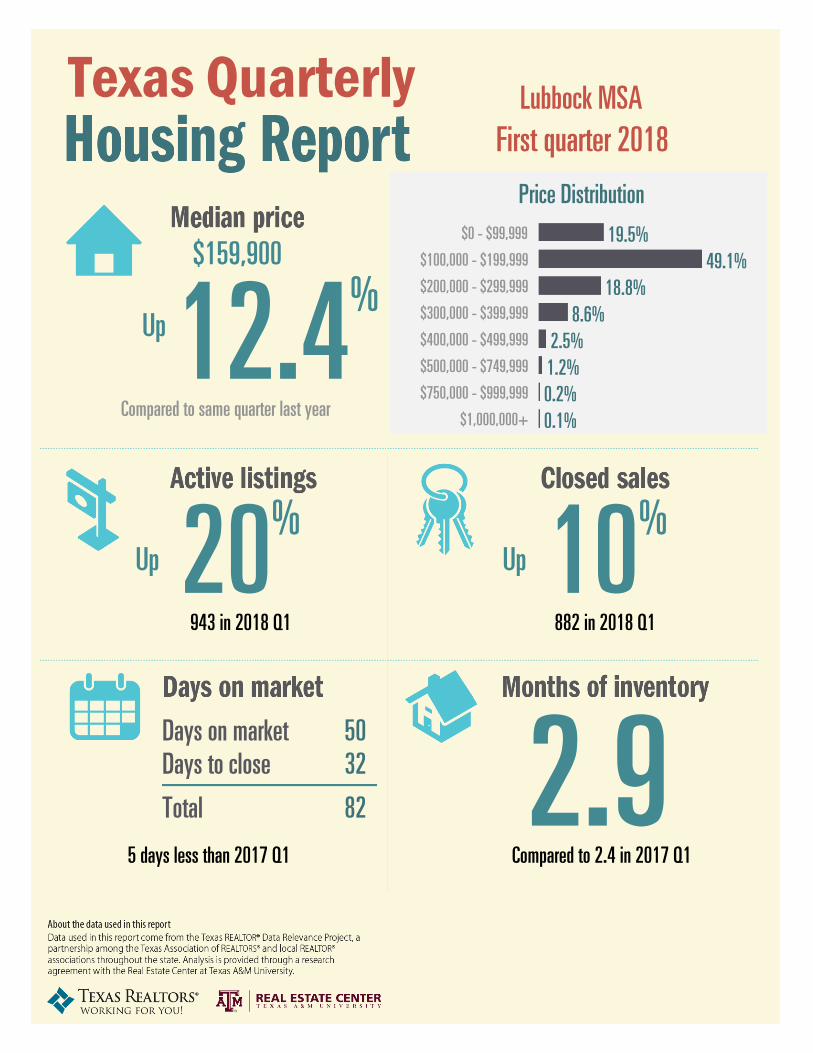
$159,900
Up 12.4%
Price Distribution$0 - $99,999 19.5%
$100,000 - $199,999 49.1%$200,000 - $299,999 18.8%$300,000 - $399,999 8.6%$400,000 - $499,999 2.5%$500,000 - $749,999 1.2%$750,000 - $999,999 0.2%
$1,000,000+ 0.1%
Up 20%
943 in 2018 Q1
Up 10%
882 in 2018 Q1
Days on market 50Days to close 32
Total 82
5 days less than 2017 Q1
2.9 Compared to 2.4 in 2017 Q1
Texas Quarterly Lubbock MSAFirst quarter 2018
Compared to same quarter last year
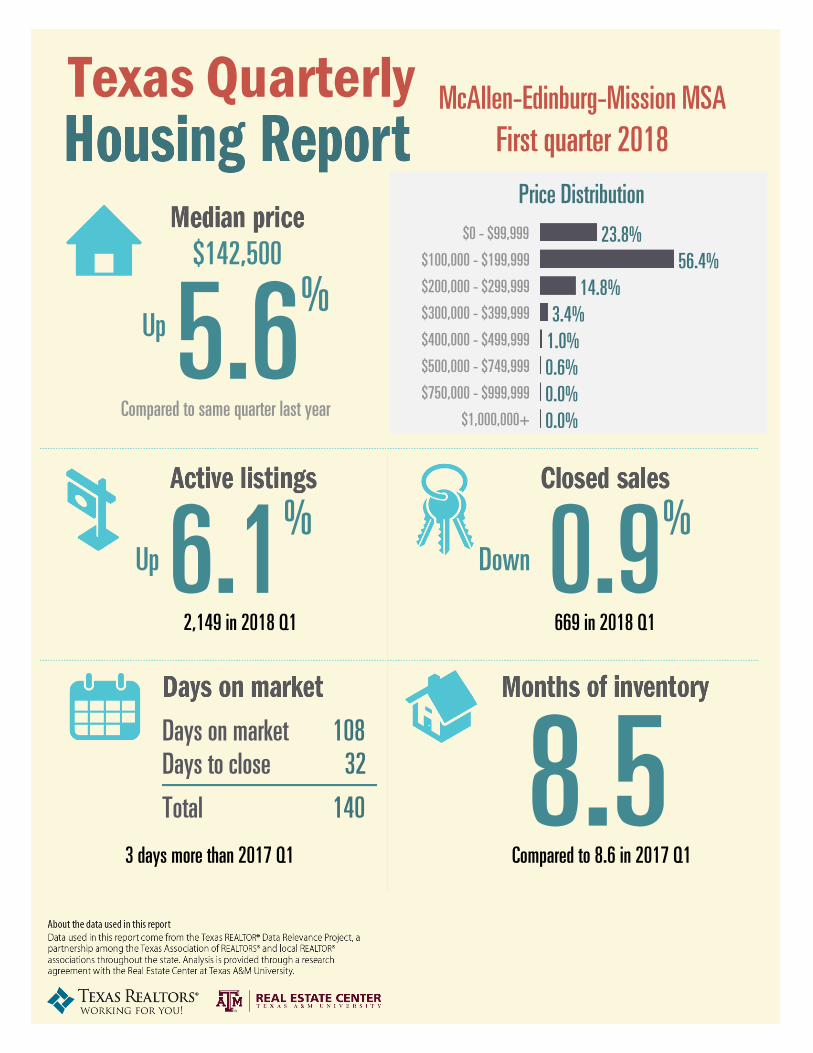
$142,500
Up 5.6%
Price Distribution$0 - $99,999 23.8%
$100,000 - $199,999 56.4%$200,000 - $299,999 14.8%$300,000 - $399,999 3.4%$400,000 - $499,999 1.0%$500,000 - $749,999 0.6%$750,000 - $999,999 0.0%
$1,000,000+ 0.0%
Up 6.1%
2,149 in 2018 Q1
Down 0.9%
669 in 2018 Q1
Days on market 108Days to close 32
Total 140
3 days more than 2017 Q1
8.5 Compared to 8.6 in 2017 Q1
Texas Quarterly McAllen-Edinburg-Mission MSAFirst quarter 2018

Compared to same quarter last year
$269,500
Up 12.3%
Price Distribution$0 - $99,999 6.3%
$100,000 - $199,999 20.2%$200,000 - $299,999 33.3%$300,000 - $399,999 20.0%$400,000 - $499,999 11.8%$500,000 - $749,999 5.6%$750,000 - $999,999 2.5%
$1,000,000+ 0.4%
Down 43.6%
230 in 2018 Q1
Down 3.8%
604 in 2018 Q1
Days on market 45Days to close 40
Total 85
20 days less than 2017 Q1
1.0 Compared to 2.1 in 2017 Q1
Texas Quarterly Midland MSAFirst quarter 2018

Compared to same quarter last year
$187,000
Up 10.1%
Price Distribution$0 - $99,999 11.0%
$100,000 - $199,999 44.7%$200,000 - $299,999 33.6%$300,000 - $399,999 5.7%$400,000 - $499,999 3.3%$500,000 - $749,999 1.8%$750,000 - $999,999 0.0%
$1,000,000+ 0.0%
Down 60.4%
164 in 2018 Q1
Up 33%
351 in 2018 Q1
Days on market 54Days to close 40
Total 94
19 days less than 2017 Q1
1.4 Compared to 4.3 in 2017 Q1
Texas Quarterly Odessa MSAFirst quarter 2018

Compared to same quarter last year
$163,500
Up 6.3%
Price Distribution$0 - $99,999 18.8%
$100,000 - $199,999 47.4%$200,000 - $299,999 24.4%$300,000 - $399,999 6.2%$400,000 - $499,999 2.3%$500,000 - $749,999 0.7%$750,000 - $999,999 0.3%
$1,000,000+ 0.0%
Down 9.3%
428 in 2018 Q1
Up 11.2%
319 in 2018 Q1
Days on market 83Days to close 35
Total 118
7 days less than 2017 Q1
3.5 Compared to 4.0 in 2017 Q1
Texas Quarterly San Angelo MSAFirst quarter 2018

Compared to same quarter last year
$214,000
Up 7.3%
Price Distribution$0 - $99,999 6.9%
$100,000 - $199,999 37.4%$200,000 - $299,999 32.5%$300,000 - $399,999 11.9%$400,000 - $499,999 6.2%$500,000 - $749,999 3.8%$750,000 - $999,999 0.8%
$1,000,000+ 0.5%
Up 1.5%
8,740 in 2018 Q1
Up 5%
6,928 in 2018 Q1
Days on market 66Days to close 34
Total 100
1 day more than 2017 Q1
3.2 Compared to 3.3 in 2017 Q1
Texas Quarterly San Antonio-New BraunfelsMSA
First quarter 2018

Compared to same quarter last year
$161,000
Up 6.6%
Price Distribution$0 - $99,999 18.6%
$100,000 - $199,999 44.9%$200,000 - $299,999 23.2%$300,000 - $399,999 8.0%$400,000 - $499,999 2.1%$500,000 - $749,999 1.6%$750,000 - $999,999 0.5%
$1,000,000+ 1.2%
Down 12.4%
474 in 2018 Q1
Up 5.7%
443 in 2018 Q1
Days on market 72Days to close 34
Total 106
8 days more than 2017 Q1
2.8 Compared to 3.4 in 2017 Q1
Texas Quarterly Sherman-Denison MSAFirst quarter 2018

Compared to same quarter last year
$127,250
Down 4.6%
Price Distribution$0 - $99,999 38.4%
$100,000 - $199,999 39.7%$200,000 - $299,999 19.9%$300,000 - $399,999 1.4%$400,000 - $499,999 0.7%$500,000 - $749,999 0.0%$750,000 - $999,999 0.0%
$1,000,000+ 0.0%
Up 37%
1,044 in 2018 Q1
Up 3.5%
149 in 2018 Q1
Days on market 96Days to close 36
Total 132
11 days less than 2017 Q1
17.3 Compared to 13.0 in 2017 Q1
Texas Quarterly Texarkana MSAFirst quarter 2018

Compared to same quarter last year
$198,950
Up 13%
Price Distribution$0 - $99,999 10.2%
$100,000 - $199,999 41.5%$200,000 - $299,999 28.1%$300,000 - $399,999 10.6%$400,000 - $499,999 5.2%$500,000 - $749,999 3.9%$750,000 - $999,999 0.4%
$1,000,000+ 0.2%
Down 15.4%
930 in 2018 Q1
Down 10.8%
551 in 2018 Q1
Days on market 100Days to close 5
Total 105
2 days less than 2017 Q1
3.9 Compared to 4.7 in 2017 Q1
Texas Quarterly Tyler MSAFirst quarter 2018

Compared to same quarter last year
$162,183
Up 2%
Price Distribution$0 - $99,999 19.6%
$100,000 - $199,999 47.0%$200,000 - $299,999 23.2%$300,000 - $399,999 8.3%$400,000 - $499,999 1.8%$500,000 - $749,999 0.0%$750,000 - $999,999 0.0%
$1,000,000+ 0.0%
Down 35.9%
238 in 2018 Q1
Down 3.4%
169 in 2018 Q1
Days on market 94Days to close 23
Total 117
7 days less than 2017 Q1
3.5 Compared to 5.5 in 2017 Q1
Texas Quarterly Victoria MSAFirst quarter 2018

Compared to same quarter last year
$175,000
Up 9.4%
Price Distribution$0 - $99,999 21.6%
$100,000 - $199,999 41.5%$200,000 - $299,999 24.3%$300,000 - $399,999 8.5%$400,000 - $499,999 2.3%$500,000 - $749,999 1.9%$750,000 - $999,999 0.0%
$1,000,000+ 0.0%
Up 29%
650 in 2018 Q1
Up 3.2%
551 in 2018 Q1
Days on market 63Days to close 38
Total 101
6 days more than 2017 Q1
2.8 Compared to 2.2 in 2017 Q1
Texas Quarterly Waco MSAFirst quarter 2018

Compared to same quarter last year
$105,000
Up 5.1%
Price Distribution$0 - $99,999 47.4%
$100,000 - $199,999 36.7%$200,000 - $299,999 11.7%$300,000 - $399,999 2.1%$400,000 - $499,999 0.8%$500,000 - $749,999 1.0%$750,000 - $999,999 0.3%
$1,000,000+ 0.0%
Down 10%
516 in 2018 Q1
Up 4.6%
390 in 2018 Q1
Days on market 71Days to close 30
Total 101
5 days less than 2017 Q1
3.5 Compared to 3.9 in 2017 Q1
Texas Quarterly Wichita Falls MSAFirst quarter 2018