testate amoebae in 31 mature forest ecosystems – densities and micro-distribution in soils
TRANSCRIPT
Tm
O
a
b
c
d
e
RA
A
admwardm©
K
I
ohp(d
Bc
0d
Available online at www.sciencedirect.com
European Journal of Protistology 48 (2012) 161–168
estate amoebae in 31 mature forest ecosystems – Densities andicro-distribution in soils
tto Ehrmanna, Daniel Puppeb,c, Manfred Wannerb,∗, Danuta Kaczorekc,d, Michael Sommerc,e
Bureau for Soil Micromorphology and Soil Biology, Münster 12, 97993 Creglingen, GermanyBrandenburg University of Technology Cottbus, Chair General Ecology, 03013 Cottbus, GermanyLeibniz-Centre for Agricultural Landscape Research (ZALF) e.V., Institute of Soil Landscape Research, 15374 Müncheberg, GermanyDepartment of Soil Environment Sciences, Warsaw University of Life Sciences (SGGW), Nowoursynowska 159, 02-776 Warsaw, PolandUniversity of Potsdam, Institute of Earth and Environmental Sciences, 14476 Potsdam, Germany
eceived 25 May 2011; received in revised form 22 December 2011; accepted 11 January 2012vailable online 16 February 2012
bstract
We studied testate amoebae and possible correlated abiotic factors in soils of 31 mature forest ecosystems using an easilypplicable and spatially explicit method. Simple counting on soil thin-sections with a light microscope resulted in amoebaensities comparable to previously reported values, i.e. 0.1 × 10⁸ to 11.5 × 10⁸ individuals m−2 (upper 3 cm of soil). Soiloisture and soil acidity seem to be correlated with amoeba densities. At sites of moderate soil moisture regimes (SMR 2–7)e found higher densities of testate amoebae at pH < 4.5. At wetter sites (SMR ≥ 8) higher individual densities were recorded
lso at less acidic sites. The in situ description of amoebae, based on the analysis of a complete soil thin-section, showed aelatively uniform spatial micro-distribution throughout the organic and mineral soil horizons (no testate amoeba clusters). We
iscuss the pros and cons of the soil thin-section method and suggest it as an additional tool to improve knowledge of the spatialicro-distribution of testate amoebae.2012 Elsevier GmbH. All rights reserved.eywords: Microhabitats; Soil thin-section; Soil moisture regimes; Soil reaction
hsTee
ntroduction
Protozoa in soils are not only important bioindicatorsf environmental conditions and changes in natural anduman-influenced ecosystems (Foissner 1999), but they also
lay a pivotal role as regulators of ecosystem processesDarbyshire 1994; Wetzel 2001), especially for nutrientynamics. Their potential importance for terrestrial Si cyclingAbbreviations: MPN, Most Probable Number; WRB, World Referencease for Soil Resources; SMR, soil moisture regime; SOC, soil organicarbon; Ct, total carbon; Nt, total nitrogen; Ccarb, carbonate – C.
∗Corresponding author.E-mail address: [email protected] (M. Wanner).
setsmatov
932-4739/$ – see front matter © 2012 Elsevier GmbH. All rights reserved.oi:10.1016/j.ejop.2012.01.003
as been addressed, but quantitative knowledge still is verycarce (Clarke 2003; Sommer et al. 2006; Aoki et al. 2007).estate amoebae constitute the dominant protozoan group,.g., in coniferous forest soils (Schönborn 1992). Schrötert al. (2003) demonstrated that testate amoebae from forestoils have an overwhelming contribution to C and N min-ralization; among the fauna, testate amoebae made by farhe largest contributions to mineralization. In some forestoils, testate amoebae, with an annual biomass production ofore than 200 g m−2 (Meisterfeld 2002), are as important
s earthworms for processes such as decomposition. Dueo their shells, they are very resistant to soil drought andther adverse conditions. Additionally, they are one of theery first colonizers of newly exposed soil substrates. They
1 rnal of
bwetaX
t1Wadeia
mi(nstasStm
eets
mesodr
M
S
wtTd(t(
r
ned3c(ra
ssCwsys(dceCpsatodn>wt1wtt
S
8surs(esemfiw
62 O. Ehrmann et al. / European Jou
uild up populations of some 100 million individuals per m2
ithin a few months facilitating plant succession (Hodkinsont al. 2002; Wanner and Xylander 2005). Furthermore, tes-ate amoebae reveal a high diversity in ecological functionnd occupy numerous ecological niches in soils (Wanner andylander 2005; Wanner et al. 2008).Forest composition influences testate amoeba communi-
ies and functional diversity significantly (e.g., Schönborn992; Coûteaux and Darbyshire 1998; Dunger et al. 2001;anner and Dunger 2001). Different afforestations (e.g.,
lder, pine, poplar) on a recultivated mine site resulted inifferent testate amoeba communities (Balík 1996; Dungert al. 2001; Wanner and Dunger 2001, 2002), and theres a clear correspondence between humus type and testatemoeba communities (e.g., Bonnet 1964).
An accurate estimate of protozoan densities is one of theost fundamental problems in soil protozoology. Most stud-
es are based on culture methods resulting in biased dataZwart et al. 1994; Adl and Gupta 2006). Culturing tech-iques (usually MPN) are unsuitable for testate amoebae,ince culturing these protozoa is quite complex and extremelyime-consuming. In most cases a direct counting method waspplied by microscopical analysis of aqueous soil suspen-ions (Wanner 1999; Schröter et al. 2003). Using this method,chröter et al. (2003) estimated that considering total fauna,
estate amoebae make the largest contribution to N and Cineralization and mobilization in (acid) forest soils.With respect to protozoa microhabitats, analyses of (gen-
ral) soil pore space availability were conducted (Darbyshiret al. 1985; Griffiths and Young 1994), but no study on tes-ate amoeba distribution in relation to microhabitats usingoil thin-sections has been published so far.
The aim of our study was to test the potential of a newethod (soil thin-section) for analysis of 31 mature forest
cosystems covering broad gradients in terms of climate andoil to quantify total density and spatial micro-distributionf testate amoebae. To identify possible drivers on amoebaensities we determined abiotic soil properties (soil moistureegime, soil acidity, soil organic carbon, nitrogen).
aterial and Methods
oil sampling and analysis
The 31 study sites of mature forested ecosystems in South-est Germany represent 11 different soil types according to
he World Reference Base for Soil Resources (WRB 2006,able 1). Five of these sites are coniferous and 26 siteseciduous forested. Samples were taken during summertimeJuly–August 1998) within six weeks. A detailed site descrip-
ion and sampling information are given in Friedel et al.2006) and Sommer et al. (2002).At each site 4 field replicates (25 cm × 25 cm) were chosenandomly in a 100 m2 area for soil sampling omitting areas
3ssu
Protistology 48 (2012) 161–168
earby tree stems (1 m distance min.) to exclude stem-flowffects. Samples were taken per horizon down to 25 cm. Bulkensities were determined by volumetric soil sampling usingsoil cores with a volume of 100 cm3 each per field repli-
ate and horizon. If soil core sampling was not applicablesoil horizon too thin), 0.25 m2 (4 × 25 cm × 25 cm) of theespective horizon was sampled completely, dried at 105 ◦Cnd weighted.
Soil texture was determined in the laboratory (undertandardized moisture) by standardized finger probes usingamples of known texture for calibration (AG Boden 1996).lay contents (<2 �m) of the soil samples were estimatedith the help of a texture triangle (AG Boden 1996). Soil
amples were air-dried and sieved prior to laboratory anal-ses. The fraction <2 mm (fine earth) was analyzed for pH,oil organic carbon (SOC) and nitrogen as well as carbonatesCcarb). The total carbon (Ct) and nitrogen (Nt) contents wereetermined by dry combustion with a CNS analyzer. Ccarbontents were measured conductometrically (Schlichtingt al. 1995) and SOC was calculated by subtraction (Ct minuscarb). C:N ratios were calculated by dividing SOC by Nt. SoilH was measured using a pH glass electrode in 0.01 M CaCl2oil suspensions (soil:water = 1:2.5). All results, except pH,re expressed on an oven-dry basis (105 ◦C). The results ofhe soil chemical analyses represented in this paper are meansf two lab repetitions per field replicate. To calculate massensities (g m−2 soil depth−1) of SOC and Nt horizon thick-esses, bulk densities and skeleton contents (soil fraction2 mm) were considered. The soil moisture regime (SMR)as characterized according to the “Procedures for Soil Pro-
ection Purposes” (Umweltministerium Baden-Württemberg995; Sommer et al. 2002). The SMR combines local climaticater balance with topographic position and soil characteris-
ics, classifying soils in relative units reaching from 1 (driest)o 10 (wettest).
oil thin-sections
At each site, three undisturbed topsoil samples (uppercm) were taken using Kubiena boxes. After acetone-drying,
amples were impregnated with Leguval resin under vac-um (Schlichting et al. 1995). One sample from each site,epresenting best an average humus profile, was chosen foroil thin-section preparation. After hardening thin-sectionsthickness 30 �m) were prepared. Testate amoebae (full andmpty shells combined) were counted at 12 representativeegments of 5 mm2 each per thin-section resulting in a totalnumeration-area of 60 mm2 (12 × 5 mm2). Shells were enu-erated in the upper 3 cm using phase contrast and darkeld microscopy (10:1 objective). Since testate amoeba shellsere about 60 �m on average in size, we assumed that our
0 �m thin-sections revealed also shell-parts from adjacentoil sections. To compensate repeated counting, we doubledoil thin-section width to 60 �m for calculation of individ-al densities. As thin-sections were assumed to represent a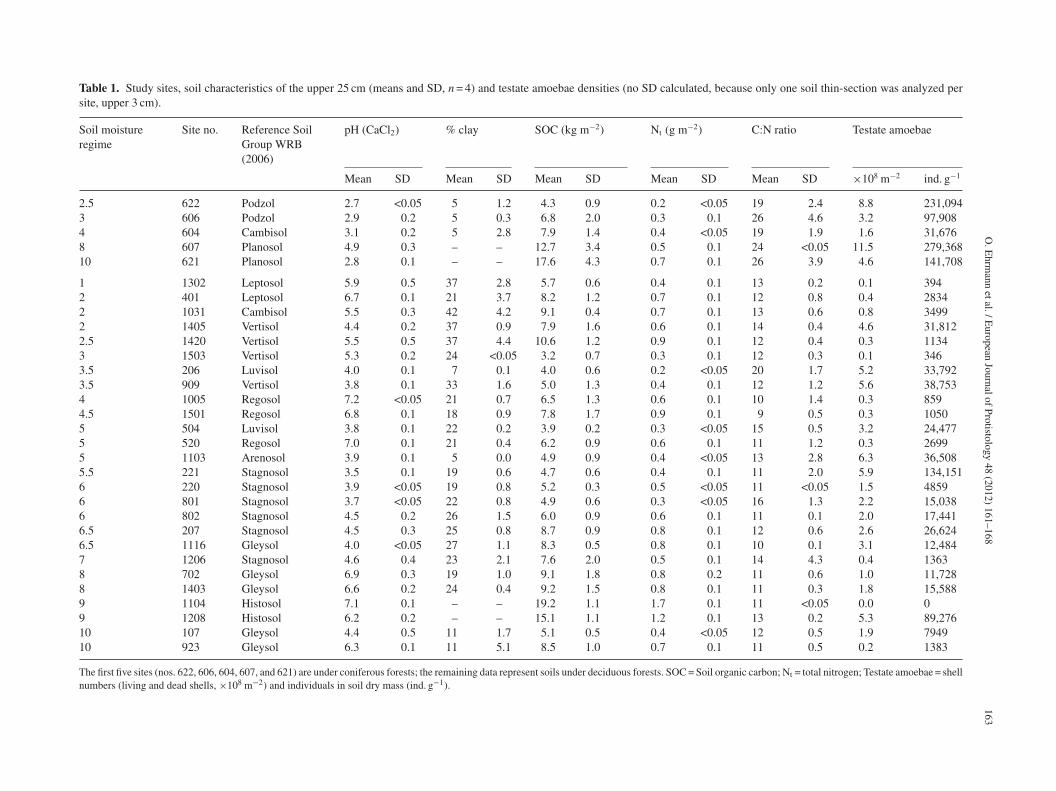
O.E
hrmann
etal./European
JournalofProtistology
48(2012)
161–168163
Table 1. Study sites, soil characteristics of the upper 25 cm (means and SD, n = 4) and testate amoebae densities (no SD calculated, because only one soil thin-section was analyzed persite, upper 3 cm).
Soil moistureregime
Site no. Reference SoilGroup WRB(2006)
pH (CaCl2) % clay SOC (kg m−2) Nt (g m−2) C:N ratio Testate amoebae
Mean SD Mean SD Mean SD Mean SD Mean SD ×108 m−2 ind. g−1
2.5 622 Podzol 2.7 <0.05 5 1.2 4.3 0.9 0.2 <0.05 19 2.4 8.8 231,0943 606 Podzol 2.9 0.2 5 0.3 6.8 2.0 0.3 0.1 26 4.6 3.2 97,9084 604 Cambisol 3.1 0.2 5 2.8 7.9 1.4 0.4 <0.05 19 1.9 1.6 31,6768 607 Planosol 4.9 0.3 – – 12.7 3.4 0.5 0.1 24 <0.05 11.5 279,36810 621 Planosol 2.8 0.1 – – 17.6 4.3 0.7 0.1 26 3.9 4.6 141,708
1 1302 Leptosol 5.9 0.5 37 2.8 5.7 0.6 0.4 0.1 13 0.2 0.1 3942 401 Leptosol 6.7 0.1 21 3.7 8.2 1.2 0.7 0.1 12 0.8 0.4 28342 1031 Cambisol 5.5 0.3 42 4.2 9.1 0.4 0.7 0.1 13 0.6 0.8 34992 1405 Vertisol 4.4 0.2 37 0.9 7.9 1.6 0.6 0.1 14 0.4 4.6 31,8122.5 1420 Vertisol 5.5 0.5 37 4.4 10.6 1.2 0.9 0.1 12 0.4 0.3 11343 1503 Vertisol 5.3 0.2 24 <0.05 3.2 0.7 0.3 0.1 12 0.3 0.1 3463.5 206 Luvisol 4.0 0.1 7 0.1 4.0 0.6 0.2 <0.05 20 1.7 5.2 33,7923.5 909 Vertisol 3.8 0.1 33 1.6 5.0 1.3 0.4 0.1 12 1.2 5.6 38,7534 1005 Regosol 7.2 <0.05 21 0.7 6.5 1.3 0.6 0.1 10 1.4 0.3 8594.5 1501 Regosol 6.8 0.1 18 0.9 7.8 1.7 0.9 0.1 9 0.5 0.3 10505 504 Luvisol 3.8 0.1 22 0.2 3.9 0.2 0.3 <0.05 15 0.5 3.2 24,4775 520 Regosol 7.0 0.1 21 0.4 6.2 0.9 0.6 0.1 11 1.2 0.3 26995 1103 Arenosol 3.9 0.1 5 0.0 4.9 0.9 0.4 <0.05 13 2.8 6.3 36,5085.5 221 Stagnosol 3.5 0.1 19 0.6 4.7 0.6 0.4 0.1 11 2.0 5.9 134,1516 220 Stagnosol 3.9 <0.05 19 0.8 5.2 0.3 0.5 <0.05 11 <0.05 1.5 48596 801 Stagnosol 3.7 <0.05 22 0.8 4.9 0.6 0.3 <0.05 16 1.3 2.2 15,0386 802 Stagnosol 4.5 0.2 26 1.5 6.0 0.9 0.6 0.1 11 0.1 2.0 17,4416.5 207 Stagnosol 4.5 0.3 25 0.8 8.7 0.9 0.8 0.1 12 0.6 2.6 26,6246.5 1116 Gleysol 4.0 <0.05 27 1.1 8.3 0.5 0.8 0.1 10 0.1 3.1 12,4847 1206 Stagnosol 4.6 0.4 23 2.1 7.6 2.0 0.5 0.1 14 4.3 0.4 13638 702 Gleysol 6.9 0.3 19 1.0 9.1 1.8 0.8 0.2 11 0.6 1.0 11,7288 1403 Gleysol 6.6 0.2 24 0.4 9.2 1.5 0.8 0.1 11 0.3 1.8 15,5889 1104 Histosol 7.1 0.1 – – 19.2 1.1 1.7 0.1 11 <0.05 0.0 09 1208 Histosol 6.2 0.2 – – 15.1 1.1 1.2 0.1 13 0.2 5.3 89,27610 107 Gleysol 4.4 0.5 11 1.7 5.1 0.5 0.4 <0.05 12 0.5 1.9 794910 923 Gleysol 6.3 0.1 11 5.1 8.5 1.0 0.7 0.1 11 0.5 0.2 1383
The first five sites (nos. 622, 606, 604, 607, and 621) are under coniferous forests; the remaining data represent soils under deciduous forests. SOC = Soil organic carbon; Nt = total nitrogen; Testate amoebae = shellnumbers (living and dead shells, ×108 m−2) and individuals in soil dry mass (ind. g−1).
164 O. Ehrmann et al. / European Journal of Protistology 48 (2012) 161–168
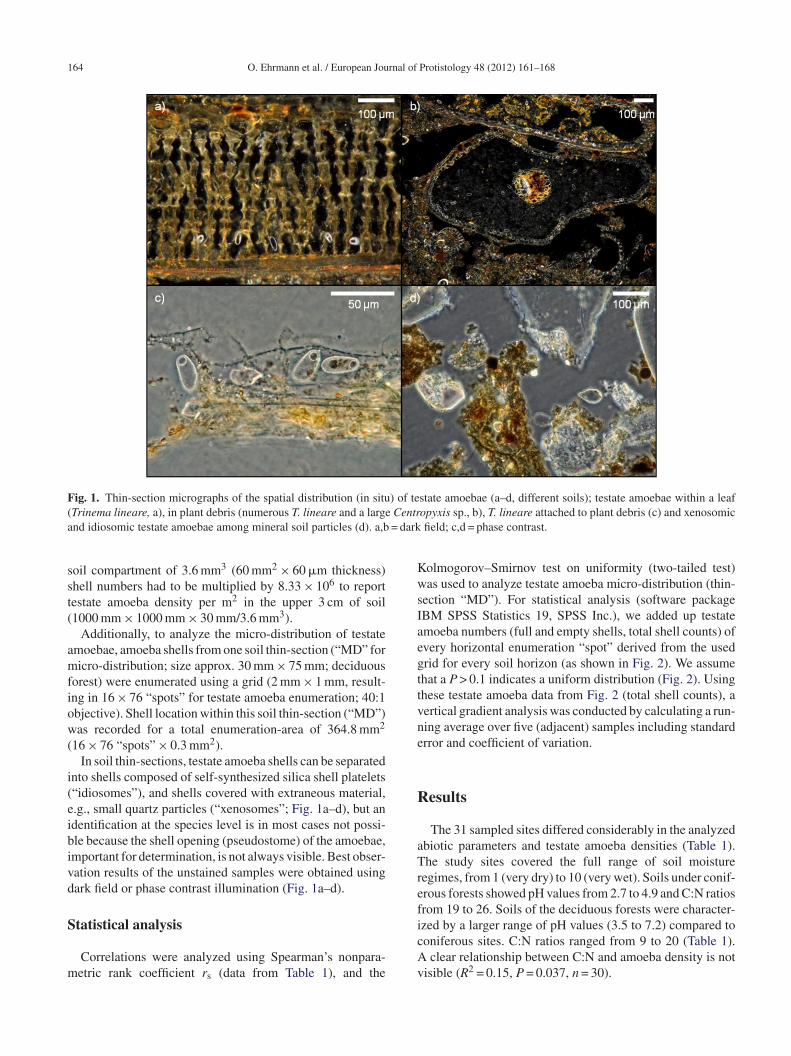
Fig. 1. Thin-section micrographs of the spatial distribution (in situ) of testate amoebae (a–d, different soils); testate amoebae within a leaf( Centra = dark
sst(
amfiow(
i(eibivd
S
m
KwsIaegttvne
R
aTref
Trinema lineare, a), in plant debris (numerous T. lineare and a largend idiosomic testate amoebae among mineral soil particles (d). a,b
oil compartment of 3.6 mm3 (60 mm2 × 60 �m thickness)hell numbers had to be multiplied by 8.33 × 10⁶ to reportestate amoeba density per m2 in the upper 3 cm of soil1000 mm × 1000 mm × 30 mm/3.6 mm3).
Additionally, to analyze the micro-distribution of testatemoebae, amoeba shells from one soil thin-section (“MD” foricro-distribution; size approx. 30 mm × 75 mm; deciduous
orest) were enumerated using a grid (2 mm × 1 mm, result-ng in 16 × 76 “spots” for testate amoeba enumeration; 40:1bjective). Shell location within this soil thin-section (“MD”)as recorded for a total enumeration-area of 364.8 mm2
16 × 76 “spots” × 0.3 mm2).In soil thin-sections, testate amoeba shells can be separated
nto shells composed of self-synthesized silica shell platelets“idiosomes”), and shells covered with extraneous material,.g., small quartz particles (“xenosomes”; Fig. 1a–d), but andentification at the species level is in most cases not possi-le because the shell opening (pseudostome) of the amoebae,mportant for determination, is not always visible. Best obser-ation results of the unstained samples were obtained usingark field or phase contrast illumination (Fig. 1a–d).
tatistical analysis
Correlations were analyzed using Spearman’s nonpara-etric rank coefficient rs (data from Table 1), and the
icAv
opyxis sp., b), T. lineare attached to plant debris (c) and xenosomicfield; c,d = phase contrast.
olmogorov–Smirnov test on uniformity (two-tailed test)as used to analyze testate amoeba micro-distribution (thin-
ection “MD”). For statistical analysis (software packageBM SPSS Statistics 19, SPSS Inc.), we added up testatemoeba numbers (full and empty shells, total shell counts) ofvery horizontal enumeration “spot” derived from the usedrid for every soil horizon (as shown in Fig. 2). We assumehat a P > 0.1 indicates a uniform distribution (Fig. 2). Usinghese testate amoeba data from Fig. 2 (total shell counts), aertical gradient analysis was conducted by calculating a run-ing average over five (adjacent) samples including standardrror and coefficient of variation.
esults
The 31 sampled sites differed considerably in the analyzedbiotic parameters and testate amoeba densities (Table 1).he study sites covered the full range of soil moisture
egimes, from 1 (very dry) to 10 (very wet). Soils under conif-rous forests showed pH values from 2.7 to 4.9 and C:N ratiosrom 19 to 26. Soils of the deciduous forests were character-
zed by a larger range of pH values (3.5 to 7.2) compared tooniferous sites. C:N ratios ranged from 9 to 20 (Table 1).clear relationship between C:N and amoeba density is notisible (R2 = 0.15, P = 0.037, n = 30).
O. Ehrmann et al. / European Journal of Protistology 48 (2012) 161–168 165
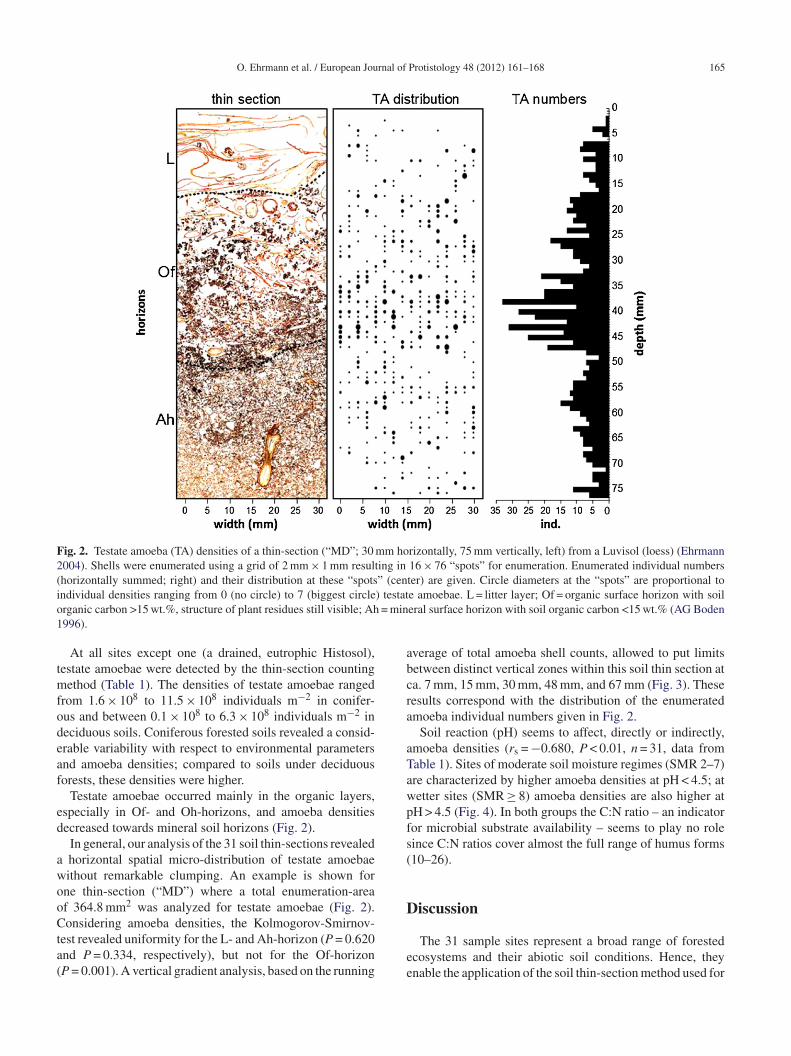
Fig. 2. Testate amoeba (TA) densities of a thin-section (“MD”; 30 mm horizontally, 75 mm vertically, left) from a Luvisol (loess) (Ehrmann2004). Shells were enumerated using a grid of 2 mm × 1 mm resulting in 16 × 76 “spots” for enumeration. Enumerated individual numbers(horizontally summed; right) and their distribution at these “spots” (center) are given. Circle diameters at the “spots” are proportional toi ) testato = min1
tmfodeaf
ed
awooCta(
abcra
aTawpfs(
D
ndividual densities ranging from 0 (no circle) to 7 (biggest circlerganic carbon >15 wt.%, structure of plant residues still visible; Ah996).
At all sites except one (a drained, eutrophic Histosol),estate amoebae were detected by the thin-section counting
ethod (Table 1). The densities of testate amoebae rangedrom 1.6 × 10⁸ to 11.5 × 10⁸ individuals m−2 in conifer-us and between 0.1 × 10⁸ to 6.3 × 10⁸ individuals m−2 ineciduous soils. Coniferous forested soils revealed a consid-rable variability with respect to environmental parametersnd amoeba densities; compared to soils under deciduousorests, these densities were higher.
Testate amoebae occurred mainly in the organic layers,specially in Of- and Oh-horizons, and amoeba densitiesecreased towards mineral soil horizons (Fig. 2).
In general, our analysis of the 31 soil thin-sections revealedhorizontal spatial micro-distribution of testate amoebaeithout remarkable clumping. An example is shown forne thin-section (“MD”) where a total enumeration-areaf 364.8 mm2 was analyzed for testate amoebae (Fig. 2).onsidering amoeba densities, the Kolmogorov-Smirnov-
est revealed uniformity for the L- and Ah-horizon (P = 0.620nd P = 0.334, respectively), but not for the Of-horizonP = 0.001). A vertical gradient analysis, based on the running
ee
e amoebae. L = litter layer; Of = organic surface horizon with soileral surface horizon with soil organic carbon <15 wt.% (AG Boden
verage of total amoeba shell counts, allowed to put limitsetween distinct vertical zones within this soil thin section ata. 7 mm, 15 mm, 30 mm, 48 mm, and 67 mm (Fig. 3). Theseesults correspond with the distribution of the enumeratedmoeba individual numbers given in Fig. 2.
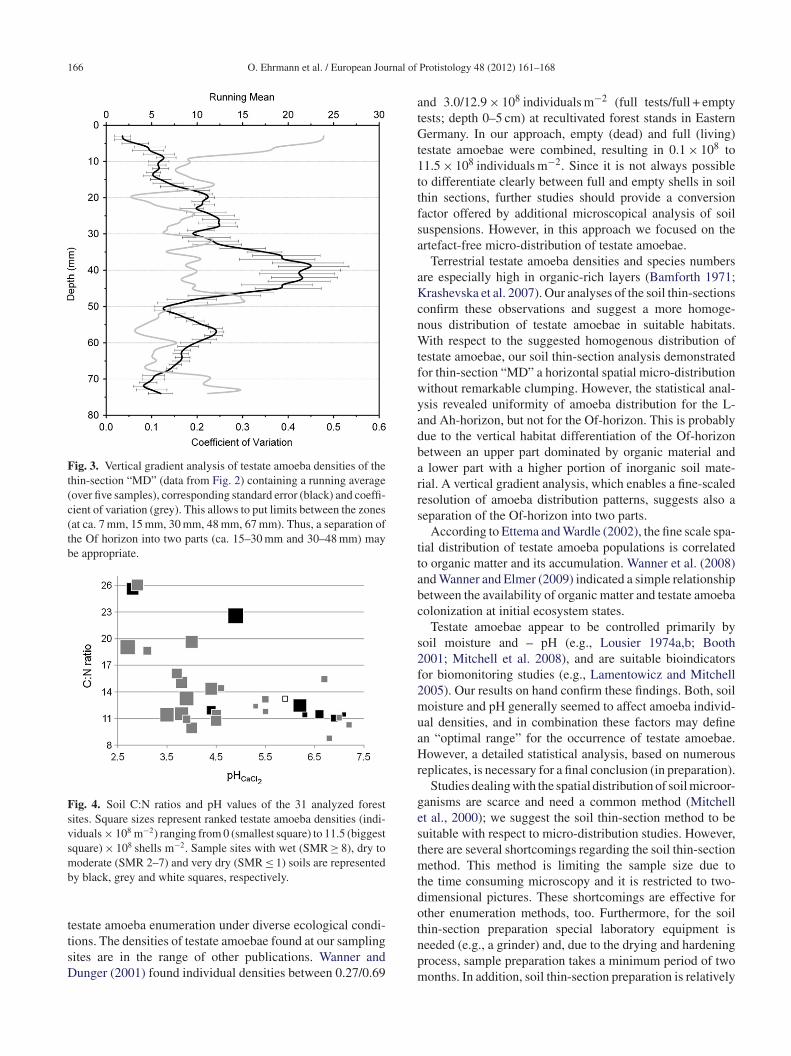
Soil reaction (pH) seems to affect, directly or indirectly,moeba densities (rs = −0.680, P < 0.01, n = 31, data fromable 1). Sites of moderate soil moisture regimes (SMR 2–7)re characterized by higher amoeba densities at pH < 4.5; atetter sites (SMR ≥ 8) amoeba densities are also higher atH > 4.5 (Fig. 4). In both groups the C:N ratio – an indicatoror microbial substrate availability – seems to play no roleince C:N ratios cover almost the full range of humus forms10–26).
iscussion
The 31 sample sites represent a broad range of forestedcosystems and their abiotic soil conditions. Hence, theynable the application of the soil thin-section method used for
166 O. Ehrmann et al. / European Journal of
Fig. 3. Vertical gradient analysis of testate amoeba densities of thethin-section “MD” (data from Fig. 2) containing a running average(over five samples), corresponding standard error (black) and coeffi-cient of variation (grey). This allows to put limits between the zones(at ca. 7 mm, 15 mm, 30 mm, 48 mm, 67 mm). Thus, a separation ofthe Of horizon into two parts (ca. 15–30 mm and 30–48 mm) maybe appropriate.
Fig. 4. Soil C:N ratios and pH values of the 31 analyzed forestsites. Square sizes represent ranked testate amoeba densities (indi-viduals × 108 m−2) ranging from 0 (smallest square) to 11.5 (biggestsquare) × 108 shells m−2. Sample sites with wet (SMR ≥ 8), dry tomoderate (SMR 2–7) and very dry (SMR ≤ 1) soils are representedb
ttsD
atGt1ttfsa
aKcnWtfwyadbarrs
ttabc
s2f2muaHr
gestmtdo
y black, grey and white squares, respectively.
estate amoeba enumeration under diverse ecological condi-
ions. The densities of testate amoebae found at our samplingites are in the range of other publications. Wanner andunger (2001) found individual densities between 0.27/0.69tnpm
Protistology 48 (2012) 161–168
nd 3.0/12.9 × 108 individuals m−2 (full tests/full + emptyests; depth 0–5 cm) at recultivated forest stands in Easternermany. In our approach, empty (dead) and full (living)
estate amoebae were combined, resulting in 0.1 × 10⁸ to1.5 × 108 individuals m−2. Since it is not always possibleo differentiate clearly between full and empty shells in soilhin sections, further studies should provide a conversionactor offered by additional microscopical analysis of soiluspensions. However, in this approach we focused on thertefact-free micro-distribution of testate amoebae.
Terrestrial testate amoeba densities and species numbersre especially high in organic-rich layers (Bamforth 1971;rashevska et al. 2007). Our analyses of the soil thin-sections
onfirm these observations and suggest a more homoge-ous distribution of testate amoebae in suitable habitats.ith respect to the suggested homogenous distribution of
estate amoebae, our soil thin-section analysis demonstratedor thin-section “MD” a horizontal spatial micro-distributionithout remarkable clumping. However, the statistical anal-sis revealed uniformity of amoeba distribution for the L-nd Ah-horizon, but not for the Of-horizon. This is probablyue to the vertical habitat differentiation of the Of-horizonetween an upper part dominated by organic material andlower part with a higher portion of inorganic soil mate-
ial. A vertical gradient analysis, which enables a fine-scaledesolution of amoeba distribution patterns, suggests also aeparation of the Of-horizon into two parts.
According to Ettema and Wardle (2002), the fine scale spa-ial distribution of testate amoeba populations is correlatedo organic matter and its accumulation. Wanner et al. (2008)nd Wanner and Elmer (2009) indicated a simple relationshipetween the availability of organic matter and testate amoebaolonization at initial ecosystem states.
Testate amoebae appear to be controlled primarily byoil moisture and – pH (e.g., Lousier 1974a,b; Booth001; Mitchell et al. 2008), and are suitable bioindicatorsor biomonitoring studies (e.g., Lamentowicz and Mitchell005). Our results on hand confirm these findings. Both, soiloisture and pH generally seemed to affect amoeba individ-
al densities, and in combination these factors may definen “optimal range” for the occurrence of testate amoebae.owever, a detailed statistical analysis, based on numerous
eplicates, is necessary for a final conclusion (in preparation).Studies dealing with the spatial distribution of soil microor-
anisms are scarce and need a common method (Mitchellt al., 2000); we suggest the soil thin-section method to beuitable with respect to micro-distribution studies. However,here are several shortcomings regarding the soil thin-section
ethod. This method is limiting the sample size due tohe time consuming microscopy and it is restricted to two-imensional pictures. These shortcomings are effective forther enumeration methods, too. Furthermore, for the soilhin-section preparation special laboratory equipment is
eeded (e.g., a grinder) and, due to the drying and hardeningrocess, sample preparation takes a minimum period of twoonths. In addition, soil thin-section preparation is relatively
rnal of
csb
teprtomitaaAprfhc
aia
A
tdmalwb((
R
A
A
A
B
B
B
B
C
C
D
D
D
E
E
F
F
F
G
H
K
L
L
L
L
M
M
M
O. Ehrmann et al. / European Jou
ost intensive and a classification of the testate amoebae onpecies level is not always possible, as a clear separationetween full and empty shells is not guaranteed.
On the other hand, there are several advantages of the soilhin-section method. It has been successfully used in soil sci-nces for a long time (see e.g., Low 1954). Unfortunately,rotozoa have been overlooked in most cases and were noteported from soil thin-sections (e.g., FitzPatrick 1993). Soilhin-section analyses give an insight into the microstructuref soil samples in situ containing heterogeneous substrateineral particles, micro aggregates and organic matter form-
ng diverse microhabitats for testate amoebae. Using soilhin-sections, intact spatial micro-distribution of xenosomicnd idiosomic shells of testate amoebae can be enumer-ted directly – within “natural”, artefact-free microhabitats!dditionally, testate amoebae inside plant debris or humusarticles can be located. These amoeba shells are often notecorded using soil suspensions. By analyzing thin-sectionsrom several spots and different soil depths, both vertical andorizontal spatial distributions of the testate amoebae can beonsidered.
These advantages let us suggest using the soil thin-sections an additional method to improve our knowledge of thentact spatial micro-distribution of testate amoebae in theirrtefact-free microhabitats.
cknowledgements
Ralf Meisterfeld (RWTH Aachen, Germany) improvedhis manuscript with helpful discussions on testate amoebaistribution and literature. Udo Bröring (BTU Cottbus, Ger-any) supported us with SPSS analyses. Edward Mitchell
nd Bertrand Fournier (Université de Neuchâtel, Switzer-and) helped us with a vertical gradient analysis. This studyas partly supported by the objective agreement 2010–2012etween the Brandenburg University of Technology CottbusBTU) and the Ministry of Science, Research and CultureMWFK) of the State of Brandenburg.
eferences
dl, M.S., Gupta, V.V.S.R., 2006. Protists in soil ecology and forestnutrient cycling. Can. J. For. Res. 36, 1805–1817.
G Boden, 1996. Bodenkundliche Kartieranleitung, 4th edn.,Bundesanstalt für Geowissenschaften und Rohstoffe und Geol-ogische Landesämter in der BRD, Hannover.
oki, Y., Hoshino, M., Matsubara, T., 2007. Silica and testate amoe-bae in a soil under pine-oak forest. Geoderma 141, 29–35.
alík, V., 1996. Soil testate amoebae (Protozoa, Rhizopoda) in envi-rons of the Sokolov city. Sbornik Okresniho muzea v Moste, radaprirodovedna 18, 5–17.
amforth, S.S., 1971. The numbers and proportions of Testacea andCiliates in litters and soils. J. Protozool. 18 (1), 24–28.
onnet, L., 1964. Le peuplement thécamoebien des sols. Rev. Ecol.Biol. Sol. 1, 123–408.
S
Protistology 48 (2012) 161–168 167
ooth, R.K., 2001. Ecology of testate amoebae (Protozoa) in twoLake Superior coastal wetlands. Implications for Paleoecologyand environmental monitoring. Wetlands 21, 564–576.
larke, J., 2003. The occurence and significance of biogenic opalin the regolith. Earth Sci. Rev. 60, 175–194.
oûteaux, M.-M., Darbyshire, J.F., 1998. Functional diversityamongst soil protozoa. Appl. Soil Ecol. 10, 229–237.
arbyshire, J.F., 1994. Protozoa. Darbyshire J.F. (Ed.), CAB Inter-national, Wallingford.
arbyshire, J.F., Robertson, L., Mackie, L.A., 1985. A comparisonof two methods of estimating the soil pore network available toprotozoa. Soil Biol. Biochem. 17, 619–624.
unger, W., Wanner, M., with Hauser, H., Hohberg, K., Schulz, H.-J., Schwalbe, T., Seifert, B., Vogel, J., Voigtländer, K., Zimdars,B., Zulka, K.P., 2001. Development of soil fauna at mine sitesduring 46 years after afforestation. Pedobiologia 45, 243–271.
hrmann, O., 2004. Protozoen in Bodendünnschliffen. MitteilungenDt. Bodenkundl. Gesellsch. 103, 23–24.
ttema, C.H., Wardle, D.A., 2002. Spatial soil ecology. Trends Ecol.Evol. 17, 177–183.
itzPatrick, E.A., 1993. Soil Microscopy and Micromorphology.Wiley, Chichester, 304pp.
oissner, W., 1999. Soil protozoa as bioindicators, pros and cons,methods, diversity, representative examples. Agric. Ecosyst.Environ. 74, 95–112.
riedel, J.K., Ehrmann, O., Pfeffer, M., Stemmer, M., Vollmer, T.,Sommer, M., 2006. Soil microbial biomass and activity, the effectof site characteristics in humid temperate forest ecosystems. J.Plant Nutr. Soil Sci. 169, 175–184.
riffiths, B.S., Young, I.M., 1994. The effects of soil structure onprotozoa in a clay-loam soil. Eur. J. Soil Sci. 45, 285–292.
odkinson, I.D., Webb, N.R., Coulson, S.J., 2002. Primary com-munity assembly on land – the missing stages, why are theheterotrophic organisms always there first? J. Ecol. 90, 569–577.
rashevska, V., Bonkowski, M., Maraun, M., Scheu, S., 2007. Tes-tate amoebae (protista) of an elevational gradient in the tropicalmountain rain forest of Ecuador. Pedobiologia 51, 319–331.
amentowicz, M., Mitchell, E.A.D., 2005. The Ecology of tes-tate amoebae (protists) in Sphagnum in north-western Polandin relation to peatland ecology. Microb. Ecol. 50, 48–63.
ousier, J.D., 1974a. Response of soil testacea to soil moisturefluctuations. Soil Biol. Biochem. 6, 235–239.
ousier, J.D., 1974b. Effects of experimental soil moisture fluc-tuations on turnover rates of testacea. Soil Biol. Biochem. 6,19–26.
ow, A.J., 1954. The study of soil structure in the field and thelaboratory. J. Soil Sci. 5, 57–74.
eisterfeld, R., 2002. Order Arcellinida Kent. In: Lee, J.J., Leedale,G.F., Bradbury, P. (Eds.), An Illustrated Guide to the Pro-tozoa. , 2nd ed. Society of Protozoologists, Lawrence, pp.827–860.
itchell, E.A.D., Borcard, D., Buttler, A.J., Grosvernier, P., Gilbert,D., Gobat, J.-M., 2000. Horizontal Distribution Patterns of Tes-tate Amoebae (Protozoa) in a Sphagnum magellanicum Carpet.Microb. Ecol. 39, 290–300.
itchell, E.A.D., Charman, D.J., Warner, B.G., 2008. Testateamoebae analysis in ecological and paleoecological studies
of wetlands, past, present and future. Biodivers. Conserv. 17,2115–2137.chlichting, E., Blume, H.P., Stahr, K., 1995. Soils practical. Black-well, Berlin, Wien, Germany, Austria (in German).
1 rnal of
S
S
S
S
U
W
W
W
W
W
W
W
W
68 O. Ehrmann et al. / European Jou
chönborn, W., 1992. The role of protozoan communities in fresh-water and soil ecosystems. Acta Protozool. 31, 11–18.
chröter, D., Wolters, V., De Ruiter, P.C., 2003. C and N mineralisa-tion in the decomposer food webs of a European forest transect.Oikos 102, 294–308.
ommer, M., Ehrmann, O., Friedel, J.K., Martin, K., Vollmer,T., Turian, G., 2002. Böden als Lebensraum für Organismen– Regenwürmer, Gehäuselandschnecken und Bodenmikroor-ganismen in Wäldern Baden-Württembergs. HohenheimerBodenkundliche Hefte 63, 1–163.
ommer, M., Kaczorek, D., Kuzyakov, Y., Breuer, J., 2006. Siliconpools and fluxes in soils and landscapes – a review. J. Plant Nutr.Soil Sc. 169, 310–329.
mweltministerium Baden-Württemberg, 1995. Bewertung vonBöden nach ihrer Leistungsfähigkeit. Luft Boden Abfall 31,1–34.
anner, M., 1999. A review on the variability of testate amoe-
bae, methodological approaches, environmental influences andtaxonomical implications. Acta Protozool. 38, 15–29.anner, M., Dunger, W., 2001. Biological activity of soils fromreclaimed open-cast coal mining areas in Upper Lusatia using
Z
Protistology 48 (2012) 161–168
testate amoebae (protists) as indicators. Ecol. Eng. 17, 323–330.
anner, M., Dunger, W., 2002. Primary immigration and successionof soil organisms on reclaimed opencast coal mining areas ineastern Germany. Eur. J. Soil Biol. 38, 137–143.
anner, M., Xylander, W.E.R., 2005. Biodiversity development ofterrestrial testate amoebae, is there any succession at all? Biol.Fertil. Soils 41, 428–438.
anner, M., Elmer, M., Kazda, M., Xylander, W.E.R., 2008. Com-munity assembly of testate amoebae: how is the very firstbeginning characterized? Microb. Ecol. 56, 43–54.
anner, M., Elmer, M., 2009. Hot spots” on a new soil surface – howdo testate amoebae settle down? Acta Protozool. 48, 281–289.
etzel, R.G., 2001. Protists, key ecosystem regulators. BioScience51, 997.
RB, 2006. World Reference Base for Soil Resources 2006 – WorldSoil Resources Report No. 103. FAO, Rome.
wart, K.B., Kuikman, P.J., Van Veen, J.A., 1994. Rhizosphere pro-tozoa, their significance in nutrient dynamics. In: Darbyshire,J.F. (Ed.), Soil Protozoa. CAB International, Wallingford, pp.93–121.