ten years of language access in washington, dc years of language access in washington, dc ten years...
TRANSCRIPT

Ten Years of Language Access in Washington, DC
HAMUTAL BERNSTEIN, JULIA GELATT, DEVLIN HANSON, AND WILLIAM MONSON APRIL 2014

Acknowledgments
We thank the interviewees who generously gave their time to talk with us. We are grateful to all of these individuals for sharing their experiences and expertise with us.
The authors are also grateful to Heather Koball, Peter Tatian, and DC OHR for their thoughtful comments on earlier versions of this paper.
Thank you also to our colleagues at the Urban Institute who provided extraordinary research and editorial support: Lina Breslav and Fiona Blackshaw.
This paper was written with support from the District of Columbia Office of Human Rights.
Copyright © 2014. The Urban Institute. Permission is granted for reproduction of this file, with attribution to the Urban Institute.
The nonpartisan Urban Institute publishes studies, reports, and books on timely topics worthy of public consideration. The views expressed are those of the authors and should not be attributed to the Urban Institute, its trustees, or its funders.

Contents
Global DC 2
The Creation of DC’s Language Access Program 8 The Context for Passage 8 The Provisions of the Language Access Act 8
Evolution of DC’s Language Access Program 11 Identifying Language Needs 11 Serving Language Needs 12 Monitoring Language Access Services 12
Demographic Analysis of the LEP/NEP Community 13
Navigating the Implementation of Language Access: Accomplishments and Challenges 24 Identifying Language Needs 25 Serving Language Needs 27 Monitoring Language Access Services 28
Recommendations 29
Summary 33
Appendix A. Limitations of the American Community Survey 34
Appendix B. Agencies Required to Conform to the Language Access Act by Compliance Date 35
References 36
Notes 38


Ten Years of Language Access in Washington, DC Ten years ago, the District of Columbia enacted the DC Language Access Act of 2004, which requires all District agencies, and especially those with significant public contact, to ensure that limited English proficient (LEP) and non–English proficient (NEP) residents have full access to services. Because LEP/ NEP residents often face barriers in their interactions with public agencies, the District passed language access legislation to require local agencies to provide translation and interpretation resources to all LEP/NEP clients. DC is one of only a few cities in the United States to have passed such legislation.
The imperative for language access stems from the District’s rich diversity. The metropolitan region has become an important immigration hub over the past several decades, with significant growth and diversification of residents in the inner and outlying suburbs of Virginia and Maryland, as well as in the District. The District’s foreign-born population accounts for more than a third of its population growth since 2007. Similar to trends throughout the region, the District has an extremely diverse immigrant population; no one country of birth makes up more than 16 percent of the foreign-born. In this context, ensuring access for LEP/NEP residents is critical. In the greater DC area,1 1 in 10 individuals over the age of 5 is LEP/NEP; in the District, the share is about 1 in 20. More than 85 percent of LEP/NEP people living in the District are foreign-born, but a substantial proportion (15 percent) are US-born. Given both the large number and the diversity of LEP individuals in DC, challenges arise when attempting to provide services to this community. The District’s Language Access Program has strived over the past 10 years to support these language needs.
This report offers an overview of the Language Access Program and Washington’s LEP/NEP population. We first present the context of the District as a city that draws immigrants from around the world. We then describe DC’s Language Access Program, its creation, and evolution, and profile the city’s LEP/NEP population. Next, we identify accomplishments and challenges for each of the three major domains required for ensuring full language access: identifying language needs, serving language needs, and monitoring the provision of those services. We conclude with recommendations for next steps for city government officials and other stakeholders as they continue to strengthen the Language Access Program in the District.
The demographic profile is based on the American Community Survey (ACS), which is the best available data source providing detailed demographic and household characteristics on a large, representative sample of US households. The program overview is based on existing literature, DC government documents and reports, and perspectives from a small group of stakeholders. Specifically, we reviewed the literature on best practices for language access policy and on immigration and language access in DC. In addition, we conducted 11 interviews with 14 stakeholders from city government and immigrant-serving nonprofits in DC, who have worked directly on language access issues at different stages of the implementation of the program. Although the research team drew on multiple sources as described, interview participants were recruited by the Office of Human Rights and the mayor’s constituent offices. It is important to note this limitation to the study, as it introduced a potential source of bias.
The findings describe a pioneering Language Access Act that emerged through a community-based effort led by the DC Language Access Coalition, made up of diverse immigrant-serving organizations that recognized the importance of ensuring full access to DC’s LEP/NEP residents. Coordinated and monitored by the Office of Human Rights, the Language Access Program is supported by the active engagement of partners and implemented directly by frontline and Language Access team staff at a wide range of District agencies. The structure and specific activities of the Language Access Program have evolved and modernized over the past decade, with significant accomplishments in increasing

2 URBAN INSTITUTE
public and agency awareness, as well as expanding available translation and interpretation resources. The complexity of assessing the language needs of an extremely diverse LEP/NEP population, across a wide array of agencies and with limited resources, poses a key challenge to the success of the program. Recommendations focus on continuing to improve data collection and analysis, recognizing the importance of human capital and bilingual skills, improving service quality and accessibility, improving coordination between agencies, pursuing aggressive community engagement, continuing the trans-parent monitoring system, examining enforcement possibilities, and considering further investments in a program that still faces considerable hurdles despite significant strides over the past decade.
Global DC
The DC Language Access Act of 2004 has been shaped by both the size and the diversity of the immigrant community in the District. More than 85,000 immigrants currently live in the District of Columbia, and their population continues to grow. Metropolitan DC is now one of the most significant immigration hubs in the country. It has the seventh-largest immigrant concentration (21.5 percent foreign-born), following New York, Los Angeles, Miami, Chicago, Houston, and San Francisco In terms of size, 1.2 million foreign-born live in the metropolitan DC region, a similar scale to Houston, San Francisco, and Dallas–Fort Worth (Singer 2012).
While the District has not always been an immigrant destination, the size of the immigrant community has grown rapidly over the past 40 years and continues to grow (figure 1). As the nation’s capital and the seat of federal government, Washington, DC, offers a global environment as the location for foreign embassies, international organizations, major research institutions and universities, and a range of organizations in the private and non-profit sectors that are associated with the policymaking community and knowledge industry. The presence of such a range of organizations provides great economic opportunities and also produces a wide array of labor needs to support the large, relatively highly-skilled, high income metropolitan population. This has led to needs, in particular, in the service and construction fields, often filled by foreign-born workers.
As the region has diversified, inflows of students and knowledge workers have been joined by refugee populations as immigrants from all global regions have joined family and friends already settled here (Singer 2012). Many inflows of immigrants in the District and the surrounding metropolitan area were driven by refugee resettlement. For instance, in the 1970s, the Vietnam War sent several waves of Vietnamese immigrants into the United States as refugees, including many that settled in the DC area. In the 1980s, civil conflict and natural disasters drove Central Americans to migrate to the United States, and many of them, especially immigrants from El Salvador, have settled in the DC area (Singer 2012). Since the 1990s, conflict in African countries has brought a wave of African, especially Ethiopian and Somali refugees into the DC area (Singer and Wilson 2006). The settlement of immigrants in DC has been driven by economic, political, religious, and academic motivations. As this section will describe, the District’s job opportunities have attracted a diverse group of immigrants from all regions of the world, filling high growth occupations at both the high and low skill levels.
The District of Columbia has attracted a relatively more diverse immigrant population than the United States. A large share of immigrants in the District of Columbia comes from Latin America (similar to the rest of the country), but the District has much larger shares of African and European immigrants. While immigrants from Asia make up a smaller share of the immigrant population in DC than in the United States as a whole, they still make up 19 percent (figure 2). Immigrants’ countries of origin are similarly diverse. No one country of origin constitutes more than 16 percent of the immigrant population in the District. Further, the top 10 countries of origin total less than 50 percent of the immigrant population. In contrast, immigrants from Mexico make up close to 30 percent of all immigrants nationwide, and the top 10 countries cover nearly 60 percent of the immigrant population. The number of immigrants from each world region has grown in the past two decades (figure 3).

TEN YEARS OF LANGUAGE ACCESS IN WASHINGTON, DC 3
Figure 1. Number of Immigrants Living in the District of Columbia, 1900–2010
Sources: 1900–2000 values from “Historical Census Tables on the Foreign-Born Population of the United States 1850 to 2000”; 2010
value is one-year estimate from the American Community Survey, accessed through American FactFinder.
0
10,000
20,000
30,000
40,000
50,000
60,000
70,000
80,000
90,000
1900 1910 1920 1930 1940 1950 1960 1970 1980 1990 2000 2010

4 URBAN INSTITUTE
Figure 2. Distribution of Immigrants by Region of Birth
Source: 2012 three-year data from the American Community Survey, accessed through American FactFinder.
Note: The top 10 countries of origin among immigrants in the United States are Mexico (28.8%), China (5.5%), India (4.7%), Philippines
(4.5%), Vietnam (3.1%), El Salvador (3.1%), Cuba (2.7%), Korea (2.7%), Dominican Republic (2.2%), and Guatemala (2.1%). The top ten
countries of origin among immigrants in the District of Columbia are El Salvador (15.8%), Ethiopia (6.2%), Mexico (3.6%), China (3.4%),
Guatemala (3.0%), India (2.9%), Nigeria (2.4%), Philippines (2.4%), Jamaica (2.3%), and Trinidad and Tobago (2.3%).
Latin
America
44%
Asia
19%
Europe
18%
Africa
16%
Northern
America
2%
Oceania
1%
Latin
America
53%
Asia
29%
Europe
12%
Africa
4%
Northern
America
2%
Oceania
0%
District of Columbia
85,300 immigrants
United States
44,450,300 immigrants

TEN YEARS OF LANGUAGE ACCESS IN WASHINGTON, DC 5
Figure 3. Number of Immigrants Living in the District of Columbia by World Region of Origin,
1990–2012
Source: “State Immigration Data Profiles: District of Columbia,” Migration Policy Institute Data Hub,
http://www.migrationpolicy.org/data/state-profiles/state/demographics/DC. Numbers are calculated based on the ACS and IPUMS data.
Note: Other includes immigrants from North America and Oceania.
0
5,000
10,000
15,000
20,000
25,000
30,000
35,000
40,000
45,000
1990 2000 2012
Latin
America
Asia
Africa
Europe
Other

6 URBAN INSTITUTE
Work opportunities in the District of Columbia have attracted both high- and low-skilled immigrants. Nearly half of the immigrant population in the District has a bachelor’s degree or higher. This is a much higher share than the national average of 27 percent and is similar to the share of native-born DC residents with a bachelor’s degree or higher (53 percent). While a portion of the immigrant substantial proportion of the population is highly educated, 20 percent have less than a high school degree. This is lower than the 31 percent of immigrants in the United States with less than a high school degree, but is still much higher than the 10 percent of native-born individuals in the District with less than a high school degree (figure 4).
Figure 4. Educational Attainment of Immigrants versus the Native-Born Population in the District
of Columbia
Source: 2012 three-year data from the American Community Survey, accessed through American FactFinder.
The District attracts both highly educated and less-educated immigrants based on its job opportunities. Figure 5 presents the fastest growing occupations in the District and the share of immigrants working in those occupations. The high-growth occupations are a mix of high-skilled and low-skilled occupations, and immigrants constitute a substantial share of workers in high-growth industries. While immigrants make up only 19.8 percent of the workforce in the District overall, they are well over 20 percent of individuals working in 5 of the top 10 high-growth occupations. Well over half of the individuals in the District working in building and grounds cleaning and maintenance are immigrants, and more than a third of individuals working in food preparation and serving related occupations are immigrants. Additionally, immigrants make up almost a quarter of all individuals working in health care practitioner and technical occupations and in health care support occupations.
Immigrants in the District have extremely high labor force participation and employment rates. One in five workers living in the District is an immigrant. In the District, immigrants are much more likely to be employed than the native-born population. This is the result of both higher labor force participation rates and higher employment rates among those in the labor force. The labor force participation rate for immigrants age 18 and older is 79 percent, while the rate for native-born age 18 and older is 72 percent. Among those participating in the labor force, immigrants also have higher employment rates than the native-born population; approximately 91 percent of immigrants are employed compared with 88 percent of the native-born population. In addition to being more likely to be employed, according to the Fiscal Policy Institute, immigrant workers living in the District are, also,
10.4
19.7 17.6
23.9
28.4
21.5
15.5 14.2
19.4
29.3
Less than high
school education
High school degree
or equivalent
Some college
education
Bachelor's degree Graduate education
US-born Foreign-born

TEN YEARS OF LANGUAGE ACCESS IN WASHINGTON, DC 7
10 percent more likely to be business-owners than native-born workers (Kallick, Parrott, and Mauro 2012).
Figure 5. Share of Immigrants and Native-Born Working in High-Growth Occupations in the
District of Columbia, 2012
Sources: Projections of fast-growth, by number, occupational categories from “Metropolitan Statistical Area 2010–2020 Industry and
Occupational Projections,” DC Department of Employment Services, July 9, 2012, http://does.dc.gov/node/184892. Immigrant shares
calculated using the share of employed workers in the occupation in 2012 who were foreign-born, based on the 2012 three-year ACS
PUMS data accessed through IPUMS.
Immigrants in the District have income and tax contribution levels similar to those of the native-born population. In the District, the median income of immigrant households is about $65,000, which is similar to native-born households at about $63,000. An Urban Institute study found that in 2000 immigrants living in the District of Columbia paid close to $1 billion in federal, state, and local taxes (Capps et al. 2006). This accounted for 16 percent of the total taxes paid by DC residents. The same study found variation in the size of tax payments for both the native-born and immigrant populations based on education: both immigrant and native-born households with higher levels of education paid more in taxes. While immigrants with less than a high school education paid less than households with higher levels of education, those with less than a high school education also contributed more in taxes than similarly educated native-born households.
18%
58%
23%
35%
23%
16%
10%
16%
12%
16%
82%
42%
77%
65%
77%
84%
90%
84%
88%
84%
0% 20% 40% 60% 80% 100%
Management
Building and grounds cleaning and maintenance
Health care support
Food preparation and serving related
Health care practitioners and technical
Education, training, and library
Legal
Computer and mathematical
Office and administrative support
Business and financial operations
Immigrants Native-born

8 URBAN INSTITUTE
The Creation of DC’s Language Access Program
The Context for Passage
Washington, DC, is one of the few municipalities in the country with a formal language access law.2 The Language Access Act of 2004 resulted from a grassroots process in which community-based organizations serving immigrant and LEP/NEP populations in the District created a formal coalition, the DC Language Access Coalition (DCLAC). This followed years of work in the community by immigrant-serving organizations, particularly Latino organizations advocating for Spanish-language services. The District had a history of providing access to city services for Spanish-speaking residents. The 1974 Bilingual Translation Services Act and the 1976 “Spanish Language Laws” were attempts to respond to the needs of LEP/NEP residents in the District. As the metropolitan region became an increasingly diverse immigration hub, with the number of foreign-born residents rising from 128,000 in 1970 to 832,000 in 2000 and increasing numbers of immigrants arriving from various parts of Africa and Asia, the need for multilingual language access support became more pressing (Singer and Wilson 2004). The DCLAC brought Latino organizations together with other groups representing Asian and African population needs in the District to highlight the need for greater access and advocate together for LEP/NEP residents.
Living in or doing business in the District presented numerous language access challenges to LEP/NEP individuals. As members of the community, LEP/NEP individuals encountered public services in myriad ways, from riding on public transportation, to interacting with their children’s teachers and school administrators, to obtaining business licenses and driver’s licenses, applying for public benefits, and engaging with service providers and agencies. Most interactions of this type require reading and filling out forms and verbally communicating with frontline staff or administrators. The DCLAC and other stakeholders recognized that the processes presented potential language barriers and advocated for the language access policy.
The DC Language Access Act was passed and signed into law on April 21, 2004. At the time, language access was an issue resonating at the local, state, and federal levels. In 2000, President Clinton signed an executive order requiring all federally funded agencies to create language access plans. Several state and local jurisdictions passed formal legislation to implement language access in their areas, including San Francisco and Oakland in 2001 and New York City in 2003 (American University Washington College of Law Immigration Justice Clinic 2012).3
The Provisions of the Language Access Act
The major features of the Language Access Act include requirements for all District government programs, departments, and services with “major public contact” to assess and meet the language needs of “the population served or encountered, or likely to be served or encountered.” Entities are required to provide oral interpretation services to all clients and annually assess their oral interpretation services based on a four-point test, following a similar approach to federal guidelines (US Department of Justice 2011):
1. The number or proportion of limited or non–English proficient persons of the population served or encountered, or likely to be served or encountered by the covered entity, in the District of Columbia;
2. The frequency with which limited or non-English proficient individuals come into contact with the covered entity;
3. The importance of the service provided by the covered entity; and 4. The resources available to the covered entity.4
Entities are also required to provide written translations of documents and oral interpretation services for any language spoken by an LEP/NEP population that constitutes 3 percent or 500

TEN YEARS OF LANGUAGE ACCESS IN WASHINGTON, DC 9
individuals, whichever is less, of their service population, again, defined as “the population served or encountered, or likely to be served or encountered.”5
To implement these requirements, the Act provides an organizational structure for planning, supporting, and monitoring language access services. Each entity with major public contact is required to establish and implement a biannual language access plan (BLAP) and designate a Language Access Coordinator. The legislation outlines the requirements and metrics to be included in the language access plans, which are to be renewed every two years. The chief coordination role is assigned to the Office of Human Rights (OHR), led by a language access director, whose responsibilities include monitoring departments’ reporting and compliance, providing technical assistance and support, and investigating complaints from the public. The DCLAC has a consultative role, along with the mayor’s constituent offices for minority outreach.6
Office of Human
Rights
DC Language
Access Coalition
(40 CBOs)
Mayor’s Offices
on Constituent
Affairs (OLA,
OAPIA, OAA)
Advising Advising
Agencies
Advisin
g
Advisin
g
Monito
ring
Advisin
g
DC Public
Services
Information

10 URBAN INSTITUTE
The Act requires agencies to digitally collect data on language needs of clients, and it describes the additional data sources that entities should consult in assessing language needs. It lists various secondary sources, including census data sources and DC Public Schools (DCPS) data. Additionally, the Act identifies DCLAC and the mayor’s constituent offices responsible for LEP/NEP outreach as data sources (table 1).
Agencies are required to train personnel in public contact positions on how to serve customers with language access needs and hire bilingual personnel as needed. Finally, agencies are required to conduct public meetings on their language access plans to obtain community feedback, and to develop plans for periodic public outreach to members of the LEP/NEP community.
Table 1. Data Sources Cited in the Language Access Act for Informing Assessment of Language
Access Needs
From census sources From local stakeholders
US Census Bureau’s “Language Use and English
Ability, Linguistic Isolation” or successor reports
Intake data collected by covered entities
Any other language-related information Data collected by DC Public Schools
Census data on language ability indicating that
individuals speak English “less than very well”
Data collected by and made available by the
mayor’s constituent offices (OLA, AAPIA, OAA)
Local census data relating to language use and
English language ability
Data collected and made available by the DCLAC
Not all DC agencies that were designated as “covered entities with major public contact” were required to comply with these requirements immediately. The Act provided for a three-phase implementation: an initial group of eight agencies was required to develop language access plans immediately, an additional six by October 2004, an additional eight by October 2005, and the remainder by October 2006.7
Regulations passed in 2008 clarified that all District agencies with public contact are required to 1) support language needs with oral interpretation and written translation following the same requirements and baselines above, even when services are provided by subcontractors or grantees; 2) annually assess language needs and track language needs in their electronic data systems; 3) hire bilingual personnel as needed; 4) train staff on use of a telephonic interpretation line; and 5) provide multilingual signage.8 Only those “covered entities with major public contact”—mentioned in the Act or later designated by OHR—are required to designate language access coordinators; participate in the BLAP, quarterly reporting, and monitoring process; and pursue explicit community outreach surrounding language access.9
There was no mention of any specific languages in the Act, although one study interviewee reported that at the DC Council hearing where the Language Access Act was passed, the six most commonly used languages were highlighted: Spanish, French, Amharic, Chinese, Vietnamese, and Korean. One interviewee involved in DCLAC recalled that they had referenced DCPS statistics in order to identify top language needs. Thus, the exact origin of the list of six languages is unclear.

TEN YEARS OF LANGUAGE ACCESS IN WASHINGTON, DC 11
Evolution of DC’s Language Access Program
Creating this major institutional change was a significant undertaking. All interviewees for this study described the trepidation surrounding the policy change and the worries at agencies about the additional logistical and financial burdens of complying with the Language Access Act. Many recalled how agencies were at different starting points in 2004; some already provided some Spanish-language support services at the time of the Act’s passage, while others had virtually no language resources or knowledge of the language needs of clients. The agencies varied not only in function but also in size (number of employees and budget), as well as level 0f interaction with and outreach to LEP/NEP residents.
The creation of a new system of requirements, services, and reporting that would be applied in a diverse array of agency environments required significant coordination. The Office of Human Rights created a new language access director position; the candidate eventually chosen came from OHR’s existing staff. The director, along with only one additional staff member,10 coordinated with agencies to designate language access coordinators (LACs) and conduct baseline assessments of agencies’ language access needs and capacities. One interviewee shared that in the early stages of implementation, OHR looked to other jurisdictions that had developed language access policies, including San Francisco and Oakland. OHR staff also participated in formal best-practices sharing organized by the Annie E. Casey Foundation.
The funding for language access services was left to agencies, a dynamic described as an “unfunded mandate” by all interviewees. The resource base has varied significantly across agencies. In the Departments of Health and of Human Services, the LAC has been a full-time position. At the Metropolitan Police Department, a number of staff people are dedicated to language access and minority liaison work. At most agencies, the LAC role was added to the other duties of the individual chosen. Agencies report the amount of funding they spend on language access resources in their quarterly reports, mainly funds spent on document translations and telephone interpretation.
The DCLAC, which was prescribed a key monitoring and consultative role in the Act, also faced resource constraints. The DCLAC is an informal coalition made up of immigrant-serving nonprofits (today it has 40 members). Funding for staffing a leadership position was provided by one member community-based organization (CBO) for several years; and in 2010, the outreach functions were spun out into a separate organization, Many Languages One Voice (MLOV). The core legal and strategic competence remains with DCLAC, which lacks dedicated paid staff. The DCLAC regularly publishes opinions and advises OHR on language access policies; it also plays a key role in referring language access complaints and assisting individuals who experience violations of their rights under the Act.
In order to provide effective access to city services for LEP/NEP residents, stakeholders have worked in three major domains: identifying language needs, serving language needs, and monitoring that service provision.
Identifying Language Needs
OHR, the agencies, and the consultative organizations shared the task of identifying language needs. The initial group of agencies put together baseline assessments, and an orientation session was held with OHR and the participating agencies. Agency understanding of client language needs was limited not only by a lack of understanding of how well language needs were being met, but also by the nature of their tracking data to document encounters with LEP/NEP clients. OHR worked with agencies to help them figure out how to track usage of language access services and record client language needs in an agency-centralized manner by improving digital case management systems as well as training staff.
Agencies also engaged in a range of events and activities to raise public awareness about language access resources and identify community needs, such as by providing multilingual interpretation and

12 URBAN INSTITUTE
translated documents at informational and celebratory events, participating in job fairs and other public fora, and meeting with specific immigrant communities. Agencies reported working with other agencies and the mayor’s constituent offices to maximize public contact.
Serving Language Needs
OHR provided technical assistance to agencies in translating documents and providing telephonic or in-person interpretations. For the first group of eight agencies, OHR commissioned the translation of vital documents into six languages: Spanish, French, Amharic, Chinese, Korean, and Vietnamese. After the first group, agencies were responsible for commissioning and paying for translations of vital documents out of their own budgets. Agencies relied on different providers, whose inconsistent quality led to an effort by the District to select three vetted citywide translation and interpretation vendors in 2012 for all outsourcing. Agencies were also responsible for providing telephonic or in-person interpretation. At the time of the Act, there was a citywide contract for a telephonic interpretation service, which all agencies could access. Training efforts focused on ensuring that all frontline staff members were aware of the interpretation line and understood how to access it and offer it to clients in order to ensure their rights under the Act. OHR developed training on the Language Access Act and services, and OHR staff participated directly in agency-level staff trainings by providing modules on language access and cultural competency. Training of frontline staff and managers was required by the Act. By 2004, some agencies already had small numbers of bilingual personnel (some to comply with federal requirements), and others had no bilingual personnel at all.
Monitoring Language Access Services
OHR had the key monitoring role, working with agencies through the LACs, whom OHR met with regularly and convened quarterly (bimonthly beginning in fiscal year 2013). OHR set up a reporting and monitoring structure whereby agencies would send quarterly reports to OHR on their implementation, and these reports would be compiled to produce an annual compliance report that was made publicly available. One interviewee commented that this reporting structure was designed to help institutionalize language access consciousness and activity, routinize the process at the agencies, and raise the visibility and priority for language access issues within agencies. OHR used the annual compliance report to report back to agencies and to the public about the accomplishments and continued gaps in compliance, developing a testing methodology that evolved significantly over time.
OHR was also responsible for investigating complaints from the public about individual rights violations, eventually reporting the numbers of formal complaints and judged violations in the annual compliance report.

TEN YEARS OF LANGUAGE ACCESS IN WASHINGTON, DC 13
Demographic Analysis of the LEP/NEP Community
In this section, we describe the language and demographic characteristics of LEP/NEP individuals in the District of Columbia and the greater DC area using data from the American Community Survey (ACS). We present these data to provide one perspective on the needs that can be addressed through the Language Access Act of 2004. As explained earlier, the Act is designed to serve the language needs of current and potential clients of DC city agencies. Because different agencies serve different subpopulations of LEP/NEP individuals in the District (the elderly, workers, children, low-income families, business owners, etc.), we provide demographic characteristics of LEP/NEP people and families, to help policymakers and city agencies understand the contours of the population being served. Also, because some city agencies serve individuals who live outside the District but work, conduct business, or attend school in the District, we present characteristics of LEP/NEP people and families living in the greater DC area as well as those who live within the boundaries of the District. We define the greater DC area as the District plus the counties directly surrounding it: Montgomery and Prince George’s counties in Maryland; and Arlington County, Fairfax County (including Fairfax and Falls Church cities), and Alexandria City in Virginia.
In this section, we show that roughly 5 percent of the population in the District is LEP/NEP. Over half of LEP/NEP individuals in the District speak Spanish, while other top languages include Amharic/Ethiopian, French, and Chinese, among others. About two-thirds of LEP/NEP households in the District are linguistically isolated (meaning that nobody age 14 and older in the household is English proficient); one-third of households contain an English-proficient teenager or adult. LEP/NEP residents in the District are particularly concentrated along the 16th Street and Georgia Avenue corridors in Wards 1 and 4 (figure 6).
These constraints mean that the analysis presented here should not be used alone to determine the language service needs for any particular agency. The findings can be useful, however, in combination with service usage data and primary data collection at the community level, alongside a recognition of the different characteristics of agencies’ client bases.

14 URBAN INSTITUTE
Figure 6. Share of Residents Age 5 and Older Who Are LEP/NEP, by Census Tract and Ward in
the District of Columbia.
Source: ACS 2012 five-year estimates accessed through the National Historical Geographic Information System (Minnesota Population
Center 2011).
Ward Percent LEP/NEP
1 7.5%
2 4.9%
3 3.6%
4 10.5%
5 4.0%
6 2.7%
7 2.0%
8 0.9%

TEN YEARS OF LANGUAGE ACCESS IN WASHINGTON, DC 15
About the Data
We use the American Community Survey (ACS) to describe the LEP/NEP population because it is, by far, the
largest survey in the United States that captures detailed information on such topics as US residents’ country of
birth, language spoken at home, and English-speaking ability. The ACS is the only data source that provides
detailed characteristics of immigrants and LEP/NEP individuals in the District from a diverse set of countries
and language groups. In this section, we draw on data both from tables produced by the US Census Bureau,
accessed through American FactFinder, and tables we created ourselves using the ACS public use microdata
sample (PUMS).
The ACS is the survey that replaced the “long form” of the decennial census. It captures more detailed
demographic and household characteristics than the decennial census, on a large, representative sample of US
households—about 1 in 38 households per year. In addition, because the ACS collects information on a yearly
basis, we are able to combine information from multiple years to create a larger sample size. Nevertheless, the
ACS has some coverage gaps, especially for LEP/NEP individuals and immigrants, which we describe in appendix
A. We also detail the Census Bureau’s substantial efforts to provide translation and interpretation services and
to include LEP/NEP individuals in the ACS to the greatest extent possible.
The American Community Survey collects information on individuals’ English speaking ability and home
language using three questions. First, respondents are asked whether they speak a language other than English
at home. If they answer yes, they are asked to report what language they speak at home. Only one language is
recorded by the Census Bureau, even if respondents list more than one language spoken at home. Because the
language spoken at home is self-reported, the Census Bureau tabulates languages in the way they are recorded.
For example, some individuals write down a language category, rather than a specific language: a large portion
of those who speak a Chinese language write down “Chinese” rather than “Mandarin,” “Cantonese,” or
another specific Chinese language. Further, in order to protect confidentiality and simplify data tables and
datasets, the Census Bureau combines some less-common languages into categories. For example, the language
Tigrinya is combined with Amharic into the category “Amharic/Ethiopian.”
After writing down the language spoken at home, individuals who speak a language other than English at home
are then asked “How well do you speak English?” and are presented with the response categories “Very well,”
“Well,” “Not well,” and “Not at all.” Researchers generally define those who speak “Well” “Not well” or “Not
at all” as limited English proficient (LEP). Those who speak English “Not at all” are sometimes classified as non–
English proficient (NEP). While reports of English ability are subjective, and different individuals may have
different thresholds for determining that they speak English “very well,” these measures have been shown to
correlate, overall, with English ability as measured through more specific questions and language tests (Siegel,
Martin, and Bruno 2001).
While the ACS is the best source of secondary data for providing an overview of the LEP/NEP population at
the local level, the sample sizes are too small to permit a ranking of the top six or ten languages spoken in the
District among LEP/NEP individuals with any great certainty. Beyond the top language spoken (Spanish), we
cannot state with high confidence that language number two in the 2012 ACS is really more common among
LEP/NEP individuals in the District than language number three, or if the difference stems from unavoidable
random sampling error. What we can say is that language number two is more common than language number
four or five, for example, or that language number four in the greater DC area is more common than languages
eight through ten. Despite this limitation, we include some rank orderings of languages below to give a
suggestion of the top languages. Further, some newer or smaller immigrant communities may be too small to
appear yet in the Census data, even though they may represent a sizable portion of the service population of a
particular DC agency.

16 URBAN INSTITUTE
Analysis
English Ability
The Language Access Act is intended to help those who speak languages other than English to have meaningful access to city services. A substantial share (15 percent) of residents in the District speak a language other than English at home; in the greater DC area, that share is almost twice as high (29 percent). Most foreign language speakers in the greater DC area are English proficient. In the District, 32 percent of those who speak a language other than English at home are LEP/NEP and may require translation/interpretation services, while 68 percent are English proficient. In the greater DC area, 39 percent of those who speak a language other than English at home are LEP/NEP.
Most of those who speak a language other than English at home are foreign-born. In the District, about two-thirds (65 percent) of those speaking a language other than English at home are foreign born, while in the greater DC area, about three-quarters (74 percent) are foreign-born (figure 7).
Figure 7. Place of Birth and English Proficiency of Those Speaking a Language Other Than English
at Home in the District of Columbia and in the Greater DC Area
Source: 2012 three-year public-use microdata from the American Community Survey, accessed through the Integrated Public Use
Microdata Sample (IPUMS) (Ruggles et al. 2010).
About 26,400 people, or 5 percent, of DC residents age 5 and older, are LEP/NEP; in the greater DC area, 303,500 people, or 11 percent, are LEP/NEP. Of those who are LEP/NEP in the District, 85 percent are foreign-born and 15 percent are US-born. In the greater DC area, 92 percent of LEP/NEP individuals are foreign-born.
LEP/NEP individuals are particularly concentrated in certain neighborhoods of the District. The areas between 16th Street and Georgia Avenue in Wards 1 and 4 have particularly high concentrations of LEP individuals, as do some areas of Petworth. In contrast, most areas of southeast DC have low shares of LEP/NEP residents.
Top languages spoken. The District and the greater DC area are home to substantial language diversity. The top language spoken in the District, other than English, is Spanish. After Spanish, the top
languages are French, Amharic/Ethiopian, German, and Chinese.11
In the greater DC area, the top foreign languages spoken are Spanish, French, Chinese, Amharic/Ethiopian, and Korean.
The District of Columbia (N=83,568) The greater DC area (N=782,825)
US-born,
English
proficient,
22.9%
US-born,
limited
English
proficient,
3.2%
Foreign-
born,
limited
English
proficient,
35.5%
Foreign-
born,
English
proficient,
38.4%
US-born,
English
proficient,
30.7%
US-born,
limited
English
proficient,
4.6%
Foreign-
born,
limited
English
proficient,
26.9%
Foreign-
born,
English
proficient,
37.8%

TEN YEARS OF LANGUAGE ACCESS IN WASHINGTON, DC 17
Speakers of these different languages in the District have different levels of English proficiency and, thus, different needs for interpretation. LEP/NEP rates range from 50 percent among Amharic/Ethiopian speakers to 15 percent among German speakers (figure 8). As a result, the top languages spoken among LEP/NEP individuals in the greater DC area form a slightly different list.
Figure 6. English Proficiency by Language Spoken at Home in the District of Columbia
Source: 2012 three-year public-use microdata from the American Community Survey, accessed through IPUMS (Ruggles et al. 2010).
The most common language among LEP/NEP individuals in the District is Spanish, spoken by a majority (60 percent) of LEP/NEP individuals. After Spanish, the top languages are Amharic/Ethiopian, French,12 and Chinese. The sample sizes available are insufficient to precisely order the top ten languages among LEP/NEP individuals in the District, but other top languages include (in alphabetical order) Filipino/Tagalog, German, Kru/Ibo/Yoruba,13 Italian, Portuguese, and Vietnamese. The top four languages account for 79 percent of all LEP/NEP individuals in the District (figure 9).
31.5% 38.6%
16.8%
49.5%
14.7%
35.9%
68.5% 61.4%
83.2%
50.5%
85.3%
64.1%
All languages
(N=83,568)
Spanish
(N=41,477)
French
(N=7,645)
Amharic / Ethiopian
(N= 5,202)
German
(N=2,997)
Chinese
(N=2,310)
Limited English proficient English proficient

18 URBAN INSTITUTE
Figure 7. Language Spoken among LEP/NEP Population in the District of Columbia
Source: 2012 three-year public-use microdata from the American Community Survey, accessed through IPUMS (Ruggles et al. 2010).
In the greater DC area, the top ten languages spoken among LEP/NEP residents are Spanish, Chinese, Korean, Vietnamese, Amharic/Ethiopian, French, Filipino/Tagalog, Arabic, Kru/Ibo/Yoruba, and Persian/Iranian/Farsi. Apart from Spanish speakers, however, the number of speakers of each language is not statistically significantly from the number of speakers of the language right below it in this ordering. Therefore, this list should be taken as suggestive, rather than a definitive ranking of the top languages in the greater DC area. Looking at the top languages among LEP/NEP individuals in the greater DC area from 2005 to 2012 does not show any notable trends in the language composition of the LEP/NEP population over this seven-year period.
Demographic Portrait of LEP/NEPs
Below, we outline the demographic characteristics of LEP/NEP individuals and families in the District and the greater DC area, focusing on their country of birth, age, citizenship status, and household characteristics. We present these characteristics to give a better understanding of the diversity of individuals who make up the LEP/NEP population in the area, and to highlight portions of the LEP/NEP population that are particularly likely to interact with certain DC government offices. Figures 12 and 13 on pages 24 and 25 summarize the characteristics of LEP/NEP individuals in the District.
Countries of birth. The top country of origin among LEP/NEP individuals in the District is El Salvador, accounting for over one-quarter of the LEP population. The second-largest country of birth of LEP/NEP individuals in the District is the United States,14 followed by Ethiopia. The other top countries of birth of LEP/NEP individuals are, in alphabetical order, Brazil, China, the Dominican Republic, Guatemala, Honduras, Mexico, and Vietnam. Figure 10 shows the national-origin breakdown of the LEP/NEP population in the District.
Spanish
60.8%
Amharic / Ethiopian
9.8%
French
4.9%
Chinese
3.1%
All other
21.4%
N=26,373

TEN YEARS OF LANGUAGE ACCESS IN WASHINGTON, DC 19
Figure 8. Countries of Birth of the LEP/NEP Population in the District of Columbia
Source: 2012 three-year public-use microdata from the American Community Survey, accessed through IPUMS (Ruggles et al. 2010).
Age. In the District, 84 percent of LEP/NEP individuals are working-age adults (age 18–64), while 7 percent are children (age 5–17), and 9 percent are seniors (age 65 and older). The share of individuals who are LEP/NEP in the District is small among each age group. In the District, only 3 percent of children age 5 to 17 are LEP/NEP, only 5 percent of working-age adults age 18–64 are LEP/NEP and only 4 percent of seniors age 65 and older are LEP/NEP.
Figure 11 shows the age breakdown of LEP/NEP individuals speaking one of the top six languages in the greater DC area. We show these numbers for the greater DC area because the counts are too small in the data to calculate age by language spoken among LEP/NEP individuals in the District alone. Across the top six languages spoken by LEP/NEP individuals in the greater DC area,15 the majority of LEP/NEP individuals are working-age adults. These age distributions show that relative to speakers of other languages, a larger proportion of French- and Vietnamese-speaking LEP/NEP individuals are children (though the numbers of French- and Vietnamese-speaking children are still much smaller than the number of Spanish-speaking children), and a larger share of LEP/NEP Korean speakers are seniors.
El Salvador, 26.9%
United States,
13.8%
Ethiopia, 9.3% Guatemala, 6.0%
Honduras, 3.6%
Mexico, 3.1%
Dominican
Republic, 2.9%
China, 2.5%
Brazil, 1.8%
Vietnam, 1.5%
All other, 28.6%
N=26,373

20 URBAN INSTITUTE
Figure 9. Age Distribution of LEP/NEP Individuals by Language in the Greater DC Area
Source: 2012 3-year public-use microdata from the American Community Survey, accessed through IPUMS (Ruggles et al. 2010).
The top language spoken by LEP/NEP children, working-age adults, and seniors in the greater DC area is Spanish. After that, the most common four other languages spoken by LEP/NEP children in the greater DC area are French, Vietnamese, Chinese, and Filipino/Tagalog. Among working-age LEP/NEP adults, the top four languages spoken other than Spanish are Chinese, Korean, Vietnamese, and Amharic/Ethiopian. Among LEP/NEP seniors in the greater DC area, the most common languages spoken other than Spanish are Korean, Chinese, Vietnamese, and Persian/Iranian/Farsi.16
LEP/NEP status may affect access to city services and government agencies not only for LEP/NEP individuals, but also for children who live with LEP/NEP parents. Among young children (age 3–4) in the District, roughly 10 percent live with LEP/NEP parents—that is, they do not live with a mother or father who is English proficient. Among school-age children (age 5 to 17) in the District, about 7 percent live with LEP/NEP parents. Four percent of children (from birth to age 17) in the District live in linguistically isolated households, where nobody age 14 or older speaks English “very well.”
In the District, about 40 percent of LEP/NEP residents are citizens, while 60 percent are noncitizens.17 Fifty-one percent of LEP/NEP individuals in the District are female, while 49 percent are male.
7.8% 7.4% 6.3% 5.1% 10.9% 7.5%
15.1%
80.2% 86.0%
74.6% 70.6%
73.9% 84.9% 72.9%
12.0% 6.6%
19.1% 24.4%
15.2% 7.7%
12.0%
All languages(N=303,501)
Spanish(N=156,215)
Chinese(N=18,691)
Korean(N=15,794)
Vietnamese(N=14,883)
Amharic/Ethiopian(N=11,563)
French(N=11,081)
Age 5-17 Age 18-64 Age 65 and older

TEN YEARS OF LANGUAGE ACCESS IN WASHINGTON, DC 21
Figure 10. Demographic Characteristics of LEP/NEP Individuals in the District of Columbia
(N=26,373)
Source: 2012 three-year public-use microdata from the American Community Survey, accessed through IPUMS (Ruggles et al. 2010).
Household characteristics. LEP/NEP householders in the District are more likely to be married than English-proficient householders. About 41 percent of LEP/NEP householders are married, compared with 24 percent of English-proficient householders. In the District, about 55 percent of LEP/NEP heads of household have no children in their home, and 45 percent have one or more children. Among English-proficient heads of household, 76 percent have no children present, and only 24 percent have at least one child.
As a result of these higher rates of marriage and greater number of children, LEP/NEP families (headed by a LEP/NEP individual) are larger, on average, than English-proficient families. The average size of LEP/NEP families is 2.5 people, compared with 1.8 people in non-LEP/NEP families.
49.1%
6.9%
39.6%
50.9%
83.7%
60.4%
9.3%
Citizen Noncitizen
Male Female
Age 5-17 Age 18-64 Age 64
and
older

22 URBAN INSTITUTE
Figure 11. Demographic Characteristics of LEP/NEP Households in the District of Columbia
(N=9,495)
Source: 2012 three-year public-use microdata from the American Community Survey, accessed through IPUMS (Ruggles et al. 2010).
In the District, slightly less than half of LEP/NEP households have low incomes. About 24 percent of LEP/NEP households have income below the federal poverty level, and another 24 percent have incomes between 100 percent and 200 percent of the federal poverty level.
Poverty rates among LEP/NEP individuals vary slightly by language spoken. Figure 14 shows poverty rates by language spoken, for the top languages spoken by LEP individuals in the greater DC area; sample sizes are not sufficient to calculate these numbers for the District alone.
23.8%
41.4%
66.9%
54.9%
24.0%
58.6%
33.1%
21.1%
52.2%
15.0% 9.1%
Married Not married
Linguistically isolated Not linguistically isolated
No children 1 child 2 children 3+
children
Poor: below federal
poverty level
Low-income: 100-200%
of federal poverty level At least 200% of federal poverty level
TEN YEARS OF LANGUAGE ACCESS IN WASHINGTON, DC 23
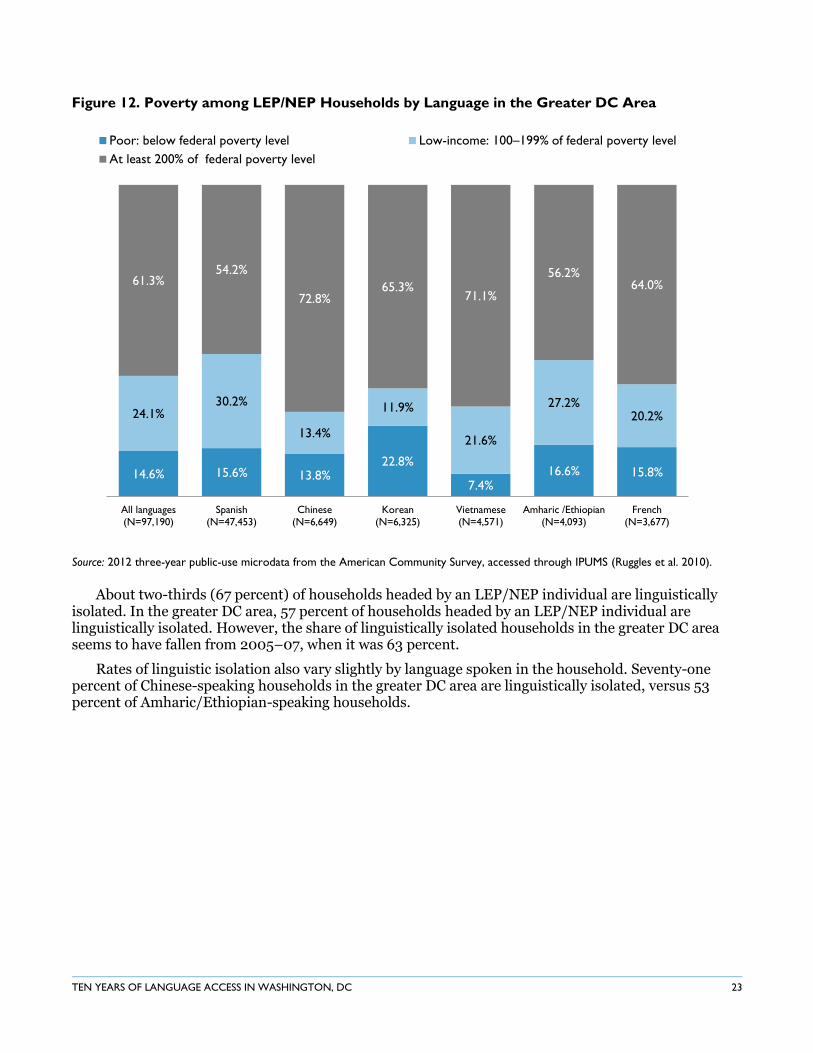
Figure 12. Poverty among LEP/NEP Households by Language in the Greater DC Area
Source: 2012 three-year public-use microdata from the American Community Survey, accessed through IPUMS (Ruggles et al. 2010).
About two-thirds (67 percent) of households headed by an LEP/NEP individual are linguistically isolated. In the greater DC area, 57 percent of households headed by an LEP/NEP individual are linguistically isolated. However, the share of linguistically isolated households in the greater DC area seems to have fallen from 2005–07, when it was 63 percent.
Rates of linguistic isolation also vary slightly by language spoken in the household. Seventy-one percent of Chinese-speaking households in the greater DC area are linguistically isolated, versus 53 percent of Amharic/Ethiopian-speaking households.
14.6% 15.6% 13.8% 22.8%
7.4% 16.6% 15.8%
24.1% 30.2%
13.4%
11.9%
21.6%
27.2% 20.2%
61.3% 54.2%
72.8% 65.3%
71.1%
56.2% 64.0%
All languages(N=97,190)
Spanish(N=47,453)
Chinese(N=6,649)
Korean(N=6,325)
Vietnamese(N=4,571)
Amharic /Ethiopian(N=4,093)
French(N=3,677)
Poor: below federal poverty level Low-income: 100–199% of federal poverty level
At least 200% of federal poverty level

24 URBAN INSTITUTE
Figure 13. Share of Linguistically Isolated LEP/NEP Households in the Greater DC Area,
by Language
Source: 2012 three-year public-use microdata from the American Community Survey, accessed through IPUMS (Ruggles et al. 2010).
As these data show, LEP/NEP individuals in the District and the greater DC area come from various countries, speak various languages, and have varying socioeconomic and household characteristics. As a result, different agencies across DC are working to meet different language needs, depending on the characteristics of their particular client population. Schools that interact with LEP/NEP parents may need to accommodate different language needs than public benefits administrators that serve low-income families. The next section outlines some of the successes and challenges in meeting these diverse language needs to date.
Navigating the Implementation of Language Access:
Accomplishments and Challenges
Washington, DC, has a complex Language Access Program that is now implemented (at varying funding and compliance levels) in 34 agencies. Agency efforts are coordinated, monitored, and enforced through the Office of Human Rights, which has evolved its nuanced approach considerably over the decade. The program has made significant strides in identifying, serving, and monitoring the diverse language needs presented by the public in a challenging fiscal and institutional climate. The city has achieved successes and faces continued challenges on a wide range of issues: public awareness of language access services, the collection of accurate tracking data on needs and service use, the analysis of diverse data sources to inform policy and planning, constraints on available demographic measures, training of District personnel and staffing of language access duties, the continued development and improvement of
43.4% 46.0%
29.3% 37.8%
44.5% 47.2% 43.4%
56.7% 54.0%
70.7% 62.3%
55.5% 52.8% 56.6%
All languages(N=97,190)
Spanish(N=47,453)
Chinese(N=6,649)
Korean(N=6,325)
Vietnamese(N=4,571)
Amharic /Ethiopian
(N=4,093)
French(N=3,677)
Not linguistically isolated Linguistically isolated

TEN YEARS OF LANGUAGE ACCESS IN WASHINGTON, DC 25
translation and interpretation services, coordination across agencies, the will and support of agency leadership, monitoring and reporting, and the enforcement of compliance.
Identifying Language Needs
Public Awareness of Language Access Services
Although agencies are required to analyze multiple data sources to inform their assessment of their clients’ language needs, usage data play a key role. Usage data reflect only those encounters with clients who have come forward and presented language access needs. For this reason, public engagement to educate the LEP/NEP community about their language access rights and the services available is critical. Public awareness of services is the foundation of any effective program targeted to hard-to-reach populations.
Interviewees largely agreed that public awareness of DC’s language access resources has increased over the past decade. Most interviewees reported their belief that members of the public are aware of their rights under the Language Access Act and the language access services available in different agencies. Some interviewees expressed concern, however, that further public education is necessary, particularly in the African community. Spanish and Asian language groups have a longer history of organizational representation and advocacy in the District and, therefore, may be better informed and represented.
Public education efforts have relied on initiatives by agencies, the mayor’s constituent offices, and the DCLAC (and MLOV), as well as OHR itself. The mayor’s constituent offices play an important liaison role for individual residents, often referring or connecting individuals to services and following up on specific instances of barriers to translation or interpretation on behalf of individuals. Immigrant-serving CBOs also take on this role, linking individuals to District services and legal-aid organizations supporting victims of language access violations.
Tracking Language Access Needs and Services Use
Documenting clients’ language needs as well as their use of multilingual services is crucial from both a user and a management perspective. Documenting the language need of a client with language barriers on first contact ensures that staff are aware and prepared to manage the client’s particular needs in subsequent encounters. Tracking client need and use is also critical for producing data to inform Language Access Coordinators, OHR, and other stakeholders.
Interviewees agreed that some agencies have made progress on tracking data. Improvements include adding language need fields to case management data systems, and increasing employee training and awareness of the importance of documenting language needs. Several government interviewees reported that after years of work, they had managed to create more cohesive data tracking systems. OHR has been working with agencies to continue improving data tracking, but highlights the issue as a major implementation gap in its most recent compliance report; a recent study with DCLAC input makes the same point (OHR 2013; American University Washington College of Law Immigrant Justice Clinic 2012).18 Ensuring that all employees consistently offer and document needs is an ongoing challenge; field-testing results indicate significant gaps in consistent offering of language access services by frontline employees. Encounters in which language access services are not offered doubtlessly also go unreported, leading to an underestimation of need. In addition, some LACs are still receiving user data in inconsistent formats across different units in agencies and suspect that not all bilingual encounters are reported.
Some interviews also cited self-identification by users as a challenge to tracking and serving needs. Not all those who might benefit from multilingual resources are willing to identify with a non-English language need; an individual may insist on communicating in English despite difficulties. Distrust may be another factor; individuals may not want to be identified as LEP or NEP because they fear discrimination or possible attention to immigration status.

26 URBAN INSTITUTE
Analysis of Data to Inform Policy
LACs are required, with the assistance of OHR and other stakeholders, to analyze their user data as well as other sources of demographic statistics in order to inform decisions about which languages to support and how to do so most effectively. Effective analysis of data is important for evaluating the effectiveness of existing services, anticipating emerging unmet needs, and making management and budgetary decisions for targeting limited resources. Full support of all language needs is limited not only by the resource and other constraints on providing service but also the data collection and analysis required to identify needs.
Efforts to be responsive to changing needs are ongoing. Several interviews referenced an initial (and still dominant) focus on Spanish as the default language, especially for document translations, and a more recent recognition and addition of Amharic as the second-most commonly encountered language in some agencies. Anecdotally, one government interviewee described the response of an agency to a change in language line usage. The agency is following up with additional research and recognition of Tigrinya as a newly emerging language.19 Advocates have proposed other new language needs, such as Tagalog, Arabic, and African languages such as Kru or Ibo.
Interviewees agreed that LACs are still facing significant challenges in collecting and analyzing language needs data. A recent study criticized the weakness of agency research and analysis to determine which language groups are meeting the 3 percent or 500-person benchmark (AU WCL IJC 2012). Several interviewees discussed the complexity of assessing language needs and analyzing performance usage data and demographic data, including addressing concerns about the accurate representation of the size of specific communities in Census and other statistics. The mayor’s constituent offices and OHR were often mentioned as information sources, but LACs did not highlight the DCLAC’s role in informing decisions, which is surprising given the role ascribed to DCLAC in the language of the Act.
More fundamentally, interviews revealed that some stakeholders were ignorant of the agency-level requirements for determining language needs. Almost all interviewees described the Language Access Act as requiring translation into the specific “core list” of languages, listed as five, six, or seven (depending on the interviewee). This reflects an institutionalization of the six languages initially chosen at the launch of the implementation period, but which are actually not required by the Act unless they meet the 3 percent or 500-person benchmark for each specific agency. Many stakeholders, including OHR, have recommended that the list be revisited to ensure that it is accurately covering the most important current language needs of client and potential client populations (OHR 2011).
Constraints on Available Demographic Measures
Some interviewees expressed concern that census data undercount members of certain national origin or language groups and, particularly, LEP/NEP individuals or undocumented immigrants. Many of the interviewees described this as a limitation for assessing language needs. As described in detail earlier and in appendix A, the US Census Bureau uses several tools in order to attempt to reach a sample of Americans that is representative, including immigrants and those with limited English proficiency. However, even if the Census Bureau can reach a fully representative sample of individuals, the sample size is only so big; and, in a jurisdiction as small as Washington, DC, it may be difficult to estimate language needs among small subpopulations. For example, census data do not have large enough sample sizes to permit reliable estimates of top language needs among poor households or among the elderly in the District. Such subpopulations may access certain city services at high rates, leading to a strong policy imperative to collect additional sources of data on these groups. These limitations of the demographic data highlight the need for stakeholders and District government to consider the multiple data sources available, including user data as well as other sources of information that may reveal difficult-to-capture community needs.

TEN YEARS OF LANGUAGE ACCESS IN WASHINGTON, DC 27
Serving Language Needs
Training of District Employees and Staffing of Language Access Duties
Employees of the District of Columbia are on the front lines of language access service. Face-to-face and telephone encounters are primary sites for detecting and serving language needs. Interviewees agreed that DC employees have become more aware of language access, and that trainings on both the rights of LEP/NEP clients and language access services have been effective, although challenges remain. One of the most common challenges cited is agencies’ capacity to meet language needs on top of the rest of their caseload. In high-traffic offices dealing with vulnerable, disadvantaged clients, providing language access adds more work to an already overburdened system.
Increasing bilingual staff capacity would assist greatly, as several studies recommend (Chatlosh and Ayometzi 2013; AU WCL IJC 2012). Some interviewees said that finding sufficient bilingual employees is not the main barrier to filling bilingual needs, pointing instead to limited funds and DC hiring practices that make it difficult to incorporate bilingual requirements into job descriptions. Some interviewees emphasized lack of understanding or appreciation of language ability as a valuable skill that should be recruited and rewarded.
LACs are given significant responsibilities and often not supported with sufficient resources at their agencies. In addition to significant reporting requirements, LACs are responsible for training, oversight, management of translations, dealing with complaints, resolution of individual cases of language access difficulties, and, in some cases, serving as the general reference person for all issues requiring bilingual support. Anecdotally, one government interviewee reported that when his agency was seeking to hire bilingual employees, he was asked to test the language proficiency level of applicants.
In recognition of the difficulties that LACs were facing, often isolated and slowed down by bureaucratic hurdles within their agencies, OHR shifted toward a team-focused system in 2013. Under the new approach, OHR asked agencies to spread responsibility and knowledge across multiple employees. OHR now requires that each agency nominate a team of individuals from different agency functions (contracts, hiring, frontline operations, language access, and others) to coordinate on that agency’s language access services and meet once annually. Several interviewees commented that this approach was preferable to the old system.
Language Access Materials and Services
Stakeholders agree that use of language access services has increased over the past decade, citing increased language line usage and the availability of more documents in translation. More vital documents are translated, and language line use has increased significantly in many agencies. More languages are also increasingly being covered, although Spanish is still privileged and other languages are not receiving equivalent resources in most cases. Spanish speakers are the largest single language-need group in both the DC and metropolitan DC populations, so resources may be proportionate to need for particular services. Yet, it is important that agencies not treat Spanish supports as sufficient for covering the diverse language access needs that may make up their current and potential client base.
Providing effective services still faces many challenges. Although documents may be translated, some interviewees voiced concern about quality control. Others pointed out the difficulty of maintaining updated documents. Web resources in multiple languages also require further attention, as highlighted in OHR’s recommendations in the latest annual compliance report (OHR 2014). Interviewees referenced agency documents available online as well as the OHR website itself.20 Since early 2013, OHR has led an initiative to require agencies to provide multilingual access links on their agency pages; links in each of the six high-frequency languages will take users to basic descriptions of that agency’s activities as well as translated vital documents. Coordinating across agencies has been a challenge, but many of the websites have become operational.

28 URBAN INSTITUTE
Although telephone language line usage has increased across city agencies, providing in-person bilingual interpreters may be more effective in certain situations and is certainly preferable if the resources exist. Several interviewees noted that in particularly sensitive interactions, telephone line interpretation can make clients uncomfortable and less willing to communicate; it can also lead to miscommunication, which may have consequences for clients’ understanding of requirements, deadlines, or other information. Many interviewees highlighted the need for more in-person bilingual interpretation to complement the language line resource.
Many interviewees also described widespread informal interpretation practices, when an individual client will rely on a friend or family member to interpret, or a bilingual employee whose job description does not prescribe that function is called on to interpret or translate, raising privacy and confidentiality concerns.21 Several interviewees described Latino employees being pushed to take on interpretation duties regardless of their actual language ability.
Coordination and Centralization
Best practices on municipal language access provision emphasize the benefits of centralizing resources across agencies. This could mean facilitating communication or coordination between agencies, identifying common procurement sources for translation and interpretation, centralizing data collection, or other forms of cooperation. OHR’s coordination offers a promising lead for such centralization efforts. Centralization can be a slow process, but it appears that some efforts have been effective. Many interviewees mentioned the 2012 establishment of common procurement sources for translation and interpretation providers, most describing it as a positive development (though some expressed concerns about the particular choice of providers).
Some interviewees highlighted the potential for greater coordination among agencies, though the diversity of agency contexts is a challenge. Some LACs describe the quarterly meetings of all the LACs with OHR as an effective space for mutual learning, though several expressed frustration about the diversity of agencies and sometimes-mismatched needs and interest levels. To supplement the quarterly meetings, some LACs interact with other individual LAC that may be facing similar issues with specific subpopulations or working on a similar scale.
Will and Support from Agency Leadership
Although language access is coordinated by the Office of Human Rights, implementation takes place in agency environments and relies on agency budgets. Although agencies generally have advanced on this issue over the past decade, interviewees revealed that language access is not prioritized in all agencies. One government interviewee described feeling grateful that his agency director prioritized the issue and delegated necessary resources, while he described other efforts as being more marginalized and less supported by their agency leadership.
OHR has made more recent efforts to foster high-level contact with agency leadership, seeking to develop stronger relationships directly between OHR and the agency directors in order to build awareness and support for language access. Recent processes of reviewing the fiscal year 2013–14 BLAPs, for example, prioritized a direct connection between OHR and directors.
Monitoring Language Access Services
Monitoring and Reporting
OHR has changed the reporting, monitoring, and scoring process significantly over the years, developing an annual report that is far more detailed than that prepared by other jurisdictions with active language access programs, such as Montgomery County, MD; Arlington County, VA; or Oakland, CA. OHR’s annual compliance reports evolved considerably over the years. The first one, in 2007, presented only summary results. In later years, under different language access directors, the reports developed a more detailed scoring mechanism for measuring compliance. OHR added a field-testing

TEN YEARS OF LANGUAGE ACCESS IN WASHINGTON, DC 29
component in fiscal year 2009 to more closely monitor agencies (OHR 2009) and modified the scoring methodology in fiscal year 2012 after a review of rating and assessment methods. The annual compliance report now includes a narrative-based scorecard for each agency (OHR 2013), designed to provide more transparency and more useful guidance.
The BLAPs were also redesigned in two phases, initially in 2011, under a new director, to move away from a narrative-based approach that was producing inconsistent results across agencies. Several LACs were convened on a number of occasions to provide their feedback on the new reporting format. Under a new director in 2013, the BLAPs were revised again, to approach a more survey-like approach with multiple-choice options and checklists.
Several interviewees objected to the amount of detail required in the BLAPs and questioned the value of the reporting. Some expressed concerns about the amount of time required to prepare the reports and wondered about the added value of providing the required information other than for OHR reporting.
Enforcing Compliance
Enforcing against noncompliance was one of the most commonly cited challenges to the Language Access Program. OHR monitors compliance in two major ways: through review and scoring of agency compliance based on quarterly reports and BLAPs, and through investigation of individual complaints of language access violations.
OHR reports on agencies’ compliance annually in the compliance report. It computes a score for individual agencies based on field testing and performance in attaining requirements. Advocates object to the fact that agencies are never rated as noncompliant, even if OHR identifies major implementation gaps in its annual review. This connects to the larger challenge that the Language Access Program confronts: the “lack of teeth” to the Language Access Act—namely, the lack of a mechanism that enforces significant consequences for agencies found to be less than 100 percent compliant with the requirements of the Act (AU WCL ICJ 2012).
The advocacy community is also concerned about the individual complaints process, and the DCLAC has provided guidance and suggestions to OHR to improve the system. Several interviewees highlighted the opacity and length of the complaints investigation process, the lack of multilingual options for the actual complaints submittal link on the OHR website, and the lack of transparency about the number of informal complaints (noting that OHR does not report individual complaints that may have been submitted but do not end up generating a full investigation). The DCLAC has also pressed for an individual right-of-action and a right to appeal OHR decisions. One interviewee reported that OHR had worked to improve the complaints process, using regulatory modification to add a right to appeal an OHR decision to the Office of Administrative Hearings, or providing more informal support through conscientious treatment of individual complaints by specific OHR staff members (following up with individual complainants to encourage them to stick with the complaints process). Though criticisms about the effectiveness of the complaints process are common, one interviewee described the corrective action process—which is initiated when OHR finds a violation and requires action on the part of the offending agency—as an effective threat, one that has encouraged his agency to act conscientiously on language access service provision.
Recommendations
Based on insights collected through the stakeholder interviews and review of best practices as well as our understanding of DC’s institutional and demographic context, we propose several recommendations for city officials and stakeholders as they continue to improve the Language Access Program and weigh difficult decisions about future planning and the use of limited resources.

30 URBAN INSTITUTE
These recommendations echo many already provided in previous studies, highlighting the substantive consensus that largely exists among language access stakeholders about remaining gaps and priorities for improving implementation.
Improve Data Collection and
Analysis
Continue public engagement efforts to raise public awareness of language access services among constituent groups, particularly newcomers and their families.
Further develop rigorous data collection on the language needs of clients and potential clients. o Continue to develop effective data
tracking and strive for consistency and coordination across agencies; help agencies learn from each other.
o Continue to seek current demographic data and share all information and research with agencies; this should include studies by formal consultative bodies (Chatlosh and Ayometzi 2013; Lee 2011) as well as cutting-edge research on municipal integration policies toward LEP/NEP populations.
Explore new sources of data to inform language needs assessment. o Collect additional data to assess customer satisfaction with language access services, potentially
using customer surveys at points of service (New York City Mayor’s Office of Immigrant Affairs 2013; Laglagaron and Sperling 2009).22
o Collect community-based primary data, partnering with CBOs to capture characteristics and language needs of hard-to-reach populations (US DOJ 2011).23
Consider how data analysis practices can be improved in order to better meet the requirements of the Act and improve services. o Provide more detailed guidance to LACs on how to analyze their usage data and other data
sources. o Ensure that all stakeholders understand the requirements of the Act. o The languages that hit the 500 person or 3 percent benchmark should be determined as
required by the Language Access Act, based on agency-specific context and the existing and potential customer base of each agency.
o Assist agencies in evaluating their language access services, or commission an objective evaluator to conduct a comprehensive needs assessment and implementation evaluation of Language Access Program.
The District is not alone
District officials should take the opportunity to learn from
good practices in use in other jurisdictions dealing with
similar challenges. Neighboring jurisdictions such as
Montgomery County, MD, and Arlington County, VA, as
well as Fairfax County, VA, all have made efforts to
support the language needs of their diverse residents.
These are counties with significant foreign-born
populations and LEP/NEP needs, with similar or even
greater linguistic diversity than District residents. The
LEP/NEP populations in the greater DC area, including
these suburbs, have a wide range of linguistic needs.
Serving a super-diverse client base poses similar
opportunities and challenges outside the District.

TEN YEARS OF LANGUAGE ACCESS IN WASHINGTON, DC 31
Recognize Importance of Human
Capital
Invest in the District’s multilingual personnel. o Modify hiring and recruitment practices
so agencies can recruit and retain highly skilled bilingual employees required, whether that means greater outreach, changes in job descriptions, wage differentials,24 or other tools.
o Whenever possible within agency constraints, hire additional bilingual personnel in top languages used by agency clientele.
Leverage existing resources more effectively at low cost. o Recognize, test, and train current
personnel who have bilingual skills. o Take advantage of Washington’s highly-
educated foreign-born population to fill bilingual need; engage directly with CBOs to help identify qualified bilingual individuals25 and seek support from the business community.
o Continue team-based agency approach in order to support LACs, and foster high-level support from managers, Directors, and above.26
Improve Quality and Accessibility of
Current Services and Materials
Ensure that all language needs are being served, in all needed languages, at high quality, and in accessible formats, while taking into account resource constraints. o Be sensitive to the dynamic nature of
LEP/NEP needs, in consideration of changing inflows and residence patterns, emerging language and service needs, and movement towards English proficiency.
o Consider certification of interpreters and translators in order to ensure quality (Laglagaron and Sperling 2009).
o Consider evaluating the quality of the new providers to ensure that translation quality is sound, and incorporate perspectives from customers, LACs, the Mayor’s constituent offices, and DCLAC/MLOV.
Continue cross-agency coordination to promote efficiencies in leveraging existing resources.27
Leveraging bilingual skill
Montgomery County also has a language access policy,
framed by a 2010 executive order that requires county
agencies to take meaningful steps to provide access to
LEP/NEP residents. The organizational setup has some
similarities with the District’s, requiring departments to
create language access plans and designate liaisons
responsible for assessing and serving language needs. An
LEP leadership team, made up of representatives from
multiple departments, may serve an advisory committee
function. The language access coordinator is based in the
Office of Community Partnerships, the government office
responsible for community outreach.
The county shows some promising practices in particular
on leveraging bilingual skills. Montgomery County was an
early mover on rewarding bilingual county employees,
providing a pay stipend for those certified proficient in
second languages at a basic or advanced level. These
bilingual staff resources are centralized through a language
certified employees database, which departments can
access to fill particular needs as they arise. The county
also takes advantage of the public’s linguistic skill through
a volunteer-staffed language bank, with bilingual individuals
on call to help translate or interpret for both county
agencies and nonprofit organizations.
Collecting information on the customer
experience
New York City, a much larger city drawing on potentially
greater resources, is another interesting case that can
offer some good practices. New York has several similar
organizational features to the District’s Language Access
Program model, such as language access coordinators for
different agencies and a field testing process of actual
agency compliance through “secret shopping” conducted
since 2010. One notable innovation is the use of
customer satisfaction surveys, distributed in the top six
languages throughout service points in different agencies
(New York City Office of Immigrant Affairs 2013). This
provides municipal agencies an opportunity to collect
feedback from customers about their use of language
access services. Although this data source faces limitations
and still must be complemented by additional sources of
information on unmet community needs, it could provide
a valuable further source of evidence to inform policy
decisions.

32 URBAN INSTITUTE
Consider Investing More Resources in the Language Access Program
Carefully consider the costs and benefits of keeping language access at current, agency-specific funding levels.
Bearing in mind the policy tradeoffs and limited budget, consider investing more funds in order to ensure full access to LEP/NEP residents.
Improve Coordination between Agencies
Continue efforts to coordinate language access efforts across agencies and centralize resources for LACs. o Consider creating an LEP/NEP data and evaluation oversight committee to help OHR provide
technical assistance to agencies (Laglagaron and Sperling 2009); this could include the DCLAC and mayor’s constituent offices as well as external research and service provision experts.
Continue to recognize that one size may not fit all for such a diverse array of agencies. o Facilitate coordination between subgroups of agencies that could learn from each other or
coordinate more effectively on a smaller scale. o Collect information on what LACs still require in order to accomplish their responsibilities. o Encourage agencies to be responsive to the language needs of their specific client bases.
Pursue Aggressive Community Engagement
OHR and agencies should continue to actively cooperate and involve DCLAC/MLOV and the mayor’s constituent offices so community engagement grows, particularly for less-established language communities.
Engaging the LEP/NEP users in public fora and through advertising campaigns should continue, complemented by a focus on centralizing resources for LEP/NEP residents in an accessible, modern format such as web or smart phone resources.
Web investments should take into account best practices such as stand-alone URLs, quality control on translations, and so on.28
Continue Transparent Monitoring Process
Consider stakeholder suggestions and feedback on the monitoring process.
Consider modifications to the reporting process in dialogue with LACs, the DCLAC, and mayor’s offices.
Provide LACS further education on the rationale of BLAP revisions and the current reporting structure and requirements.
Making web access accessible
Arlington County passed a language access resolution
in 2004, with a key assistance and monitoring role
provided by the Office of Human Rights and authority
falling to the county manager. Arlington offers some
promising practices on website accessibility for
LEP/NEP residents, geared in particular for Spanish-
speaking residents, who are the county’s single largest
language need group. Spanish-language website
resources are centralized as a mirror page to the
main county website. There are gaps in providing
translation of all website material, but lessons can be
drawn on easy accessibility.

TEN YEARS OF LANGUAGE ACCESS IN WASHINGTON, DC 33
Examine Enforcement Possibilities
Consider the objections to the current enforcement process and explore possibilities for how to add “teeth” to the Language Access Act.
Continue attempts to increase the transparency of the individual complaints process.
Consider reporting informal complaints that are reported to agency staff, mayor’s constituent offices, DCLAC, and CBOs but that do not go through the full OHR investigation process.
Strive for timely processing of individual complaints, and reduce barriers to individuals in order to make sure that all complaints are investigated.
Summary
This report provides an overview of the District of Columbia’s Language Access Program and LEP/NEP population in the context of the city’s diverse population and global stature. District agencies are challenged to meet a diverse set of language needs in serving the 5 percent of District residents with limited English proficiency. Speaking primarily Spanish, but also a wide range of languages including Amharic/Ethiopian, French, Chinese, Filipino/Tagalog, German, Kru/Ibo/Yoruba, Italian, Portuguese, and Vietnamese, the diverse LEP/NEP population in the District and in the greater DC area presents a challenge to agencies seeking to serve the language needs of their clients.
To meet these needs, stakeholders recommend that the District consider investing further resources into the provision of high-quality services informed by rigorously collected and analyzed data. Next steps could including provide further assistance in interpreting both census statistics as well as usage data, and continuing to encourage agencies to collect consistent information about their current and potential client base as well as explore additional data sources. Other next steps should include careful consideration of bilingual personnel resources and recruitment and retention practices, and continued efforts to strive to improve language access services provided by agencies. Efforts to ensure quality control, engage the LEP/NEP community, and fairly and transparently monitor and enforce the requirements of the Language Access Act should continue and take key stakeholder perspectives into account.
The diversity of customer bases and resources available across different agencies poses a challenge to coordination and monitoring. It is crucial to keep in mind that while coordination across agencies must continue, one size does not fit all when it comes to language access. Agencies should strive to tailor language access resources to their particular client and potential client needs.
The Language Access Program builds on a strong legislative base and a vibrant community of stakeholders that contribute to assessing, supporting, and monitoring services to the District’s diverse LEP/NEP population. Decisionmakers and stakeholders should continue to work together to improve the Language Access Program and strive to ensure that the District provides necessary supports for its diverse population.

34 URBAN INSTITUTE
Appendix A. Limitations of the American Community Survey
The US Census Bureau, which runs the ACS, expends considerable time and effort attempting to reach a sample of Americans that represents the full diversity of the country, including immigrants and those with limited English proficiency. First, to protect against non-response by LEP/NEPs, they maintain a language assistance program, which translates documents into multiple languages, recruits and trains bilingual interviewers and provides telephone or Internet assistance in multiple languages (US Census Bureau 2009). The Census Bureau also conducts research to understand the census-taking experiences of limited English proficient individuals in order to make improvements (see, for example, Whitworth 2001 or Pan and Lubkemann 2012). The Census Bureau analyzed the share of households that do not answer the ACS because of language barriers. Nation-wide, this share is essentially 0 percent. There are only two US counties (both outside of the DC metro area) where language problems lead to more than 1 percent of households failing to answer the survey (Griffin and Broadwater 2005).
Undercount rates for other Census data (the 2010 Decennial Census) is estimated at around 1.5 percent for the Hispanic population, 2.1 percent for the black population, and about 0.1 percent for the Asian population nationwide.29 Demographers estimate that this share is larger for immigrants. Some estimate an undercount of about 10 percent for undocumented immigrants and 2.5 percent for legal immigrants (Hoefer, Rytina, and Baker 2011). Evidence suggests the Census is getting better at surveying immigrant households (Passel, Cohn, and Gonzalez-Barrera 2013). Sampling weights are provided and used in this analysis to help correct for under-sampling of certain populations at the state and local levels.

TEN YEARS OF LANGUAGE ACCESS IN WASHINGTON, DC 35
Appendix B. Agencies Required to Conform to the Language
Access Act by Compliance Date
Phase 1 (April 4, 2004)
Department of Health
Department of Human Services
Department of Employment Services
Metropolitan Police Department
District of Columbia Public School System
Office of Planning
Fire and Emergency Medical Services
Office of Human Rights
Phase 2 (October 1, 2004)
Department of Housing and Community Development
Department of Mental Health
Department of Motor Vehicles
Child and Family Services Agency
Alcoholic Beverage Regulation Administration
Department of Consumer and Regulatory Affairs
Phase 3 (October 1, 2005)
Department of Parks and Recreation
Office on Aging
District of Columbia Public Library
Office of Personnel
Office of Contracting and Procurement
Department of Corrections
Department of Public Works
Office of Tax and Revenue
Phase 4 (October 1, 2006)
DC Housing Authority
Office of the People’s Counsel
Homeland Security and Emergency Management Agency
other covered entities

36 URBAN INSTITUTE
References
American University Washington College of Law Immigrant Justice Clinic and D.C. Language Access Coalition (DCLAC). 2012. Access Denied: The Unfulfilled Promise of the D.C. Language Access Act. Washington, DC: American University Washington College of Law http://www.wcl.american.edu/news/documents/AccessDenied.pdf.
Arlington County Government. n.d. “Limited English Proficiency Policy Implementation: County Manager’s Initiative to Enhance Accessibility of County Services to Persons with Limited English Proficiency, Fiscal Year 2011-2012.” http://www.arlingtonva.us/departments/CountyManager/HumanRights/Limited%20English%20Proficiency%20Policy%20Implementation.pdf.
Capps, Randy, Everett Henderson, Jeffrey S. Passel, and Michael Fix. 2006. “Civic Contributions: Taxes Paid by Immigrants in the Washington, DC, Metropolitan Area.” Washington, DC: The Urban Institute. http://www.urban.org/publications/411338.html.
Chatlosh, Kelsey, and C. C. Ayometzi. 2013. “Accessing and Providing: Frontline Voices on Language Access” Washington DC Executive Officer of the Mayor, Office on Latino Affairs.
Government of the District of Columbia Office of Human Rights (OHR). 2007a. “Language Access Fact Sheet.” Washington, DC: OHR.
———. 2007b. “The Implementation of the D.C. Language Access Act of 2004: A Compliance Review (Fiscal Years 2005-2007).” Washington, DC: OHR.
———. 2008. “Implementation of the D.C. Language Access Act of 2004: A Compliance Review for Fiscal Year 2008, Executive Summary.” Washington, DC: OHR.
———. 2009. “Language Access in the District: An Annual Compliance Review and 5-Year Checkpoint.” Washington, DC: OHR.
———. 2011. “Language Access in the District: 2010 Annual Compliance Review.” Washington, DC: OHR.
———. 2012. “Language Access in the District: 2011 Annual Compliance Review.” Washington, DC: OHR.
———. 2013. “Language Access in the District: 2012 Annual Compliance Review.” Washington, DC: OHR.
———. 2014. “Language Access in the District: 2013 Annual Compliance Review.” Washington, DC: OHR.
Griffin, Deborah, and Joan Broadwater. 2005. “American Community Survey Noninterview Rates due to Language Barriers.” Suitland, MD: US Census Bureau. https://www.census.gov/cac/race_ethnic_advisory_committees/docs/2005_April_acs-noninterview-rates.pdf.
Hoefer, Michael, Nancy Rytins, and Bryan C. Baker. 2011. “Estimates of the Unauthorized Immigrant Population Residing in the United States: January 2010.” Washington, DC: US Department of Homeland Security Office of Immigration Statistics. http://www.dhs.gov/xlibrary/assets/statistics/publications/ois_ill_pe_2010.pdf.
Kallick, David D., James Parrott, and Frank Mauro. 2012. Immigrant Small Business Owners. New York: Fiscal Policy Institute. http://www.fiscalpolicy.org/immigrant-small-business-owners-FPI-20120614.pdf.
Laglagaron, Laureen, and Jessica Sperling. 2009.“Is This Working? Assessment and Evaluation Methods Used to Build and Assess Language Access Services in Social Service Agencies.” Washington, DC: Migration Policy Institute. http://www.migrationpolicy.org/research/working-assessment-and-evaluation-methods-used-build-and-access-language-services-social.
Lee, S.M. 2011.“Language Access Services: Summaries, Findings, Comparisons, and Recommendations.” Washington, DC: Mayor’s Office on Asian and Pacific Islander Affairs.
Minnesota Population Center. 2011. National Historical Geographic Information System: Version 2.0. Minneapolis: University of Minnesota.

TEN YEARS OF LANGUAGE ACCESS IN WASHINGTON, DC 37
Montgomery County. n.d. LEP Resources. Retrieved from http://www.montgomerycountymd.gov/lep/documents.html.
New York City Mayor’s Office of Immigrant Affairs (MOIA). 2013. A Blueprint for Immigrant Integration: Language Access. New York: MOIA. http://www.nyc.gov/html/imm/downloads/pdf/Blueprints/BII-Language-Access.pdf.
Pan, Yuling, and Stephen Lubkemann. 2012. “Observing Census Enumeration of Non-English Speaking Households in the 2010 Census: Evaluation Report.” Suitland, MD: US Census Bureau. https://www.census.gov/2010census/pdf/2010_Census_Enumeration_Non-English_Speaking_Households.pdf.
Passel, Jeffrey S., D’Vera Cohn, and Ana Gonzalez-Barrera. 2013. “Population Decline of Unauthorized Immigrants Stalls, May Have Reversed.” Washington, DC: Pew Research Center. http://www.pewhispanic.org/files/2013/09/Unauthorized-Sept-2013-FINAL.pdf.
Ruggles, S., J. T. Alexander, K. Genadek, R. Goeken R., M. B. Schroeder, and M. Sobek. 2010. Integrated Public Use Microdata Series: Version 5.0 [machine-readable database]. Minneapolis: University of Minnesota.
Siegel, Paul, Elizabeth Martin, Rosalind and Bruno. 2001. “Language Use and Linguistic Isolation: Historical Data and Methodological Issues.” Suitland, MD: US Census Bureau. http://www.census.gov/hhes/socdemo/language/data/census/li-final.pdf.
Singer, Audrey. 2012. “Metropolitan Washington: A New Immigrant Gateway.” In Hispanic Migration and Urban Development: Studies from Washington, DC, edited by Enrique S. Pumar. Bingley, UK: Emerald Publishing . Retrieved from http://www.brookings.edu/research/articles/2013/04/washington-dc-immigration-singer.
Singer, Audrey, and Jill H. Wilson. 2004. “Polyglot Washington: Language Needs and Abilities in the Nation’s Capital.” Washington, DC: The Brookings Institution.
———. 2006. “From ‘There’ to ‘Here’: Refugee Resettlement in Metropolitan America.” Washington, DC: The Brookings Institution. http://www.brookings.edu/~/media/research/files/reports/2006/9/demographics%20singer/20060925_singer.pdf
US Census Bureau. 2009. “Design and Methodology: American Community Survey.” Suitland, MD: US Census Bureau. https://www.census.gov/acs/www/Downloads/survey_methodology/acs_design_methodology.pdf.
US Department of Justice (DOJ), Civil Rights Division, Federal Coordination and Compliance Section. 2011. “Common Language Access Questions, Technical Assistance, and Guidance for Federally Conducted and Federally Assisted Programs.” Washington, DC: US DOJ. http://www.lep.gov/resources/081511_Language_Access_CAQ_TA_Guidance.pdf.
Whitworth, Erin. 2001. “How Selected Language Groups Coped with Census 2000.” In Proceedings of the Annual Meeting of the American Statistical Association, August 5-9, 2001. Retrieved from http://www.amstat.org/sections/srms/Proceedings/y2001/Proceed/00289.pdf.

38 URBAN INSTITUTE
Notes
1 We define the greater DC area as the District plus the counties directly surrounding the city: Montgomery and Prince George’s counties in Maryland; and Arlington County, Fairfax County (including Fairfax and Falls Church cities), and Alexandria City in Virginia.
2 Other jurisdictions include Oakland and San Francisco, CA; New York, NY; and some counties, including Montgomery County, MD.
3 Washington State passed its language access legislation in 2006.
4 Language Access Act of 2004.
5 This benchmark was designed to be low because of the relatively small size of the population and the high linguistic diversity of the LEP population in Washington, DC. In larger cities, the parallel threshold triggering language access requirements is much higher. In San Francisco, the benchmark is 10,000 people or 5 percent, and Oakland’s is 10,000 people (see City of Oakland, “Agenda Report,” September 24, 2013, http://www2.oaklandnet.com/oakca1/groups/hrm/documents/report/oak045044.pdf).
6 This group included the Office on Latino Affairs (OLA) and the Office on Asian and Pacific Islander Affairs (OAPIA). It later included the Office on African Affairs (OAA), which was established several years after the Act’s passage.
7 See appendix B for the tiered list of agencies, available in the 2007 Language Access Fact Sheet (DC OHR 2007a).
8 According to 2008 regulations, Section 1205.1 states that “covered entities are any District government agency, department, or program that furnishes information or renders services, programs, or activities directly to the public or contracts with other entities, either directly or indirectly, to conduct programs, services or activities to the public.” Section 1205 lists the requirements, which echo the language in the original Act regarding the four-point test, and the 500 person or 3 percent benchmark for triggering translation of vital documents.
9 Detailed requirements are listed in Section 1206.
10 OHR staffing for administration of the Language Access Act has varied over the decade, fluctuating between one and two full-time staff members and paid interns.
11 Those who speak “Chinese” might speak Mandarin, Cantonese, or another Chinese language. The ACS provides numbers of Mandarin and Cantonese speakers, for those who self-report those languages, but it appears most people speaking a Chinese language do not specify which language, so these numbers are unreliable. Those who speak “Amharic/Ethiopian” might speak Amharic, Tigrinya, or other languages common in Ethiopia.
12 Many of the French-speaking LEP/NEP individuals in the District are from French-speaking African countries.
13 Kru, Ibo (also spelled Igbo), and Yoruba are all West African languages. Kru is spoken primarily in the Ivory Coast, Burkina Faso, and Liberia. Ibo is spoken primarily in Nigeria, while Yoruba is spoken primarily in Nigeria, Benin, and Togo.
14 Of the US-born LEP/NEP population in the District, 64 percent speak Spanish and 31 percent are children (age 5-17). It is possible that some individuals in this category were born in the United States but grew up outside the United States speaking a language other than English. It is also possible that these individuals apply a higher standard of what counts as speaking English “very well” than foreign-born individuals. Otherwise, we cannot be sure what lies behind the existence of these substantial numbers of US-born LEP/NEP individuals.
15 The number of French-speaking LEP/NEP individuals in the greater DC area is statistically significantly greater than the number of Tagalog/Filipino-speaking LEP/NEP individuals in greater DC.
16 We provide these numbers for the greater DC area, because the counts are too small to calculate them for The District proper.
17 The category “noncitizens” includes foreign-born individuals in several immigration statuses: legal permanent residents with green cards; temporary legal immigrants, such as students or those on temporary work visas; refugees and asylees; and undocumented immigrants. The category “citizens” includes US-born citizens as well as foreign-born individuals who have gone through the naturalization process to obtain citizenship.
18 The American University report suggests that language line use and sign-in sheets is not a comprehensive enough measure of client needs (page 2); it also notes gaps in monitoring.

TEN YEARS OF LANGUAGE ACCESS IN WASHINGTON, DC 39
19 Tigrinya is spoken by members of the Tigray-Tigrinya ethnic group in parts of Ethiopia and Eritrea.
20 In particular, the mechanism by which individuals submit reports of violations they experienced at an agency.
21 The Language Access Program has a formal waiver process and form that were designed to accommodate this practice. The form is supposed to be used by frontline employees when clients opt out of language access services because they have brought their own informal interpreters with them.
22 See also Robin Ghertner, “Practitioner’s Corner: How to Assess the Effectiveness of Language Access Programs,” Migration Policy Institute, accessed March 31, 2014, http://www.migrationpolicy.org/programs/language-access-translation-and-interpretation-policies-and-practices/practitioners-corn-1.
23 The DOJ guidelines also emphasize the importance of contact with CBOs to help identify populations that require outreach.
24 Wage bonuses are provided to certified bilingual employees in neighboring Montgomery County, MD. See Lily Qi, “Practitioner’s Corner: Doing More with Less on Language Access,” Migration Policy Institute, accessed March 31, 2014, http://www.migrationpolicy.org/programs/language-access-translation-and-interpretation-policies-and-practices/practitioners-corner-more.
25 A recent initiative led by the Office of African Affairs to create job circles and culminating in a bilingual job fair to connect the African community to municipal positions is a good model.
26 Best practices suggest that it is important to develop support from middle and senior management, see Laglagaron and Sperling (2009, 14).
27 Qi, “Doing More with Less on Language Access,” http://www.migrationpolicy.org/programs/language-access-translation-and-interpretation-policies-and-practices/practitioners-corner-more.
28 See “Practitioner’s Corner: Top 10 Best Practices for Multilingual Websites” adapted from Lee Van’s Hispanic Online Best Practice, Migration Policy Institute, accessed March 31, 2014, http://www.migrationpolicy.org/programs/language-access-translation-and-interpretation-policies-and-practices/practitioners-corn-0.
29 See “Census Bureau Releases Estimates of Undercount and Overcount in the 2010 Census,” US Census Bureau, press release, May 12, 2012, https://www.census.gov/newsroom/releases/archives/2010_census/cb12-95.html.