templates for speech-evoked auditory brainstem...
TRANSCRIPT
Templates for speech-evoked auditory brainstem responseperformance in cochlear implanteesMona I. Mourada, Mohamed Eidb, Hicham G. Elmonguic, Mohamed M. Talaata,Mirhan K. Eldeeba
aUnit of Audiovestibular Medicine, Faculty of
Medicine, Department of Otorhinolaryngology,bDepartment of Diagnostic Imaging, Faculty of
Medicine, cDepartment of Computer and
Systems Engineering, Faculty of Engineering,
Alexandria University, Alexandria, Egypt
Correspondence to Mirhan K. Eldeeb, MSc,
Unit of Audiovestibular Medicine, Faculty of
Medicine, Department of Otorhinolaryngology,
Faculty of Medicine, Al Sultan Hussein Street,
Al Khartoom Square, Al Azareeta, Alexandria,
21111, Egypt; Tel: +20 348 47426;
fax: 002-03-4873-076;
e-mail: [email protected]
This study was presented at the 52nd Inner
Ear Biology 2015 symposium and workshop as
a poster presentation, Transduction of a
complex signal through the normal cochlea
and through the cochlear implant’ Abstract
book page 22 poster number 53; 12–15
September 2015; Rome, Italy, and the Cairo
Cochlear International Congress as oral
presentation Transduction of the speech
syllable /da/through cochlear implant’;
5–7 February 2016; Cairo, Egypt.
Received 13 September 2016
Accepted 30 November 2016
Advanced Arab Academy of Audio-Vestibulogy Journal 2016, 3:25–34
IntroductionSpeech-evoked auditory brainstem response (ABR) has been used to assess thefidelity of encoding speech stimuli at the subcortical level in normal individuals innoise and in special populations such as learning-impaired children and musicians.The neural code generated by cochlear implants (CIs) in the auditory brainstempathway and its similarity to stimulus may account for variable speech developmentin cochlear implantees.ObjectiveThe aim of this study was to describe speech ABR recorded in CI individuals andestablish measurement parameters for the neural response and its reproducibility.Participants and methodsChildren between 5 and 10 years of age implanted in the right ear with fully inserted12-electrode CIs were selected. All participants had normal morphology of thecochlea and auditory nerve in preoperative computed tomographic scan and MRI.Speech syllable 40ms /da/ was used to elicit speech ABR. Response traces forintensity input/output functions were harvested. Grand averages were constructedfor peak picking. Individual patient responses were analyzed for reproducibility,latency of wave V, root mean square amplitude of the response, and correlation tothe stimulus.ResultsGrand averages showed wave V, followed by the frequency following response.Wave V is a vertex-positive peak, equivalent to that elicited by a click, which reflectsthe stimulation by the transient /d/. The mean latency of wave V was 2.59±0.7ms at70 dBHL. The frequency following response showed multiple sequenced troughscorresponding to the sustained vowel /a/. Individual responses collected for similarstimulus parameters showed high reproducibility, being 99.65% at 60 dBHL and52.8% at 30 dBHL. Participants showed variable latency and root mean squareamplitude-intensity input–output functions slopes. The mean stimulus-to-responsecorrelation was 18.1±3.1%.ConclusionSpeech ABR in CI participants shows similar morphology to that recorded in norms.CIs thus transcribe the speech signal with high fidelity to the brainstem pathways.
Keywords:auditory brainstem response, cochlear implant, speech auditory brainstem response
Adv Arab Acad Audio-Vestibul J 3:25–34
© 2017 Advanced Arab Academy of Audiovestibulogy
2314-8667
IntroductionSound transduction in the cochlea follows propagationof the mechanical traveling wave along the basilarmembrane, stimulating the outer and inner haircells, and evoking the eighth nerve action potential.In profound hearing loss, this function is substantiallydisturbed with subsequent failure to provoke anauditory nerve action potential.
Cochlear implant (CI) transduces acoustic intoelectrical signals bypassing the damaged cochlea andprovoking auditory nerve action potentials. Thetransduction process involves acoustic signalprocessing to extract prominent features of the targetspeech and feeds it to the auditory nerve through
electrical biphasic pulses tonotopically mapped in thecochlear scala using place coding strategies. Inaddition, temporal coding, conveyed through pulserate, enhances low-frequency perception [1].
Auditorybrainstemresponse(ABR)isaseriesofpotentialsthat have robust timing and reproducibility for transientand sustained acoustic signals. It is measured for speechstimuli [2–22]. Transient stimuli whether a click [23] or astop consonant [20] will yield a series of voltages I–V.
This is an open access article distributed under the terms of the Creative
Commons Attribution-NonCommercial-ShareAlike 3.0 License, which
allows others to remix, tweak, and build upon the work
noncommercially, as long as the author is credited and the new
creations are licensed under the identical terms.
Original article 25
© 2017 Advanced Arab Academy of Audio-Vestibulogy Journal | Published by Wolters Kluwer - Medknow DOI: 10.4103/2314-8667.202551
Sustainedstimuli suchasphrases [24],monosyllabicwords[25], and vowels [26–28] will yield a series of potentialscomposing the frequency following response (FFR). TheFFR vertex-negative peaks in response to the speechsyllable /da/ of 40ms duration are named B, C, D, E,F, and O [20]. Transduction of acoustic speech with CIintoneural codes in thebrainstemmaythereforebe studiedby speech-evoked ABR.
The aim of the present study was to describe speechABR morphology in CI individuals and establishparameters for neural response reproducibility.
In this investigation it was hypothesized that the CIprocessor-electrode coupling transduces the speechsyllable reflecting its temporal and spectral components.In this respect, it mimics speech ABR reported in normalindividuals.
Participants and methodsParticipantsTen prelingually deafened children using CIs wereselected. Particpants’ ages ranged from 5 to 10 years(four male and six female). The study was approved bythe local ethics committee, and an informed consentwas obtained from each participant’s parent beforeinclusion. Criteria for selection were as follows:
(1) Preoperative computed tomography (CT) andMRI of the petrous bone, indicating normalanatomy of the cochlea and eighth nerve.
(2) Postoperative CT of the petrous bone showing fullinsertion of the 12-electrode (Med-EL, Innsbruck,Austria) standard array.
(3) Implantation in the right ear.(4) Participants with all electrodes enabled.(5) For all participants the same coding strategy was
used, fine structure four (FS4) coding strategy.
Informed consent was obtained from every participant’sparent. Each CI participant was subjected to thefollowing protocol of evaluation.
Behavioral assessmentAll children were examined using warble tones indecibel hearing level (dBHL) at 250, 500, 1000,2000, and 4000Hz to obtain aided free-fieldthresholds using their final map adjustments.
Speech auditory brainstem response recordingSpeech stimulus
Speech-like /da/ syllable 40ms duration, providedby Kraus brainstem toolbox, was presented at a
repetition rate of 2.1/s and alternating polarity. The/da/ complex utilizes a five-formant synthetic speechsyllable /da/, produced using a Klatt cascade/parallelformant synthesizer. A detailed description of thestimulus is provided in the study by Banai et al. [29].
Stimulus calibration
Calibration of the stimulus /da/ was measured for eachparticipant at the level of the ear with CI. Stimulusintensity was measured in decibel sound pressure level(dBSPL) using a Radio Shack sound level meter. It wascorrected to dBHL by subtracting 20 dB from thesound level meter dial.
Recording parameters
Responses were differentially recorded using anelectrode montage forehead-to-contralateral (left)mastoid, chin being the ground. This contralateralelectrode montage was chosen to minimize stimulusartifact by increasing the distance between the device,speaker, and the reference electrode. Disposableelectrodes with conductive paste were used.Electrode sites were cleaned with alcohol and rubbedwith rough gauze to lower skin resistance. To ensurebalanced inputs to the differential amplifier andoptimize signal-to-noise ratio, electrode impedancedid not exceed 3000 Ω and differences betweenelectrode pairs were kept below 2000Ω.
Responses were averaged for 1000 stimuli. A 60-msrecording window (including a 10ms prestimulusperiod) was used. Responses were online filteredthrough a 30–500Hz band-pass filter. An averagedno stimulus run, with the processor turned on, was usedas a control trace. Moreover, an averaged response withthe processor-off was used as a control trace.
On the basis of a pilot study on CI participants, whenthe parameters used in normal-hearing children in theliterature (a stimulus rate of 4.1/s and a band-pass filterof 30–3000Hz [8]) were applied to CI participants, thetraces had poor definition of response peaks andtroughs. Changing stimulus rate to 2.1/s andchanging band-pass filter to 30–500Hz yieldedclearer recordings with less noise contamination andvisually rated reproducibility. Wave V could be traceddown to 30 dBHL in most cases.
Test procedure
Responses were recorded using Bio-logic navigator Proversion 7.0.0 (Natus Medical Incorporated, San Carlos,California, United States). Measures were obtained in aquiet room and all participants were tested either in acomfortable state while watching silent cartoon or while
26 Advanced Arab Academy of Audio-Vestibulogy Journal, Vol. 3 No. 2, July-December 2016
sleeping. The stimulus /da/ was delivered through aspeaker located 30 cm from the participant’s head at90° azimuth. Response input–output intensityfunction was recorded starting at 70 dBHL and thenat successively lower intensities by 10 dB decrementsdown to the level where no visual response could beattained. Two traces were recorded at each stimulusintensity to ensure that the response is repeatable. Thetwo traces were used to assess waveform reproducibilityand then the two traces were added to create an average.
Data analysis of the response
Traces were analyzed using both theMATLABDigitalSignal Processing toolbox and the Kraus brainstemtoolbox in MathWorks’ MATLAB software (TheMathWorks, Inc., Natick, Massachusetts, UnitedStates).
Traces were exported to ASCII format using theAEP2ASCII software provided by the Natuscorporation version 7.0.0 of Bio-logic navigator Pro.Digital signals were extracted from the ASCII files;they had a frequency of four kHz. The stimulus /da/was retrieved as a WAV file, which had a frequency of48 kHz.
For the analysis, both the stimulus and responses (traces)were converted into 8 kHz digital signals. The stimulussampling rate was reduced by using a sampling ratecompressor that implements the function: xd[n]=x[6n], where xd[n] is the compressed stimulus and x[n]is the WAV file stimulus. On the other hand, theresponses were upsampled by a factor of 2, and thenfiltered using a low pass filter to compensate for missingvalues. The following formula was used to implementthis upsampling, where yi[n] is the upsampled responseand y[n] is the extracted trace:
yi n½ � ¼ ∑∞
�∞y½n�sin π n� 2kð Þ=2ð Þ
π n� 2kð Þ=2 :
All upsampled responses and compressed stimuluswere converted to an AVG format that the Krausbrainstem toolbox uses.
To analyze the responses and their correlation with thestimulus, normalized cross correlation was used. Innormalized cross correlation, maximum correlationwas searched across different lag times. The FFR wascorrelated to the vowel part of the stimulus, whichbracketed the temporal window (11–40ms) at 60 and70 dBHL. The FFR included the segment 3ms afterwave V trough to the end of the trace. The normalizedcross correlation allowed clearer illustrations of the crosscorrelation even when signals had diverse levels of
energy. The normalized cross correlation of twosignals is the cross correlation of the normalizedsignals. Let ~y n½ �, y n½ �, and σy n½ � denote thenormalized signal, the average value, and the SD ofy[n], respectively. Therefore,
~y n½ � ¼ y n½ � � y n½ �σy n½ �
:
The root mean square (RMS) amplitude was obtainedfor the whole response waveform. RMS amplitude wasalso measured for wave V peak to its following trough.RMS amplitude measurement for the FFR includedthe segment 3ms after wave V trough to the end of thetrace. The RMS amplitude ratio of wave V to FFR wascalculated at all stimulus intensities.
For each patient, the intertrace normalized correlationwas performed for the following:
(1) Speech ABR traces of similar intensities.(2) Between speech ABR trace at 60 dBHL and a
control trace recorded and averaged, where nostimulus was presented, but the processor wasturned on.
(3) Between speech ABR trace at 60 dBHL and acontrol trace recorded and averaged when theprocessor was turned off.
The prestimulus baseline RMS amplitude was sub-tracted from the response to remove any noise duringrecording.
Labeling of wave V at threshold followed visualinspection of the peak in the input–output function.Wave V was marked as the first positive peak 6ms orearlier, followed by a sharp trough at high stimulusintensities. To estimate wave V threshold, a bracket-ing procedure of ‘down-ten/up-ten dBHL’ was applied.Threshold corresponded to the level at which responseswere obtained for two ascending runs. Wave V wasidentified as the positive peak near 6ms immediatelybefore the negative slope, and A was selected as thebottom of the downward slope following wave V [8,29].A reliable peak was judged as having a peak-to-peakamplitude larger than the prestimulus baseline activity.Ambiguous peaks were visually assessed by three raters.Wave V and the FFR were expected to be earliercompared with speech ABR in normal individualsdespite possible maturational delays. This can beattributed to loss of cochlear travel time estimated tobe 6ms present in normal individuals [30,31]. A delay of0.8ms due to the speaker distance from the ear was alsoexpected and was corrected after peak marking.
Templates for speech ABR performance in CI Mourad et al. 27
Designation of the FFR thresholds followed thenormalized correlation procedure. Two parameterswere measured. First, the percentage correlationbetween the two traces when wave V is absent. Thiscorrelation was based on morphology and RMSsimilarity. The second parameter is the lag timebetween the traces in ms. The FFR threshold wasmarked as the minimum intensity at which a maximalcorrelation was obtained at ∼0ms lag time. The peak ofmaximum correlation had to be a single peak more than50% to judge the trace as the FFR threshold.
A grand average was constructed for traces of similarintensities across patients to create a template for peakmarking. Initially, the average latency of wave V ofindividual traces at a given intensity was calculated togive wave V latency of a grand average. Individualtraces were aligned at the average latency of wave V fora given intensity.
ResultsMap levels and aided free-field thresholdsTable 1 shows the mean and SDs of threshold (T) andmost comfortable (C) electrical stimulation levels incharge units (qu) in final maps and aided free-fieldthresholds.
Speech auditory brainstem response morphologySpeech auditory brainstem response grand average
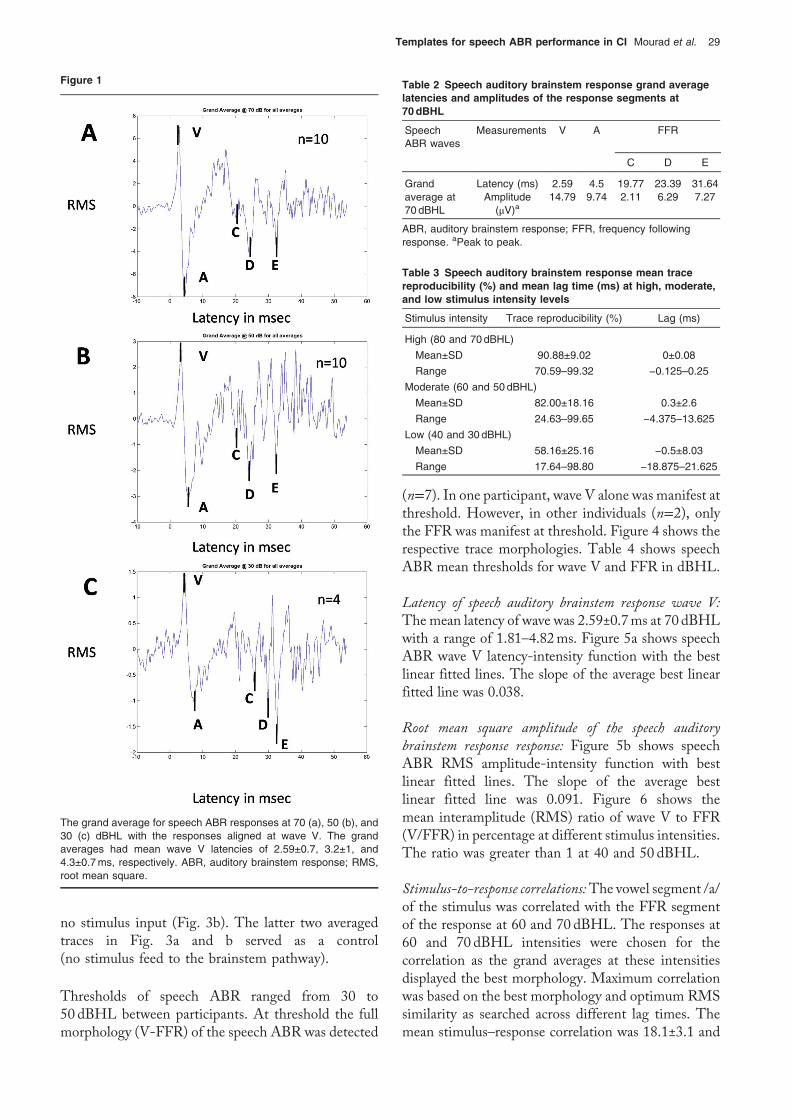
The response consisted of an early segment (waveVpeakfollowedbywaveA trough) and a later segment (series ofvertex-negative peaks, which represent the FFR). Themost prominent FFR troughs in the grand averages,particularly that at 70 dBHL, were waves C, D, and E.Waves B, F, and O of FFR in normal individuals werenot detected. Figure 1 shows labeled grand averages forspeech ABR at 70, 50, and 30 dBHL. Table 2 showsspeech ABR grand average latencies and amplitudes ofthe response segments at 70 dBHL.
Speech auditory brainstem response individual traces
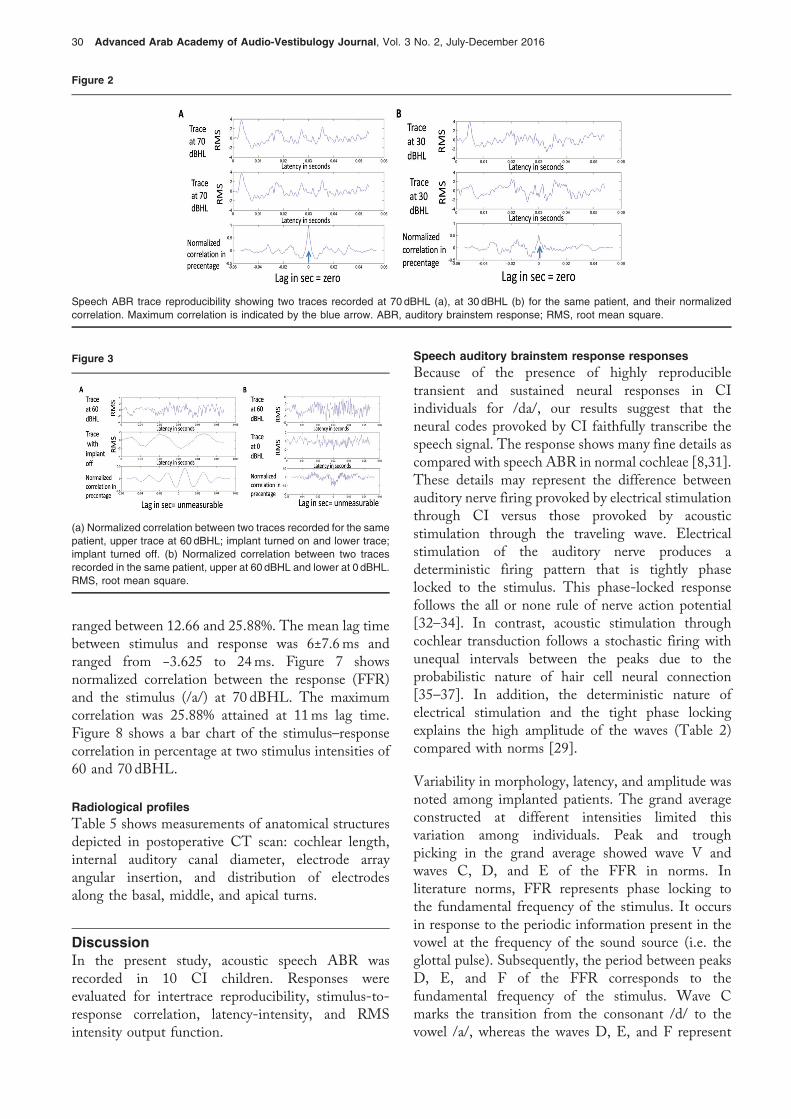
Waveform reproducibility: The response morphology tothe /da/ stimulus was maintained for the input–outputintensity function (70–30 dBHL). Speech ABR tracereproducibility was maximal at high and moderateintensities (reaching 99.65% at 60 dBHL). Table 3shows speech ABR mean trace reproducibility exp-ressed in percentage and mean lag time in ms at high,moderate, and low stimulus intensity levels. Figure 2shows normalized correlation between two traces of thesame intensity. Figure 3 shows normalized correlationbetween a true trace and an averaged raw waveformwhen the processor turned off (Fig. 3a), and there was T
able
1Themea
nan
dSD
ofTan
dC
elec
trical
stim
ulationleve
lsin
quforfinal
map
san
daided
free
-field
thresh
olds
Electrode
s1
23
45
67
89
1011
12
Des
iredfreq
uenc
yba
nd(H
z)10
0–19
819
8–32
532
6–49
249
3–71
270
7–99
599
2–13
7313
78–18
8618
88–25
6726
00–35
2834
66–47
0347
99–65
1262
39–84
66
Tleve
ls
Mea
n±SD
3.9±
24.2±
2.1
4.2±
2.2
4.2±
2.1
5.1±
2.9
5.3±
2.9
4.8±
2.6
5.2±
2.8
5.7±
3.3
5.6±
3.3
5.1±
2.7
5.1±
2.7
Cleve
ls
Mea
n±SD
28.41±
6.86
28.57±
7.17
28.83±
7.30
29.28±
7.41
30.87±
8.06
32.39±
8.03
31.88±
7.2
32.38±
7.71
34.17±
7.86
34.25±
7.38
33.68±
6.82
33.36±
6.79
Frequ
ency
ofwarbletone
s(H
z)a
250
500
1000
2000
4000
Aided
free
-field
thresh
olds
(dBHL)
Mea
n±SD
30.5±5
32.5±5.4
32±5.4
34±5.2
37.5±4.9
aThe
warbletone
freq
uenc
yis
disp
laye
din
thetableas
anap
prox
imationto
CIelec
trod
ede
siredfreq
uenc
yba
nds.
28 Advanced Arab Academy of Audio-Vestibulogy Journal, Vol. 3 No. 2, July-December 2016
no stimulus input (Fig. 3b). The latter two averagedtraces in Fig. 3a and b served as a control(no stimulus feed to the brainstem pathway).
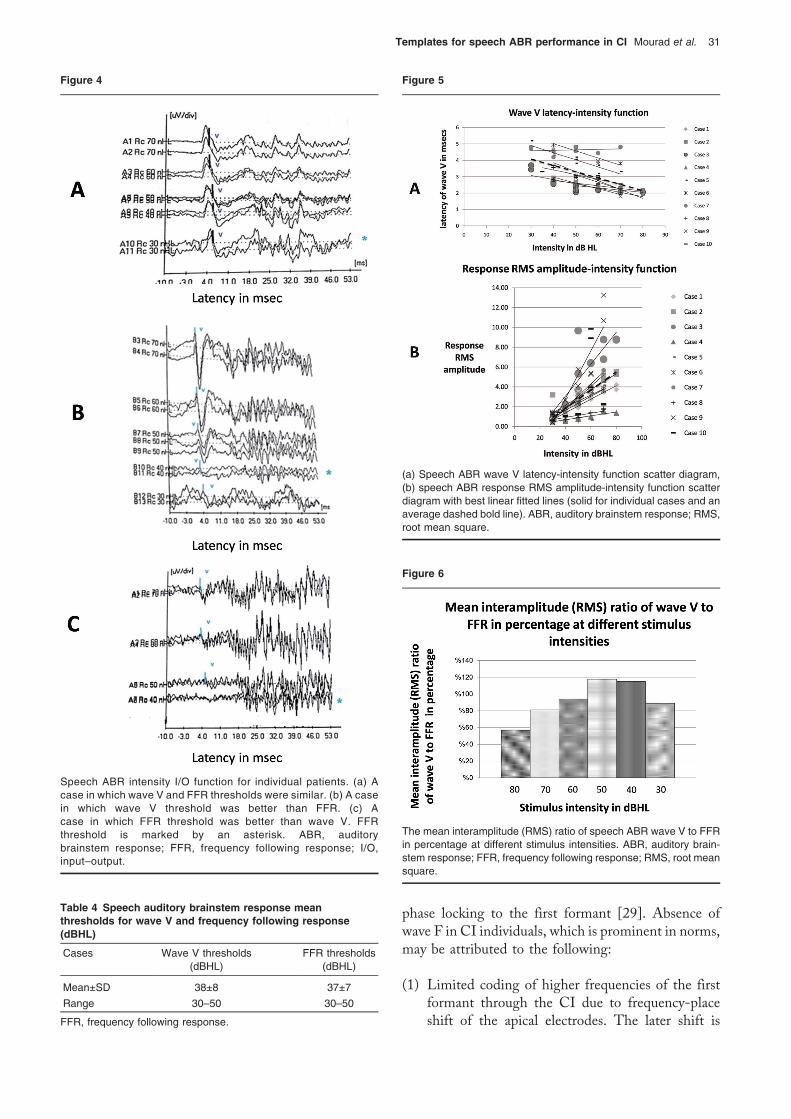
Thresholds of speech ABR ranged from 30 to50 dBHL between participants. At threshold the fullmorphology (V-FFR) of the speech ABR was detected
(n=7). In one participant, wave V alone was manifest atthreshold. However, in other individuals (n=2), onlythe FFR was manifest at threshold. Figure 4 shows therespective trace morphologies. Table 4 shows speechABR mean thresholds for wave V and FFR in dBHL.
Latency of speech auditory brainstem response wave V:Themean latency of wave was 2.59±0.7ms at 70 dBHLwith a range of 1.81–4.82ms. Figure 5a shows speechABR wave V latency-intensity function with the bestlinear fitted lines. The slope of the average best linearfitted line was 0.038.
Root mean square amplitude of the speech auditorybrainstem response response: Figure 5b shows speechABR RMS amplitude-intensity function with bestlinear fitted lines. The slope of the average bestlinear fitted line was 0.091. Figure 6 shows themean interamplitude (RMS) ratio of wave V to FFR(V/FFR) in percentage at different stimulus intensities.The ratio was greater than 1 at 40 and 50 dBHL.
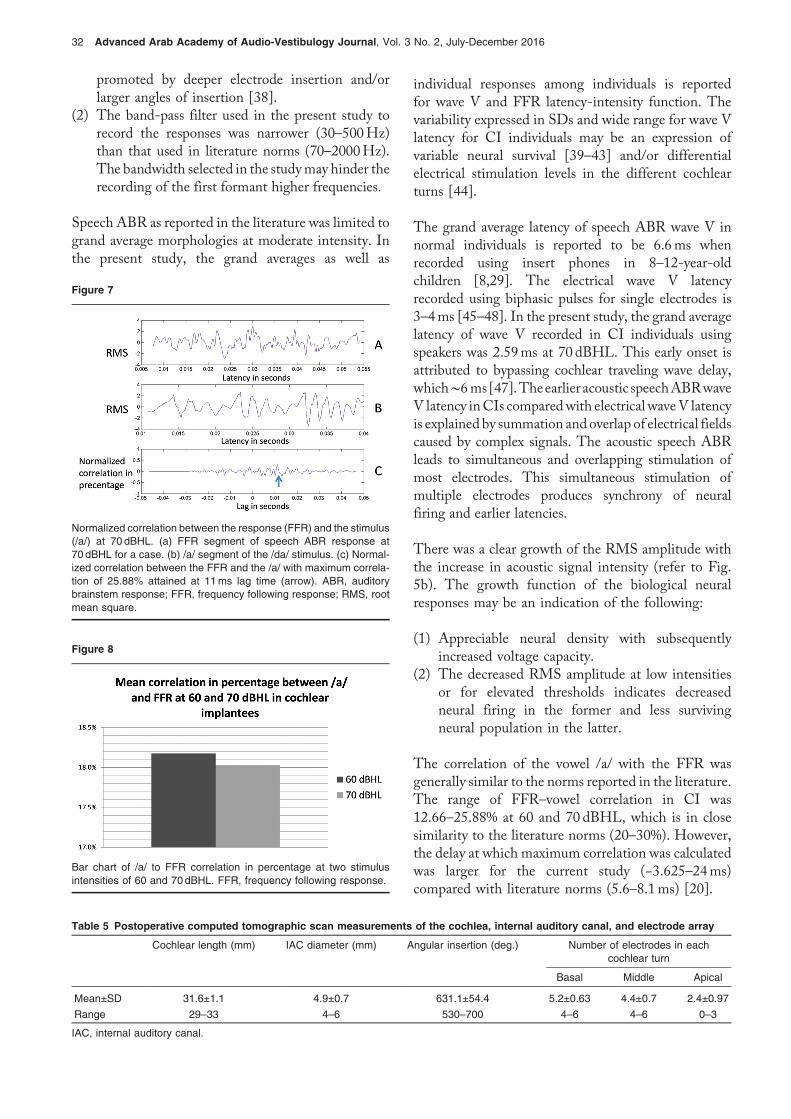
Stimulus-to-response correlations:The vowel segment /a/of the stimulus was correlated with the FFR segmentof the response at 60 and 70 dBHL. The responses at60 and 70 dBHL intensities were chosen for thecorrelation as the grand averages at these intensitiesdisplayed the best morphology. Maximum correlationwas based on the best morphology and optimum RMSsimilarity as searched across different lag times. Themean stimulus–response correlation was 18.1±3.1 and
Figure 1
The grand average for speech ABR responses at 70 (a), 50 (b), and30 (c) dBHL with the responses aligned at wave V. The grandaverages had mean wave V latencies of 2.59±0.7, 3.2±1, and4.3±0.7ms, respectively. ABR, auditory brainstem response; RMS,root mean square.
Table 2 Speech auditory brainstem response grand averagelatencies and amplitudes of the response segments at70dBHL
SpeechABR waves
Measurements V A FFR
C D E
Grandaverage at70 dBHL
Latency (ms) 2.59 4.5 19.77 23.39 31.64Amplitude
(μV)a14.79 9.74 2.11 6.29 7.27
ABR, auditory brainstem response; FFR, frequency followingresponse. aPeak to peak.
Table 3 Speech auditory brainstem response mean tracereproducibility (%) and mean lag time (ms) at high, moderate,and low stimulus intensity levels
Stimulus intensity Trace reproducibility (%) Lag (ms)
High (80 and 70dBHL)
Mean±SD 90.88±9.02 0±0.08
Range 70.59–99.32 −0.125–0.25
Moderate (60 and 50 dBHL)
Mean±SD 82.00±18.16 0.3±2.6
Range 24.63–99.65 −4.375–13.625
Low (40 and 30 dBHL)
Mean±SD 58.16±25.16 −0.5±8.03
Range 17.64–98.80 −18.875–21.625
Templates for speech ABR performance in CI Mourad et al. 29
ranged between 12.66 and 25.88%. The mean lag timebetween stimulus and response was 6±7.6ms andranged from −3.625 to 24ms. Figure 7 showsnormalized correlation between the response (FFR)and the stimulus (/a/) at 70 dBHL. The maximumcorrelation was 25.88% attained at 11ms lag time.Figure 8 shows a bar chart of the stimulus–responsecorrelation in percentage at two stimulus intensities of60 and 70 dBHL.
Radiological profilesTable 5 shows measurements of anatomical structuresdepicted in postoperative CT scan: cochlear length,internal auditory canal diameter, electrode arrayangular insertion, and distribution of electrodesalong the basal, middle, and apical turns.
DiscussionIn the present study, acoustic speech ABR wasrecorded in 10 CI children. Responses wereevaluated for intertrace reproducibility, stimulus-to-response correlation, latency-intensity, and RMSintensity output function.
Speech auditory brainstem response responsesBecause of the presence of highly reproducibletransient and sustained neural responses in CIindividuals for /da/, our results suggest that theneural codes provoked by CI faithfully transcribe thespeech signal. The response shows many fine details ascompared with speech ABR in normal cochleae [8,31].These details may represent the difference betweenauditory nerve firing provoked by electrical stimulationthrough CI versus those provoked by acousticstimulation through the traveling wave. Electricalstimulation of the auditory nerve produces adeterministic firing pattern that is tightly phaselocked to the stimulus. This phase-locked responsefollows the all or none rule of nerve action potential[32–34]. In contrast, acoustic stimulation throughcochlear transduction follows a stochastic firing withunequal intervals between the peaks due to theprobabilistic nature of hair cell neural connection[35–37]. In addition, the deterministic nature ofelectrical stimulation and the tight phase lockingexplains the high amplitude of the waves (Table 2)compared with norms [29].
Variability in morphology, latency, and amplitude wasnoted among implanted patients. The grand averageconstructed at different intensities limited thisvariation among individuals. Peak and troughpicking in the grand average showed wave V andwaves C, D, and E of the FFR in norms. Inliterature norms, FFR represents phase locking tothe fundamental frequency of the stimulus. It occursin response to the periodic information present in thevowel at the frequency of the sound source (i.e. theglottal pulse). Subsequently, the period between peaksD, E, and F of the FFR corresponds to thefundamental frequency of the stimulus. Wave Cmarks the transition from the consonant /d/ to thevowel /a/, whereas the waves D, E, and F represent
Figure 2
Speech ABR trace reproducibility showing two traces recorded at 70 dBHL (a), at 30 dBHL (b) for the same patient, and their normalizedcorrelation. Maximum correlation is indicated by the blue arrow. ABR, auditory brainstem response; RMS, root mean square.
Figure 3
(a) Normalized correlation between two traces recorded for the samepatient, upper trace at 60 dBHL; implant turned on and lower trace;implant turned off. (b) Normalized correlation between two tracesrecorded in the same patient, upper at 60 dBHL and lower at 0 dBHL.RMS, root mean square.
30 Advanced Arab Academy of Audio-Vestibulogy Journal, Vol. 3 No. 2, July-December 2016
phase locking to the first formant [29]. Absence ofwave F in CI individuals, which is prominent in norms,may be attributed to the following:
(1) Limited coding of higher frequencies of the firstformant through the CI due to frequency-placeshift of the apical electrodes. The later shift is
Table 4 Speech auditory brainstem response meanthresholds for wave V and frequency following response(dBHL)
Cases Wave V thresholds(dBHL)
FFR thresholds(dBHL)
Mean±SD 38±8 37±7
Range 30–50 30–50
FFR, frequency following response.
Figure 5
(a) Speech ABR wave V latency-intensity function scatter diagram,(b) speech ABR response RMS amplitude-intensity function scatterdiagram with best linear fitted lines (solid for individual cases and anaverage dashed bold line). ABR, auditory brainstem response; RMS,root mean square.
Figure 6
The mean interamplitude (RMS) ratio of speech ABR wave V to FFRin percentage at different stimulus intensities. ABR, auditory brain-stem response; FFR, frequency following response; RMS, root meansquare.
Figure 4
Speech ABR intensity I/O function for individual patients. (a) Acase in which wave V and FFR thresholds were similar. (b) A casein which wave V threshold was better than FFR. (c) Acase in which FFR threshold was better than wave V. FFRthreshold is marked by an asterisk. ABR, auditorybrainstem response; FFR, frequency following response; I/O,input–output.
Templates for speech ABR performance in CI Mourad et al. 31
promoted by deeper electrode insertion and/orlarger angles of insertion [38].
(2) The band-pass filter used in the present study torecord the responses was narrower (30–500Hz)than that used in literature norms (70–2000Hz).The bandwidth selected in the studymay hinder therecording of the first formant higher frequencies.
Speech ABR as reported in the literature was limited togrand average morphologies at moderate intensity. Inthe present study, the grand averages as well as
individual responses among individuals is reportedfor wave V and FFR latency-intensity function. Thevariability expressed in SDs and wide range for wave Vlatency for CI individuals may be an expression ofvariable neural survival [39–43] and/or differentialelectrical stimulation levels in the different cochlearturns [44].
The grand average latency of speech ABR wave V innormal individuals is reported to be 6.6ms whenrecorded using insert phones in 8–12-year-oldchildren [8,29]. The electrical wave V latencyrecorded using biphasic pulses for single electrodes is3–4ms [45–48]. In the present study, the grand averagelatency of wave V recorded in CI individuals usingspeakers was 2.59ms at 70 dBHL. This early onset isattributed to bypassing cochlear traveling wave delay,which∼6ms[47].Theearlier acoustic speechABRwaveV latency inCIs comparedwith electrical waveV latencyis explained by summation andoverlap of electrical fieldscaused by complex signals. The acoustic speech ABRleads to simultaneous and overlapping stimulation ofmost electrodes. This simultaneous stimulation ofmultiple electrodes produces synchrony of neuralfiring and earlier latencies.
There was a clear growth of the RMS amplitude withthe increase in acoustic signal intensity (refer to Fig.5b). The growth function of the biological neuralresponses may be an indication of the following:
(1) Appreciable neural density with subsequentlyincreased voltage capacity.
(2) The decreased RMS amplitude at low intensitiesor for elevated thresholds indicates decreasedneural firing in the former and less survivingneural population in the latter.
The correlation of the vowel /a/ with the FFR wasgenerally similar to the norms reported in the literature.The range of FFR–vowel correlation in CI was12.66–25.88% at 60 and 70 dBHL, which is in closesimilarity to the literature norms (20–30%). However,the delay at which maximum correlation was calculatedwas larger for the current study (−3.625–24ms)compared with literature norms (5.6–8.1ms) [20].
Figure 7
Normalized correlation between the response (FFR) and the stimulus(/a/) at 70 dBHL. (a) FFR segment of speech ABR response at70 dBHL for a case. (b) /a/ segment of the /da/ stimulus. (c) Normal-ized correlation between the FFR and the /a/ with maximum correla-tion of 25.88% attained at 11ms lag time (arrow). ABR, auditorybrainstem response; FFR, frequency following response; RMS, rootmean square.
Figure 8
Bar chart of /a/ to FFR correlation in percentage at two stimulusintensities of 60 and 70dBHL. FFR, frequency following response.
Table 5 Postoperative computed tomographic scan measurements of the cochlea, internal auditory canal, and electrode array
Cochlear length (mm) IAC diameter (mm) Angular insertion (deg.) Number of electrodes in eachcochlear turn
Basal Middle Apical
Mean±SD 31.6±1.1 4.9±0.7 631.1±54.4 5.2±0.63 4.4±0.7 2.4±0.97
Range 29–33 4–6 530–700 4–6 4–6 0–3
IAC, internal auditory canal.
32 Advanced Arab Academy of Audio-Vestibulogy Journal, Vol. 3 No. 2, July-December 2016
Because the morphology of speech ABR response in CIindividuals mimics the speech signal in its transient andsustained portions, brainstem responses to complexstimuli are viewed as biomarkers for encoding aspeech syllable in the subcortical auditory system.Speech ABR in individuals with CI showed bothrapid deflections (waveV) and some of the discretepeaks corresponding to the periodic peaks of thestimulus waveform in a robust manner.
Role of the fine structure four strategy, and speechauditory brainstem response, root mean square amplitude,
and lag time in view of the present research
The FS4 strategy was implemented in current research.In this strategy, the input signal is band-pass filteredand fed into channels to stimulate the electrode arraytonotopically placed in the cochlea. In the low-frequencychannels, the fine structure is encoded by stimulating thefirst four apical electrodes at a rate equal to theinstantaneous frequency of the signals. The amplitudeof biphasic pulses is equal to the instantaneous envelopeofthe signal. For this temporal weighted strategy, phase-locking stimulation is emphasized simulating the normalcochlea and increasing the low-frequency informationconveyed to the apical portions of the cochlea to970Hz [49]. This explains the approximation of thespeech ABR FFR morphology and reproducibility inCI individuals to that in normal individuals. Mulleret al. [50] reported that FS4 strategy improves vowelidentification and speech understanding inCI individualsdue to phase-locking mechanisms. The high-frequencychannels in the basal electrodes process signals accordingto the continuous interleaving strategy principle in whichthe envelope of the signal is amplitude modulated at aconstant rate [51]. This principle is applied to theremaining eight electrodes and simulates the placetheory for frequency coding in the normal cochlea.
RMS similarity and lag time were used to evaluatetrace reproducibility in addition to stimulus–responsecorrelation. As the use of these parameters reflectedresponse consistency, they may provide prognosticmeasure of speech neural encoding in CI. Assessmentof intertrace correlation based on RMS and lag timedetermines the power of the phase-locking abilities ofthe auditory nerve and the brainstem. This may alsoprovide useful information about the effectiveness of aparticular coding strategy as regards low-frequencysignals to neural code transduction.
Electrode array insertion angle and depthThe standard electrode array used in our cases is 31mmin length, which allows an insertion angle of∼720° [52].A long electrode would allow the stimulation of more
apical regions of the cochlea with better coding of thelow-frequency information in the vowel /a/. FFR willtherefore displaymost of the described fundamental andformant frequencies harbored in the stimulus.
Conclusion
(1) Brainstem auditory responses provoked byCI signaltransduction faithfully transcribe the complex inputsignal.
(2) Response lag time and RMS are reasonablebiomarkers for response consistency.
(3) User-friendly software programs for clinicalimplementation will provide a valuable tool toassess CI signal transduction.
AcknowledgementsTheauthors thanktheCochlear ImplantUnit,FacultyofMedicine, Alexandria University, Egypt, for providingthe participants of the study. They also thank Dr NinaKraus Laboratory for providing the brainstem toolbox.
Financial support and sponsorshipNil.
Conflicts of interestThere are no conflicts of interest.
References1 Clark G. The multi-channel cochlear implant and the relief of severe-to-
profound deafness. Cochlear Implants Int 2012; 13:69–85.
2 Wible B, Nicol T, Kraus N. Abnormal neural encoding of repeated speechstimuli in noise in children with learning problems. Clin Neurophysiol 2002;113:485–494.
3 Wible B, Nicol T, Kraus N. Atypical brainstem representation of onset andformant structure of speech sounds in children with language-basedlearning problems. Biol Psychol 2004; 67:299–317.
4 Johnson KL, Nicol TG, Zecker SG, Kraus N. Auditory brainstem correlatesof perceptual timing deficits. J Cogn Neurosci 2007; 19:376–385.
5 AbramsDA, Nicol T, Zecker SG, KrausN. Auditory brainstem timing predictscerebral asymmetry for speech. J Neurosci 2006; 26:11131–11137.
6 Kraus N, McGee TJ, Carrell TD, Zecker SG, Nicol TG, Koch DB. Auditoryneurophysiologic responses and discrimination deficits in children withlearning problems. Science 1996; 273:971–973.
7 Russo NM, Nicol TG, Zecker SG, Hayes EA, Kraus N. Auditory trainingimproves neural timing in the human brainstem. Behav Brain Res 2005;156:95–103.
8 Russo N, Nicol T, Musacchia G, Kraus N. Brainstem responses to speechsyllables. Clin Neurophysiol 2004; 115:2021–2030.
9 Kraus N, Banai K. Auditory-processing malleability − Focus on languageand music. Curr Dir Psychol Sci 2007; 16:105–110.
10 Song JH, Banai K, Kraus N. Brainstem timing deficits in children withlearning impairment may result from corticofugal origins. Audiol Neurootol2008; 13:335–344.
11 Banai K, Nicol T, Zecker SG, Kraus N. Brainstem timing: implications forcortical processing and literacy. J Neurosci 2005; 25:9850–9857.
12 Chandrasekaran B, Hornickel J, Skoe E, Nicol T, Kraus N. Context-dependent encoding in the human auditory brainstem relates to hearingspeech in noise: implications for developmental dyslexia. Neuron 2009;64:311–319.
Templates for speech ABR performance in CI Mourad et al. 33
13 Wible B, Nicol T, Kraus N. Correlation between brainstem and corticalauditory processes in normal and language-impaired children. Brain 2005;128:417–423.
14 King C, Warrier CM, Hayes E, Kraus N. Deficits in auditory brainstempathway encoding of speech sounds in children with learning problems.Neurosci Lett 2002; 319:111–115.
15 Hornickel J, Kraus N. Unstable representation of sound: a biological markerof dyslexia. J Neurosci 2013; 33:3500–3504.
16 Wong PC, Skoe E, Russo NM, Dees T, Kraus N. Musical experienceshapes human brainstem encoding of linguistic pitch patterns. Nat Neurosci2007; 10:420–422.
17 Hayes EA, Warrier CM, Nicol TG, Zecker SG, Kraus N. Neural plasticityfollowing auditory training in children with learning problems. ClinNeurophysiol 2003; 114:673–684.
18 Anderson S, Skoe E, Chandrasekaran B, Kraus N. Neural timing is linked tospeech perception in noise. J Neurosci 2010; 30:4922–4926.
19 Song JH, Banai K, Russo NM, Kraus N. On the relationship betweenspeech- and nonspeech-evoked auditory brainstem responses. AudiolNeurootol 2006; 11:233–241.
20 Cunningham J, Nicol T, Zecker SG, Bradlow A, Kraus N. Neurobiologicresponses to speech in noise in children with learning problems: deficitsand strategies for improvement. Clin Neurophysiol 2001; 112:758–767.
21 Song JH, Nicol T, Kraus N. Test-retest reliability of the speech-evokedauditory brainstem response. Clin Neurophysiol 2011; 122:346–355.
22 Rocha-Muniz CN, Befi-Lopes DM, Schochat E. Sensitivity, specificity andefficiency of speech-evoked ABR. Hear Res 2014; 317:15–22.
23 Moller AR. Neural mechanisms of BAEP. Electroencephalogr ClinNeurophysiol Suppl 1999; 49:27–35.
24 Galbraith GC, Amaya EM, de Rivera JM, Donan NM, DuongMT, Hsu JN, etal.Brain stem evoked response to forward and reversed speech in humans.Neuroreport 2004; 15:2057–2060.
25 Krishnan A, Xu Y, Gandour JT, Cariani PA. Human frequency-followingresponse: representation of pitch contours in Chinese tones. Hear Res2004; 189:1–12.
26 Ananthakrishnan S, Krishnan A, Bartlett E. Human frequency followingresponse: neural representation of envelope and temporal fine structure inlisteners with normal hearing and sensorineural hearing loss. Ear Hear2016; 37:e91–e103.
27 Krishnan A. Human frequency-following responses: representation ofsteady-state synthetic vowels. Hear Res 2002; 166:192–201.
28 Aiken SJ, Picton TW. Envelope and spectral frequency-following responsesto vowel sounds. Hear Res 2008; 245:35–47.
29 Banai K, Abrams D, Kraus N. Sensory-based learning disability: insightsfrom brainstem processing of speech sounds. Int J Audiol 2007;46:524–532.
30 Anderson S, Kraus N. Sensory-cognitive interaction in the neural encodingof speech in noise: a review. J Am Acad Audiol 2010; 21:575–585.
31 Johnson KL, Nicol TG, Kraus N. Brain stem response to speech: abiological marker of auditory processing. Ear Hear 2005; 26:424–434.
32 Clark GM. Hearing due to electrical stimulation of the auditory system. MedJ Aust 1969; 1:1346–1348.
33 Clark GM. Middle ear and neural mechanisms in hearing and themanagement of deafness [thesis]. Sydney, New South Wales: Universityof Sydney; 1970.
34 Clark GM. Responses of cells in the superior olivary complex of the cat toelectrical stimulation of the auditory nerve. Exp Neurol 1969; 24:124–136.
35 Paolini A, Clark GM. The effect of pulsatile intracochlear electricalstimulation on intracellularly recorded cochlear nucleus neurons. In:Clark GM editor. Cochlear Implants: XVI World Congress ofOtohinolaryngology Head and Neck Surgery. Bologna, Italy: MonduzziEditore; 1997:119–124.
36 Siebert WM. Frequency discrimination in the auditory system: place orperiodicity mechanisms? Proc IEEE Inst Electr Electron Eng 1970;58:723–730.
37 Burkitt AN, Clark GM. Synchronization of the neural response to noisyperiodic synaptic input. Neural Comput 2001; 13:2639–2672.
38 Schatzer R, Vermeire K, Visser D, Krenmayr A, Kals M, Voormolen M, et al.Electric-acoustic pitch comparisons in single-sided-deaf cochlear implantusers: frequency-place functions and rate pitch. Hear Res 2014; 309:26–35.
39 Kikkawa YS, Nakagawa T, Ying L, Tabata Y, Tsubouchi H, Ido A, et al.Growth factor-eluting cochlear implant electrode: impact on residualauditory function, insertional trauma, and fibrosis. J Transl Med 2014;12:280.
40 Sly DJ, Hampson AJ, Minter RL, Heffer LF, Li J, Millard RE, et al. Brain-derived neurotrophic factor modulates auditory function in the hearingcochlea. J Assoc Res Otolaryngol 2013; 13:1–16.
41 Gillespie LN, Zanin MP, Shepherd RK. Cell-based neurotrophin treatmentsupports long-term auditory neuron survival in the deaf guinea pig. J ControlRelease 2015; 198:26–34.
42 Fransson A, Jarlebark LE, Ulfendahl M. In vivo infusion of UTP and uridineto the deafened guinea pig inner ear: effects on response thresholds andneural survival. J Neurosci Res 2009; 87:1712–1717.
43 Landry TG, Wise AK, Fallon JB, Shepherd RK. Spiral ganglion neuronsurvival and function in the deafened cochlea following chronicneurotrophic treatment. Hear Res 2011; 282:303–313.
44 Firszt JB, Chambers RD, Kraus, Reeder RM. Neurophysiology of cochlearimplant users I: effects of stimulus current level and electrode site on theelectrical ABR, MLR, and N1-P2 response. Ear Hear 2002; 23:502–515.
45 Gyo K, Yanagihara N. Electrically and acoustically evoked brain stemresponses in guinea pig. Acta Otolaryngol 1980; 90:25–31.
46 Starr A, Brackmann DE. Brain stem potentials evoked by electricalstimulation of the cochlea in human subjects. Ann Otol Rhinol Laryngol1979; 88:550–556.
47 Guiraud J, Gallego S, Arnold L, Boyle P, Truy E, Collet L. Effects of auditorypathway anatomy and deafness characteristics? (1): on electrically evokedauditory brainstem responses. Hear Res 2007; 223:48–60.
48 Lundin K, Stillesjo F, Rask-Andersen H. Prognostic value of electricallyevoked auditory brainstem responses in cochlear implantation. CochlearImplants Int 2015; 16:254–261.
49 Riss D, Hamzavi JS, Blineder M, Honeder C, Ehrenreich I, Kaider A, et al.FS4, FS4-p, and FSP: a 4-month crossover study of 3 fine structure sound-coding strategies. Ear Hear 2014; 35:e272–e281.
50 Muller J, Brill S, Hagen R, Moeltner A, Brockmeier SJ, Stark T, et al.Clinicaltrial results with the MED-EL fine structure processing coding strategy inexperienced cochlear implant users. J Otorhinolaryngol Relat Spec 2012;74:185–198.
51 Wilson BS, Finley CC, Lawson DT, Wolford RD, Eddington DK, RabinowitzWM. Better speech recognition with cochlear implants. Nature 1991;352:236–238.
52 Brill S, Muller J, Hagen R, Moltner A, Brockmeier SJ, Stark T, et al. Site ofcochlear stimulation and its effect on electrically evoked compound actionpotentials using the MED-EL standard electrode array. Biomed Eng Online2009; 8:40.
34 Advanced Arab Academy of Audio-Vestibulogy Journal, Vol. 3 No. 2, July-December 2016