template for reports developed - national center for ... · web viewkrembil foundation, arthritis...
TRANSCRIPT
Evidence Table 1. Postmarketing studies: AdultsAuthor,
Year, Study Design
Population studied
Vaccines included
Selection Bias Attrition, non-response
Participation bias
Ascertainment of
vaccination status
Ascertainment of health outcome
Analysis conducted
Adjusted for these potential confounders
Period data collected
Study funder
Primary results regarding vaccine
Any risk factor
findings
Comment
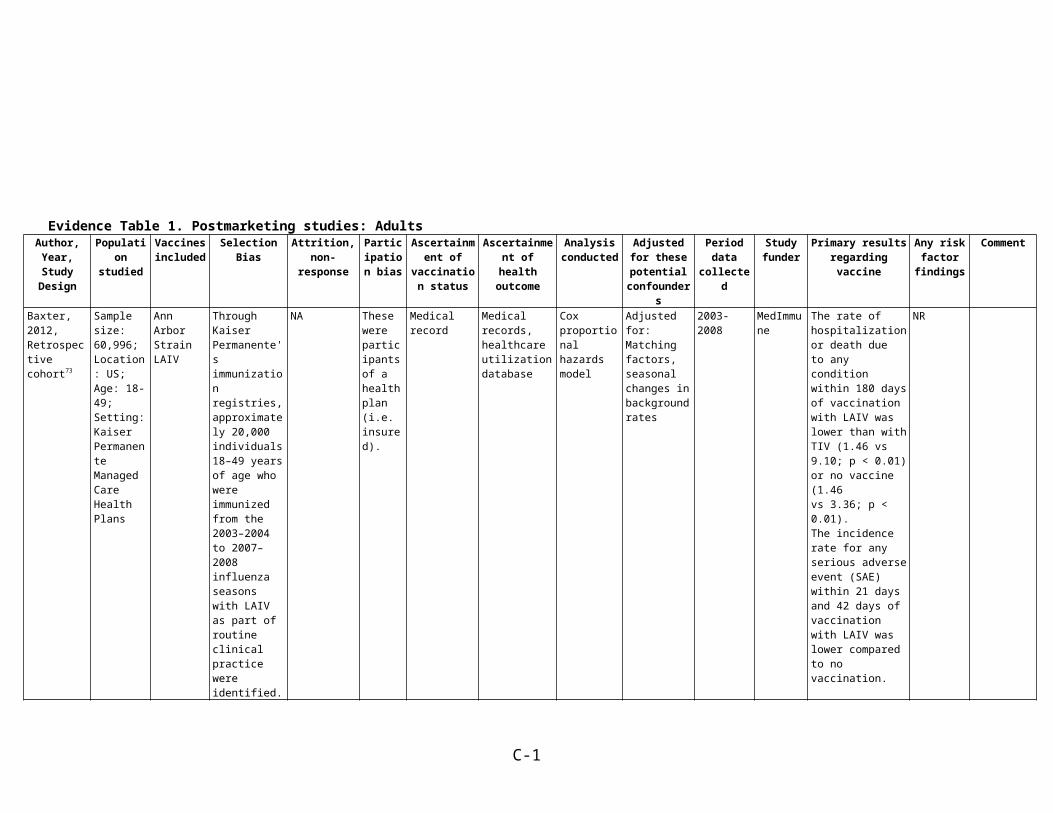
Baxter, 2012, Retrospective cohort73
Sample size: 60,996; Location: US; Age: 18-49; Setting: Kaiser Permanente Managed Care Health Plans
Ann Arbor Strain LAIV
Through Kaiser Permanente'simmunization registries, approximately 20,000 individuals 18–49 years of age who were immunized from the 2003–2004 to 2007–2008 influenza seasons with LAIV as part of routine clinicalpractice were identified.
NA These were participants of a health plan (i.e. insured).
Medical record Medical records, healthcare utilization database
Cox proportional hazards model
Adjusted for: Matching factors, seasonal changes in background rates
2003-2008 MedImmune
The rate of hospitalization or death dueto any condition within 180 days of vaccination with LAIV waslower than with TIV (1.46 vs 9.10; p < 0.01) or no vaccine (1.46vs 3.36; p < 0.01).The incidence rate for any serious adverse event (SAE) within 21 days and 42 days of vaccination with LAIV was lower compared to no vaccination.
NR
C-1
Evidence Table 1. Postmarketing studies: AdultsAuthor, Year, Study Design
Population studied
Vaccines included
Selection Bias Attrition, non-response
Participation bias
Ascertainment of vaccination status
Ascertainment of health outcome
Analysis conducted
Adjusted for these potential confounders
Period data collected
Study funder
Primary results regarding vaccine
Any risk factor findings
Comment
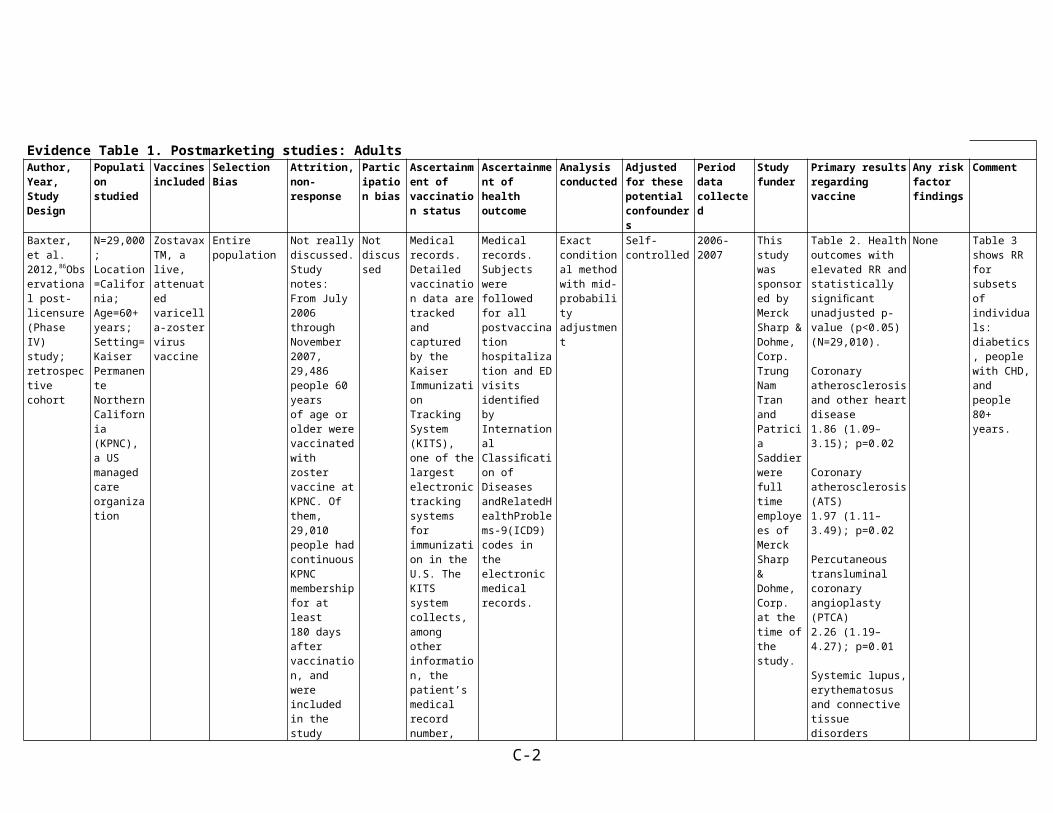
Baxter, et al. 2012,86Observational post-licensure (Phase IV) study; retrospective cohort
N=29,000;Location=California;Age=60+ years;Setting=Kaiser Permanente Northern California (KPNC), a US managed care organization
ZostavaxTM, a live, attenuated varicella-zoster virus vaccine
Entire population
Not really discussed. Study notes: From July 2006 through November 2007, 29,486 people 60 yearsof age or older were vaccinated with zoster vaccine at KPNC. Ofthem, 29,010 people had continuous KPNC membership for at least180 days after vaccination, and were included in the study population.
Not discussed
Medical records. Detailed vaccination data are tracked and captured by the KaiserImmunization Tracking System (KITS), one of the largest electronic tracking systems for immunization in the U.S. The KITS systemcollects, among other information, the patient’s medical record number, date of vaccination, type of vaccine, route of administration, facility in which the vaccine was administered, manufacturerand vaccine lot number, and can be linked to other data sources to get additional information
Medical records. Subjects were followed for all postvaccination hospitalization and ED visits identified by International Classification of DiseasesandRelatedHealthProblems-9(ICD9) codes in the electronic medical records.
Exact conditional method with mid-probability adjustment
Self-controlled 2006-2007 This study was sponsored by Merck Sharp & Dohme, Corp. Trung Nam Tran and Patricia Saddier were full time employees of Merck Sharp& Dohme, Corp. at the time of the study.
Table 2. Health outcomes with elevated RR and statistically significant unadjusted p-value (p<0.05)(N=29,010).
Coronary atherosclerosis and other heart disease1.86 (1.09–3.15); p=0.02
Coronary atherosclerosis (ATS)1.97 (1.11–3.49); p=0.02
Percutaneous transluminal coronary angioplasty(PTCA)2.26 (1.19–4.27); p=0.01
Systemic lupus, erythematosus and connective tissuedisorders8.57 (1.08–212.11); p=0.04
None Table 3 shows RR for subsets of individuals: diabetics, people with CHD, and people 80+ years.
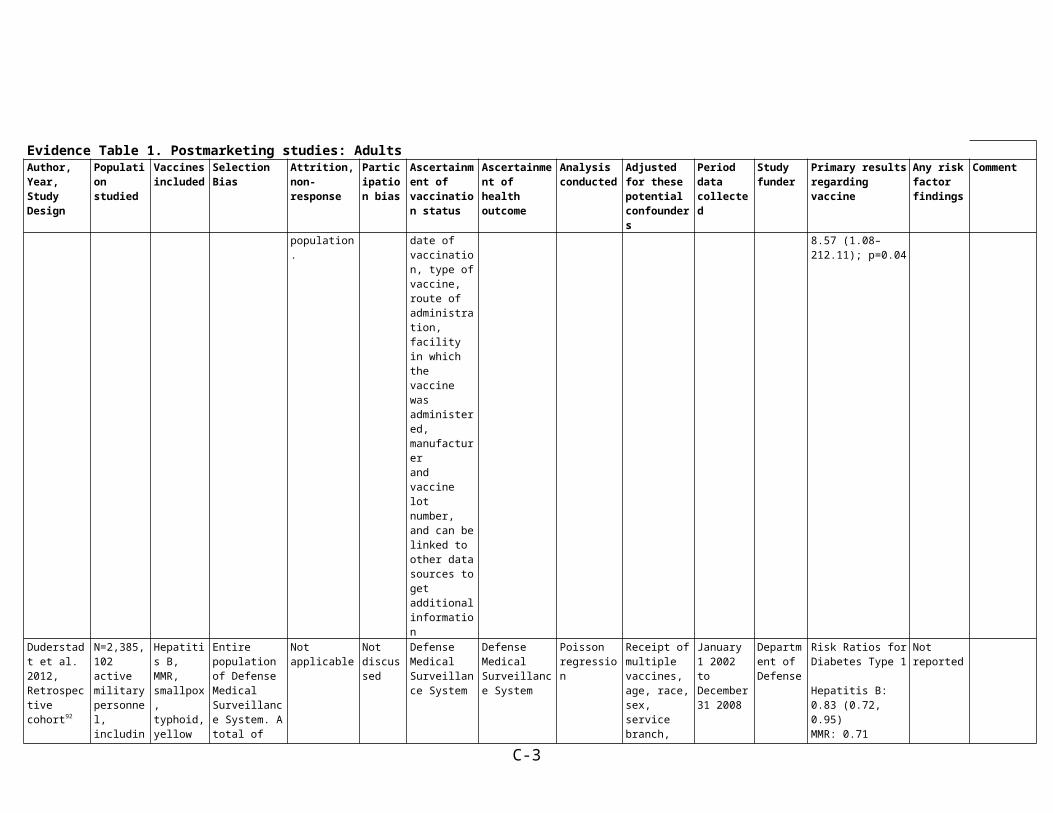
Duderstadt et al. 2012,
N=2,385,102 active
Hepatitis B, MMR,
Entire population of
Not applicable Not discussed
Defense Medical
Defense Medical
Poisson regression
Receipt of multiple
January 1 2002 to
Department of
Risk Ratios for Diabetes Type 1
Not reported
C-2
Evidence Table 1. Postmarketing studies: AdultsAuthor, Year, Study Design
Population studied
Vaccines included
Selection Bias Attrition, non-response
Participation bias
Ascertainment of vaccination status
Ascertainment of health outcome
Analysis conducted
Adjusted for these potential confounders
Period data collected
Study funder
Primary results regarding vaccine
Any risk factor findings
Comment
Retrospective cohort92
military personnel, including 1,074 cases of type 1 diabetes;Location=US;Age=17-35 years;
smallpox, typhoid, yellow fever
Defense Medical Surveillance System. A total of 17,874 were excluded; if these exclusions differed systematically from those included, bias would be introduced into the study
Surveillance System
Surveillance System
vaccines, age, race, sex, service branch, military grade, occupation, deployment, and calendar year
December 31 2008
DefenseHepatitis B: 0.83 (0.72, 0.95)MMR: 0.71 (0.61, 0.83)
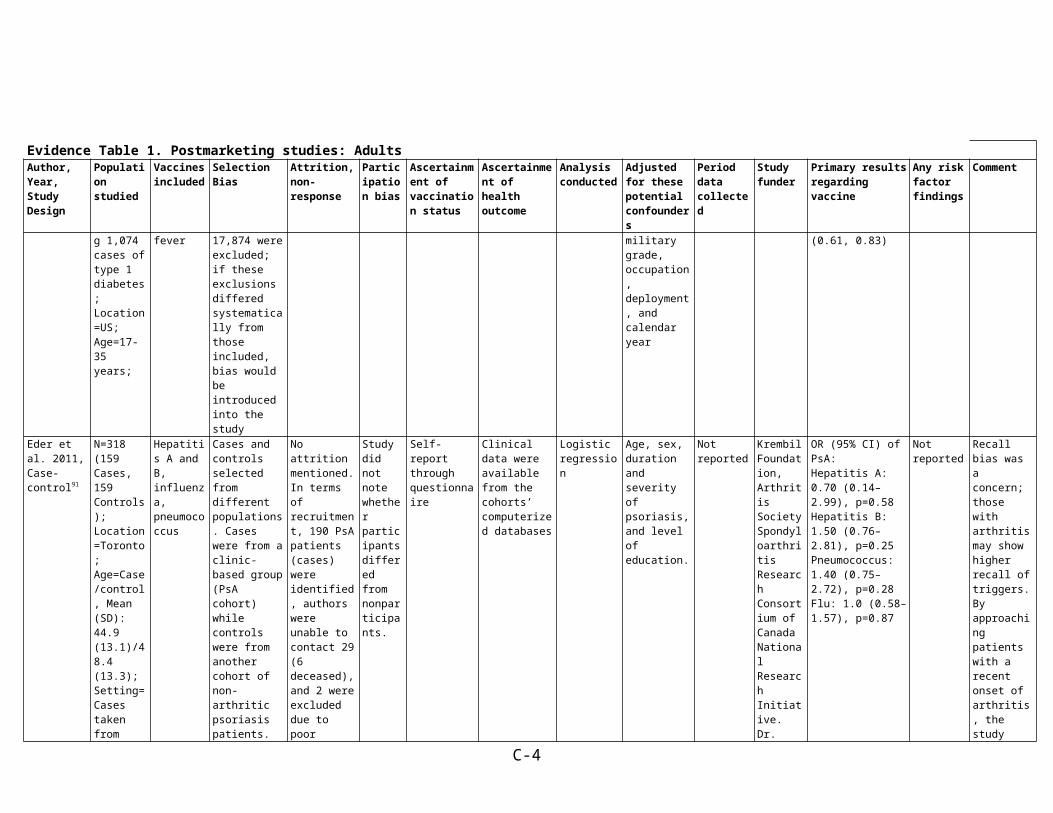
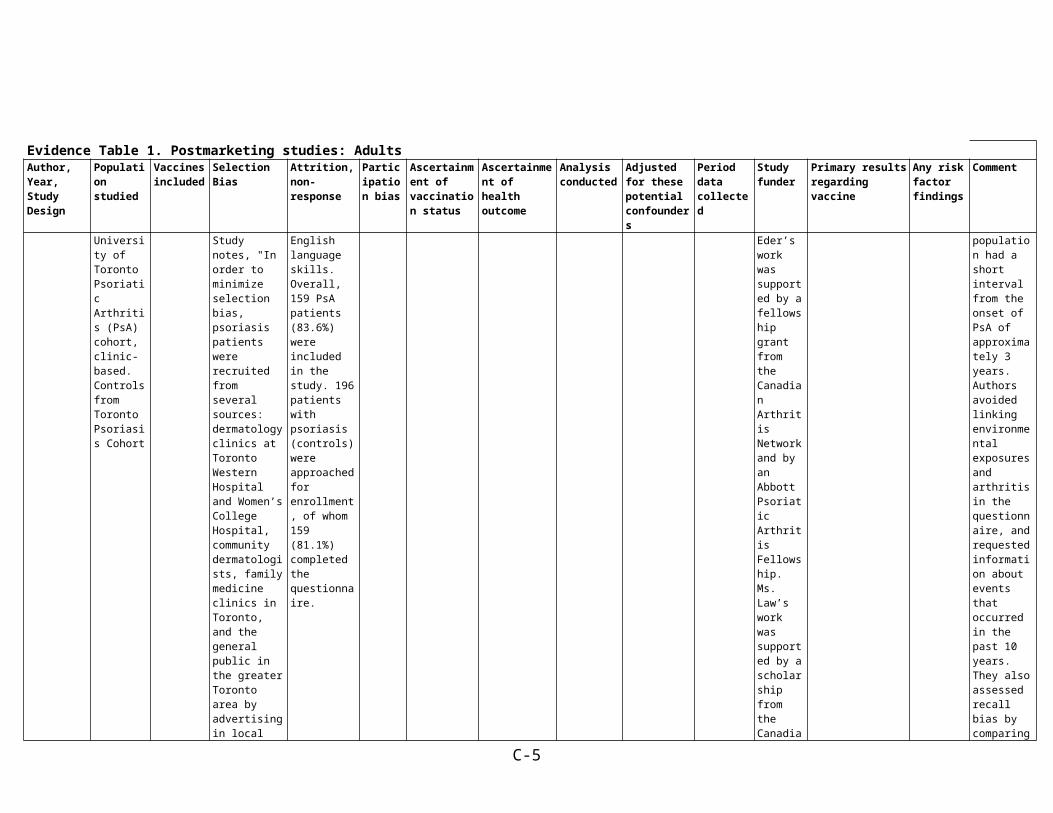
Eder et al. 2011, Case-control91
N=318 (159 Cases, 159 Controls);Location=Toronto;Age=Case/control, Mean (SD): 44.9 (13.1)/48.4 (13.3);Setting=Cases taken from University of Toronto Psoriatic Arthritis (PsA) cohort, clinic-based. Controls from Toronto Psoriasis Cohort
Hepatitis A and B, influenza, pneumococcus
Cases and controls selected from different populations. Cases were from a clinic-based group (PsA cohort) while controls were from another cohort of non-arthritic psoriasis patients. Study notes, "In order to minimize selection bias, psoriasis patients wererecruited from several sources: dermatology clinics at Toronto Western Hospital and Women’s College Hospital,community
No attrition mentioned. In terms of recruitment, 190 PsA patients (cases) were identified, authors were unable to contact 29 (6 deceased), and 2 were excluded due to poor English language skills. Overall, 159 PsA patients (83.6%) were included in the study. 196 patients with psoriasis (controls) were approached for enrollment, of whom 159 (81.1%) completed the
Study did not note whether participants differed from nonparticipants.
Self-report through questionnaire
Clinical data were available from the cohorts’ computerized databases
Logistic regression
Age, sex, duration and severity of psoriasis, and level of education.
Not reported Krembil Foundation, Arthritis Society Spondyloarthritis Research Consortium of Canada National Research Initiative. Dr. Eder’s work was supported by a fellowship grant from the Canadian Arthritis Network and by an Abbott Psoriatic Arthritis Fellowship. Ms. Law’s
OR (95% CI) of PsA:Hepatitis A: 0.70 (0.14–2.99), p=0.58 Hepatitis B: 1.50 (0.76–2.81), p=0.25Pneumococcus: 1.40 (0.75–2.72), p=0.28Flu: 1.0 (0.58–1.57), p=0.87
Not reported Recall bias was a concern; those with arthritis may show higher recall of triggers. By approaching patients with a recent onset of arthritis, the study population had a short interval from the onset of PsA of approximately 3 years. Authors avoided linking environmental exposures and arthritis in the questionnaire, and requested information
C-3
Evidence Table 1. Postmarketing studies: AdultsAuthor, Year, Study Design
Population studied
Vaccines included
Selection Bias Attrition, non-response
Participation bias
Ascertainment of vaccination status
Ascertainment of health outcome
Analysis conducted
Adjusted for these potential confounders
Period data collected
Study funder
Primary results regarding vaccine
Any risk factor findings
Comment
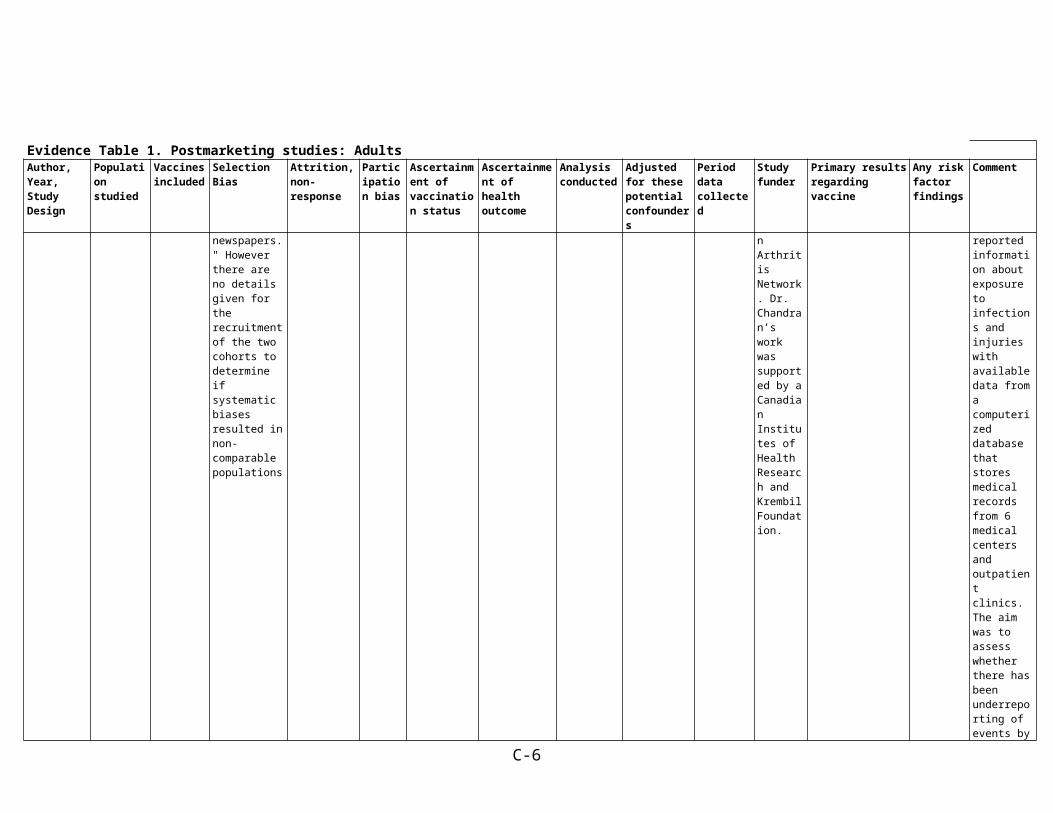
dermatologists, family medicine clinics in Toronto, and the general public in the greater Toronto area byadvertising in local newspapers." However there are no details given for the recruitment of the two cohorts to determine if systematic biases resulted in non-comparable populations
questionnaire. work was supported by a scholarship from the Canadian Arthritis Network. Dr. Chandran’s work was supported by a Canadian Institutes of Health Research and Krembil Foundation.
about events that occurred in the past 10 years. They also assessed recall bias by comparing reported information about exposure to infections and injuries with available data from a computerized database that stores medicalrecords from 6 medical centers and outpatient clinics. The aim was to assess whether there has been underreporting of events by psoriasis patients. Overall, 3 of 3 patients with psoriasis reported a previous injury and 0 of 2 reported an infection. In the PsA group, only 1 of 3 reported an injury and 1 of 6
C-4
Evidence Table 1. Postmarketing studies: AdultsAuthor, Year, Study Design
Population studied
Vaccines included
Selection Bias Attrition, non-response
Participation bias
Ascertainment of vaccination status
Ascertainment of health outcome
Analysis conducted
Adjusted for these potential confounders
Period data collected
Study funder
Primary results regarding vaccine
Any risk factor findings
Comment
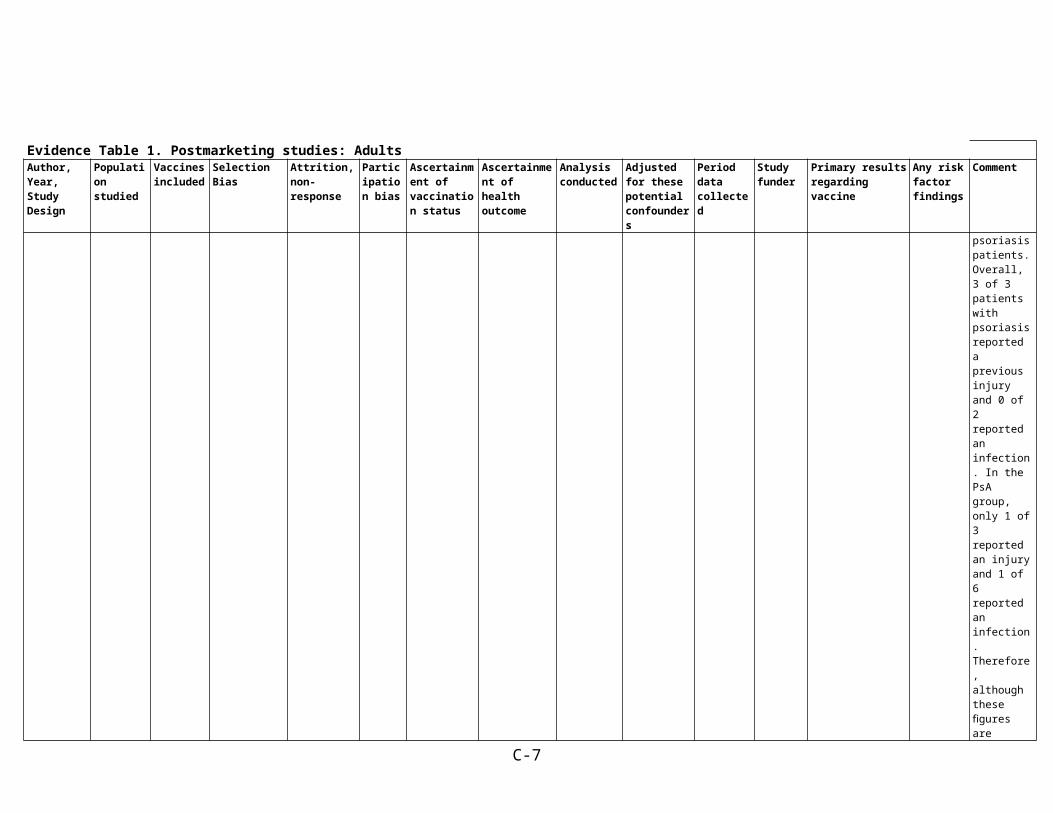
reported an infection. Therefore, although these figures are small, it seems that recall bias is not a threat to the validity of the study, as the rates of reporting were not lower in the psoriasis group."
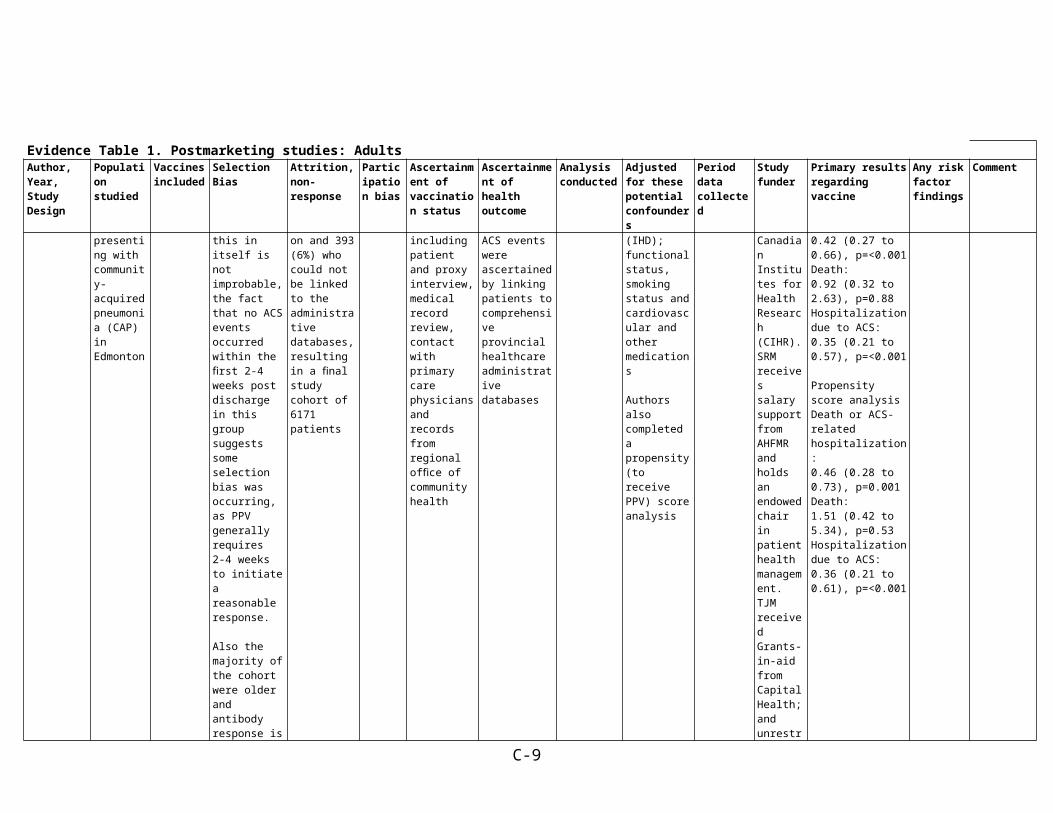
Eurich et al. 2012, Prospective cohort75
N=6171;Location=Edmonton (Alberta, Canada);Age=mean age 59 years;Setting=Population-based cohort of adults presenting with community-acquired pneumonia (CAP) in Edmonton
Pneumococcal polysaccharide vaccination (PPV)
Authors note a large protective effect against ACS events among patients receiving PPV during the acute pneumonia event was observed. Although this in itself is not improbable, the fact that no ACS events occurred within thefirst 2-4 weeks post discharge in this group suggests someselection bias was occurring, as PPV generally requires2-4 weeks to initiate a
Of the 6874 cohort patients with CAP, authors excluded 310 (5%)who had PPV first administered during their initial CAP presentation and 393 (6%) who could not be linked to theadministrative databases, resulting in a final study cohort of 6171 patients
Not discussed
PPV status was collected by trained staff masked to all study hypotheses.Receipt of vaccination was ascertained throughmultiple avenues including patient and proxy interview, medicalrecord review, contact with primary care physicians and recordsfrom regional office of community health
Research nurses prospectively collected all clinically diagnosed ACS events in the emergency department and during hospitalization. Thereafter, ACS events were ascertained by linking patients tocomprehensive provincial healthcare administrative databases
Multivariable Cox proportional hazard model
Pneumonia severity based on the PSI; comorbidities including chronic obstructive pulmonary disease, diabetes, ischemic heart disease (IHD); functional status, smoking status andcardiovascular and other medications
Authors also completed a propensity (to receive PPV) score analysis
2000 to 2002
DTE receives salary support from Alberta Heritage Foundation for Medical Research (AHFMR) and the Canadian Institutes for Health Research (CIHR). SRMreceives salary support from AHFMR and holds an endowed
Adjusted HRs for fatal and non-fatal ACS events within 90 days according to pneumococcal vaccination status
Primary analysisDeath or ACS-related hospitalization:0.42 (0.27 to 0.66), p=<0.001Death: 0.92 (0.32 to 2.63), p=0.88Hospitalization due to ACS:0.35 (0.21 to 0.57), p=<0.001
Propensity score analysisDeath or ACS-related hospitalization: 0.46 (0.28 to 0.73), p=0.001Death:
None
C-5
Evidence Table 1. Postmarketing studies: AdultsAuthor, Year, Study Design
Population studied
Vaccines included
Selection Bias Attrition, non-response
Participation bias
Ascertainment of vaccination status
Ascertainment of health outcome
Analysis conducted
Adjusted for these potential confounders
Period data collected
Study funder
Primary results regarding vaccine
Any risk factor findings
Comment
reasonable response.
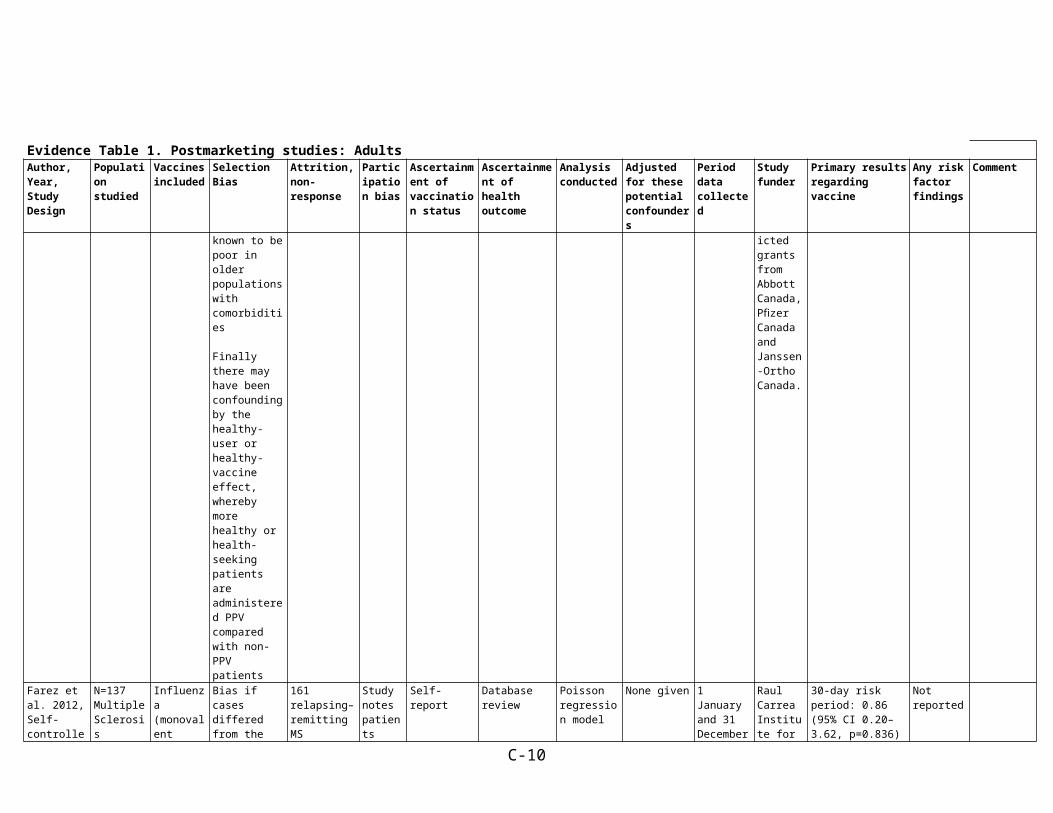
Also the majority of the cohort were older and antibody response isknown to be poor in older populations with comorbidities
Finally there may have been confounding by the healthy-user or healthy-vaccine effect, whereby more healthy or health-seeking patients are administered PPV compared with non-PPV patients
chair in patient health management. TJM received Grants-in-aid from Capital Health; and unrestricted grantsfrom Abbott Canada, Pfizer Canada and Janssen-Ortho Canada.
1.51 (0.42 to 5.34), p=0.53Hospitalization due to ACS: 0.36 (0.21 to 0.61), p=<0.001
Farez et al. 2012, Self-controlled case series62
N=137 Multiple Sclerosis patients;Location=Argentina;Age=37 +/-8 years (mean)
Influenza (monovalent Focetria, Novartis SRL, Italy or trivalent Istivac, Sanofi Pasteur, France)
Bias if cases differed from the general population in systematic ways (e.g., more or less likely to be vaccinated, doctors more likely to recommend vaccinations)
161 relapsing–remitting MS patients were identified from the database. 23 patients refused to participate and 2 had received other immunizations, leaving 137
Study notes patients excluded did not differ significantly from those included
Self-report Database review Poisson regression model
None given 1 January and 31 December 2010
Raul Carrea Institute for Neurological Research
30-day risk period: 0.86 (95% CI 0.20–3.62, p=0.836)
60-day risk period: 0.61 (95% CI 0.18–2.02, p=0.419)
90-day risk period: 0.51 (95% CI 0.18–1.47, p=0.211)
Not reported
Garbe et al. 2012, Case-control68
N=1,200 (outpatient + inpatient). Influenza
Influenza vaccine
(Pneumoco
Cases and controls selected from the same hospitals using
None Study did not address
Self-report through face-to-face interviews and
Patients with ITP were identified through regular
Unconditional logistic regression
Model 1: age and sex (“single drug assessment”)
October 2000 until March 2009
Cases were collected within the
OR (95% CI) of ITP Influenza, outpatient cases and controls:Model 1: 3.8 (1.5–
Not reported
C-6
Evidence Table 1. Postmarketing studies: AdultsAuthor, Year, Study Design
Population studied
Vaccines included
Selection Bias Attrition, non-response
Participation bias
Ascertainment of vaccination status
Ascertainment of health outcome
Analysis conducted
Adjusted for these potential confounders
Period data collected
Study funder
Primary results regarding vaccine
Any risk factor findings
Comment
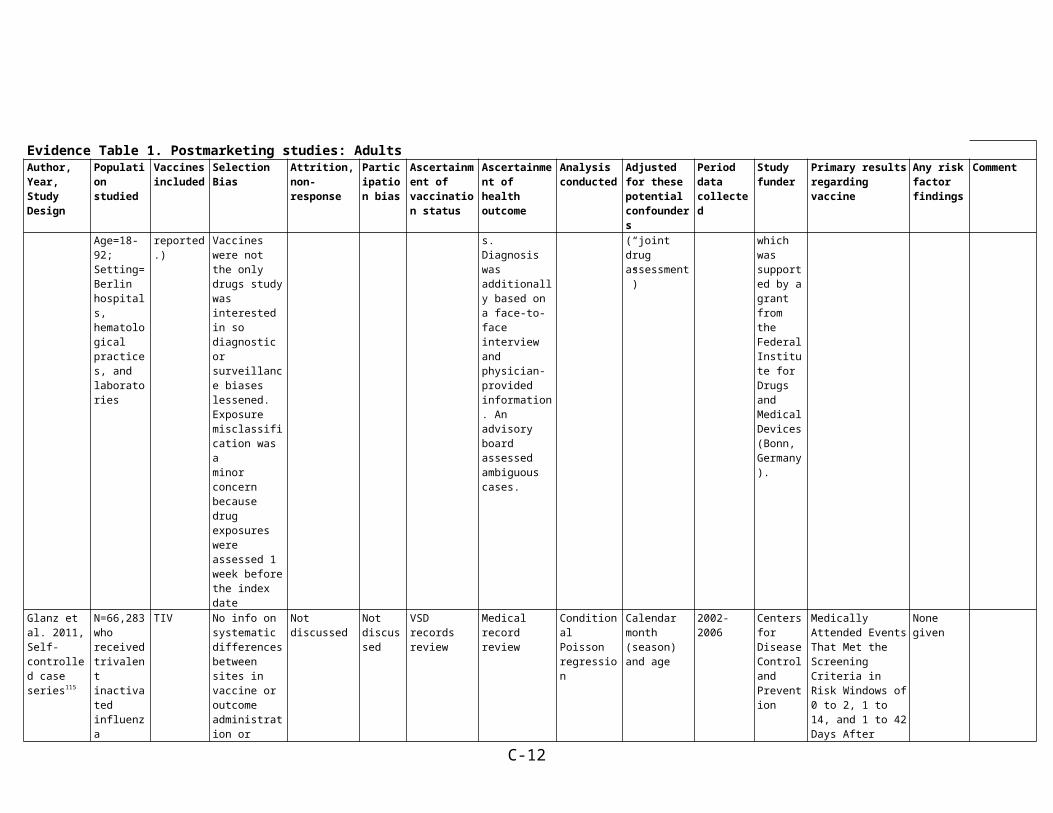
results presented just for outpatients where N=861;Location=Berlin, Germany;Age=18-92;Setting=Berlin hospitals, hematological practices, and laboratories
ccal and poliomyelitis vaccine also assessed as causing 1 case each but ORs were Not reported.)
the same general procedures for interviews reducing the chance of selection bias occurring. Vaccines were not the only drugs study was interested in so diagnostic or surveillance biases lessened. Exposure misclassification was aminor concern because drug exposures were assessed 1 week before the index date
physician-provided information
active inquiry in 2- to 3-week intervals in hospitals, hematological practices and laboratories. Diagnosis was additionally based on a face-to-face interview and physician-provided information. An advisory board assessed ambiguous cases.
Model 2: age, sex and all drugs that were significant in the single drug assessment (“joint drug assessment”)
study “Berlin Case–Control Surveillance (FAKOS) of Serious Blood Dyscrasias”,which was supported by a grant from the Federal Institute for Drugs andMedical Devices (Bonn, Germany).
9.1) Model 2: 4.0 (1.5–9.6)
Glanz et al. 2011, Self-controlled case series115
N=66,283 who received trivalent inactivated influenza vaccine (TIV);Location=US;Age=24-59 months;Setting=Seven US managed care organizations (Vaccine Safety Datalink)
TIV No info on systematic differences between sites in vaccine or outcome administration or ascertainment
Not discussed Not discussed
VSD records review
Medical record review
Conditional Poisson regression
Calendar month (season) and age
2002-2006 Centers for Disease Control and Prevention
Medically Attended Events That Met the Screening Criteria in Risk Windows of 0 to 2, 1 to 14, and 1 to 42 Days After Vaccination
Non-confirmed Cases From Electronic Data Analysis
Potentially seriousNervous system disorder: 6.32 (0.96-41.65), p=0.06 Cardiac event: 3.56 (0.55-22.89), p=0.18Hypotension: 5.52 (0.71-43.07), p=0.10Gastrointestinal tract
None given
C-7
Evidence Table 1. Postmarketing studies: AdultsAuthor, Year, Study Design
Population studied
Vaccines included
Selection Bias Attrition, non-response
Participation bias
Ascertainment of vaccination status
Ascertainment of health outcome
Analysis conducted
Adjusted for these potential confounders
Period data collected
Study funder
Primary results regarding vaccine
Any risk factor findings
Comment
disorder: 2.75 (1.07-7.09), p=0.04 Cellulitis and skin reaction: 3.06 (0.89-10.53), p=0.08 Potentially less serious and commonRash: 2.33 (0.68-7.93), p=0.18 Limb soreness: 3.56 (1.30-9.75), p=0.01Fever: 1.40 (1.09-1.80), p=0.01 Gastrointestinal tract symptoms (vomiting and diarrhea): 1.52 (1.18-1.95), p=0.001
Medical Record–Confirmed CasesPotentially seriousGastrointestinal tract disorder: 7.70 (1.11-53.52), p=0.04Cellulitis and skin reaction: 3.27 (0.36-29.70), p=0.29Potentially less serious and commonRash: 1.94 (0.44-8.63), p=0.38Fever: 1.71 (1.64-1.80)Gastrointestinal tract symptoms (vomiting and diarrhea): 1.18 (1.10-1.25)
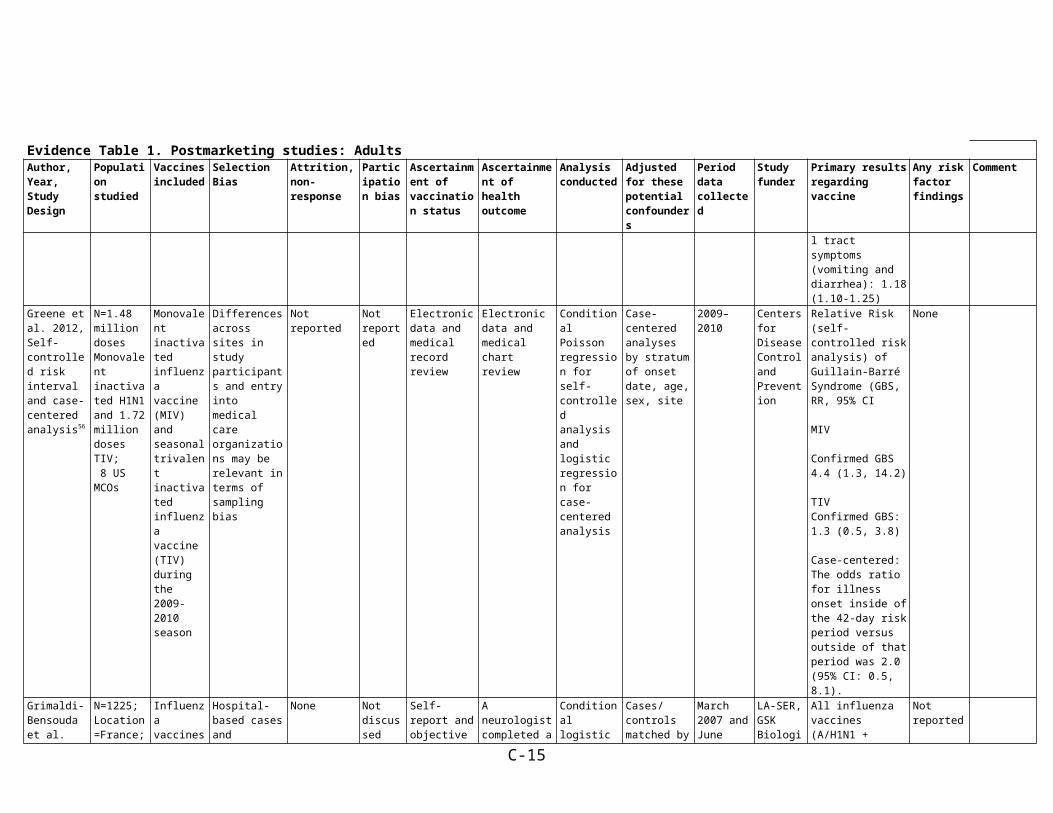
Greene et al. 2012, Self-controlled risk interval and case-centered analysis56
N=1.48 million doses Monovalent inactivated H1N1 and 1.72 million
Monovalent inactivated influenza vaccine (MIV) and seasonal trivalent
Differences across sites in study participants and entry into medical care organizations
Not reported Not reported
Electronic data and medical record review
Electronic data and medical chart review
Conditional Poisson regression for self-controlled analysis and logistic
Case-centered analyses by stratum of onset date, age, sex, site
2009–2010 Centers for Disease Control and Prevention
Relative Risk (self-controlled risk analysis) of Guillain-Barré Syndrome (GBS, RR, 95% CI
MIV
None
C-8
Evidence Table 1. Postmarketing studies: AdultsAuthor, Year, Study Design
Population studied
Vaccines included
Selection Bias Attrition, non-response
Participation bias
Ascertainment of vaccination status
Ascertainment of health outcome
Analysis conducted
Adjusted for these potential confounders
Period data collected
Study funder
Primary results regarding vaccine
Any risk factor findings
Comment
doses TIV; 8 US MCOs
inactivated influenza vaccine (TIV) during the 2009-2010 season
may be relevant in terms of sampling bias
regression for case-centered analysis
Confirmed GBS 4.4 (1.3, 14.2)
TIVConfirmed GBS: 1.3 (0.5, 3.8)
Case-centered:The odds ratio for illness onset inside of the 42-day risk period versus outside of that period was 2.0 (95% CI: 0.5, 8.1).
Grimaldi-Bensouda et al. 2011, Prospective case-control58
N=1225;Location=France;Age=Cases/Controls, Mean (SD): 48.6 (18.0)/50.7 (18.1);Setting=Cases drawn from all university and major regional hospital centers in metropolitan France known to have a large neurology clinic and centers treating neurologic disease in children; Controls
Influenza vaccines (seasonal and A/H1N1)
Hospital-based cases and controls from general practitioner lists. Diagnostic and surveillance approaches may differ such that hospital cases may have had better ascertainment of risk factors. Authors note that exposure misclassification may have occurred.
None Not discussed
Self-report and objective confirmation obtained in a sample of 40% of cases and controls for the seasonal vaccination. The proportion was raised to 100% during the A/H1N1 vaccination program. Confirmation included copies of vaccination sheets, certificates, and other documentation.
A neurologist completed a detailed medical form - cases ascertained using an algorithm considering clinical, electrophysiologic, and cerebrospinal fluid data. Borderline cases were reviewed by independent and blinded experts
Conditional logistic regression
Cases/controls matched by age, gender, index date (calendar month), and region
Receipt of other vaccines during the same time window, receipt of influenza vaccine in the past (before the time window considered), family history of autoimmune diseases, number of physician consultations in the previous year (0–2, 3–6, 7–12, or
March 2007 and June 2010. For the influenza A/H1N1 vaccine, analysis was restricted to the GBS cases that had occurred from commencement of the French national vaccination program on October 20, 2009, to 6 weeks after the end of the vaccination campaign on March 31, 2010
LA-SER, GSK Biologicals, and Sanofi-Pasteur
All influenza vaccines (A/H1N1 + seasonal)First 6 weeks: 1.22 (0.45-3.32) 7 weeks to 3 months: 0.66 (0.27-1.65)4 months to 6 months: 0.80 (0.34-1.88)
Seasonal influenza vaccine only First 6 weeks: 1.30 (0.41-4.12)7 weeks to 3 months: 0.60 (0.23-1.60)4 months to 6 months: 0.69 (0.29-1.66)
Influenza A/H1N1 vaccine only First 6 weeks: 0.92 (0.11-7.55)7 weeks to 3 months: 1.08 (0.09-13.15)
Not reported
C-9
Evidence Table 1. Postmarketing studies: AdultsAuthor, Year, Study Design
Population studied
Vaccines included
Selection Bias Attrition, non-response
Participation bias
Ascertainment of vaccination status
Ascertainment of health outcome
Analysis conducted
Adjusted for these potential confounders
Period data collected
Study funder
Primary results regarding vaccine
Any risk factor findings
Comment
from registry of general practice patients across France
>=13), antibiotic or antiviral treatment in the previous 2 months, use of antipyretic agents in the previous 2 months.
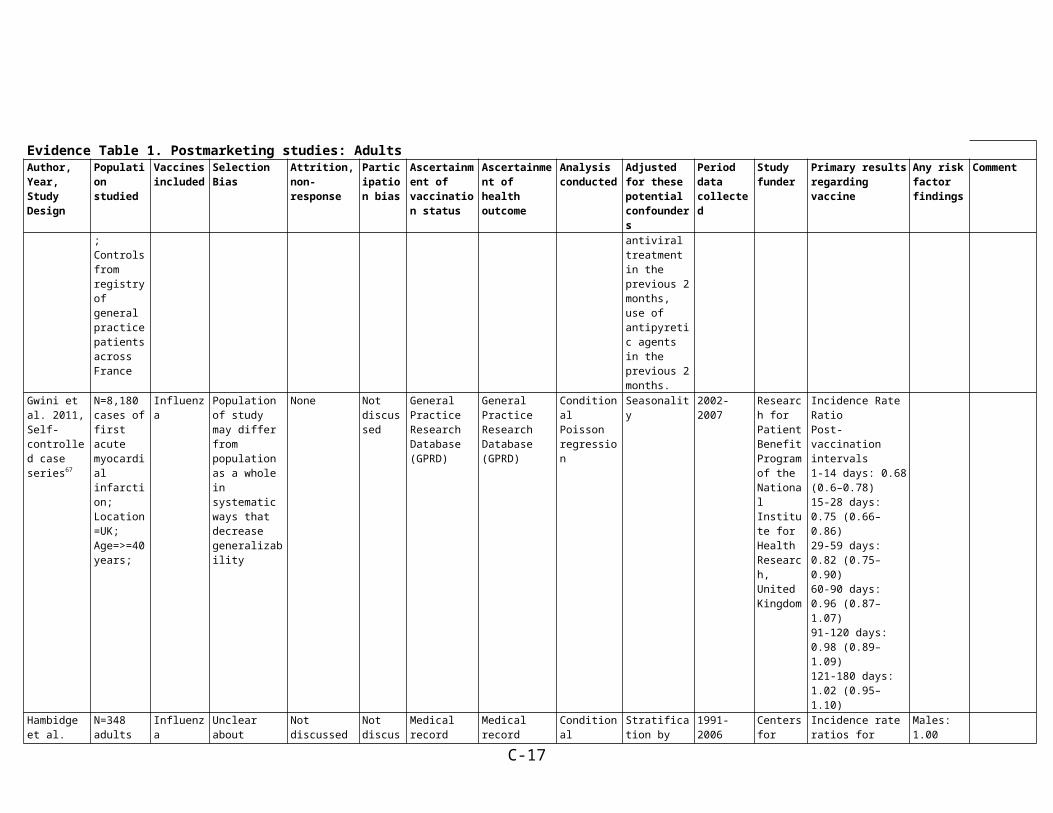
Gwini et al. 2011, Self-controlled case series67
N=8,180 cases of first acute myocardial infarction;Location=UK;Age=>=40 years;
Influenza Population of study may differ from population as a whole in systematic ways that decrease generalizability
None Not discussed
General Practice Research Database (GPRD)
General Practice Research Database (GPRD)
Conditional Poisson regression
Seasonality 2002-2007 Research for Patient Benefit Program of the National Institute for Health Research, United Kingdom
Incidence Rate RatioPost-vaccination intervals1-14 days: 0.68 (0.6–0.78)15-28 days: 0.75 (0.66–0.86)29-59 days: 0.82 (0.75–0.90)60-90 days: 0.96 (0.87–1.07)91-120 days: 0.98 (0.89–1.09)121-180 days: 1.02 (0.95–1.10)
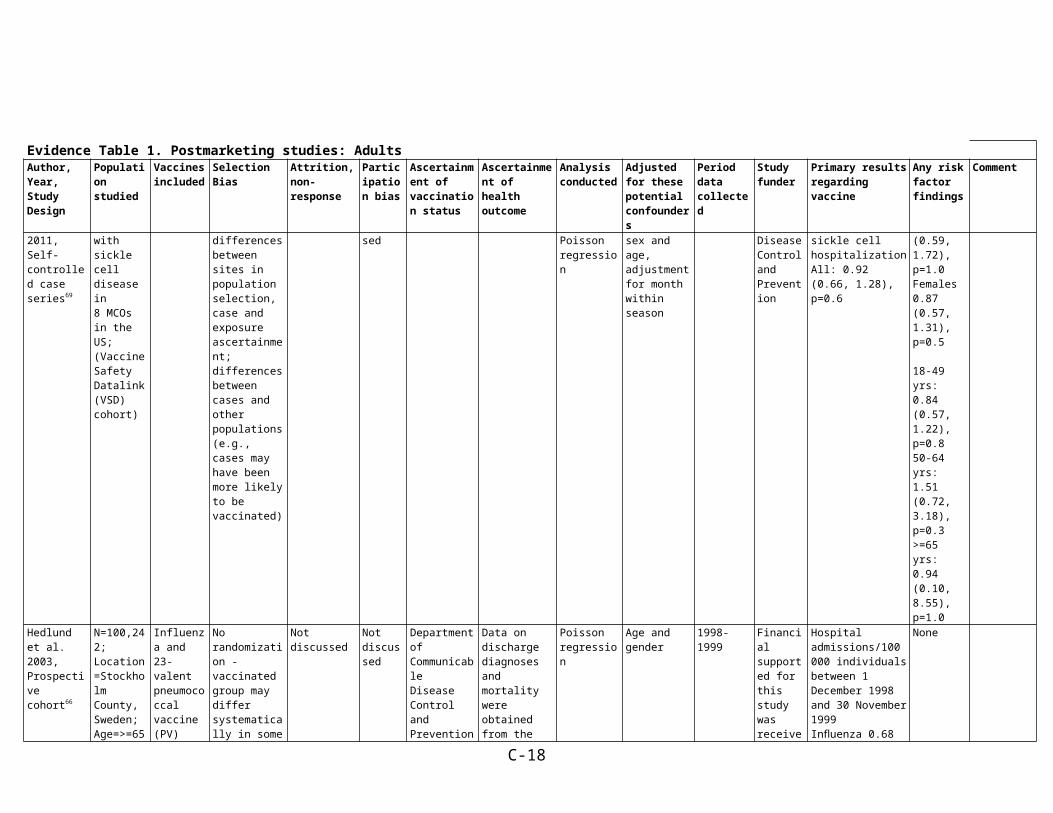
Hambidge et al. 2011, Self-controlled case series69
N=348 adults with sickle cell disease in8 MCOs in the US;(Vaccine Safety Datalink (VSD) cohort)
Influenza Unclear about differences between sites in population selection, case and exposure ascertainment; differences between cases and other populations (e.g., cases may have been more likely to be vaccinated)
Not discussed Not discussed
Medical record Medical record Conditional Poisson regression
Stratification by sex and age, adjustment for month within season
1991-2006 Centers for Disease Control and Prevention
Incidence rate ratios for sickle cell hospitalizationAll: 0.92 (0.66, 1.28), p=0.6
Males: 1.00 (0.59, 1.72), p=1.0Females 0.87 (0.57, 1.31), p=0.5
18-49 yrs: 0.84 (0.57, 1.22), p=0.850-64 yrs: 1.51 (0.72, 3.18), p=0.3>=65 yrs: 0.94 (0.10, 8.55), p=1.0
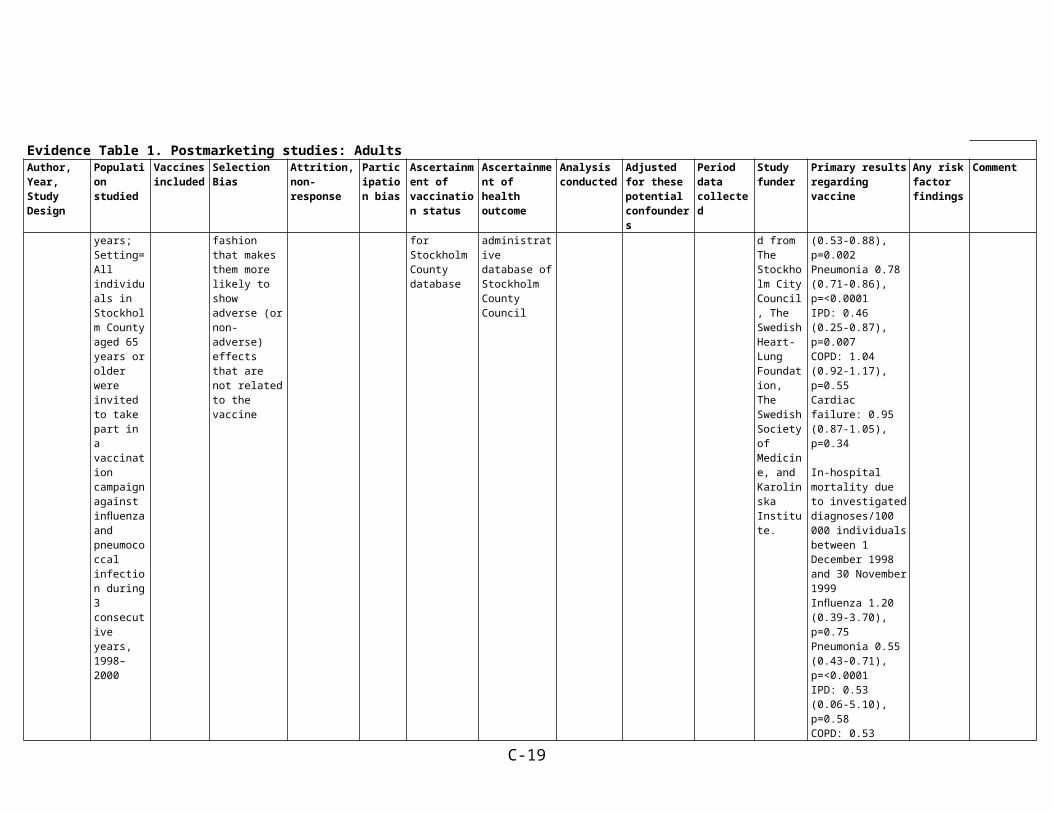
Hedlund et al. 2003, Prospective
N=100,242;Location=Stockholm
Influenza and 23-valent
No randomization - vaccinated
Not discussed Not discussed
Department of CommunicableDisease
Data on discharge diagnoses and
Poisson regression
Age and gender
1998-1999 Financial supported for this
Hospital admissions/100 000 individuals between 1
None
C-10

Evidence Table 1. Postmarketing studies: AdultsAuthor, Year, Study Design
Population studied
Vaccines included
Selection Bias Attrition, non-response
Participation bias
Ascertainment of vaccination status
Ascertainment of health outcome
Analysis conducted
Adjusted for these potential confounders
Period data collected
Study funder
Primary results regarding vaccine
Any risk factor findings
Comment
cohort66 County, Sweden;Age=>=65 years;Setting=All individuals in Stockholm County aged 65 years or older were invited to take part in a vaccination campaign against influenza and pneumococcal infection during 3 consecutive years, 1998–2000
pneumococcal vaccine (PV)
group may differ systematically in some fashion that makes them more likely to show adverse (or non-adverse) effects that are not related to the vaccine
Control and Prevention for Stockholm County database
mortality were obtained from the administrative database of Stockholm CountyCouncil
study was received from The Stockholm City Council, The Swedish Heart-Lung Foundation, The Swedish Society of Medicine, and KarolinskaInstitute.
December 1998 and 30 November 1999Influenza 0.68 (0.53-0.88), p=0.002Pneumonia 0.78 (0.71-0.86), p=<0.0001IPD: 0.46 (0.25-0.87), p=0.007COPD: 1.04 (0.92-1.17), p=0.55Cardiac failure: 0.95 (0.87-1.05), p=0.34
In-hospital mortality due to investigated diagnoses/100 000 individuals between 1 December 1998 and 30 November 1999Influenza 1.20 (0.39-3.70), p=0.75Pneumonia 0.55 (0.43-0.71), p=<0.0001IPD: 0.53 (0.06-5.10), p=0.58COPD: 0.53 (0.29-0.98), p=0.034Cardiac failure: 0.72 (0.59-0.87), p=0.0007
Hospital admissions/100 000 individuals per year between 1 December 1998 and 31 May 1999Influenza: 0.66 (0.52-0.82), p=0.0002Pneumonia: 0.72 (0.65-0.79), p=<0.0001IPD: 0.47 (0.24-0.93),
C-11
Evidence Table 1. Postmarketing studies: AdultsAuthor, Year, Study Design
Population studied
Vaccines included
Selection Bias Attrition, non-response
Participation bias
Ascertainment of vaccination status
Ascertainment of health outcome
Analysis conducted
Adjusted for these potential confounders
Period data collected
Study funder
Primary results regarding vaccine
Any risk factor findings
Comment
p=0.02COPD: 1.07 (0.94-1.23), p=0.32Cardiac failure: 0.90 (0.80-1.01), p=0.08
Hospital admissions/100 000 individuals per year between 1 June and 30 November 1999Influenza: 1.36 (0.58-3.17), p=0.48Pneumonia: 0.88 (0.77-1.00), p=0.05IPD: 0.45 (0.15-1.32), p=0.20COPD: 1.00 (0.87-1.15), p=0.98Cardiac failure: 1.02 (0.93-1.11), p=0.69
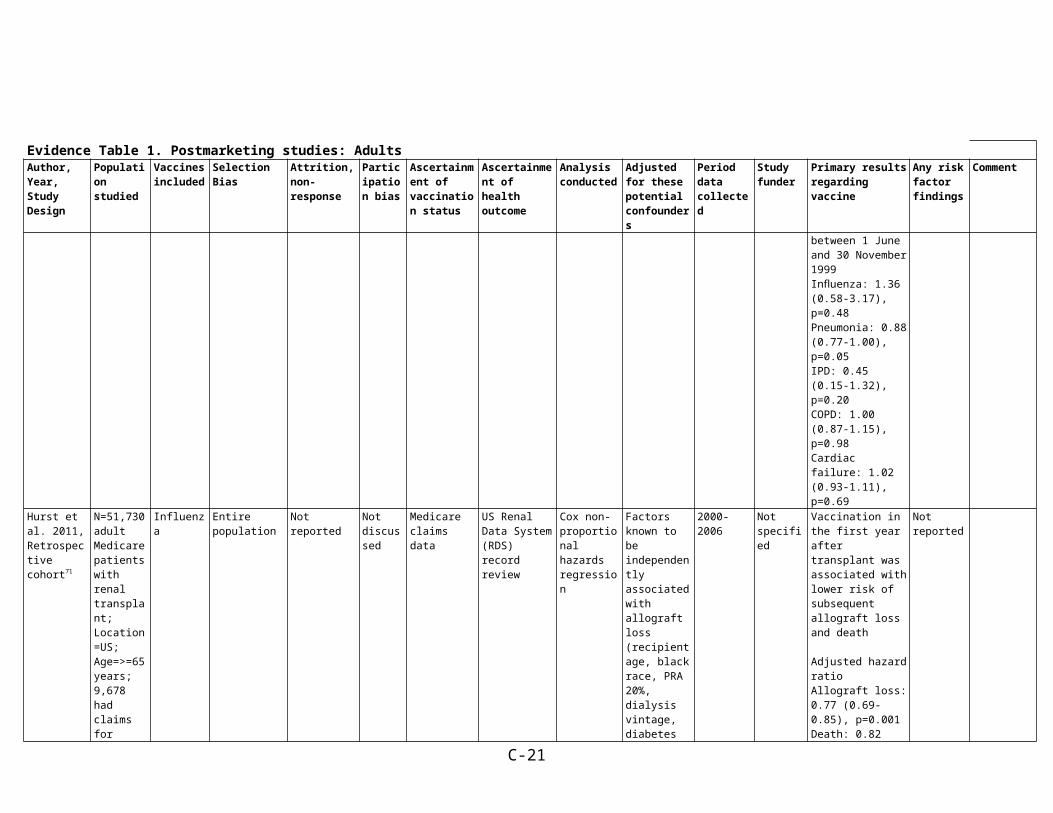
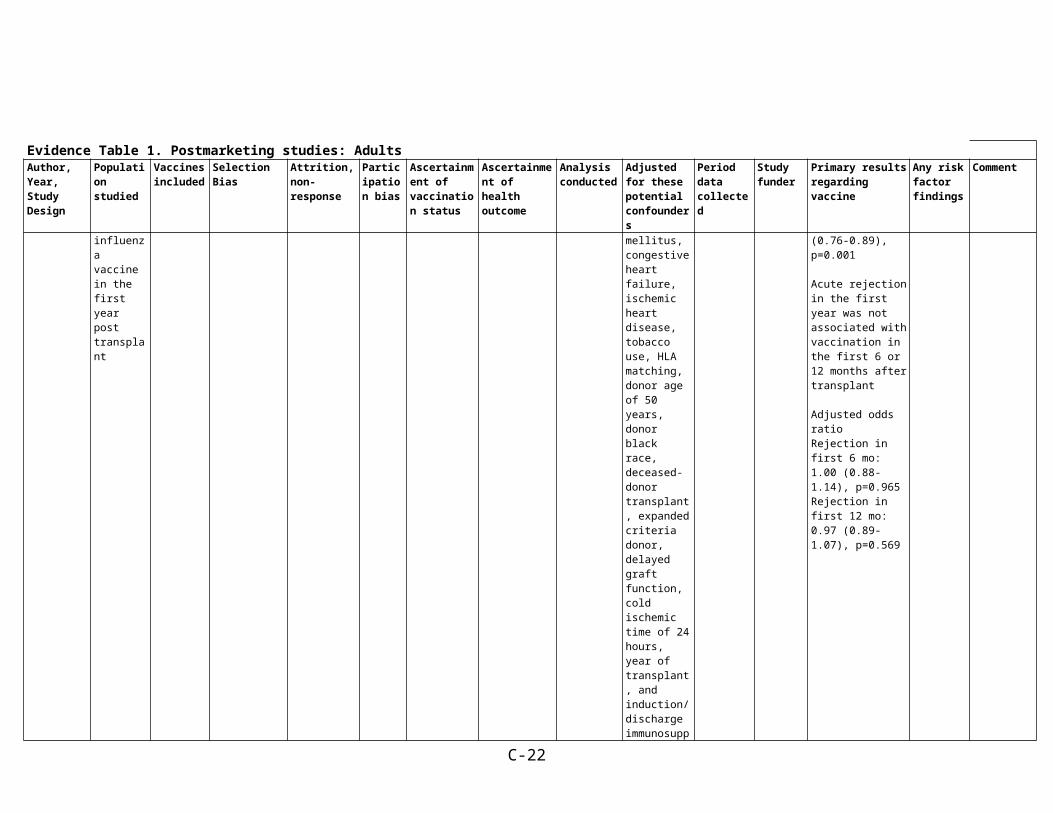
Hurst et al. 2011, Retrospective cohort71
N=51,730 adult Medicare patients with renal transplant;Location=US;Age=>=65 years;9,678 had claims for influenza vaccine in the first year post transplant
Influenza Entire population
Not reported Not discussed
Medicare claims data
US Renal Data System (RDS) record review
Cox non-proportional hazards regression
Factors known to beindependently associated with allograft loss (recipient age, black race, PRA 20%, dialysis vintage, diabetes mellitus, congestive heart failure, ischemic heart disease, tobacco use, HLA matching, donor age of 50 years, donor black race, deceased-
2000-2006 Not specified
Vaccination in the first year after transplant was associated with lower risk of subsequent allograft loss and death
Adjusted hazard ratio Allograft loss: 0.77 (0.69-0.85), p=0.001Death: 0.82 (0.76-0.89), p=0.001
Acute rejection in the first year was not associated with vaccination in the first 6 or 12 months after transplant
Adjusted odds ratio Rejection in first 6
Not reported
C-12

Evidence Table 1. Postmarketing studies: AdultsAuthor, Year, Study Design
Population studied
Vaccines included
Selection Bias Attrition, non-response
Participation bias
Ascertainment of vaccination status
Ascertainment of health outcome
Analysis conducted
Adjusted for these potential confounders
Period data collected
Study funder
Primary results regarding vaccine
Any risk factor findings
Comment
donor transplant, expanded criteria donor,delayed graft function, cold ischemic time of 24 hours,year of transplant, and induction/discharge immunosuppression).
Others not specified for the relevant model but could include: older age, diabetes, later year of transplant, and tacrolimus or mycophenolate at discharge
mo: 1.00 (0.88-1.14), p=0.965Rejection in first 12 mo: 0.97 (0.89-1.07), p=0.569
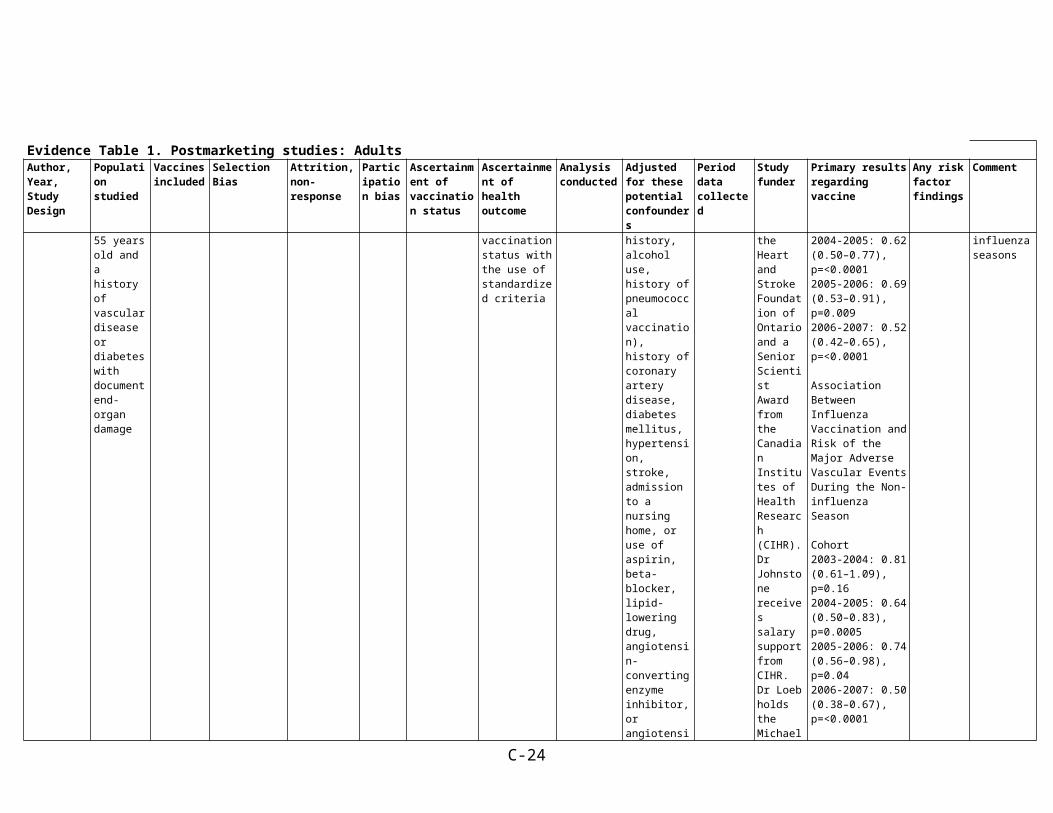
Johnstone et al. 2012, Prospective cohort65
N=31,546;Location=40 countries;Setting=Participants in the ONTARGET /TRANSCEND trials: at least 55 years old and a history of vascular disease or diabetes
Influenza, pneumococcal
Difficult to determine without more details on the original studies through which population drawn from
In total, 99.8% of participants were followed up until the primary outcome occurred or the end of study
Not discussed
Self-report All study outcomes were prospectively adjudicated by a central committee blinded to study medication allocation and influenza vaccination status with the use of standardized criteria
Logistic regression
Adjusted by propensity score for influenza vaccination (body mass index, age, sex, ethnicity, education, vitamin use, smoking history, alcohol use, history of pneumococcal vaccination), history of
2004 to 2007
This study was supported by a grant from Boehringer Ingelheim. Dr Yusuf was supported by the Heart and Stroke Foundation of Ontario and a
Association Between Influenza Vaccination and Risk of Major Adverse Vascular Events During the Influenza Season
Cohort2003-2004: 0.96 (0.73–1.27), p=0.792004-2005: 0.62 (0.50–0.77), p=<0.00012005-2006: 0.69 (0.53–0.91), p=0.0092006-2007: 0.52 (0.42–0.65),
Not reported There was no association between pneumococcal vaccination and the primary outcome during any of the influenza seasons
C-13

Evidence Table 1. Postmarketing studies: AdultsAuthor, Year, Study Design
Population studied
Vaccines included
Selection Bias Attrition, non-response
Participation bias
Ascertainment of vaccination status
Ascertainment of health outcome
Analysis conducted
Adjusted for these potential confounders
Period data collected
Study funder
Primary results regarding vaccine
Any risk factor findings
Comment
with document end-organ damage
coronary artery disease, diabetes mellitus, hypertension, stroke, admission to a nursing home, or use of aspirin, beta-blocker, lipid-lowering drug, angiotensin-converting enzyme inhibitor, or angiotensin II inhibitor
Senior Scientist Award from the Canadian Institutes of Health Research (CIHR). Dr Johnstone receives salary support from CIHR. Dr Loeb holds the Michael G. DeGroote Chair in Infectious Diseases at McMaster University
p=<0.0001
Association Between Influenza Vaccination and Risk of the Major Adverse Vascular Events During the Non-influenza Season
Cohort2003-2004: 0.81 (0.61–1.09), p=0.162004-2005: 0.64 (0.50–0.83), p=0.00052005-2006: 0.74 (0.56–0.98), p=0.042006-2007: 0.50 (0.38–0.67), p=<0.0001
Association Between Influenza Vaccination and Risk of Non-cardiovascular Death During the Influenza Season
Cohort2004-2005Non-cardiovascular deaths: 0.26 (0.16–0.40), p=<0.0001Cancer deaths: 0.20 (0.10–0.39), p=<0.0001Deaths resulting from other causes: 0.33 (0.18–0.60), p=0.00042005–2006Non-cardiovascular deaths: 0.21 (0.10–0.46), p=0.0001Cancer deaths: 0.27 (0.10–0.69), p=0.0065
C-14
Evidence Table 1. Postmarketing studies: AdultsAuthor, Year, Study Design
Population studied
Vaccines included
Selection Bias Attrition, non-response
Participation bias
Ascertainment of vaccination status
Ascertainment of health outcome
Analysis conducted
Adjusted for these potential confounders
Period data collected
Study funder
Primary results regarding vaccine
Any risk factor findings
Comment
Deaths resulting from other causes: 0.14 (0.03–0.58), p=0.0070
2006-2007Non-cardiovascular deaths: 0.27 (0.18–0.41), p=<0.0001Cancer deaths: 0.17 (0.10–0.31), p=<0.0001Deaths resulting from other causes: 0.47 (0.25–0.86), p=0.0137
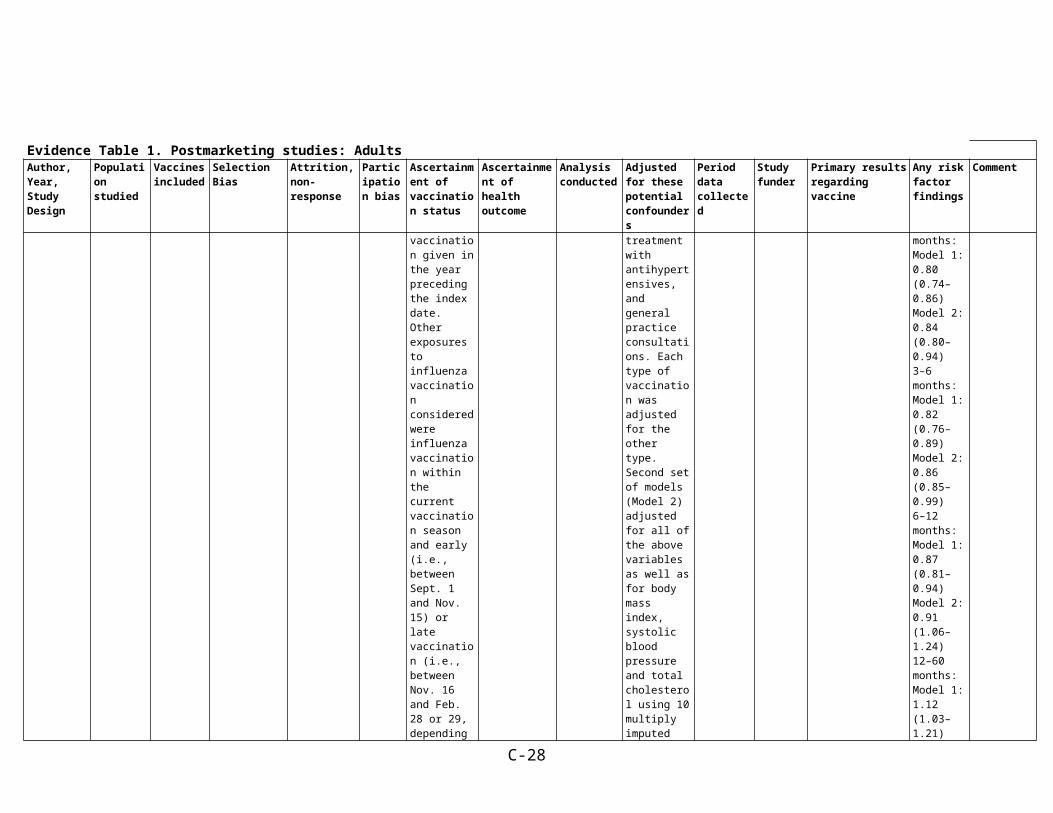
Siriwardena et al. 2010, Matched case-control64
N=78,706 (16,012 cases of myocardial infarction (MI), 62,964 controls);Location=UK;Age=40 to >=65;Setting=United Kingdom General Practice ResearchDatabase (GPRD), an extensively validated computerized database, representative of and comprising 5% of the population of England
Influenza; pneumococcal (study didn't specify types)
Possible biases in that those with risk factor for outcome may be more likely to be vaccinated, but confounders related to this were controlled for in multivariate analyses
Regression analyses dropped some participants due to missing data on risk factors such as smoking.
Not discussed
Data were extracted from the GPRD (assume by researchers). Virtually all patients in the database are registered with a general practitioner, and all health care attendances are recorded in the database. The database contains anonymized patient data that includes demographic information, diagnoses, medication, health-related behaviors, referrals and treatment outcomes.
Data were extracted from the GPRD (assume by researchers). Cases were at least 40 years at the time of first acute myocardial infarction (fatal or nonfatal) had clinical records for over five and a half years(between Nov. 1, 2001, to May 31, 2007) and were identified using standardized (Read and Oxford Medical InformationSystems [OXMIS]) codes.
Conditional logistic regression
Model 1 adjusted for asthma or chronic obstructive pulmonary disease, chronic heart disease, stroke or transient ischemic attack, diabetes, splenectomy, chronic liver disease, chronic renal failure, immunosuppression and HIV, hyperlipidemia, family history of acute myocardial infarction, peripheral vascular disease, hypertension, smoking
Cases identified from incident occurring between Nov.1, 2001, to May 31, 2007.
This study was supported by funding from the Research for Patient Benefit Program of the National Institute for Health Research, United Kingdom
OR (95% CI) of acute MIInfluenza vaccination within previous year:Model 1: 0.81 (0.77-0.85), p<0.001Model 2: 0.83 (0.80–0.88)
Pneumococcal vaccination within previous year:Model 1: 0.96 (0.91–1.02)Model 2: 0.98 (0.93-1.04)
Pneumococcal vaccination results included in Appendix (www.cmaj.ca/cgi/content/full/cmaj.091891/DC1)
None given, but subgroup results shows for the following categories:
InfluenzaVaccination in preceding yr: < 65 yr: Model 1: 0.81 (0.73–0.90) Model 2: 0.83 (0.75–0.92) ≥ 65 yr: Model 1: 0.79 (0.75–0.83) Model 2: 0.82 (0.78–0.86)
Time since last vaccination at index
C-15

Evidence Table 1. Postmarketing studies: AdultsAuthor, Year, Study Design
Population studied
Vaccines included
Selection Bias Attrition, non-response
Participation bias
Ascertainment of vaccination status
Ascertainment of health outcome
Analysis conducted
Adjusted for these potential confounders
Period data collected
Study funder
Primary results regarding vaccine
Any risk factor findings
Comment
and Wales. Influenza vaccination was defined as vaccination given in the year preceding the index date. Other exposures to influenza vaccination considered were influenza vaccination within the current vaccination season and early (i.e., between Sept. 1 and Nov. 15) or late vaccination (i.e., between Nov. 16 and Feb. 28 or 29, depending on the year). Patients were considered to have had a pneumococcal vaccination if they had ever received the pneumococcal vaccine before the index date. Combined vaccination was defined as pneumococcal vaccination ever combined
status, treatment with acetylsalicylic acid, treatment with statins, treatment with antihypertensives, and general practice consultations. Each type of vaccination was adjusted for the other type. Second set of models (Model 2) adjusted for all of the above variables as well as for body mass index, systolic blood pressure and total cholesterol using 10 multiply imputed data sets. (Systolic blood pressure, body mass index, and total cholesterol were not included in the main adjusted analyses owing to missing data (63%, 45% and 15% completeness respectively). Matched case-
date, months:
0–3 months:
Model 1: 0.80 (0.74–0.86) Model 2: 0.84 (0.80–0.94) 3–6 months:
Model 1: 0.82 (0.76–0.89) Model 2: 0.86 (0.85–0.99) 6–12 months:Model 1: 0.87 (0.81–0.94) Model 2: 0.91 (1.06–1.24) 12–60 months: Model 1: 1.12 (1.03–1.21) Model 2: 1.15 (0.88–1.20) ≥ 60 months: Model 1: 0.96 (0.82–1.13) Model 2: 1.03
Within-season vaccination Yes: Model 1: 0.80 (0.76–
C-16
Evidence Table 1. Postmarketing studies: AdultsAuthor, Year, Study Design
Population studied
Vaccines included
Selection Bias Attrition, non-response
Participation bias
Ascertainment of vaccination status
Ascertainment of health outcome
Analysis conducted
Adjusted for these potential confounders
Period data collected
Study funder
Primary results regarding vaccine
Any risk factor findings
Comment
with influenza vaccination in the year preceding the index date.
control, matched for: age, sex, general practice attended and calendar time (i.e., month corresponding to index date of acute myocardial infarction)
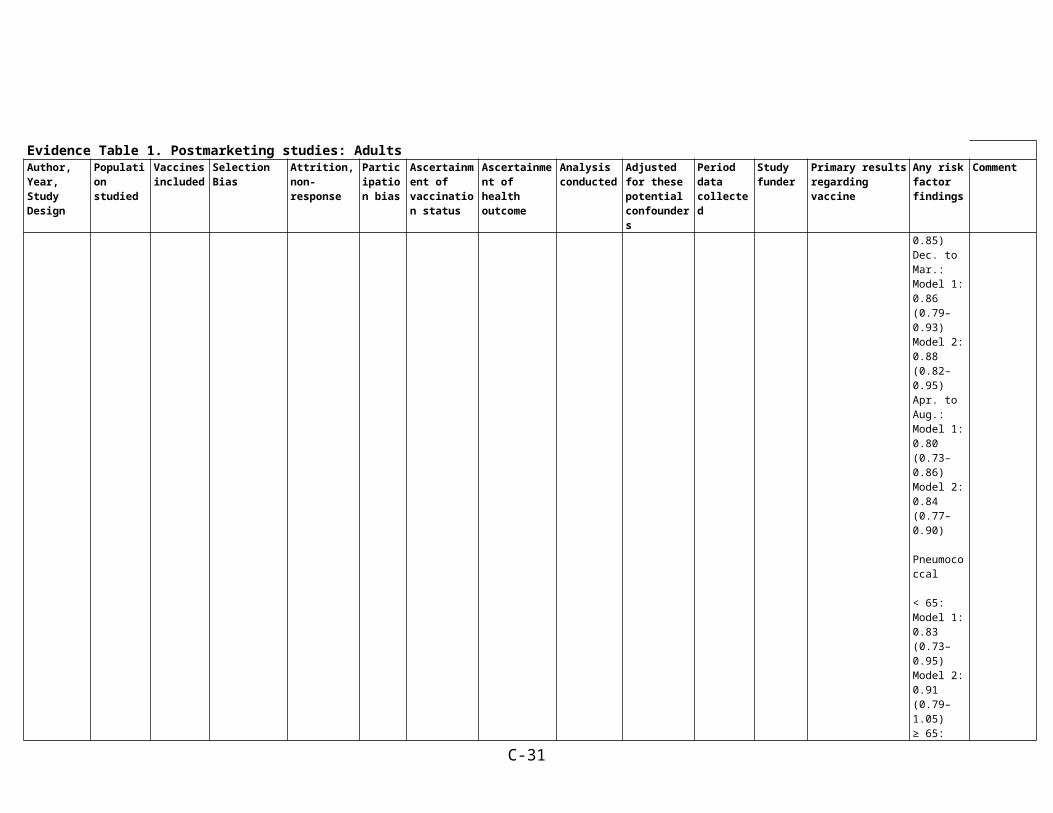
0.84) Model 2: 0.83 (0.79–0.87) Early within-season (Sept. to mid-Nov.):Model 1: 0.79 (0.75–0.83) Model 2: 0.82 (0.78–0.86) Late within-season (mid-Nov. to Feb.):Model 1: 0.88 (0.79–0.97) Model 2: 0.90 (0.82–1.00)Vaccination in previous yr, by month of index date: Sept. to Nov.:Model 1: 0.75 (0.68–0.83) Model 2: 0.77 (0.70–0.85) Dec. to Mar.: Model 1: 0.86 (0.79–0.93) Model 2: 0.88 (0.82–0.95) Apr. to Aug.:Model 1:
C-17
Evidence Table 1. Postmarketing studies: AdultsAuthor, Year, Study Design
Population studied
Vaccines included
Selection Bias Attrition, non-response
Participation bias
Ascertainment of vaccination status
Ascertainment of health outcome
Analysis conducted
Adjusted for these potential confounders
Period data collected
Study funder
Primary results regarding vaccine
Any risk factor findings
Comment
0.80 (0.73–0.86) Model 2: 0.84 (0.77–0.90)
Pneumococcal
< 65:Model 1: 0.83 (0.73–0.95) Model 2: 0.91 (0.79–1.05) ≥ 65:Model 1: 0.88 (0.83–0.93) Model 2: 0.97 (0.91–1.03)
Tanner et al. 2012, Case-control63
N=286;Location=Utah;Age=20.4 to 92.5;Setting=The University of Utah Voice Disorders Center
Swine flu
(Also assessed measles, mumps, and rubella separately - unsure if any of these are MMR)
Selected segment - University of Utah Voice Disorders Center
No details about dropping out over the course of the study, but study notes in the recruitment phase:
Of the 192 patients approached and invited to participate, 150 individualswith SD completed the study(cases)
Of the 160 patients approached and invited
Not reported
Self-report through questionnaire. Trained examiners administered the questionnaire to each participant and were periodically audited to ensure accuracy.
Voice disorder diagnosis was confirmed by a multidisciplinary team of professionals including a laryngologist and one of four speech-language pathologists. Diagnosis was assigned following a thorough evaluation including a detailed case history, auditory-perceptual evaluation, and videolaryngostroboscopy,
Logistic regression
Age, sex, race/ethnicity
Not reported The work was supported inpart by a University of Utah College of Health Researchand Creative Grant
Vacc v. Nonvacc:2.1 (0.9-5.0)
Don't Know v. Nonvacc:2.3 (1.3-4.1)
Not reported
C-18
Evidence Table 1. Postmarketing studies: AdultsAuthor, Year, Study Design
Population studied
Vaccines included
Selection Bias Attrition, non-response
Participation bias
Ascertainment of vaccination status
Ascertainment of health outcome
Analysis conducted
Adjusted for these potential confounders
Period data collected
Study funder
Primary results regarding vaccine
Any risk factor findings
Comment
to participate, 136 VC individuals completed the study (controls)
employing diagnostic criteria previously established and reported.
Ting et al. 2011, Retrospective matched cohort (each pair included 1 vaccinated and 1 non-vaccinated COPD patient)72
586 patients with moderate to severe COPD identified in COPD Registers of 6 general practices in North Derbyshire UK.Age range 37-89 (median 68)
influenza entire population of COPD patients in these 6-practices
n/a n/a medical record medical record (spirometry records)
McNemar's test
controlled for environmental factors (weather, prevalence of respiratory viral pathogens)
10/2005-12/2005
NR In the 14 days following vaccination, the control group had 21 COPD exacerbations cf. 11 in the vaccinated group (McNemar's p=0.11, not significant; OR 0.52 [95% CI 0.29, 1.14])
Study did NOT look at exacerbations by COPD stage or other risk factors.
Tseng et al. 2010, Prospective cohort74
N=84,170;Location=CA;Age=45-69 years;Setting=Kaiser Permanente Northern and Southern California health plans (California Men's Health Study)
Pneumococcal
Should be noted, participants who were vaccinated were significantly older than participants who were not vaccinated. Region, race/ethnicity, household income, education, andBMI also were associated significantly with vaccination status.
Study notes themean (SD) length of follow-up was 4.7 (1.36) years. The unvaccinated group had relatively shorter length of followup
Not discussed
Immunization records were tracked by the Kaiser Immunization Tracking System
Electronic health records
Cox proportional hazards regression
Propensity score was created: age, race/ethnicity, region (northern vs southern California Kaiser Permanente), household income, education,BMI, cigarette smoking, physical activity level, sedentary for more than 6.5 hours per day outside of work, alcohol
2002-2007 This study was funded by California Cancer Research Program and Kaiser Permanente.
Association of Pneumococcal Vaccination and Incidence of MI and Stroke
Acute MIAll men: 1.09 (0.98-1.21), p=0.13StrokeAll men: 1.14 (1.00-1.31), p=0.05
Association of Pneumococcal Vaccination and Incidence of MI and StrokeAge, y<65: 1.23 (1.08-1.40), p=0.001>=65: 0.89 (0.80-1.01), p=0.10High-risk groupsCurrent smokers: 1.11 (0.83-1.47),
C-19

Evidence Table 1. Postmarketing studies: AdultsAuthor, Year, Study Design
Population studied
Vaccines included
Selection Bias Attrition, non-response
Participation bias
Ascertainment of vaccination status
Ascertainment of health outcome
Analysis conducted
Adjusted for these potential confounders
Period data collected
Study funder
Primary results regarding vaccine
Any risk factor findings
Comment
consumption, number of influenza vaccines received, calorie intake, fat intake, fruit and vegetable consumption, history of diabetes, history of high blood pressure, history of high cholesterol, history of peripheral artery disease, history of other heart diseases, history of stroke, history of acute MI, and the log scale transformed number of outpatient visits during the 5 years before baseline. Cigarette smoking was modeled through smoking status
p=0.48Diabetes: 1.04 (0.87-1.24), p=0.51Hypertension: 1.10 (0.97-1.25), p=0.16
Low-risk group: 0.98 (0.35-2.73), p=0.97Influenza vaccine0: 1.10 (0.70-1.72), p=0.691-10: 1.10 (0.97-1.26), p=0.14>10: 1.00 (0.83-1.21), p=0.97
Tseng et al. 2012, Case-centered and Self-controlled case series85
N=193,083 recipients of zoster vaccine in 8 US MCOs;Age=50 and older;
Zoster VSD population - might be differences in case and exposure ascertainment across sites
Not discussed Not discussed
Medical records
Authors used computerized data to identify any adultwith a pre-specified event of interest or
Case-centered: logistic regression
SCCS: conditional
No additional confounders controlled for in models
1 January 2007 to 31 December 2008
Contract from the Centers for DiseaseControl and Prevention
Relative risk (RR) and 95% confidence interval (CI) of pre-specified adverse events within predefined risk windows following
Not reported
C-20
Evidence Table 1. Postmarketing studies: AdultsAuthor, Year, Study Design
Population studied
Vaccines included
Selection Bias Attrition, non-response
Participation bias
Ascertainment of vaccination status
Ascertainment of health outcome
Analysis conducted
Adjusted for these potential confounders
Period data collected
Study funder
Primary results regarding vaccine
Any risk factor findings
Comment
death Poisson regression
vaccination with a zoster vaccine
Case-centeredDay 1-14Stroke: 1.03 (0.83–1.28)Acute myocardial infarction: 1.17 (0.92–1.48)Cardiomyopathy: 0.73 (0.51–1.03) Heart failure: 0.76 (0.46–1.24) Meningitis, encephalitis and encephalopathy: 0.54 (0.19–1.52) Ramsey-Hunt syndromes and Bell’s palsy: 0.63 (0.29–1.38)
Day 15-28Stroke: 0.92 (0.73–1.16)Acute myocardial infarction: 1.04 (0.81–1.34) Acute Myocarditis: 8.98 (1.67–46.36)Cardiomyopathy: 1.11 (0.83–1.48) Heart failure: 1.08 (0.70–1.65) Meningitis, encephalitis and encephalopathy: 0.90 (0.40–2.05)
Day 29-42Stroke: 1.06 (0.85–1.31) Acute myocardial
C-21
Evidence Table 1. Postmarketing studies: AdultsAuthor, Year, Study Design
Population studied
Vaccines included
Selection Bias Attrition, non-response
Participation bias
Ascertainment of vaccination status
Ascertainment of health outcome
Analysis conducted
Adjusted for these potential confounders
Period data collected
Study funder
Primary results regarding vaccine
Any risk factor findings
Comment
infarction: 0.97 (0.75–1.26)Acute pericarditis: 1.04 (0.13–8.05)Acute Myocarditis: 17.18 (3.71–79.67) Cardiomyopathy: 1.00 (0.74–1.36)Heart failure: 0.95 (0.60–1.49) Meningitis, encephalitis and encephalopathy: 0.62 (0.23–1.69)
Day 1-42Stroke: 1.00 (0.87–1.15)Acute myocardial infarction: 1.07 (0.92–1.26)Acute pericarditis: 0.27 (0.03–2.22)Acute Myocarditis: 19.44 (3.58–105.68)Cardiomyopathy: 0.94 (0.77–1.14)Heart failure: 0.91 (0.68–1.21)Meningitis, encephalitis and encephalopathy: 0.66 (0.37–1.16)Mortality: 0.31 (0.23–0.40)
Day 1-7Cellulitis and infection: 1.30 (1.18–1.44)Allergic Reaction: 2.13 (1.87–2.40)
SCCS
C-22

Evidence Table 1. Postmarketing studies: AdultsAuthor, Year, Study Design
Population studied
Vaccines included
Selection Bias Attrition, non-response
Participation bias
Ascertainment of vaccination status
Ascertainment of health outcome
Analysis conducted
Adjusted for these potential confounders
Period data collected
Study funder
Primary results regarding vaccine
Any risk factor findings
Comment
Day 1-14Cerebrovascular diseases: 0.94 (0.70–1.28)Acute myocardial infarction: 1.22 (0.87–1.73)Cardiomyopathy: 0.70 (0.45–1.10) Heart failure: 0.77 (0.41–1.46) Meningitis, encephalitis and encephalopathy: 0.80 (0.21–2.98) Ramsey-Hunt syndromes and Bell’s palsy: 0.78 (0.29–2.09)
Day 15-28Cerebrovascular diseases: 1.03 (0.74–1.42) Acute myocardial infarction: 1.24 (0.85–1.79) Cardiomyopathy: 1.05 (0.69–1.59) Heart failure: 0.92 (0.51–1.63) Meningitis, encephalitis and encephalopathy: 0.86 (0.29–2.55)
Day 29-42Cerebrovascular diseases: 0.97 (0.71–1.30)Acute myocardial infarction: 0.97 (0.67–1.39)Acute pericarditis:
C-23
Evidence Table 1. Postmarketing studies: AdultsAuthor, Year, Study Design
Population studied
Vaccines included
Selection Bias Attrition, non-response
Participation bias
Ascertainment of vaccination status
Ascertainment of health outcome
Analysis conducted
Adjusted for these potential confounders
Period data collected
Study funder
Primary results regarding vaccine
Any risk factor findings
Comment
1.00 (0.06–15.99) Acute Myocarditis: 3.00 (0.31–28.84) Cardiomyopathy: 0.86 (0.57–1.29) Heart failure: 0.64 (0.36–1.16) Meningitis, encephalitis and encephalopathy: 0.80 (0.21–2.98)
Day 1-42Cerebrovascular diseases: 0.99 (0.83–1.19)Acute myocardial infarction: 1.05 (0.86–1.29)Acute pericarditis: 0.50 (0.05–5.51)Acute Myocarditis: 5.00 (0.58–42.80)Cardiomyopathy: 0.94 (0.73–1.20)Heart failure: 0.88 (0.61–1.25)Meningitis, encephalitis and encephalopathy: 0.78 (0.39–1.56)
Day 1-7Cellulitis and infection: 1.10 (0.95–1.26)Allergic Reaction: 2.32 (1.85–2.91)
Uno et al. 2012, Case-control145
N=413 (189 ASD cases, 224 controls);Location=Kanto area,
MMR, diphtheria–pertussis–tetanus vaccine (DPT); the
Selected segment - Kanto, Japan. Also, cases were patients of psycho-
89 of 1875 cases excluded because missing vaccine records.
Not reported
Study notes that "vaccination history...collected based on the MCH
Patients were diagnosed based on the (DSM-IV) and standardized criteria using the
Conditional logistic regression
Maternal hypertension, low Apgar score, obstetrical vacuum
Study doesn't note when researchers collected data, but the
A part of the study is the result of research grants
MMR: 1.10 (0.64–1.90), p=0.72
Maternal hypertension:4.19 (0.46–38.57), p=0.21
C-24

Evidence Table 1. Postmarketing studies: AdultsAuthor, Year, Study Design
Population studied
Vaccines included
Selection Bias Attrition, non-response
Participation bias
Ascertainment of vaccination status
Ascertainment of health outcome
Analysis conducted
Adjusted for these potential confounders
Period data collected
Study funder
Primary results regarding vaccine
Any risk factor findings
Comment
Japan;Age=22.6 years (mean);Setting=Cases were patients of the YokohamaPsycho-Developmental Clinic (YPDC). Controls were volunteers from area schools.
polio vaccine. Study did not specify whether DPT was acellular and did not specify whether polio was inactivated.
Only MMR was included in controlled analyses.
developmental clinic (may differ from cases that don't go to clinic)
Additional 3 excluded because received vaccines overseas. 1429 cases born before 3/84 or after 5/92, leaving 354 cases. 189 cases could be matched to a control.
handbook,which was routinely attached to each patient’s file, were examined." Study did not note exactly who did the examining, but I assume it was the researchers.
Diagnostic Interview for Social and Communication Disorder (DISCO). Another child psychiatrist or clinical psychologist conducted intellectual or developmental tests, such as the Psycho-Educational Profile-Revised and Wechsler Intelligence Scale for Children-Third Edition. After the interview and testing, the diagnosis was made by the team according to the DSM-IV criteria.
extraction or forceps delivery
(Table 4 displays results with control variables. Tables 1-3 display crude ORs. Authors only controlled for those risk factors that displayed high crude ORs.)
Cases/controls matched by sex and year of birth
universe of eligible participants included patients visiting the clinic between April 1997 (when the clinic opened) and March 2011.
from the Ministry of Health, Labor and Welfare of Japan, and “Integrated researchon neuropsychiatric disorders” carried out under the Strategic Research Program for Brain Sciences by the Ministry of Education, Culture, Sports, Science and Technology of Japan
Low Apgar score:2.06 (0.18–22.12), p=0.57
Obstetrical vacuum extraction or forcepsdelivery:0.98 (0.50–1.92), p=0.96
Vila-Corcoles et al. 2012, Prospective cohort76
N=27,204 (8,981 vaccinated, 18,223 unvaccinated);Location=Spain;Age=71.7 (mean at study start);Setting=nine primary care centers in the
Pneumococcal (PPV23)
Paper did not provide details on recruitment - referred reader to another paper
None discussed
Not discussed
Review of the primary care centers’ electronic clinicalrecords
Computerized clinical record system
Outcomes identified bases on ICD-9 codes with physician verification based on medical record review
Cox proportional hazards models
The following variables were considered in all the initial models: age, sex, number of outpatient visits to family physician in 12-months before study start, influenza vaccination in prior autumn, history of
Cohort members were followed from the start ofthe study (December 1, 2008) until the occurrence of any event, change in pneumococc
This work was supported by a grant from the “Fondo de Investigación Sanitaria” of the Instituto de Salud Carlos III [FIS 09/00043]
Multivariate hazard ratio (95% CI)CAP: 0.85 (0.62-1.15), p=0.287AMI: 0.83 (0.56-1.22), p=0.347Ischemic Stroke: 0.65 (0.42-0.99), p=0.048Death from any cause: 0.88 (0.75-1.03), p=0.12
Not reported
C-25

Evidence Table 1. Postmarketing studies: AdultsAuthor, Year, Study Design
Population studied
Vaccines included
Selection Bias Attrition, non-response
Participation bias
Ascertainment of vaccination status
Ascertainment of health outcome
Analysis conducted
Adjusted for these potential confounders
Period data collected
Study funder
Primary results regarding vaccine
Any risk factor findings
Comment
HealthRegion of Tarragona (a mixed residential-industrialurban area in the Mediterranean coast of Catalonia, Spain)
coronary artery disease, history of stroke, history of chronic heart disease, chronic pulmonary disease, hypertension, hypercholesterolemia, obesity, diabetes mellitus, smoking status, alcoholism, chronic severe liver disease, chronic severe nephropathy, cancer, dementia and nursing-home residence. Age, sex and influenza vaccine status were judged epidemiologically relevant variables, being included in all the final models.Final Models: CAP: Adjusted for age, sex, number of outpatientvisits in prior year, influenza vaccination in
al vaccination status, disenrollment from the primary care center, death, or until the end of first 12-month follow-up (November 30, 2009).
of the Spanish Health Ministry
C-26

Evidence Table 1. Postmarketing studies: AdultsAuthor, Year, Study Design
Population studied
Vaccines included
Selection Bias Attrition, non-response
Participation bias
Ascertainment of vaccination status
Ascertainment of health outcome
Analysis conducted
Adjusted for these potential confounders
Period data collected
Study funder
Primary results regarding vaccine
Any risk factor findings
Comment
prior year, chronic pulmonary disease, chronic heart disease, smoking and nursing-home resident AMI: Adjusted for age, sex, number of outpatient visits in prior year, influenza vaccination in prior year, history of coronary artery disease, chronic heart disease, diabetes mellitus, hypercholesterolemia, smoking (confounder) and nursing-home resident Ischemic Heart Disease: Adjusted for age, sex, number of outpatient visits in prior year, influenza vaccination in prior year, history of coronary artery disease, history of stroke,
C-27
Evidence Table 1. Postmarketing studies: AdultsAuthor, Year, Study Design
Population studied
Vaccines included
Selection Bias Attrition, non-response
Participation bias
Ascertainment of vaccination status
Ascertainment of health outcome
Analysis conducted
Adjusted for these potential confounders
Period data collected
Study funder
Primary results regarding vaccine
Any risk factor findings
Comment
smoking (confounder) and nursing-home resident Death from any cause: Adjusted for age, sex, number of outpatient visits in prior year, influenza vaccinationin prior year, chronic pulmonary disease, chronic heart disease, diabetesmellitus, cancer, chronic nephropathy, dementia, hypertension, hypercholesterolemia, obesity, smoking, and nursing home-resident
Yu et al. 2007, Case-control93
N=1,875 (355 Graves' disease cases, 418 Hashimoto's thyroiditis cases, 1,102 controls);Location=Vaccine Safety Datalink
Hepatitis B vaccine, influenza, MMR, Hepatitis A, polio
Potential for those with disease to be more likely to receive vaccination or more likely to be assessed for vaccination. Also possible recall bias and exposure misclassification
None Not discussed
Vaccine information was collected from administrative immunization records, chart review, and telephone interviews with study subjects
Medical record review. Identified cases of Graves’ disease and Hashimoto’s thyroiditis on the basis of International Classification of Diseases, Ninth Revision(ICD-9) codes
Logistic regression
Controls were frequency-matched to cases by birth year, sex, and study site (HMO)
All models adjusted for frequency-matching variables (age
January 1, 1999 through June 30, 2002
ID Biomedical, Chiron Therapeutics and Vaccines, and Sanofi Pasteur; Studysupported by the Vaccine Safety
OR (95% CI) for Graves’ diseaseMain analysisHepatitis B: 0.90 (0.62–1.32)Influenza: 1.07 (0.80–1.42)MMR: 0.59 (0.29–1.20)Hepatitis A: 0.70 (0.43–1.13)Polio: 1.29 (0.76–2.17)
Not reported
C-28

Evidence Table 1. Postmarketing studies: AdultsAuthor, Year, Study Design
Population studied
Vaccines included
Selection Bias Attrition, non-response
Participation bias
Ascertainment of vaccination status
Ascertainment of health outcome
Analysis conducted
Adjusted for these potential confounders
Period data collected
Study funder
Primary results regarding vaccine
Any risk factor findings
Comment
Project:Group Health Cooperative, Seattle, WA; NorthwestKaiser Permanente, Portland, OR; and Kaiser Permanente of Northern California, Oakland, CA;Age=18–69 years;Setting=Three health maintenance organizations (HMOs)
. Authors noted that case groups may have included some subjects with thyroid conditions other thanGraves’ disease or Hashimoto’s thyroiditis.
for thyroid disease, associated withinpatient and outpatient medical encounters that were recorded in HMO administrative data systems.
groups, sex, site, and index year), personal and family history of autoimmune disease, smoking status, race, and education
Datalink contractwith America’s Health Insurance Plans, funded by the CDC
OR (95% CI) for Hashimoto’s thyroiditisMain analysisHepatitis B: 1.23 (0.87–1.73)Influenza: 1.15 (0.89–1.48)MMR: 1.50 (0.79–2.86)Hepatitis A: 0.97 (0.64–1.46)Polio: 1.17 (0.73–1.86)
Zhang et al. 2012, Retrospective cohort84
N=463,541(4,026 with ankylosing spondylitis, 66,751 with inflammatory bowel disease, 11,030 with psoriatic arthritis, 89,565 with psoriasis, and 292,169 with RA);Location=US;Age=74 years (mean at study
Zoster Herpes
Could not control for differences between those who received vaccinations and those who did not (e.g., those receiving vaccines may be a healthier population).
Misclassification of medication exposure
Actual vaccine administrationdates were unknown for 59% of patients, which resulted in the exclusionof these patients from safety analyses potentially introducing bias
Did not discuss
Database review
Database review (administrative claims fromphysicians or hospitalizations)
Proportional hazard regression
Sex, race, immune-mediated disease, time varying concurrent medications, andtime-varying health care utilization (hospitalization and physician visits)
January 1, 2006, through December 31, 2009
Agency for Healthcare Research and Quality
HR (95% CI) for Herpes Zoster Incidence
Using ICD-9-CM diagnosis code+pharmacy claim definition for HZ case (Def 1)HZ vaccination: 0.61 (0.52-0.71) Using ICD-9-CM diagnosis code only for HZ case (Def 2)HZ vaccination: 0.67 (0.59-0.75)
SexMen [Reference]Women Def 1: 1.22 (1.17-1.28) Def 2: 1.21 (1.17-1.26)
RaceWhite [Reference] Black Def 1: 0.67 (0.62-0.73) Def 2: 0.69 (0.64-0.74)Other Def 1: 0.89 (0.81-0.97)
C-29

Evidence Table 1. Postmarketing studies: AdultsAuthor, Year, Study Design
Population studied
Vaccines included
Selection Bias Attrition, non-response
Participation bias
Ascertainment of vaccination status
Ascertainment of health outcome
Analysis conducted
Adjusted for these potential confounders
Period data collected
Study funder
Primary results regarding vaccine
Any risk factor findings
Comment
start);Setting=US Medicare beneficiaries
Def 2: 0.89 (0.83-0.95)
Immune-mediated diseaseRheumatoid arthritis [Reference] Ankylosing spondylitis Def 1: 0.98 (0.77-1.25) Def 2: 0.94 (0.77-1.13)Inflammatory bowel diseases Def 1: 1.03 (0.97-1.10) Def 2: 1.02 (0.97-1.07)
Psoriatic arthritis Def 1: 0.92 (0.80-1.05) Def 2: 0.92 (0.83-1.02)
Psoriasis Def 1: 0.99 (0.93-1.05) Def 2: 0.97 (0.93-1.02)
Hospitalized in the previous 6 moNo [Reference] Yes Def 1: 1.00
C-30
Evidence Table 1. Postmarketing studies: AdultsAuthor, Year, Study Design
Population studied
Vaccines included
Selection Bias Attrition, non-response
Participation bias
Ascertainment of vaccination status
Ascertainment of health outcome
Analysis conducted
Adjusted for these potential confounders
Period data collected
Study funder
Primary results regarding vaccine
Any risk factor findings
Comment
(0.95-1.05) Def 2: 1.25 (1.20-1.29)No. of physician visits in the previous 6 moDef 1: 1.04 (1.04-1.04) Def 2: 1.04 (1.04-1.04)DMARDs, exclusive groupsNon-biologic DMARDs [Reference] Anti-TNF biologics Def 1: 1.15 (1.08-1.23) Def 2: 1.10 (1.04-1.16)
Non-TNF biologics Def 1: 0.99 (0.86-1.13) Def 2: 1.05 (0.94-1.16)
None Def 1: 0.84 (0.80-0.88) Def 2: 0.86 (0.82-0.89)
Oral glucocorticoid useNo [Reference]
C-31

Evidence Table 1. Postmarketing studies: AdultsAuthor, Year, Study Design
Population studied
Vaccines included
Selection Bias Attrition, non-response
Participation bias
Ascertainment of vaccination status
Ascertainment of health outcome
Analysis conducted
Adjusted for these potential confounders
Period data collected
Study funder
Primary results regarding vaccine
Any risk factor findings
Comment
Yes Def 1: 1.79 (1.71-1.86) Def 2: 1.69 (1.64-1.75)
C-32