temperature trends in south africa: … · south african weather service, private bag x097,...
TRANSCRIPT
INTERNATIONAL JOURNAL OF CLIMATOLOGY
Int. J. Climatol. 24: 1929–1945 (2004)
Published online in Wiley InterScience (www.interscience.wiley.com). DOI: 10.1002/joc.1096
TEMPERATURE TRENDS IN SOUTH AFRICA: 1960–2003
A. C. KRUGER* and S. SHONGWESouth African Weather Service, Private Bag X097, Pretoria 0001, South Africa
Received 7 March 2002Revised 23 July 2004Accepted 26 July 2004
ABSTRACT
Time series of South African temperatures were investigated for temporal and spatial trends for the period 1960 to 2003.For this purpose a total of 26 climate stations were utilized, with each having sufficient data available and not havingundergone major moves or changes in exposure that would influence the homogeneity of their data series. The vastmajority, a total of 23 stations, showed positive trends in their annual mean maximum temperature series, 13 of themsignificant, with trends higher for central stations than those closer to the coast. Annual mean minimum temperaturesshowed 21 stations having positive trends, with 18 significant. Stations not showing significantly positive trends in annualmean minimum temperatures were mostly situated in the central interior. The annual average temperature data series of24 of the stations showed positive trends, with 18 of them significant. Trends of mean seasonal temperature showed thattemperature trends are not consistent throughout the year, with the average trend for autumn showing a maximum andspring a minimum. Monthly trends of average annual temperatures showed large differences in trend between stations,and for each station between months, but similar tendencies in trend between months were found to exist for stations closeby and also for groups of stations on a regional basis. Trends in diurnal temperature range are almost equally dividedbetween positive and negative, with the positive trends in the central interior mainly being caused by large positivetrends in maximum temperature. It is also shown that, in general, days and nights with relatively high temperatureshave increased, while days and nights with relatively low temperatures have decreased. The effects of urbanization ontemperature trends are investigated, and the conclusion is that most stations regarded as urban stations are still usefulfor trend analysis; being situated on the outskirts of cities they are, therefore, not substantially influenced by the urbanheat island. El Nino and La Nina events do not seem to play a significant role in the increasing temperatures observed.Copyright 2004 Royal Meteorological Society.
KEY WORDS: South Africa; linear regression; Student’s t test; temperature trends; extremes; El Nino; La Nina; warming
1. INTRODUCTION
The purpose of this paper is to inform on temperature trends in South Africa for the period 1960 to 2003,a period for which reliable temperature data are available. The results presented give an indication of thepresent state of South African temperatures on a regional basis in relation to the past four decades.
Other similar notable studies conducted in the southern African region, as well as the Southern Hemisphere,are from Collins et al. (2000), King’uyu et al. (2000), Salinger and Mullan (1999), Hoffmann et al. (1997),Rosenbluoeth et al. (1997), Unganai (1997), Zheng et al. (1997), Torok and Nicholls (1996), Plummer(1996) and Hughes and Balling (1996). The key results of some of the studies above, done for Africa inparticular, are as follows. Muhlenbruch-Tegen (1992) evaluated long-term surface temperature variations inSouth Africa for the period 1940 to 1989. For this period no real evidence has been found for overall changesin mean monthly temperatures, and only a small number of stations showed a significant increase in meanannual temperature, all of them situated along the coast. However, trends of seasonal mean temperatureshowed clear and significant changes, which will be mentioned later for comparison with the results of this
* Correspondence to: A. C. Kruger, South African Weather Service, Private Bag X097, Pretoria 0001, South Africa;e-mail: [email protected]
Copyright 2004 Royal Meteorological Society
1930 A. C. KRUGER AND S. SHONGWE
study. Hughes and Balling (1995) examined the maximum and minimum temperature trends for South Africafor the period 1960 to 1990, but also compared the different results obtained for urban and non-urban stations.Maximum temperatures increased by 0.11 °C per decade and 0.12 °C per decade on average for non-urbanand urban stations respectively, but for minimum temperatures a non-significant trend of 0.07 °C per decadeon average for non-urban stations and a significant trend of 0.34 °C per decade for urban stations weredetermined. Their results will be compared with those found in this study, where the effect of urbanization ontemperature trends is examined, as it is important to make an assessment of the severity of urban contaminationof climate data, especially when assessments of the historical variability and changes of climate are made.King’uyu et al. (2000) investigated trends in mean surface minimum and maximum air temperatures overeastern Africa, from the Sudan southwards to include Botswana, Zimbabwe and Mozambique, for 71 stationsfor the period 1939 to 1992. Large spatial and temporal variations were found, mostly depending on whetherthe station is close to a large water feature. The results for the northern part of the study showed less spatialvariability and generally indicate night-time warming and daytime cooling. The southern parts showed mixedresults, with the Mozambique Channel even showing general cooling. Unganai (1997) investigated surfacetemperature variations over Zimbabwe, one of South Africa’s northern neighbours, for the period 1897 to1993. At national level, maximum temperatures showed a warming trend during all seasons studied, whereasminimum temperatures either showed no trend or slight cooling. The general change in temperature wassubsequently not attributed to global warming due to an increase in greenhouse gases, because of the absenceof significant increases in night-time temperatures. Notably, two warm phases were identified: the first wasfrom the mid-1930s to the late 1940s, and the second was from the early 1980s to the end of the period ofstudy. All of the above studies, however, do not include the mid and late 1990s, which showed in general acontinued upward trend in global temperatures. Therefore, it is possible that, by including the 1990s and theearly part of this century, markedly different results in trends than those for the previous studies of Africa,and in particular South Africa, might be obtained.
With global warming a reality (Datsenko and Sonechkin, 1999; Jones et al., 1999; Peterson et al., 1999;Easterling et al., 2000), whether caused by natural variability or anthropogenically induced (Tett et al., 1999;Stott et al., 2001), it is important to be informed and regularly updated on observed regional temperaturetrends. These results can aid with verification of climate model studies, which in turn assist with contingencyplanning for agriculture and water supply, for example, for the future.
2. DATA
Quality-controlled daily maximum and minimum temperature data for stations with the minimum period ofdata available, i.e. 1960 to 2003, were extracted from the South African Weather Service climate database.
To make sure that trend results are accurate for a location, data sets should be as complete as possible. Acondition for a climate station to be included in the study, therefore, was to have (for the determination of alltrends) at least 90% of data available for the period 1960 to 2003. If gaps occur in a data set for a specificclimate station, it also should not be concentrated only in one part of its time series, e.g. at the beginning orend, but more evenly dispersed.
Data series of climate stations were also compared graphically with surrounding stations where possible,to check for visible outliers. Where any doubt existed as to the correctness of temperature values, they weredeleted before analysis.
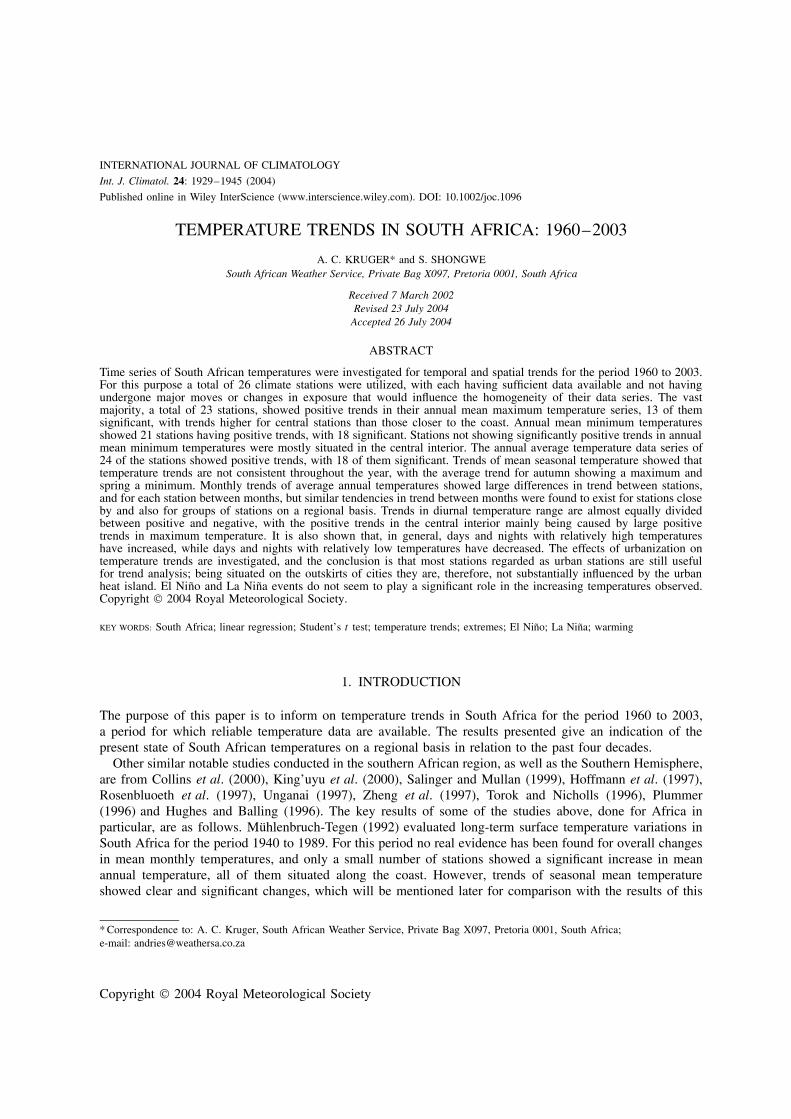
The metadata of each station were then scrutinized for possible moves and changes in exposure ofinstrumentation. After the above-mentioned exercises, a total of 26 climate stations remained that hadsufficiently complete data sets, and which were deemed not to have moved substantially to influence thehomogeneity of their time series. The positions of these climate stations in South Africa are shown inFigure 1. There is some overlap of stations with those used in previous studies, e.g. Muhlenbruch-Tegen(1992) and Hughes and Balling (1996), but some stations were omitted because of gaps in their time series,or after inspection of their metadata.
Copyright 2004 Royal Meteorological Society Int. J. Climatol. 24: 1929–1945 (2004)
SOUTH AFRICAN TEMPERATURE TRENDS 1931
Figure 1. Locations of the 26 stations in South Africa used in the study, with names of provinces in italics
3. ANALYSES AND RESULTS
Analyses were performed over the period 1960 to 2003, as temperature data before this period are notsufficiently quality controlled. Linear trends were determined for maximum, minimum and average annualmean temperatures, seasonal mean temperatures, monthly mean temperatures and annual means of the diurnalrange of temperatures. Also, similar to the approach followed by Collins et al. (2000), trends of the annualfrequencies and runs of days and nights with maximum and minimum temperatures respectively in certaintemperature categories were determined. The effect of urbanization on temperature trends was investigatedfor urban stations by comparing trends with non-urban stations close by, where possible. Different sub-periods from 1960 to 2003 were compared to examine whether there was any change in temperature trendsthroughout the period of investigation. The possible influence of El Nino and La Nina events on temperaturetrends was also investigated for those stations that we know are in the part of South Africa in which climateis significantly affected by these events.
The correlation co-efficients of all trends were tested for significance by a two-sided t-test, and wheretrends are indicated to be significant in the discussions of results they are at the 5% level.
In sections of results where analyses do not only comprise determinations of linear trend, additional analysismethods are discussed in detail.
3.1. Trends in mean annual maximum, minimum and average temperature
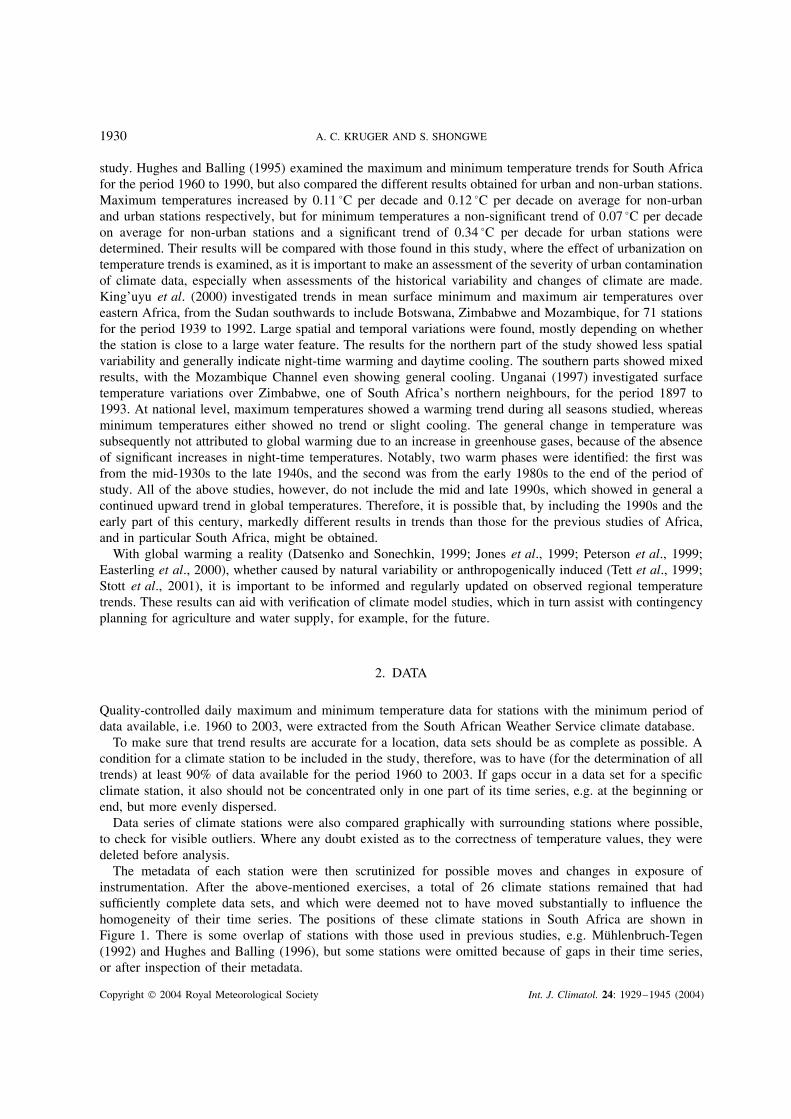
Trends calculated for the mean annual maximum temperatures of the 26 stations used in the study are shownin Figure 2. A total of 23 out of 26 stations show positive trends, with 13 of them significant. Spatially, stationswith significant trends in mean annual maximum temperature are mostly close to the coast, with the exceptionof Bloemfontein, Polokwane, Upington and Vanwyksvlei. However, trends seem to be higher for these centralstations than for those closer to the coast.
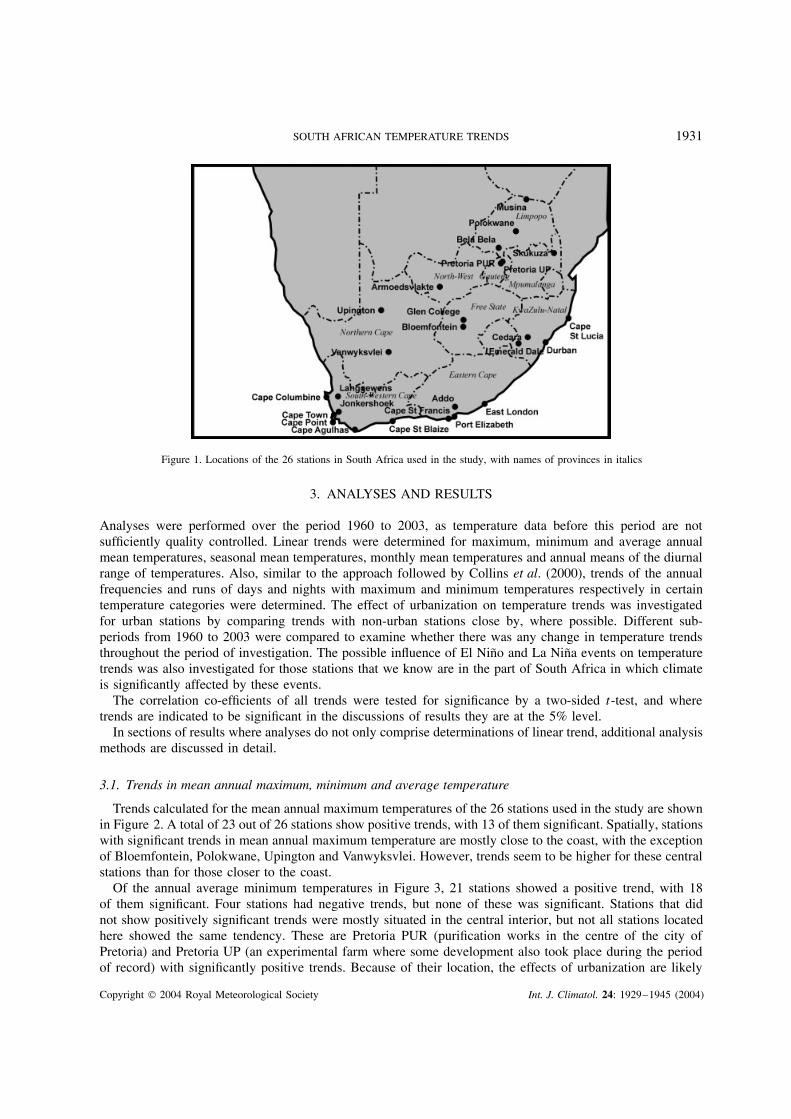
Of the annual average minimum temperatures in Figure 3, 21 stations showed a positive trend, with 18of them significant. Four stations had negative trends, but none of these was significant. Stations that didnot show positively significant trends were mostly situated in the central interior, but not all stations locatedhere showed the same tendency. These are Pretoria PUR (purification works in the centre of the city ofPretoria) and Pretoria UP (an experimental farm where some development also took place during the periodof record) with significantly positive trends. Because of their location, the effects of urbanization are likely
Copyright 2004 Royal Meteorological Society Int. J. Climatol. 24: 1929–1945 (2004)
1932 A. C. KRUGER AND S. SHONGWE
-0.2
-0.1
0
0.1
0.2
0.3
0.4
0.5
Cap
e C
olum
bine
*C
ape
Tow
n*C
ape
Poi
nt*
Jonk
ersh
oek
Cap
e A
gulh
as*
Cap
e S
t. B
laiz
e*C
ape
St.
Fran
cis
Por
t Eliz
abet
h*E
ast L
ondo
n*D
urba
n*C
ape
St.
Luci
aLa
ngge
wen
sU
ping
ton*
Van
wyk
svle
i*A
ddo*
Arm
oeds
vlak
teB
loem
font
ein*
Gle
n C
olle
geC
edar
aE
mer
ald
Dal
eP
reto
ria P
UR
Pre
toria
UP
Bel
a B
ela
Pol
okw
ane*
Mus
ina
Sku
kuza
Climate Station
°C/d
ecad
e
Figure 2. Trend (°C/decade) in annual mean maximum temperature for the period 1960–2003 (asterisk indicates significant trend at the5% level)
-0.2
-0.1
0
0.1
0.2
0.3
0.4
0.5
°C/d
ecad
e
Cap
e C
olum
bine
*C
ape
Tow
n*C
ape
Poi
nt*
Jonk
ersh
oek*
Cap
e A
gulh
as*
Cap
e S
t. B
laiz
eC
ape
St.
Fran
cis*
Por
t Eliz
abet
hE
ast L
ondo
n*D
urba
n*C
ape
St.
Luci
a*La
ngge
wen
s*U
ping
ton*
Van
wyk
svle
iA
ddo*
Arm
oeds
vlak
teB
loem
font
ein
Gle
n C
olle
geC
edar
a*E
mer
ald
Dal
e*P
reto
ria P
UR
*P
reto
ria U
P*
Bel
a B
ela
Pol
okw
ane
Mus
ina*
Sku
kuza
*
Climate Station
Figure 3. Trend (°C/decade) in annual mean minimum temperature for the period 1960–2003 (asterisk indicates significant trend at the5% level)
to be reflected in the temperature trends of these stations, especially the Pretoria PUR, but this is discussedmore fully in Section 3.5.
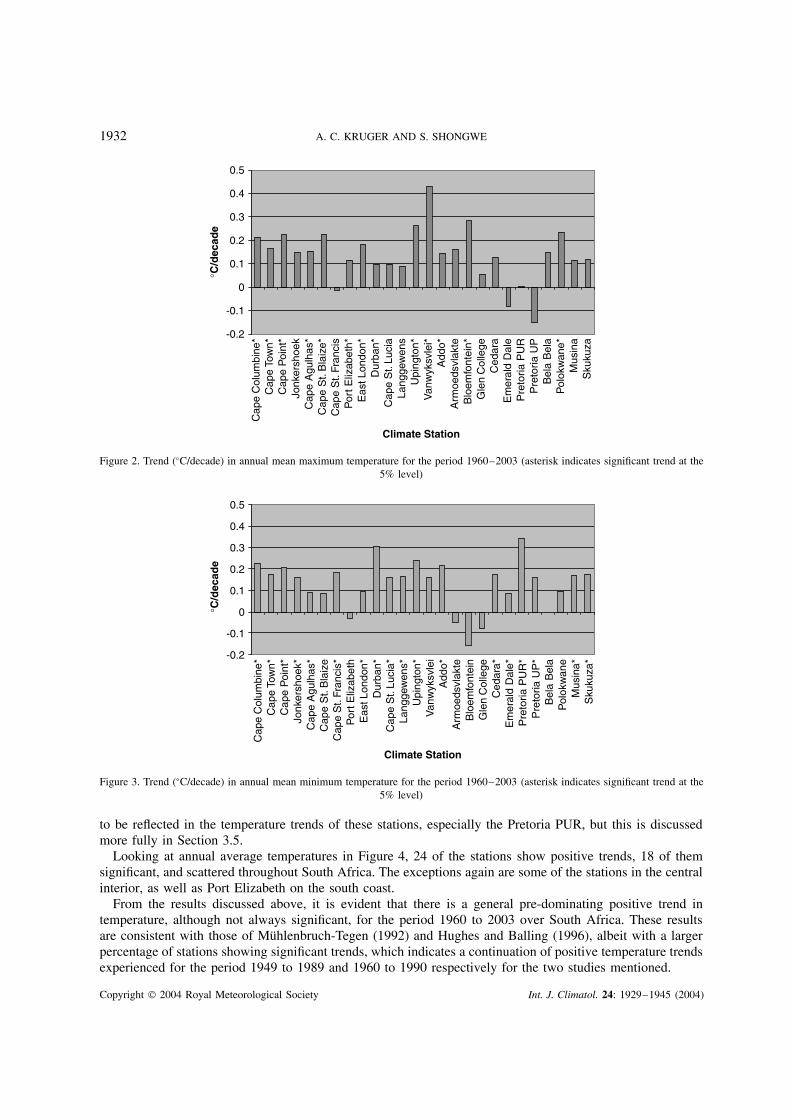
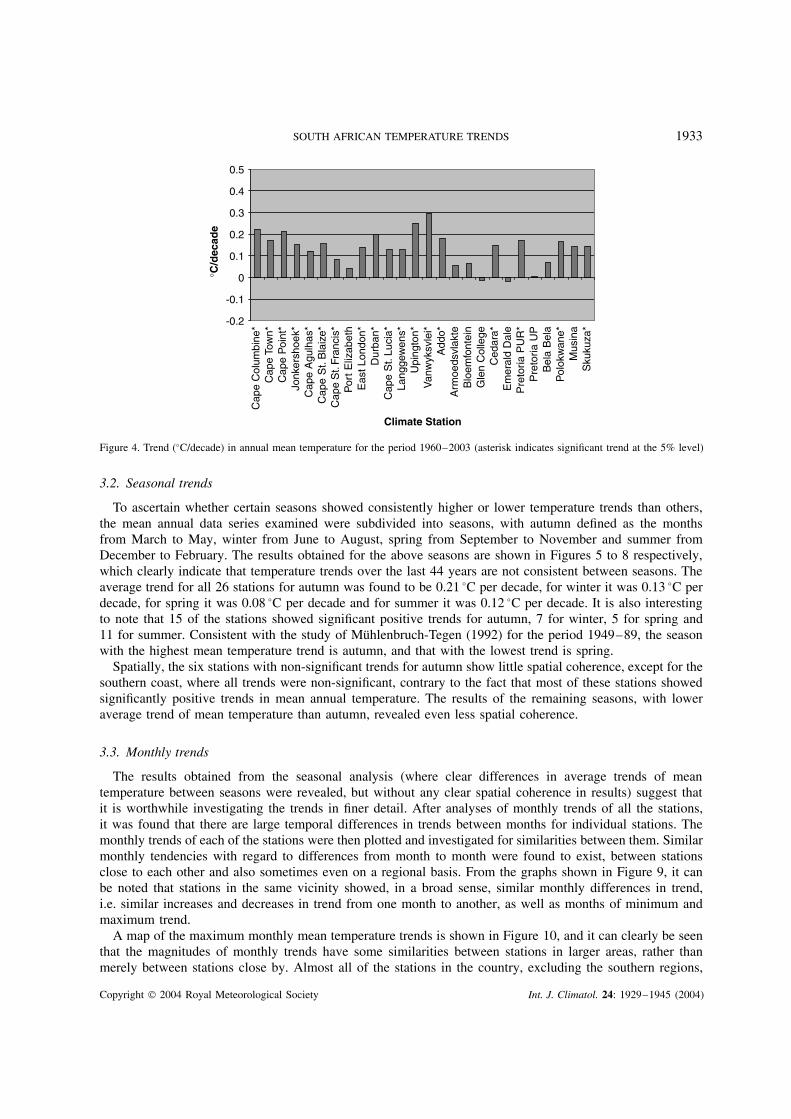
Looking at annual average temperatures in Figure 4, 24 of the stations show positive trends, 18 of themsignificant, and scattered throughout South Africa. The exceptions again are some of the stations in the centralinterior, as well as Port Elizabeth on the south coast.
From the results discussed above, it is evident that there is a general pre-dominating positive trend intemperature, although not always significant, for the period 1960 to 2003 over South Africa. These resultsare consistent with those of Muhlenbruch-Tegen (1992) and Hughes and Balling (1996), albeit with a largerpercentage of stations showing significant trends, which indicates a continuation of positive temperature trendsexperienced for the period 1949 to 1989 and 1960 to 1990 respectively for the two studies mentioned.
Copyright 2004 Royal Meteorological Society Int. J. Climatol. 24: 1929–1945 (2004)
SOUTH AFRICAN TEMPERATURE TRENDS 1933
Cap
e C
olum
bine
*C
ape
Tow
n*C
ape
Poi
nt*
Jonk
ersh
oek*
Cap
e A
gulh
as*
Cap
e S
t. B
laiz
e*C
ape
St.
Fran
cis*
Por
t Eliz
abet
hE
ast L
ondo
n*D
urba
n*C
ape
St.
Luci
a*La
ngge
wen
s*U
ping
ton*
Van
wyk
svle
i*A
ddo*
Arm
oeds
vlak
teB
loem
font
ein
Gle
n C
olle
geC
edar
a*E
mer
ald
Dal
eP
reto
ria P
UR
*P
reto
ria U
PB
ela
Bel
aP
olok
wan
e*M
usin
aS
kuku
za*
Climate Station
-0.2
-0.1
0
0.1
0.2
0.3
0.4
0.5
°C/d
ecad
e
Figure 4. Trend (°C/decade) in annual mean temperature for the period 1960–2003 (asterisk indicates significant trend at the 5% level)
3.2. Seasonal trends
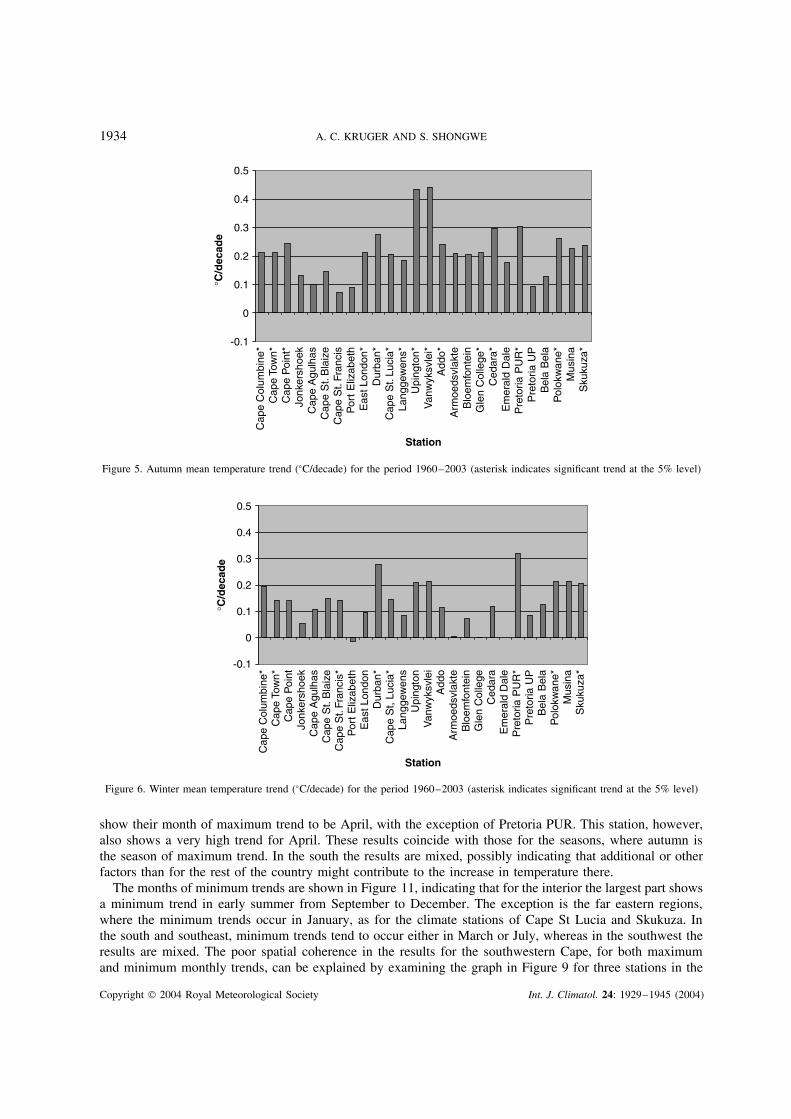
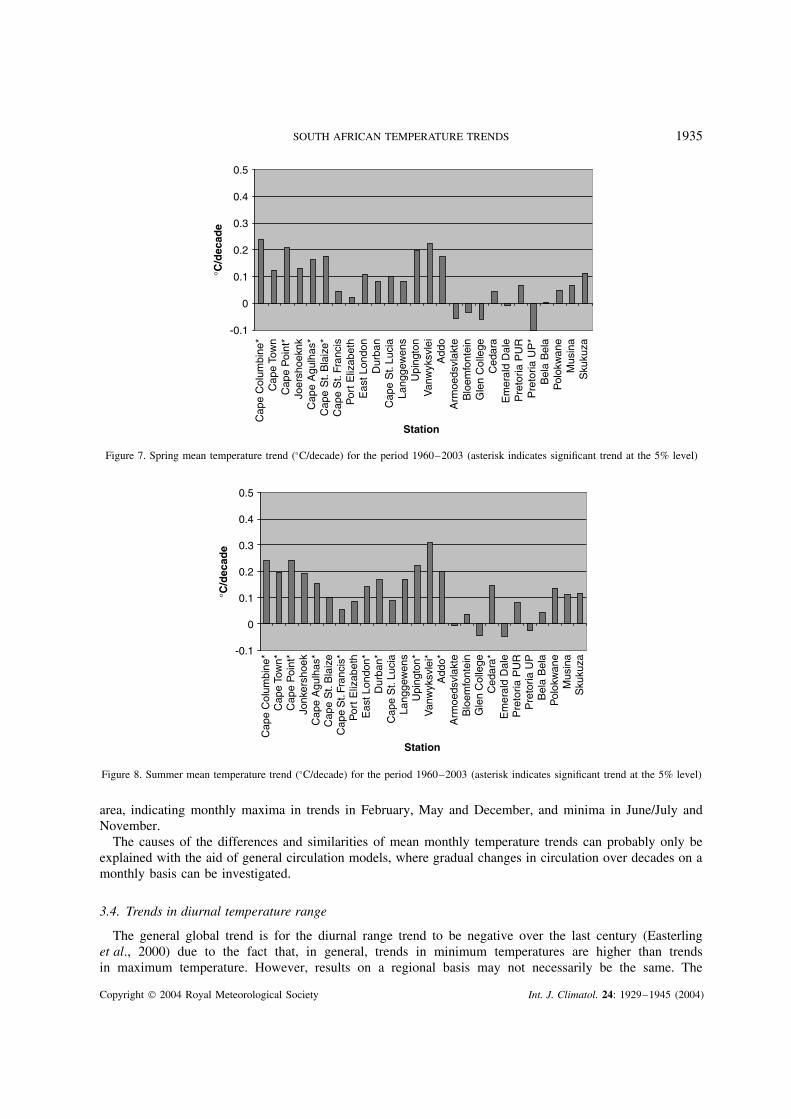
To ascertain whether certain seasons showed consistently higher or lower temperature trends than others,the mean annual data series examined were subdivided into seasons, with autumn defined as the monthsfrom March to May, winter from June to August, spring from September to November and summer fromDecember to February. The results obtained for the above seasons are shown in Figures 5 to 8 respectively,which clearly indicate that temperature trends over the last 44 years are not consistent between seasons. Theaverage trend for all 26 stations for autumn was found to be 0.21 °C per decade, for winter it was 0.13 °C perdecade, for spring it was 0.08 °C per decade and for summer it was 0.12 °C per decade. It is also interestingto note that 15 of the stations showed significant positive trends for autumn, 7 for winter, 5 for spring and11 for summer. Consistent with the study of Muhlenbruch-Tegen (1992) for the period 1949–89, the seasonwith the highest mean temperature trend is autumn, and that with the lowest trend is spring.
Spatially, the six stations with non-significant trends for autumn show little spatial coherence, except for thesouthern coast, where all trends were non-significant, contrary to the fact that most of these stations showedsignificantly positive trends in mean annual temperature. The results of the remaining seasons, with loweraverage trend of mean temperature than autumn, revealed even less spatial coherence.
3.3. Monthly trends
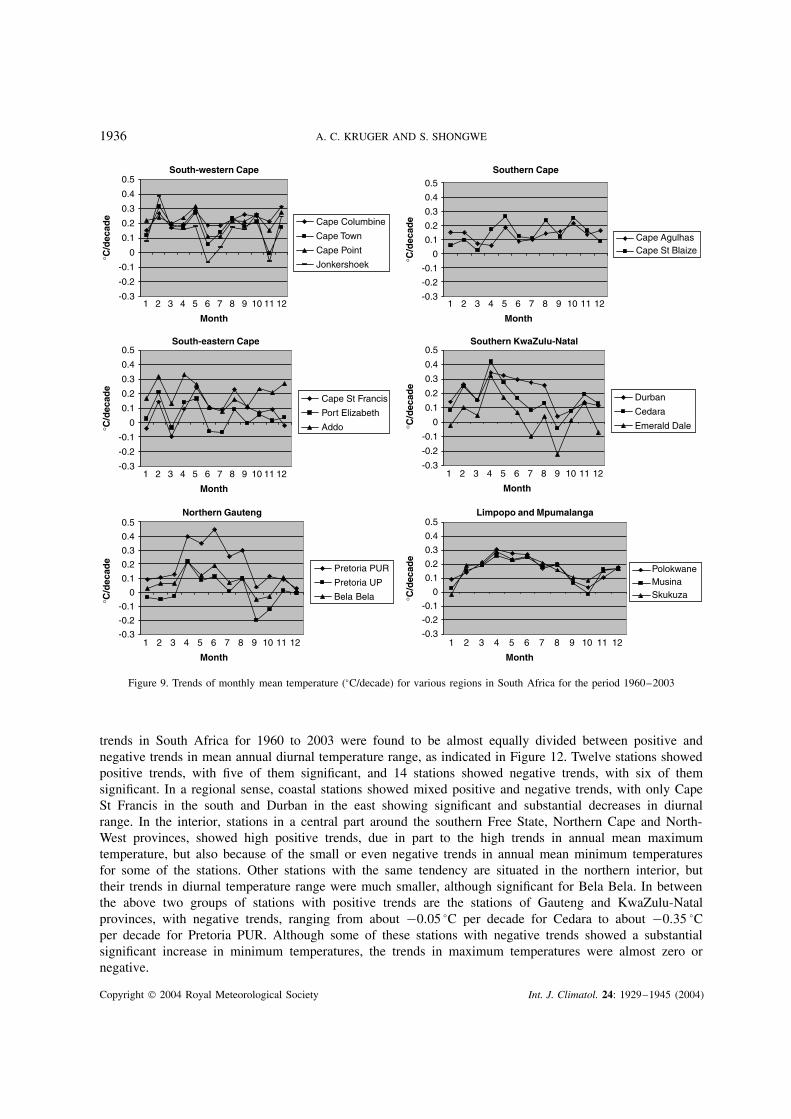
The results obtained from the seasonal analysis (where clear differences in average trends of meantemperature between seasons were revealed, but without any clear spatial coherence in results) suggest thatit is worthwhile investigating the trends in finer detail. After analyses of monthly trends of all the stations,it was found that there are large temporal differences in trends between months for individual stations. Themonthly trends of each of the stations were then plotted and investigated for similarities between them. Similarmonthly tendencies with regard to differences from month to month were found to exist, between stationsclose to each other and also sometimes even on a regional basis. From the graphs shown in Figure 9, it canbe noted that stations in the same vicinity showed, in a broad sense, similar monthly differences in trend,i.e. similar increases and decreases in trend from one month to another, as well as months of minimum andmaximum trend.
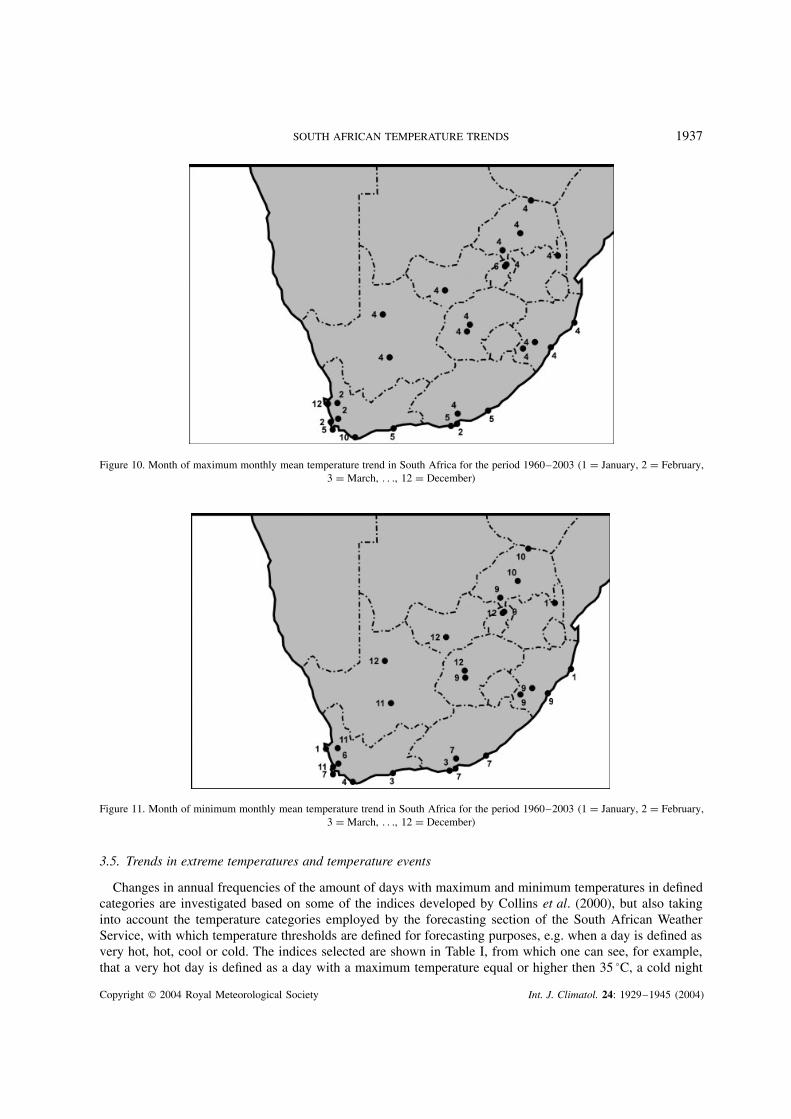
A map of the maximum monthly mean temperature trends is shown in Figure 10, and it can clearly be seenthat the magnitudes of monthly trends have some similarities between stations in larger areas, rather thanmerely between stations close by. Almost all of the stations in the country, excluding the southern regions,
Copyright 2004 Royal Meteorological Society Int. J. Climatol. 24: 1929–1945 (2004)
1934 A. C. KRUGER AND S. SHONGWE
Cap
e C
olum
bine
*C
ape
Tow
n*C
ape
Poi
nt*
Jonk
ersh
oek
Cap
e A
gulh
asC
ape
St.
Bla
ize
Cap
e S
t. Fr
anci
sP
ort
Eliz
abet
hE
ast L
ondo
n*D
urba
n*C
ape
St.
Luci
a*La
ngge
wen
s*U
ping
ton*
Van
wyk
svle
i*A
ddo*
Arm
oeds
vlak
teB
loem
font
ein
Gle
n C
olle
ge*
Ced
ara*
Em
eral
d D
ale
Pre
toria
PU
R*
Pre
toria
UP
Bel
a B
ela
Pol
okw
ane*
Mus
ina
Sku
kuza
*
Station
-0.1
0
0.1
0.2
0.3
0.4
0.5
°C/d
ecad
e
Figure 5. Autumn mean temperature trend (°C/decade) for the period 1960–2003 (asterisk indicates significant trend at the 5% level)
Cap
e C
olum
bine
*C
ape
Tow
n*C
ape
Poi
ntJo
nker
shoe
kC
ape
Agu
lhas
Cap
e S
t. B
laiz
eC
ape
St.
Fran
cis*
Por
t Eliz
abet
hE
ast L
ondo
nD
urba
n*C
ape
St,
Luci
a*La
ngge
wen
sU
ping
ton
Van
wyk
svle
iA
ddo
Arm
oeds
vlak
teB
loem
font
ein
Gle
n C
olle
geC
edar
aE
mer
ald
Dal
eP
reto
ria P
UR
*P
reto
ria U
PB
ela
Bel
aP
olok
wan
e*M
usin
aS
kuku
za*
-0.1
0
0.1
0.2
0.3
0.4
0.5
°C/d
ecad
e
Station
Figure 6. Winter mean temperature trend (°C/decade) for the period 1960–2003 (asterisk indicates significant trend at the 5% level)
show their month of maximum trend to be April, with the exception of Pretoria PUR. This station, however,also shows a very high trend for April. These results coincide with those for the seasons, where autumn isthe season of maximum trend. In the south the results are mixed, possibly indicating that additional or otherfactors than for the rest of the country might contribute to the increase in temperature there.
The months of minimum trends are shown in Figure 11, indicating that for the interior the largest part showsa minimum trend in early summer from September to December. The exception is the far eastern regions,where the minimum trends occur in January, as for the climate stations of Cape St Lucia and Skukuza. Inthe south and southeast, minimum trends tend to occur either in March or July, whereas in the southwest theresults are mixed. The poor spatial coherence in the results for the southwestern Cape, for both maximumand minimum monthly trends, can be explained by examining the graph in Figure 9 for three stations in the
Copyright 2004 Royal Meteorological Society Int. J. Climatol. 24: 1929–1945 (2004)
SOUTH AFRICAN TEMPERATURE TRENDS 1935
Cap
e C
olum
bine
*C
ape
Tow
nC
ape
Poi
nt*
Joer
shoe
knk
Cap
e A
gulh
as*
Cap
e S
t. B
laiz
e*C
ape
St.
Fran
cis
Por
t Eliz
abet
hE
ast L
ondo
nD
urba
nC
ape
St.
Luci
aLa
ngge
wen
sU
ping
ton
Van
wyk
svle
iA
ddo
Arm
oeds
vlak
teB
loem
font
ein
Gle
n C
olle
geC
edar
aE
mer
ald
Dal
eP
reto
ria P
UR
Pre
toria
UP
*B
ela
Bel
aP
olok
wan
eM
usin
aS
kuku
za
Station
-0.1
0
0.1
0.2
0.3
0.4
0.5
°C/d
ecad
e
Figure 7. Spring mean temperature trend (°C/decade) for the period 1960–2003 (asterisk indicates significant trend at the 5% level)
Station
-0.1
0
0.1
0.2
0.3
0.4
0.5
°C/d
ecad
e
Cap
e C
olum
bine
*C
ape
Tow
n*C
ape
Poi
nt*
Jonk
ersh
oek
Cap
e A
gulh
as*
Cap
e S
t. B
laiz
eC
ape
St.
Fran
cis*
Por
t E
lizab
eth
Eas
t Lon
don*
Dur
ban*
Cap
e S
t. Lu
cia
Lang
gew
ens
Upi
ngto
n*V
anw
yksv
lei*
Add
o*A
rmoe
dsvl
akte
Blo
emfo
ntei
nG
len
Col
lege
Ced
ara*
Em
eral
d D
ale
Pre
toria
PU
RP
reto
ria U
PB
ela
Bel
aP
olok
wan
eM
usin
aS
kuku
za
Figure 8. Summer mean temperature trend (°C/decade) for the period 1960–2003 (asterisk indicates significant trend at the 5% level)
area, indicating monthly maxima in trends in February, May and December, and minima in June/July andNovember.
The causes of the differences and similarities of mean monthly temperature trends can probably only beexplained with the aid of general circulation models, where gradual changes in circulation over decades on amonthly basis can be investigated.
3.4. Trends in diurnal temperature range
The general global trend is for the diurnal range trend to be negative over the last century (Easterlinget al., 2000) due to the fact that, in general, trends in minimum temperatures are higher than trendsin maximum temperature. However, results on a regional basis may not necessarily be the same. The
Copyright 2004 Royal Meteorological Society Int. J. Climatol. 24: 1929–1945 (2004)
1936 A. C. KRUGER AND S. SHONGWE
South-western Cape
1 2 3 4 5 6 7 8 9 10 11 12
Month
1 2 3 4 5 6 7 8 9 10 11 12
Month
1 2 3 4 5 6 7 8 9 10 11 12
Month
1 2 3 4 5 6 7 8 9 10 11 12
Month
1 2 3 4 5 6 7 8 9 10 11 12
Month
1 2 3 4 5 6 7 8 9 10 11 12
Month
Cape Columbine
Cape Town
Cape Point
Jonkershoek
Southern Cape
Cape AgulhasCape St Blaize
South-eastern Cape
Cape St Francis
Port Elizabeth
Addo
Southern KwaZulu-Natal
Durban
Cedara
Emerald Dale
Northern Gauteng
Pretoria PUR
Pretoria UP
Bela Bela
Limpopo and Mpumalanga
PolokwaneMusinaSkukuza
-0.1
-0.2
-0.3
0
0.1
0.2
0.3
0.4
0.5
°C/d
ecad
e
-0.1
-0.2
-0.3
0
0.1
0.2
0.3
0.4
0.5
°C/d
ecad
e
-0.1
-0.2
-0.3
0
0.1
0.2
0.3
0.4
0.5
°C/d
ecad
e
-0.1
-0.2
-0.3
0
0.1
0.2
0.3
0.4
0.5
°C/d
ecad
e
-0.1
-0.2
-0.3
0
0.1
0.2
0.3
0.4
0.5
°C/d
ecad
e
-0.1
-0.2
-0.3
0
0.1
0.2
0.3
0.4
0.5
°C/d
ecad
e
Figure 9. Trends of monthly mean temperature (°C/decade) for various regions in South Africa for the period 1960–2003
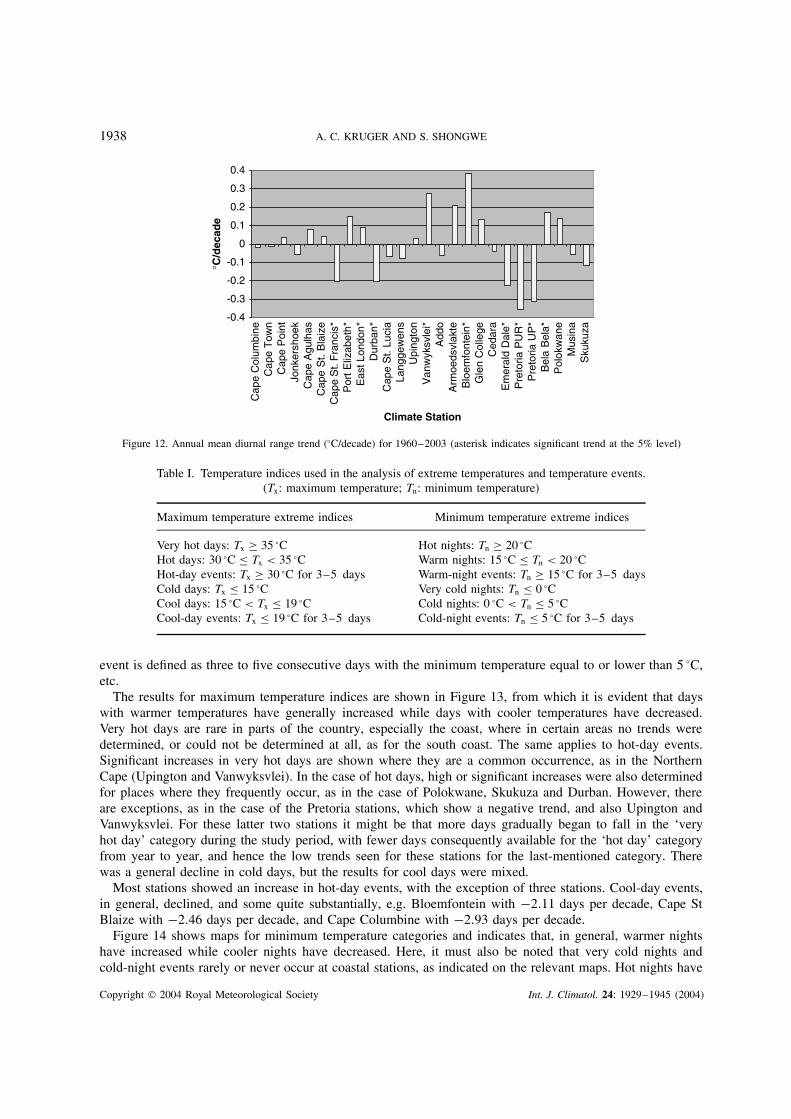
trends in South Africa for 1960 to 2003 were found to be almost equally divided between positive andnegative trends in mean annual diurnal temperature range, as indicated in Figure 12. Twelve stations showedpositive trends, with five of them significant, and 14 stations showed negative trends, with six of themsignificant. In a regional sense, coastal stations showed mixed positive and negative trends, with only CapeSt Francis in the south and Durban in the east showing significant and substantial decreases in diurnalrange. In the interior, stations in a central part around the southern Free State, Northern Cape and North-West provinces, showed high positive trends, due in part to the high trends in annual mean maximumtemperature, but also because of the small or even negative trends in annual mean minimum temperaturesfor some of the stations. Other stations with the same tendency are situated in the northern interior, buttheir trends in diurnal temperature range were much smaller, although significant for Bela Bela. In betweenthe above two groups of stations with positive trends are the stations of Gauteng and KwaZulu-Natalprovinces, with negative trends, ranging from about −0.05 °C per decade for Cedara to about −0.35 °Cper decade for Pretoria PUR. Although some of these stations with negative trends showed a substantialsignificant increase in minimum temperatures, the trends in maximum temperatures were almost zero ornegative.
Copyright 2004 Royal Meteorological Society Int. J. Climatol. 24: 1929–1945 (2004)
SOUTH AFRICAN TEMPERATURE TRENDS 1937
Figure 10. Month of maximum monthly mean temperature trend in South Africa for the period 1960–2003 (1 = January, 2 = February,3 = March, . . ., 12 = December)
Figure 11. Month of minimum monthly mean temperature trend in South Africa for the period 1960–2003 (1 = January, 2 = February,3 = March, . . ., 12 = December)
3.5. Trends in extreme temperatures and temperature events
Changes in annual frequencies of the amount of days with maximum and minimum temperatures in definedcategories are investigated based on some of the indices developed by Collins et al. (2000), but also takinginto account the temperature categories employed by the forecasting section of the South African WeatherService, with which temperature thresholds are defined for forecasting purposes, e.g. when a day is defined asvery hot, hot, cool or cold. The indices selected are shown in Table I, from which one can see, for example,that a very hot day is defined as a day with a maximum temperature equal or higher then 35 °C, a cold night
Copyright 2004 Royal Meteorological Society Int. J. Climatol. 24: 1929–1945 (2004)
1938 A. C. KRUGER AND S. SHONGWE
Climate Station
-0.1
-0.2
-0.4
-0.3
0
0.1
0.2
0.3
0.4
°C/d
ecad
e
Cap
e C
olum
bine
Cap
e T
own
Cap
e P
oint
Jonk
ersh
oek
Cap
e A
gulh
asC
ape
St.
Bla
ize
Cap
e S
t. F
ranc
is*
Por
t Eliz
abet
h*E
ast L
ondo
n*D
urba
n*C
ape
St.
Luci
aLa
ngge
wen
sU
ping
ton
Van
wyk
svle
i*A
ddo
Arm
oeds
vlak
teB
loem
font
ein*
Gle
n C
olle
geC
edar
aE
mer
ald
Dal
e*P
reto
ria P
UR
*P
reto
ria U
P*
Bel
a B
ela*
Pol
okw
ane
Mus
ina
Sku
kuza
Figure 12. Annual mean diurnal range trend (°C/decade) for 1960–2003 (asterisk indicates significant trend at the 5% level)
Table I. Temperature indices used in the analysis of extreme temperatures and temperature events.(Tx: maximum temperature; Tn: minimum temperature)
Maximum temperature extreme indices Minimum temperature extreme indices
Very hot days: Tx ≥ 35 °C Hot nights: Tn ≥ 20 °CHot days: 30 °C ≤ Tx < 35 °C Warm nights: 15 °C ≤ Tn < 20 °CHot-day events: Tx ≥ 30 °C for 3–5 days Warm-night events: Tn ≥ 15 °C for 3–5 daysCold days: Tx ≤ 15 °C Very cold nights: Tn ≤ 0 °CCool days: 15 °C < Tx ≤ 19 °C Cold nights: 0 °C < Tn ≤ 5 °CCool-day events: Tx ≤ 19 °C for 3–5 days Cold-night events: Tn ≤ 5 °C for 3–5 days
event is defined as three to five consecutive days with the minimum temperature equal to or lower than 5 °C,etc.
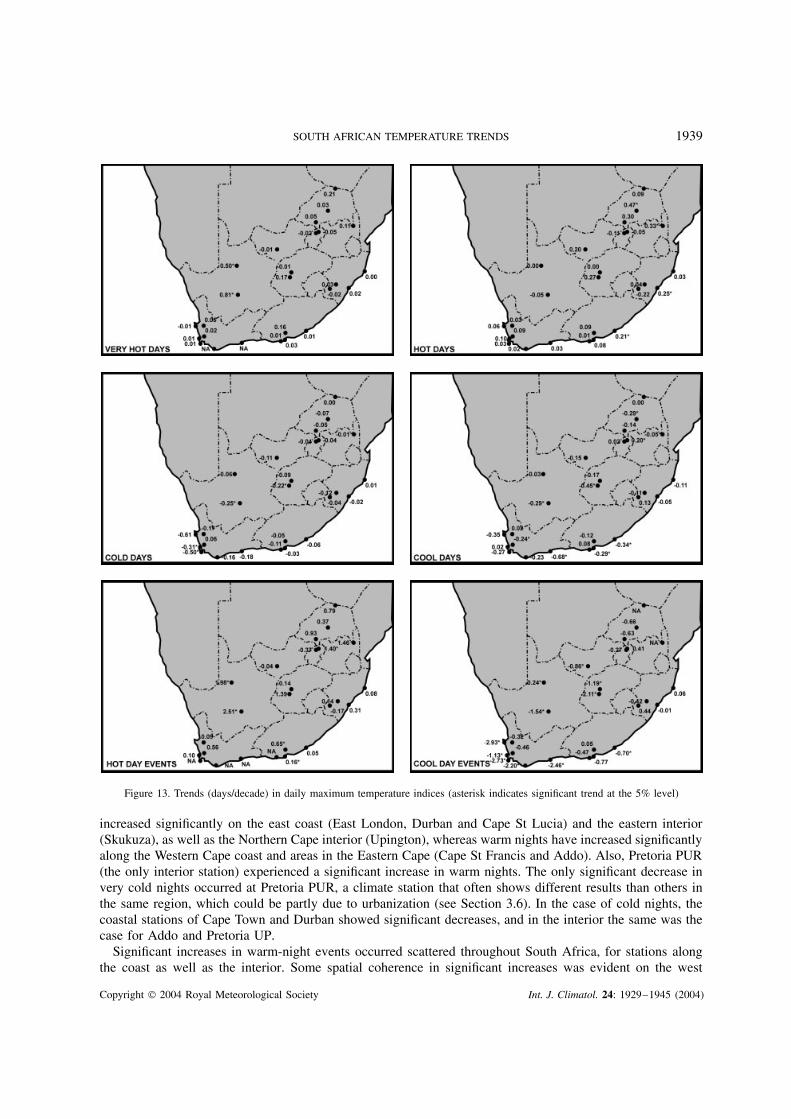
The results for maximum temperature indices are shown in Figure 13, from which it is evident that dayswith warmer temperatures have generally increased while days with cooler temperatures have decreased.Very hot days are rare in parts of the country, especially the coast, where in certain areas no trends weredetermined, or could not be determined at all, as for the south coast. The same applies to hot-day events.Significant increases in very hot days are shown where they are a common occurrence, as in the NorthernCape (Upington and Vanwyksvlei). In the case of hot days, high or significant increases were also determinedfor places where they frequently occur, as in the case of Polokwane, Skukuza and Durban. However, thereare exceptions, as in the case of the Pretoria stations, which show a negative trend, and also Upington andVanwyksvlei. For these latter two stations it might be that more days gradually began to fall in the ‘veryhot day’ category during the study period, with fewer days consequently available for the ‘hot day’ categoryfrom year to year, and hence the low trends seen for these stations for the last-mentioned category. Therewas a general decline in cold days, but the results for cool days were mixed.
Most stations showed an increase in hot-day events, with the exception of three stations. Cool-day events,in general, declined, and some quite substantially, e.g. Bloemfontein with −2.11 days per decade, Cape StBlaize with −2.46 days per decade, and Cape Columbine with −2.93 days per decade.
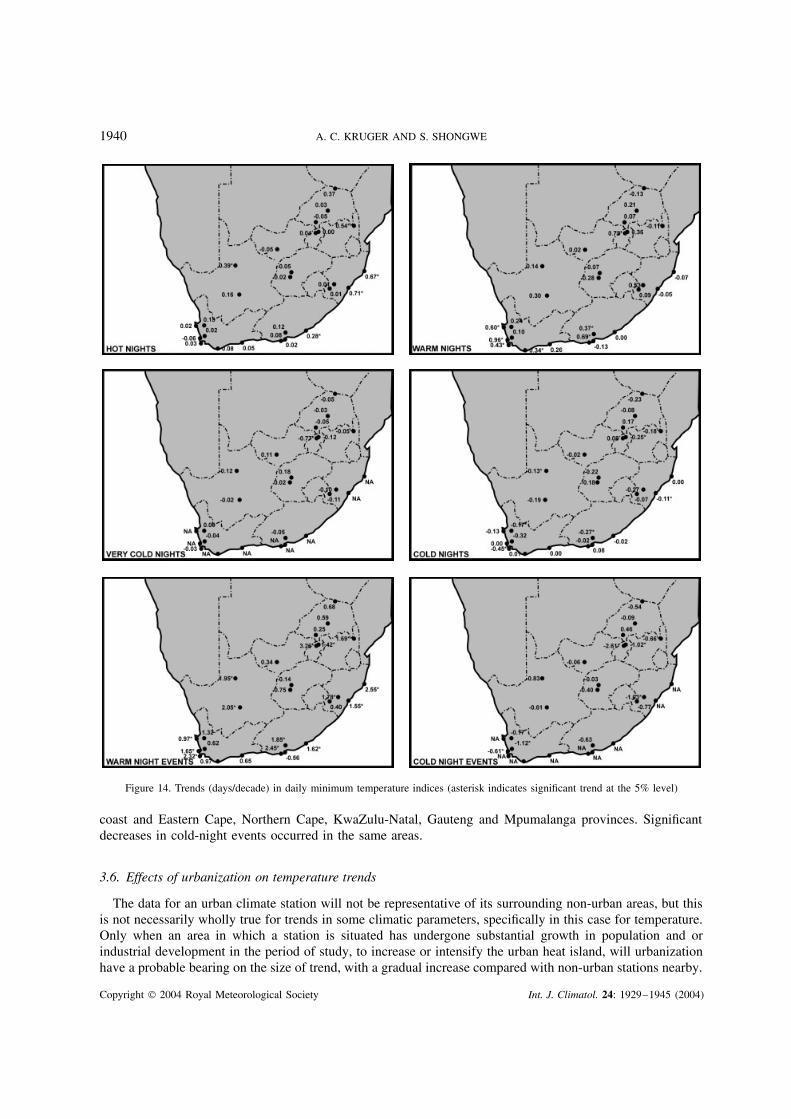
Figure 14 shows maps for minimum temperature categories and indicates that, in general, warmer nightshave increased while cooler nights have decreased. Here, it must also be noted that very cold nights andcold-night events rarely or never occur at coastal stations, as indicated on the relevant maps. Hot nights have
Copyright 2004 Royal Meteorological Society Int. J. Climatol. 24: 1929–1945 (2004)
SOUTH AFRICAN TEMPERATURE TRENDS 1939
Figure 13. Trends (days/decade) in daily maximum temperature indices (asterisk indicates significant trend at the 5% level)
increased significantly on the east coast (East London, Durban and Cape St Lucia) and the eastern interior(Skukuza), as well as the Northern Cape interior (Upington), whereas warm nights have increased significantlyalong the Western Cape coast and areas in the Eastern Cape (Cape St Francis and Addo). Also, Pretoria PUR(the only interior station) experienced a significant increase in warm nights. The only significant decrease invery cold nights occurred at Pretoria PUR, a climate station that often shows different results than others inthe same region, which could be partly due to urbanization (see Section 3.6). In the case of cold nights, thecoastal stations of Cape Town and Durban showed significant decreases, and in the interior the same was thecase for Addo and Pretoria UP.
Significant increases in warm-night events occurred scattered throughout South Africa, for stations alongthe coast as well as the interior. Some spatial coherence in significant increases was evident on the west
Copyright 2004 Royal Meteorological Society Int. J. Climatol. 24: 1929–1945 (2004)
1940 A. C. KRUGER AND S. SHONGWE
Figure 14. Trends (days/decade) in daily minimum temperature indices (asterisk indicates significant trend at the 5% level)
coast and Eastern Cape, Northern Cape, KwaZulu-Natal, Gauteng and Mpumalanga provinces. Significantdecreases in cold-night events occurred in the same areas.
3.6. Effects of urbanization on temperature trends
The data for an urban climate station will not be representative of its surrounding non-urban areas, but thisis not necessarily wholly true for trends in some climatic parameters, specifically in this case for temperature.Only when an area in which a station is situated has undergone substantial growth in population and orindustrial development in the period of study, to increase or intensify the urban heat island, will urbanizationhave a probable bearing on the size of trend, with a gradual increase compared with non-urban stations nearby.
Copyright 2004 Royal Meteorological Society Int. J. Climatol. 24: 1929–1945 (2004)
SOUTH AFRICAN TEMPERATURE TRENDS 1941
Stations that underwent substantial increased urbanization in their vicinities during the study period are CapeTown, Port Elizabeth, East London, Durban, Pretoria PUR and Pretoria UP.
In this section we compare the temperature trends of the above stations with the remaining non-urbanstations. In the case of mean annual maximum temperature trends, the urban stations show, on average,a non-significant positive trend of 0.07 °C per decade compared with a significant 0.16 °C per decade fornon-urban stations; for mean annual minimum temperature trends is a significant 0.17 °C per decade (urban)compared with a non-significant 0.11 °C per decade (non-urban). Pretoria PUR, which is located in the centreof Pretoria, in contrast to other urban stations, which are located at airports more on the outskirts of cities,exhibits temperature trends that seem to be most likely contaminated by urbanization. This station showsa significant increase in mean annual minimum temperature of 0.34 °C per decade compared with 0.16 °Cper decade at Pretoria UP, more on the outskirts of the city. Other stations identified as urban do not showthe same contrast in temperature trends when compared with other stations in their region. It seems that forthe stations used in the study, except for Pretoria PUR, other influences on the region where the climatestation is situated have a much greater effect on its temperature trends than whether it is classified as urbanor non-urban.
Hughes and Balling (1996) also divided stations into urban and non-urban groups and calculated averagediurnal range trends for both groups, and found that, in general, non-urban stations showed a more positivetrend than urban stations. This means that there should have been a stronger increase in minimum temperaturescompared with maximum temperatures for urban stations than for non-urban stations. We did a similar exerciseand found average trends of 0.03 °C per decade for non-urban stations and −0.07 °C per decade for urbanstations. The biggest reason for the difference in trends seems to be a lower increase in mean maximumtemperature trends for urban stations than for non-urban stations, although the differences in mean minimumtemperature trends between urban and non-urban station also seem to play some role to a lesser extent. Thesetrends are similar in sign to those found by Hughes and Balling (1996), with trends of 0.04 °C and −0.22 °Crespectively. However, our results for urban stations are much closer to zero than their study, indicating apossible decrease in trend for the last decade.
3.7. Changes in temperature trends between different periods from 1960 to 2003
It is already established that most stations showed a significant increase in mean annual temperature for theperiod 1960 to 2003, as shown in Figure 3, but previous studies did not show these largely positive trendsfor most climate stations in their studies (Muhlenbruch-Tegen, 1992; Hughes and Balling, 1996), probablybecause the period 1991 to 2003 was not included. Globally, the last decade of the previous century was shownto be substantially warmer than previous decades. Therefore, we decided to quantify the average difference intrends of mean annual temperatures, between the periods 1960 to 1990 and 1991 to 2003, with the exceptionof Pretoria PUR, for which the temperature data are most probably contaminated by urbanization. The periodfor 1960 to 1990 has an average mean temperature of 18.18 °C and a trend of 0.11 °C per decade for theremaining 25 stations, whereas the period 1991 to 2003 has an average mean temperature of 18.48 °C anda trend of 0.09 °C per decade. There is not much difference between the trends for the two periods, and theaverage trend for the latter period is even slightly lower than for the former. It can thus be concluded thatthere is no gradual increase in annual mean temperature trends from 1960 to 2003.
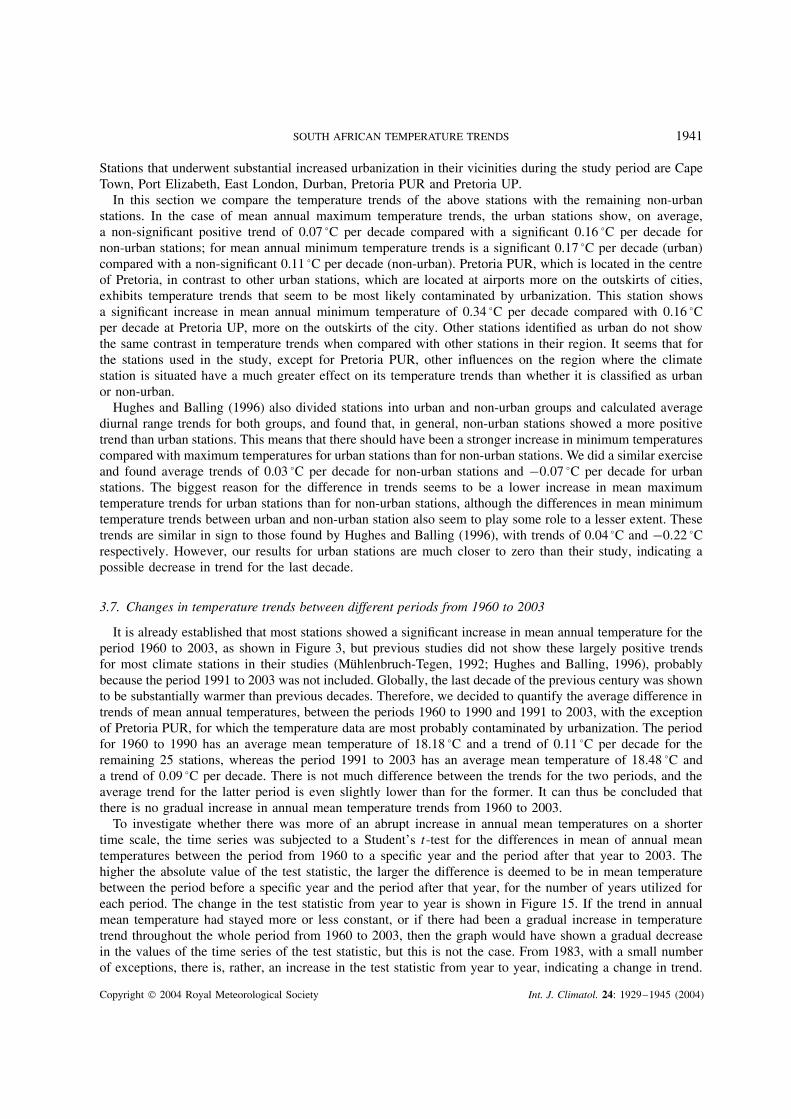
To investigate whether there was more of an abrupt increase in annual mean temperatures on a shortertime scale, the time series was subjected to a Student’s t-test for the differences in mean of annual meantemperatures between the period from 1960 to a specific year and the period after that year to 2003. Thehigher the absolute value of the test statistic, the larger the difference is deemed to be in mean temperaturebetween the period before a specific year and the period after that year, for the number of years utilized foreach period. The change in the test statistic from year to year is shown in Figure 15. If the trend in annualmean temperature had stayed more or less constant, or if there had been a gradual increase in temperaturetrend throughout the whole period from 1960 to 2003, then the graph would have shown a gradual decreasein the values of the time series of the test statistic, but this is not the case. From 1983, with a small numberof exceptions, there is, rather, an increase in the test statistic from year to year, indicating a change in trend.
Copyright 2004 Royal Meteorological Society Int. J. Climatol. 24: 1929–1945 (2004)
1942 A. C. KRUGER AND S. SHONGWE
-6
-5
-4
-3
-2
-1
0
1
1961
1963
1965
1967
1969
1971
1973
1975
1977
1979
1981
1983
1985
1987
1989
1991
1993
1995
1997
1999
2001
Year
Test
sta
tist
ic
Figure 15. Time series of Student’s t-test for the difference in means. The value of the test statistic indicates the difference between theaverage temperature from 1960 to a specific year (on the x-axis) and the average temperature after the specific year to 2003
From the above, the conclusion is that, on average for the 25 stations, there was from about 1982 a ratherabrupt increase in annual mean temperatures. In this regard it is interesting to note that, on average, the meanannual temperature trend for the stations from 1960 to 1982 is a non-significant 0.04 °C per decade, whereasthe trend is almost zero, 0.01 °C per decade, for the period from 1983 to 2003. For the whole period from1960 to 2003 the average trend in mean annual temperature is a significant 0.13 °C per decade. There wastherefore, on average for all stations, a somewhat abrupt increase in mean annual temperatures during theearly 1980s, the main cause of the significant trend determined for the study period as a whole.
3.8. The influence of El Nino and La Nina events on average annual temperatures
To test whether the trends in temperatures are forced partly by El Nino and La Nina events, regressionanalysis was performed using average late-summer (January to March) NINO3 sea-surface temperatures(SSTs) and average late-summer temperatures. This procedure was applied to all stations within the areaof South Africa which had a significantly negative correlation between late-summer NINO3 SSTs and late-summer rainfall, as established by Kruger (1999). This area covers more or less a broad band over the centralparts of the country, from northwest to southeast, and includes eight stations, namely Upington, Vanwyksvlei,Armoedsvlakte, Glen College, Bloemfontein, Addo, Cedara and Emerald Dale. All the above stations showeda significant correlation between late-summer NINO3 SSTs and temperature.
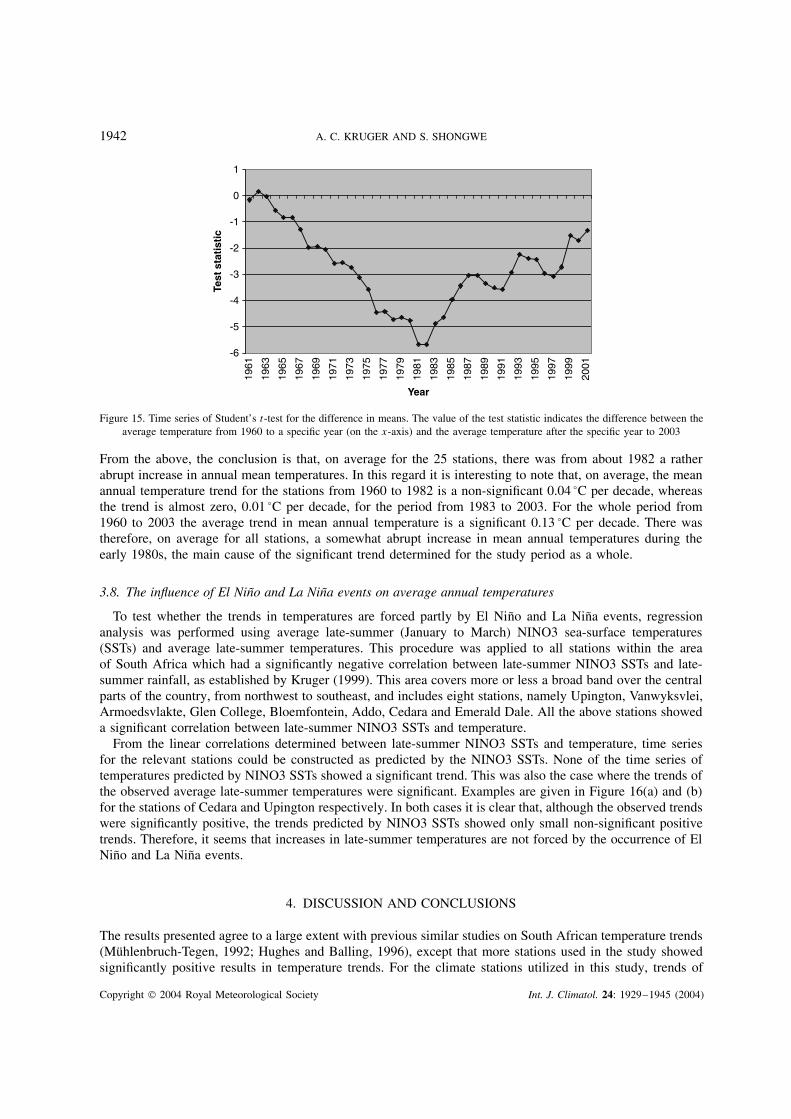
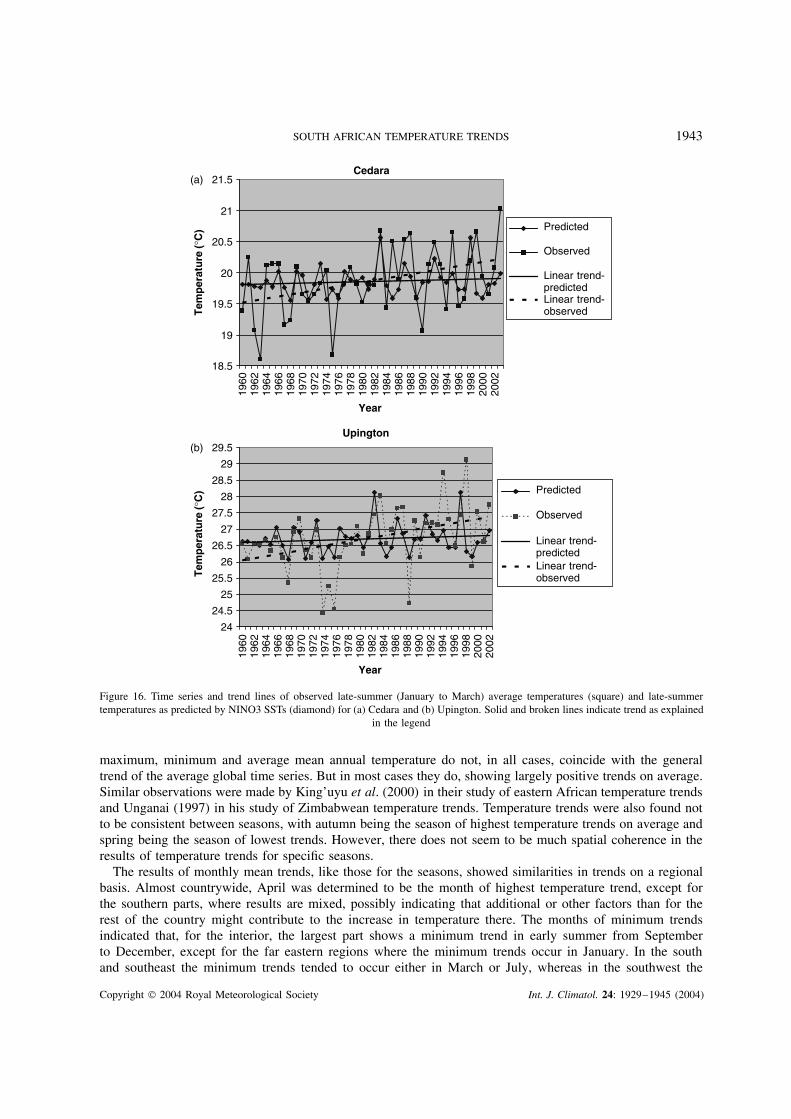
From the linear correlations determined between late-summer NINO3 SSTs and temperature, time seriesfor the relevant stations could be constructed as predicted by the NINO3 SSTs. None of the time series oftemperatures predicted by NINO3 SSTs showed a significant trend. This was also the case where the trends ofthe observed average late-summer temperatures were significant. Examples are given in Figure 16(a) and (b)for the stations of Cedara and Upington respectively. In both cases it is clear that, although the observed trendswere significantly positive, the trends predicted by NINO3 SSTs showed only small non-significant positivetrends. Therefore, it seems that increases in late-summer temperatures are not forced by the occurrence of ElNino and La Nina events.
4. DISCUSSION AND CONCLUSIONS
The results presented agree to a large extent with previous similar studies on South African temperature trends(Muhlenbruch-Tegen, 1992; Hughes and Balling, 1996), except that more stations used in the study showedsignificantly positive results in temperature trends. For the climate stations utilized in this study, trends of
Copyright 2004 Royal Meteorological Society Int. J. Climatol. 24: 1929–1945 (2004)
SOUTH AFRICAN TEMPERATURE TRENDS 1943
Cedara
18.5
19
19.5
20
20.5
21
21.5(a)
(b)
1960
1962
1964
1966
1968
1970
1972
1974
1976
1978
1980
1982
1984
1986
1988
1990
1992
1994
1996
1998
2000
2002
Year
1960
1962
1964
1966
1968
1970
1972
1974
1976
1978
1980
1982
1984
1986
1988
1990
1992
1994
1996
1998
2000
2002
Year
Tem
per
atu
re (°
C)
Tem
per
atu
re (°
C)
Predicted
Observed
Linear trend-predictedLinear trend-observed
Upington
24
24.5
25
25.5
26
26.5
27
27.5
28
28.5
29
29.5
Predicted
Observed
Linear trend-predictedLinear trend-observed
Figure 16. Time series and trend lines of observed late-summer (January to March) average temperatures (square) and late-summertemperatures as predicted by NINO3 SSTs (diamond) for (a) Cedara and (b) Upington. Solid and broken lines indicate trend as explained
in the legend
maximum, minimum and average mean annual temperature do not, in all cases, coincide with the generaltrend of the average global time series. But in most cases they do, showing largely positive trends on average.Similar observations were made by King’uyu et al. (2000) in their study of eastern African temperature trendsand Unganai (1997) in his study of Zimbabwean temperature trends. Temperature trends were also found notto be consistent between seasons, with autumn being the season of highest temperature trends on average andspring being the season of lowest trends. However, there does not seem to be much spatial coherence in theresults of temperature trends for specific seasons.
The results of monthly mean trends, like those for the seasons, showed similarities in trends on a regionalbasis. Almost countrywide, April was determined to be the month of highest temperature trend, except forthe southern parts, where results are mixed, possibly indicating that additional or other factors than for therest of the country might contribute to the increase in temperature there. The months of minimum trendsindicated that, for the interior, the largest part shows a minimum trend in early summer from Septemberto December, except for the far eastern regions where the minimum trends occur in January. In the southand southeast the minimum trends tended to occur either in March or July, whereas in the southwest the
Copyright 2004 Royal Meteorological Society Int. J. Climatol. 24: 1929–1945 (2004)
1944 A. C. KRUGER AND S. SHONGWE
results were mixed. A conclusion from the above results is that it is advisable to investigate trends for asshort a time scale as possible, as seasonal trends can show more detail of trends than average annual series(as in this case), whereas a monthly time series, showing even more detail in trends, lends itself to furtherinvestigation of temperature trends and its causes on a regional basis. With a relatively large focus presentlyin climate research on the downscaling of general circulation model (GCM) results to smaller regions, theresults obtained in this study can be applied for verification purposes, and downscaled GCM results can inturn be utilized to explain the monthly or seasonal differences in trend.
Trends in diurnal temperature range also show that results on a regional basis do not necessarily coincidewith the general global trends, which are negative over the last century (Easterling et al., 2000). Positive andnegative diurnal range trends seem to occur more or less as frequently as each other. Partly due to relativelyhigh maximum temperature trends, many stations in the interior showed positive diurnal range trends, whereasat the coast the results were not as coherent spatially.
Examining the days and nights with temperatures between, at, or below certain threshold values, in mostcases it is evident that warmer days and nights have increased, while cooler days and nights have decreased.Significant results in trends were found in areas where specific temperature indices were occurring on arelatively frequent basis. As could be expected, the same types of result were found with runs of hot andcold maximum and minimum daily temperatures.
Climate stations that can be classified as urban stations were investigated to see whether their trends weresubstantially different from those in the same region. We came to the conclusion that the results of temperaturetrends of the urban stations used in the study are still useful, as most of these stations are situated on theoutskirts of cities. The exception is Pretoria PUR, whose results were consistently different than those inthe same region. Where the trend results of urban stations were, on average, notably different than the ruralstations was in the case of diurnal range trends. Urban stations have, on average, lower trends than non-urbanstations, confirming the results of Hughes and Balling (1996).
Although it is widely accepted that the average temperatures for the 1990s were substantially warmerthan preceding decades (18.48 °C for 1991 to 2003 compared with 18.18 °C for 1960 to 1990), trends intemperatures in South Africa have not increased during the last decade. The average temperature trend from1991 to 2003 is 0.09 °C per decade, compared with 0.11 °C per decade from 1960 to 1990. It was found thatthere was rather a relatively strong increase in average temperatures in the early 1980s, this being the maincause of the general increase in temperature over the whole period from 1960 to 2003. While the averagetrend in annual mean temperatures is a significant 0.13 °C per decade for 1960 to 2003, non-significant trendsof 0.04 °C per decade and 0.01 °C per decade were found for 1960 to 1982 and 1983 to 2003 respectively.The 1982–83 rainfall season was one of the driest and hottest over much of South Africa due to an extremeEl Nino event, but it seems that average temperatures have never fully recovered since then.
Consequently, we tested whether the trends in temperatures were found to be forced partly be El Nino andLa Nina events. Although there was a significant correlation between average late-summer NINO3 SSTs andlate-summer temperatures over the same area which had a significant correlation between the same SSTs andrainfall (Kruger, 1999), the indications are that El Nino and La Nina events do not play a significant role inthe observed significant increases in late-summer temperatures.
REFERENCES
Collins DA, Della-Marta PM, Plummer N, Trewin BC. 2000. Trends in annual frequencies of extreme temperature events in Australia.Australian Meteorological Magazine 49: 277–292.
Datsenko NM, Sonechkon DM. 1999. Refinement of time series of mean annual air temperature for the Northern and SouthernHemispheres in the 19th century. Russian Meteorology and Hydrology 10: 17–22.
Easterling DR, Karl TR, Gallo KP, Robinson DA, Trenberth KE, Dai A. 2000. Observed climate variability and change of relevanceto the biosphere. Journal of Geophysical Research 105: 20 101–20 114.
Hoffmann JAJ, Nuonoez SE, Vargas WM. 1997. Temperature, humidity and precipitation variations in Argentina and the adjacentsub-Antarctic region during the present century. Meteorologische Zeitschrift 6: 3–11.
Hughes SH, Balling RC. 1996. Urban influences on South African temperature trends. International Journal of Climatology 16: 935–940.Jones PD, New M, Parker DE, Martin S, Rigor IG. 1999. Surface air temperature and its changes over the past 150 years. Reviews of
Geophysics 37: 173–183.King’uyu SM, Ogallo LA, Anyamba EK. 2000. Recent trends of minimum and maximum surface temperatures over eastern Africa.
Journal of Climate 13: 2876–2886.
Copyright 2004 Royal Meteorological Society Int. J. Climatol. 24: 1929–1945 (2004)
SOUTH AFRICAN TEMPERATURE TRENDS 1945
Kruger AC. 1999. The influence of the decadal-scale variability of summer rainfall on the impact of El Nino and La Nina events inSouth Africa. International Journal of Climatology 19: 59–68.
Muhlenbruch-Tegen A. 1992. Long-term surface temperature variations in South Africa. South African Journal of Science 88: 197–205.Peterson TC, Gallo KP, Lawrimore J, Owen TW, Huang A, McKittrick DA. 1999. Global rural temperature trends. Geophysical
Research Letters 26: 329–332.Plummer N. 1996. Temperature variability and extremes over Australia. Part 1: recent observed changes. Australian Meteorological
Magazine 45: 233–250.Rosenbluoeth B, Fuenzalida HA, Aceituno P. 1997. Recent temperature variations in southern South America. International Journal of
Climatology 17: 67–85.Salinger MJ, Mullan AB. 1999. New Zealand climate; temperature and precipitation variations and their links with atmospheric
circulation 1930–1994. International Journal of Climatology 19: 1049–1071.Stott PA, Tett SFB, Jones GS, Allen MR, Ingram WJ, Mitchell JFB. 2001. Attribution of twentieth century temperature change to natural
and anthropogenic causes. Climate Dynamics 17: 1–21.Tett SFB, Stott PA, Allen MR, Ingram WJ, Mitchell JFB. 1999. Causes of twentieth-century temperature change near the Earth’s surface.
Nature 399: 569–572.Torok SJ, Nicholls N. 1996. A historical annual dataset for Australia. Australian Meteorological Magazine 45: 251–260.Unganai LS. 1997. Surface temperature variation over Zimbabwe between 1897 and 1993. Theoretical and Applied Climatology 56:
89–101.Zheng X, Basher RE, Thompson CS. 1997. Trend detection in regional-mean temperature series: maximum, minimum, diurnal range,
and SST. Journal of Climate 10: 317–326.
Copyright 2004 Royal Meteorological Society Int. J. Climatol. 24: 1929–1945 (2004)