temperature plasma sources used in plasma medicine ... · pdf fileapplication of coupled mode...
TRANSCRIPT
Perspective: The physics, diagnostics, and applications of atmospheric pressure lowtemperature plasma sources used in plasma medicineM. Laroussi, X. Lu, and M. Keidar
Citation: Journal of Applied Physics 122, 020901 (2017); doi: 10.1063/1.4993710View online: http://dx.doi.org/10.1063/1.4993710View Table of Contents: http://aip.scitation.org/toc/jap/122/2Published by the American Institute of Physics
Articles you may be interested in Announcement: Journal of Applied Physics eliminates publication fees effective 1 June 2017Journal of Applied Physics 122, 010201 (2017); 10.1063/1.4989932
A diffuse plasma jet generated from the preexisting discharge filament at atmospheric pressureJournal of Applied Physics 122, 013301 (2017); 10.1063/1.4989975
Tutorial: Reactive high power impulse magnetron sputtering (R-HiPIMS)Journal of Applied Physics 121, 171101 (2017); 10.1063/1.4978350
Active control and switching of broadband electromagnetically induced transparency in symmetric metadevicesApplied Physics Letters 111, 021101 (2017); 10.1063/1.4993428
Investigation of the properties of semiconductor wafer bonding in multijunction solar cells via metal-nanoparticlearraysJournal of Applied Physics 122, 023101 (2017); 10.1063/1.4992805
Application of coupled mode theory on radiative heat transfer between layered Lorentz materialsJournal of Applied Physics 121, 183101 (2017); 10.1063/1.4983021
Perspective: The physics, diagnostics, and applications of atmosphericpressure low temperature plasma sources used in plasma medicine
M. Laroussi,1,a) X. Lu,2 and M. Keidar3
1Plasma Engineering and Medicine Institute, Old Dominion University, Norfolk, Virginia 23529, USA2State Key Laboratory of Advanced Electromagnetic Engineering and Technology, HuaZhong Universityof Science and Technology, Wuhan, Hubei 430074, People’s Republic of China3Mechanical and Aerospace Engineering Department, George Washington University, Washington DC 20052,USA
(Received 12 March 2017; accepted 3 June 2017; published online 13 July 2017)
Low temperature plasmas have been used in various plasma processing applications for several
decades. But it is only in the last thirty years or so that sources generating such plasmas at
atmospheric pressure in reliable and stable ways have become more prevalent. First, in the late
1980s, the dielectric barrier discharge was used to generate relatively large volume diffuse plasmas at
atmospheric pressure. Then, in the early 2000s, plasma jets that can launch cold plasma plumes in
ambient air were developed. Extensive experimental and modeling work was carried out on both
methods and much of the physics governing such sources was elucidated. Starting in the mid-1990s,
low temperature plasma discharges have been used as sources of chemically reactive species that can
be transported to interact with biological media, cells, and tissues and induce impactful biological
effects. However, many of the biochemical pathways whereby plasma affects cells remain not well
understood. This situation is changing rather quickly because the field, known today as “plasma med-
icine,” has experienced exponential growth in the last few years thanks to a global research commu-
nity that engaged in fundamental and applied research involving the use of cold plasma for the
inactivation of bacteria, dental applications, wound healing, and the destruction of cancer cells/
tumors. In this perspective, the authors first review the physics as well as the diagnostics of the princi-
pal plasma sources used in plasma medicine. Then, brief descriptions of their biomedical applications
are presented. To conclude, the authors’ personal assessment of the present status and future outlook
of the field is given. Published by AIP Publishing. [http://dx.doi.org/10.1063/1.4993710]
I. INTRODUCTION
Plasmas have been used for biological and medical appli-
cations for several decades. Some of these uses involved
either low pressure plasmas1,2 or relatively hot plasmas where
thermal effects are dominant.3 The low pressure work (mostly
oxygen plasma) was partly conducted by NASA investigators
aiming to destroy biological matter and inactivate microorgan-
isms for space applications. Also, in the early 2000s, in-depth
investigations of low pressure plasmas for medical steriliza-
tion applications were conducted by Moisan et al.4 The ther-
mal or “hot” plasma work mainly involved the use of plasma
for cauterization and blood coagulation such as in the Argon
Plasma Coagulator.5
In the late 1980s and early 1990s, engineering advances
in the generation of large volume, low temperature, atmo-
spheric pressure plasma took place. For simplicity and conve-
nience, we refer to atmospheric pressure low temperature
plasma as LTP throughout this paper. Investigators initially
used the dielectric barrier discharge (DBD), powered by sinu-
soidal high voltages at kHz frequencies, and helium gas to
produce relatively large volume diffuse plasmas.6–8 The origi-
nal aim was to use these plasmas for material processing, such
as rendering plastics or cloth more hydrophilic or hydropho-
bic. However, by the mid-1990s, experiments were conducted
that showed that these plasmas can also be used to inactivate
bacteria.9 This biological application attracted the attention of
the Physics and Electronics Directorate of the US Air Force
Office of Scientific Research (AFOSR) which saw the poten-
tial of using such plasmas to treat soldiers’ wounds and steril-
izing biotic and abiotic surfaces. Subsequently, the AFOSR
funded proof of principle research work that started in 1997
and lasted for more than a decade. Parallel to this early work,
efforts conducted in Russia showed that plasma-generated
nitric oxide (NO) plays a crucial role in enhancing phygocyto-
sis and accelerating the proliferation of fibroblasts. Both
in vitro and in vivo experiments were conducted by the
Russian investigators who called their approach
“plasmadynamics therapy” of wounds.10 Finally, and around
2002 researchers from the Netherlands reported that LTP can
be used to detach mammalian cells without causing necrosis
and under some conditions can even lead to apoptosis (pro-
grammed cell death).11
The above described groundbreaking early research
efforts and later works by more investigators eventually led
to the foundation of a novel multidisciplinary research disci-
pline: the biomedical applications of low temperature
plasma. Today laboratories from around the world form a
sizable global research community working on understand-
ing the interaction of LTP with biological cells, tissues, and
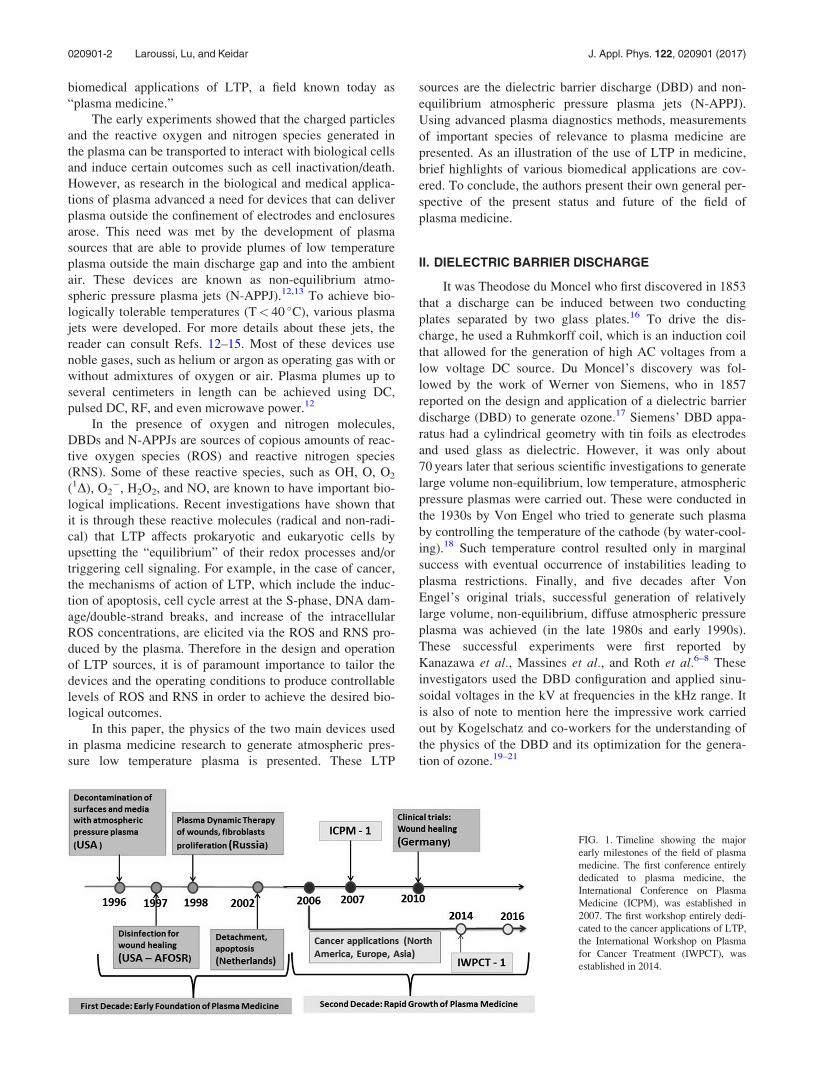
systems. Figure 1 is a timeline graph showing some of the
most important milestones in the development of thea)Author to whom correspondence should be addressed: [email protected]
0021-8979/2017/122(2)/020901/19/$30.00 Published by AIP Publishing.122, 020901-1
JOURNAL OF APPLIED PHYSICS 122, 020901 (2017)
biomedical applications of LTP, a field known today as
“plasma medicine.”
The early experiments showed that the charged particles
and the reactive oxygen and nitrogen species generated in
the plasma can be transported to interact with biological cells
and induce certain outcomes such as cell inactivation/death.
However, as research in the biological and medical applica-
tions of plasma advanced a need for devices that can deliver
plasma outside the confinement of electrodes and enclosures
arose. This need was met by the development of plasma
sources that are able to provide plumes of low temperature
plasma outside the main discharge gap and into the ambient
air. These devices are known as non-equilibrium atmo-
spheric pressure plasma jets (N-APPJ).12,13 To achieve bio-
logically tolerable temperatures (T< 40 �C), various plasma
jets were developed. For more details about these jets, the
reader can consult Refs. 12–15. Most of these devices use
noble gases, such as helium or argon as operating gas with or
without admixtures of oxygen or air. Plasma plumes up to
several centimeters in length can be achieved using DC,
pulsed DC, RF, and even microwave power.12
In the presence of oxygen and nitrogen molecules,
DBDs and N-APPJs are sources of copious amounts of reac-
tive oxygen species (ROS) and reactive nitrogen species
(RNS). Some of these reactive species, such as OH, O, O2
(1D), O2�, H2O2, and NO, are known to have important bio-
logical implications. Recent investigations have shown that
it is through these reactive molecules (radical and non-radi-
cal) that LTP affects prokaryotic and eukaryotic cells by
upsetting the “equilibrium” of their redox processes and/or
triggering cell signaling. For example, in the case of cancer,
the mechanisms of action of LTP, which include the induc-
tion of apoptosis, cell cycle arrest at the S-phase, DNA dam-
age/double-strand breaks, and increase of the intracellular
ROS concentrations, are elicited via the ROS and RNS pro-
duced by the plasma. Therefore in the design and operation
of LTP sources, it is of paramount importance to tailor the
devices and the operating conditions to produce controllable
levels of ROS and RNS in order to achieve the desired bio-
logical outcomes.
In this paper, the physics of the two main devices used
in plasma medicine research to generate atmospheric pres-
sure low temperature plasma is presented. These LTP
sources are the dielectric barrier discharge (DBD) and non-
equilibrium atmospheric pressure plasma jets (N-APPJ).
Using advanced plasma diagnostics methods, measurements
of important species of relevance to plasma medicine are
presented. As an illustration of the use of LTP in medicine,
brief highlights of various biomedical applications are cov-
ered. To conclude, the authors present their own general per-
spective of the present status and future of the field of
plasma medicine.
II. DIELECTRIC BARRIER DISCHARGE
It was Theodose du Moncel who first discovered in 1853
that a discharge can be induced between two conducting
plates separated by two glass plates.16 To drive the dis-
charge, he used a Ruhmkorff coil, which is an induction coil
that allowed for the generation of high AC voltages from a
low voltage DC source. Du Moncel’s discovery was fol-
lowed by the work of Werner von Siemens, who in 1857
reported on the design and application of a dielectric barrier
discharge (DBD) to generate ozone.17 Siemens’ DBD appa-
ratus had a cylindrical geometry with tin foils as electrodes
and used glass as dielectric. However, it was only about
70 years later that serious scientific investigations to generate
large volume non-equilibrium, low temperature, atmospheric
pressure plasmas were carried out. These were conducted in
the 1930s by Von Engel who tried to generate such plasma
by controlling the temperature of the cathode (by water-cool-
ing).18 Such temperature control resulted only in marginal
success with eventual occurrence of instabilities leading to
plasma restrictions. Finally, and five decades after Von
Engel’s original trials, successful generation of relatively
large volume, non-equilibrium, diffuse atmospheric pressure
plasma was achieved (in the late 1980s and early 1990s).
These successful experiments were first reported by
Kanazawa et al., Massines et al., and Roth et al.6–8 These
investigators used the DBD configuration and applied sinu-
soidal voltages in the kV at frequencies in the kHz range. It
is also of note to mention here the impressive work carried
out by Kogelschatz and co-workers for the understanding of
the physics of the DBD and its optimization for the genera-
tion of ozone.19–21
FIG. 1. Timeline showing the major
early milestones of the field of plasma
medicine. The first conference entirely
dedicated to plasma medicine, the
International Conference on Plasma
Medicine (ICPM), was established in
2007. The first workshop entirely dedi-
cated to the cancer applications of LTP,
the International Workshop on Plasma
for Cancer Treatment (IWPCT), was
established in 2014.
020901-2 Laroussi, Lu, and Keidar J. Appl. Phys. 122, 020901 (2017)
The performance of the DBD was greatly improved
upon when (late 1990s and early 2000s) fast rise time voltage
pulses with pulse widths in the nanoseconds-microseconds
range were employed. These pulses transfer the applied
energy to the electron population and effectively allow a
means to control the electron energy distribution function
(EEDF). This control of the EEDF leads to the possibility of
tailoring and enhancing of the plasma chemistry.22–25 The
DBD proved to be very relevant to various plasma process-
ing applications and was the first device used in the mid-
1990s in the early experiments on the biological applications
of LTP.9,26–28 These early experiments showed that the
charged particles and reactive species generated in the
plasma can be transported to interact with biological cells
and induce certain biological outcomes.
DBDs use a dielectric material to cover at least one of
the electrodes. The electrodes are driven by voltages of sev-
eral kV at frequencies in the kHz range. DBDs usually gen-
erate plasmas with filamentary structures resulting in non-
uniform material treatment. However, in the late 1980s and
in the 1990s a quest to develop DBDs that can generate non-
filamentary or diffuse plasma led to interesting results.
Several reports were published that showed that under some
conditions DBDs can produce diffuse, relatively homoge-
nous plasmas, at atmospheric pressure.6–8,29–32
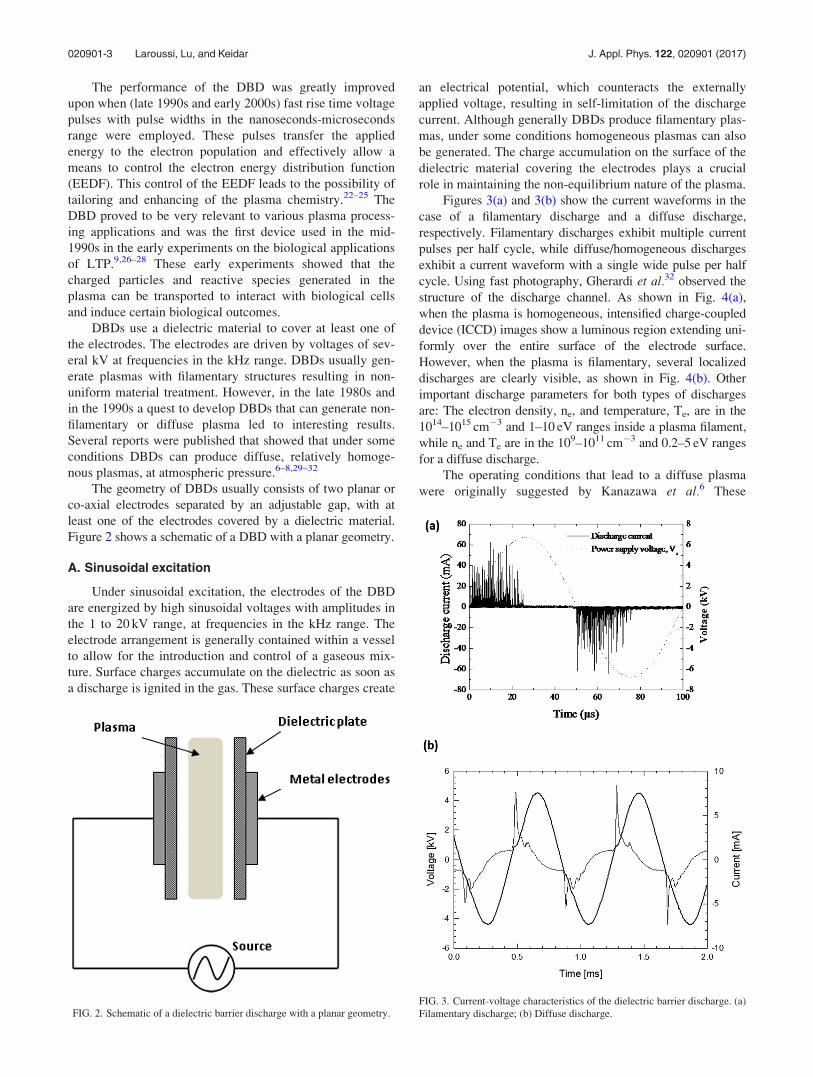
The geometry of DBDs usually consists of two planar or
co-axial electrodes separated by an adjustable gap, with at
least one of the electrodes covered by a dielectric material.
Figure 2 shows a schematic of a DBD with a planar geometry.
A. Sinusoidal excitation
Under sinusoidal excitation, the electrodes of the DBD
are energized by high sinusoidal voltages with amplitudes in
the 1 to 20 kV range, at frequencies in the kHz range. The
electrode arrangement is generally contained within a vessel
to allow for the introduction and control of a gaseous mix-
ture. Surface charges accumulate on the dielectric as soon as
a discharge is ignited in the gas. These surface charges create
an electrical potential, which counteracts the externally
applied voltage, resulting in self-limitation of the discharge
current. Although generally DBDs produce filamentary plas-
mas, under some conditions homogeneous plasmas can also
be generated. The charge accumulation on the surface of the
dielectric material covering the electrodes plays a crucial
role in maintaining the non-equilibrium nature of the plasma.
Figures 3(a) and 3(b) show the current waveforms in the
case of a filamentary discharge and a diffuse discharge,
respectively. Filamentary discharges exhibit multiple current
pulses per half cycle, while diffuse/homogeneous discharges
exhibit a current waveform with a single wide pulse per half
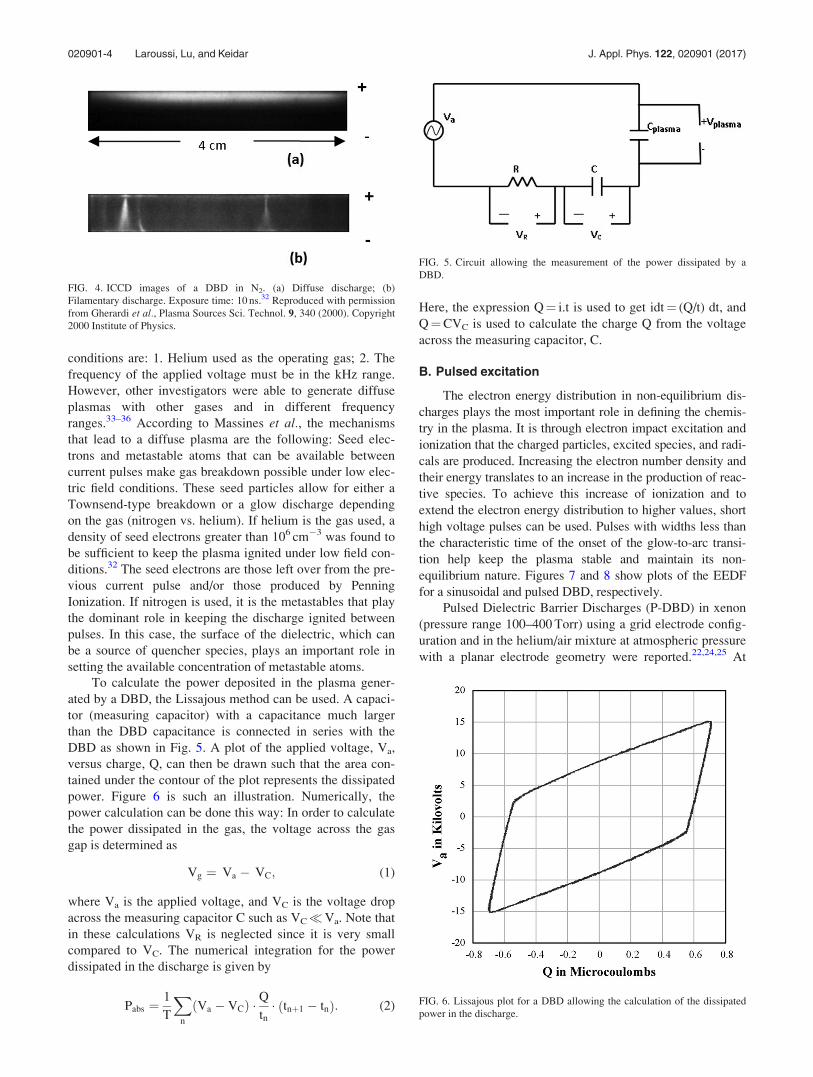
cycle. Using fast photography, Gherardi et al.32 observed the
structure of the discharge channel. As shown in Fig. 4(a),
when the plasma is homogeneous, intensified charge-coupled
device (ICCD) images show a luminous region extending uni-
formly over the entire surface of the electrode surface.
However, when the plasma is filamentary, several localized
discharges are clearly visible, as shown in Fig. 4(b). Other
important discharge parameters for both types of discharges
are: The electron density, ne, and temperature, Te, are in the
1014–1015 cm�3 and 1–10 eV ranges inside a plasma filament,
while ne and Te are in the 109–1011 cm�3 and 0.2–5 eV ranges
for a diffuse discharge.
The operating conditions that lead to a diffuse plasma
were originally suggested by Kanazawa et al.6 These
FIG. 2. Schematic of a dielectric barrier discharge with a planar geometry.FIG. 3. Current-voltage characteristics of the dielectric barrier discharge. (a)
Filamentary discharge; (b) Diffuse discharge.
020901-3 Laroussi, Lu, and Keidar J. Appl. Phys. 122, 020901 (2017)
conditions are: 1. Helium used as the operating gas; 2. The
frequency of the applied voltage must be in the kHz range.
However, other investigators were able to generate diffuse
plasmas with other gases and in different frequency
ranges.33–36 According to Massines et al., the mechanisms
that lead to a diffuse plasma are the following: Seed elec-
trons and metastable atoms that can be available between
current pulses make gas breakdown possible under low elec-
tric field conditions. These seed particles allow for either a
Townsend-type breakdown or a glow discharge depending
on the gas (nitrogen vs. helium). If helium is the gas used, a
density of seed electrons greater than 106 cm�3 was found to
be sufficient to keep the plasma ignited under low field con-
ditions.32 The seed electrons are those left over from the pre-
vious current pulse and/or those produced by Penning
Ionization. If nitrogen is used, it is the metastables that play
the dominant role in keeping the discharge ignited between
pulses. In this case, the surface of the dielectric, which can
be a source of quencher species, plays an important role in
setting the available concentration of metastable atoms.
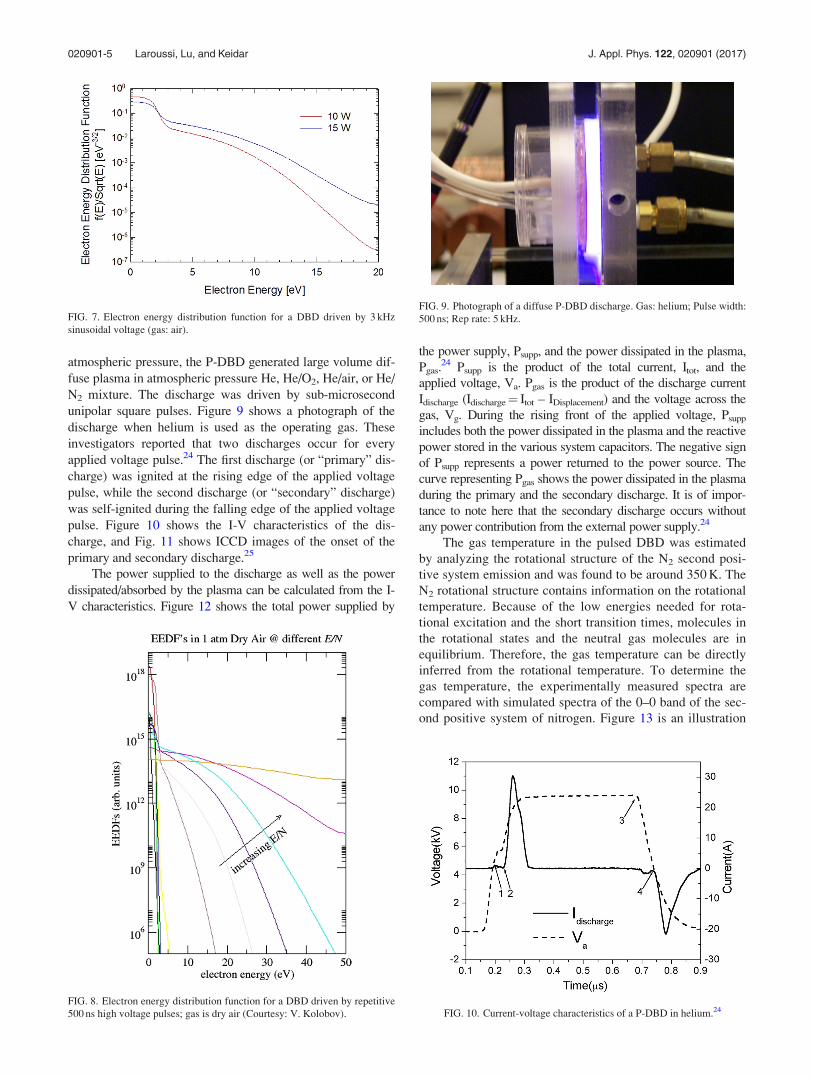
To calculate the power deposited in the plasma gener-
ated by a DBD, the Lissajous method can be used. A capaci-
tor (measuring capacitor) with a capacitance much larger
than the DBD capacitance is connected in series with the
DBD as shown in Fig. 5. A plot of the applied voltage, Va,
versus charge, Q, can then be drawn such that the area con-
tained under the contour of the plot represents the dissipated
power. Figure 6 is such an illustration. Numerically, the
power calculation can be done this way: In order to calculate
the power dissipated in the gas, the voltage across the gas
gap is determined as
Vg ¼ Va � VC; (1)
where Va is the applied voltage, and VC is the voltage drop
across the measuring capacitor C such as VC�Va. Note that
in these calculations VR is neglected since it is very small
compared to VC. The numerical integration for the power
dissipated in the discharge is given by
Pabs ¼1
T
X
n
Va � VCð Þ � Qtn
� tnþ1 � tnð Þ: (2)
Here, the expression Q¼ i.t is used to get idt¼ (Q/t) dt, and
Q¼CVC is used to calculate the charge Q from the voltage
across the measuring capacitor, C.
B. Pulsed excitation
The electron energy distribution in non-equilibrium dis-
charges plays the most important role in defining the chemis-
try in the plasma. It is through electron impact excitation and
ionization that the charged particles, excited species, and radi-
cals are produced. Increasing the electron number density and
their energy translates to an increase in the production of reac-
tive species. To achieve this increase of ionization and to
extend the electron energy distribution to higher values, short
high voltage pulses can be used. Pulses with widths less than
the characteristic time of the onset of the glow-to-arc transi-
tion help keep the plasma stable and maintain its non-
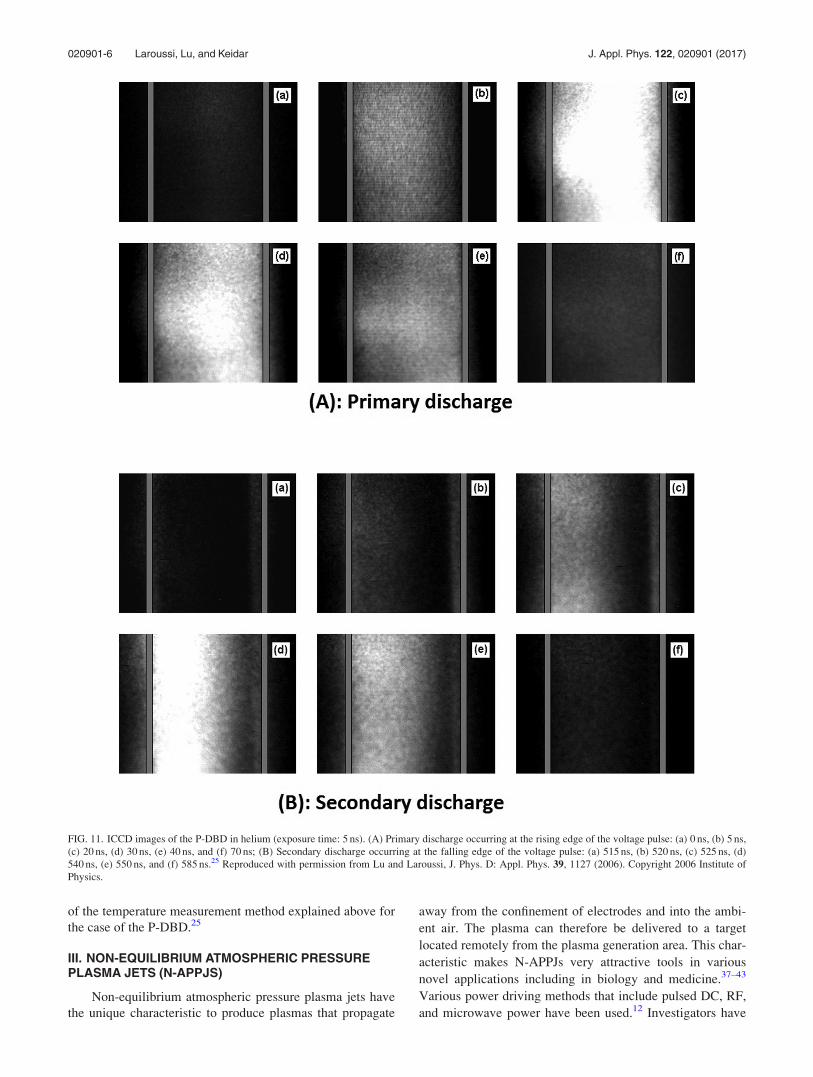
equilibrium nature. Figures 7 and 8 show plots of the EEDF
for a sinusoidal and pulsed DBD, respectively.
Pulsed Dielectric Barrier Discharges (P-DBD) in xenon
(pressure range 100–400 Torr) using a grid electrode config-
uration and in the helium/air mixture at atmospheric pressure
with a planar electrode geometry were reported.22,24,25 At
FIG. 4. ICCD images of a DBD in N2. (a) Diffuse discharge; (b)
Filamentary discharge. Exposure time: 10 ns.32 Reproduced with permission
from Gherardi et al., Plasma Sources Sci. Technol. 9, 340 (2000). Copyright
2000 Institute of Physics.
FIG. 5. Circuit allowing the measurement of the power dissipated by a
DBD.
FIG. 6. Lissajous plot for a DBD allowing the calculation of the dissipated
power in the discharge.
020901-4 Laroussi, Lu, and Keidar J. Appl. Phys. 122, 020901 (2017)
atmospheric pressure, the P-DBD generated large volume dif-
fuse plasma in atmospheric pressure He, He/O2, He/air, or He/
N2 mixture. The discharge was driven by sub-microsecond
unipolar square pulses. Figure 9 shows a photograph of the
discharge when helium is used as the operating gas. These
investigators reported that two discharges occur for every
applied voltage pulse.24 The first discharge (or “primary” dis-
charge) was ignited at the rising edge of the applied voltage
pulse, while the second discharge (or “secondary” discharge)
was self-ignited during the falling edge of the applied voltage
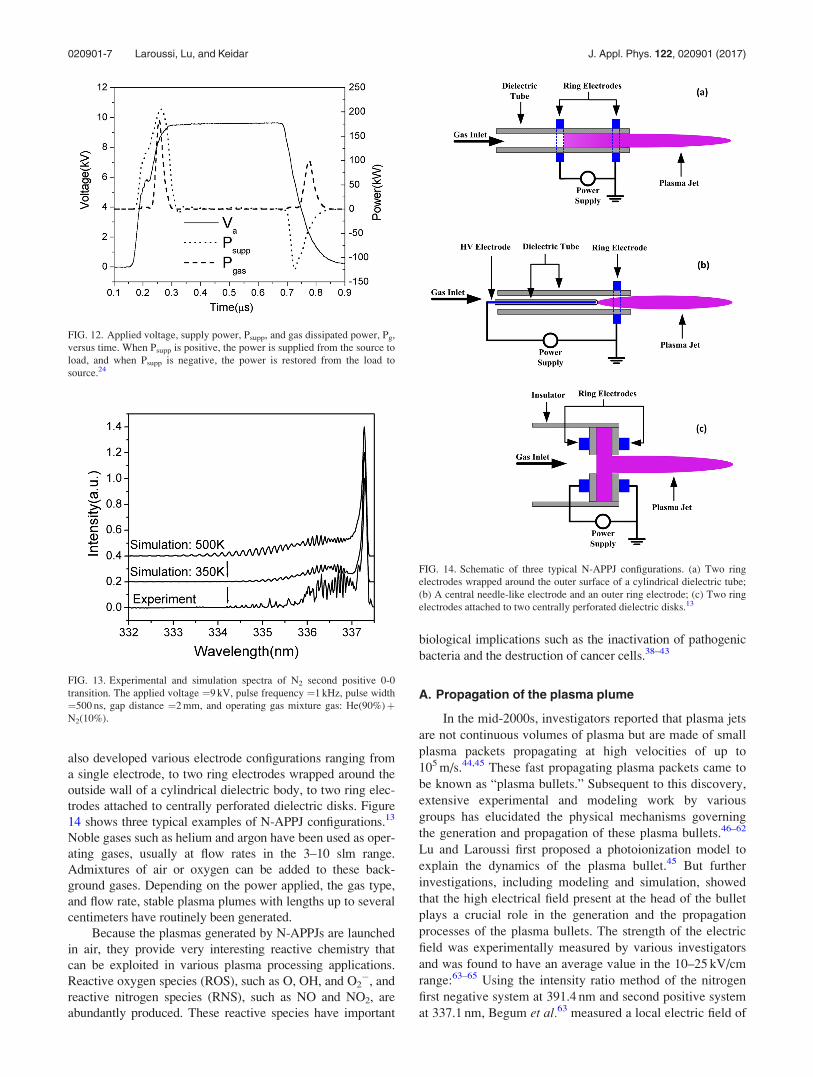
pulse. Figure 10 shows the I-V characteristics of the dis-
charge, and Fig. 11 shows ICCD images of the onset of the
primary and secondary discharge.25
The power supplied to the discharge as well as the power
dissipated/absorbed by the plasma can be calculated from the I-
V characteristics. Figure 12 shows the total power supplied by
the power supply, Psupp, and the power dissipated in the plasma,
Pgas.24 Psupp is the product of the total current, Itot, and the
applied voltage, Va. Pgas is the product of the discharge current
Idischarge (Idischarge¼ Itot – IDisplacement) and the voltage across the
gas, Vg. During the rising front of the applied voltage, Psupp
includes both the power dissipated in the plasma and the reactive
power stored in the various system capacitors. The negative sign
of Psupp represents a power returned to the power source. The
curve representing Pgas shows the power dissipated in the plasma
during the primary and the secondary discharge. It is of impor-
tance to note here that the secondary discharge occurs without
any power contribution from the external power supply.24
The gas temperature in the pulsed DBD was estimated
by analyzing the rotational structure of the N2 second posi-
tive system emission and was found to be around 350 K. The
N2 rotational structure contains information on the rotational
temperature. Because of the low energies needed for rota-
tional excitation and the short transition times, molecules in
the rotational states and the neutral gas molecules are in
equilibrium. Therefore, the gas temperature can be directly
inferred from the rotational temperature. To determine the
gas temperature, the experimentally measured spectra are
compared with simulated spectra of the 0–0 band of the sec-
ond positive system of nitrogen. Figure 13 is an illustration
FIG. 7. Electron energy distribution function for a DBD driven by 3 kHz
sinusoidal voltage (gas: air).
FIG. 8. Electron energy distribution function for a DBD driven by repetitive
500 ns high voltage pulses; gas is dry air (Courtesy: V. Kolobov).
FIG. 9. Photograph of a diffuse P-DBD discharge. Gas: helium; Pulse width:
500 ns; Rep rate: 5 kHz.
FIG. 10. Current-voltage characteristics of a P-DBD in helium.24
020901-5 Laroussi, Lu, and Keidar J. Appl. Phys. 122, 020901 (2017)
of the temperature measurement method explained above for
the case of the P-DBD.25
III. NON-EQUILIBRIUM ATMOSPHERIC PRESSUREPLASMA JETS (N-APPJS)
Non-equilibrium atmospheric pressure plasma jets have
the unique characteristic to produce plasmas that propagate
away from the confinement of electrodes and into the ambi-
ent air. The plasma can therefore be delivered to a target
located remotely from the plasma generation area. This char-
acteristic makes N-APPJs very attractive tools in various
novel applications including in biology and medicine.37–43
Various power driving methods that include pulsed DC, RF,
and microwave power have been used.12 Investigators have
FIG. 11. ICCD images of the P-DBD in helium (exposure time: 5 ns). (A) Primary discharge occurring at the rising edge of the voltage pulse: (a) 0 ns, (b) 5 ns,
(c) 20 ns, (d) 30 ns, (e) 40 ns, and (f) 70 ns; (B) Secondary discharge occurring at the falling edge of the voltage pulse: (a) 515 ns, (b) 520 ns, (c) 525 ns, (d)
540 ns, (e) 550 ns, and (f) 585 ns.25 Reproduced with permission from Lu and Laroussi, J. Phys. D: Appl. Phys. 39, 1127 (2006). Copyright 2006 Institute of
Physics.
020901-6 Laroussi, Lu, and Keidar J. Appl. Phys. 122, 020901 (2017)
also developed various electrode configurations ranging from
a single electrode, to two ring electrodes wrapped around the
outside wall of a cylindrical dielectric body, to two ring elec-
trodes attached to centrally perforated dielectric disks. Figure
14 shows three typical examples of N-APPJ configurations.13
Noble gases such as helium and argon have been used as oper-
ating gases, usually at flow rates in the 3–10 slm range.
Admixtures of air or oxygen can be added to these back-
ground gases. Depending on the power applied, the gas type,
and flow rate, stable plasma plumes with lengths up to several
centimeters have routinely been generated.
Because the plasmas generated by N-APPJs are launched
in air, they provide very interesting reactive chemistry that
can be exploited in various plasma processing applications.
Reactive oxygen species (ROS), such as O, OH, and O2�, and
reactive nitrogen species (RNS), such as NO and NO2, are
abundantly produced. These reactive species have important
biological implications such as the inactivation of pathogenic
bacteria and the destruction of cancer cells.38–43
A. Propagation of the plasma plume
In the mid-2000s, investigators reported that plasma jets
are not continuous volumes of plasma but are made of small
plasma packets propagating at high velocities of up to
105 m/s.44,45 These fast propagating plasma packets came to
be known as “plasma bullets.” Subsequent to this discovery,
extensive experimental and modeling work by various
groups has elucidated the physical mechanisms governing
the generation and propagation of these plasma bullets.46–62
Lu and Laroussi first proposed a photoionization model to
explain the dynamics of the plasma bullet.45 But further
investigations, including modeling and simulation, showed
that the high electrical field present at the head of the bullet
plays a crucial role in the generation and the propagation
processes of the plasma bullets. The strength of the electric
field was experimentally measured by various investigators
and was found to have an average value in the 10–25 kV/cm
range:63–65 Using the intensity ratio method of the nitrogen
first negative system at 391.4 nm and second positive system
at 337.1 nm, Begum et al.63 measured a local electric field of
FIG. 12. Applied voltage, supply power, Psupp, and gas dissipated power, Pg,
versus time. When Psupp is positive, the power is supplied from the source to
load, and when Psupp is negative, the power is restored from the load to
source.24
FIG. 13. Experimental and simulation spectra of N2 second positive 0-0
transition. The applied voltage ¼9 kV, pulse frequency ¼1 kHz, pulse width
¼500 ns, gap distance ¼2 mm, and operating gas mixture gas: He(90%)þN2(10%).
FIG. 14. Schematic of three typical N-APPJ configurations. (a) Two ring
electrodes wrapped around the outer surface of a cylindrical dielectric tube;
(b) A central needle-like electrode and an outer ring electrode; (c) Two ring
electrodes attached to two centrally perforated dielectric disks.13
020901-7 Laroussi, Lu, and Keidar J. Appl. Phys. 122, 020901 (2017)
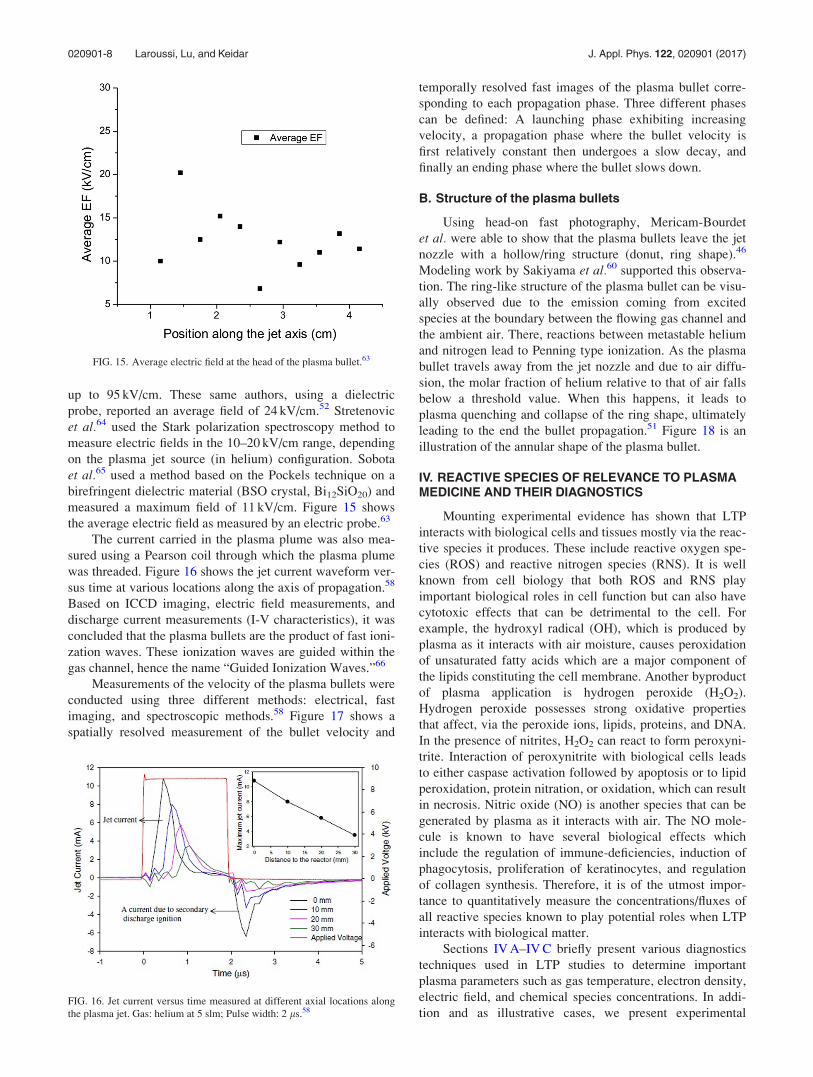
up to 95 kV/cm. These same authors, using a dielectric
probe, reported an average field of 24 kV/cm.52 Stretenovic
et al.64 used the Stark polarization spectroscopy method to
measure electric fields in the 10–20 kV/cm range, depending
on the plasma jet source (in helium) configuration. Sobota
et al.65 used a method based on the Pockels technique on a
birefringent dielectric material (BSO crystal, Bi12SiO20) and
measured a maximum field of 11 kV/cm. Figure 15 shows
the average electric field as measured by an electric probe.63
The current carried in the plasma plume was also mea-
sured using a Pearson coil through which the plasma plume
was threaded. Figure 16 shows the jet current waveform ver-
sus time at various locations along the axis of propagation.58
Based on ICCD imaging, electric field measurements, and
discharge current measurements (I-V characteristics), it was
concluded that the plasma bullets are the product of fast ioni-
zation waves. These ionization waves are guided within the
gas channel, hence the name “Guided Ionization Waves.”66
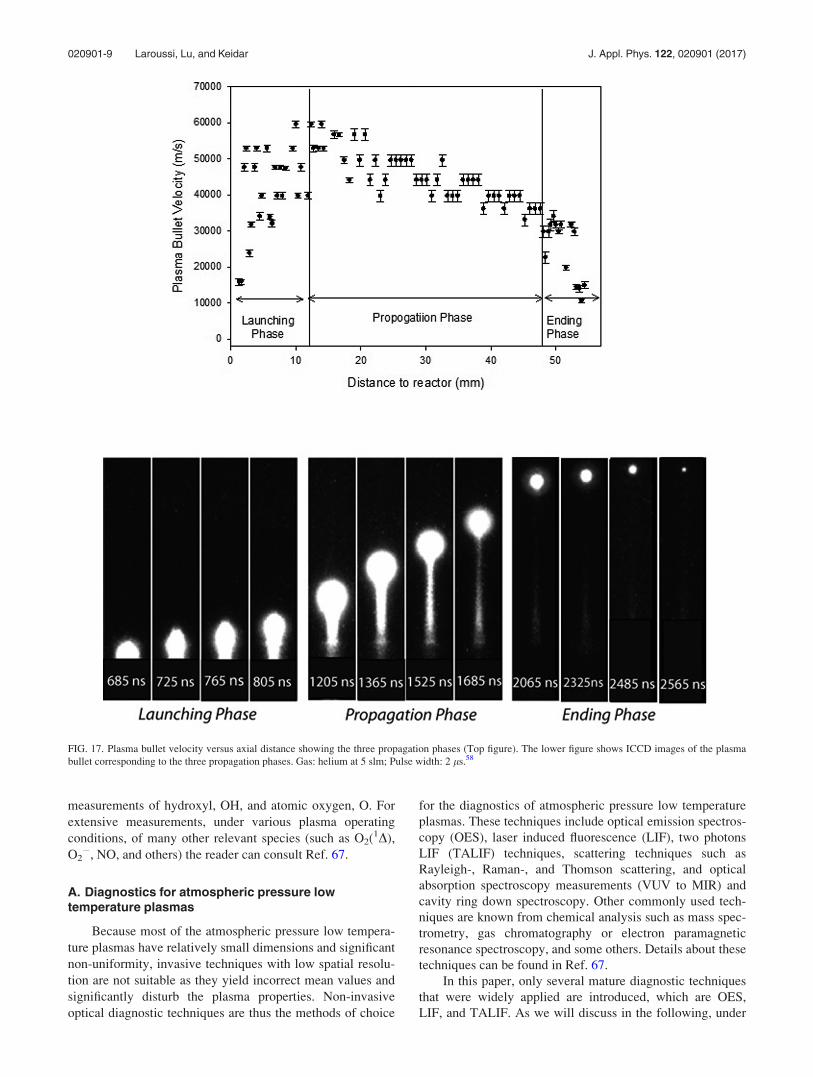
Measurements of the velocity of the plasma bullets were
conducted using three different methods: electrical, fast
imaging, and spectroscopic methods.58 Figure 17 shows a
spatially resolved measurement of the bullet velocity and
temporally resolved fast images of the plasma bullet corre-
sponding to each propagation phase. Three different phases
can be defined: A launching phase exhibiting increasing
velocity, a propagation phase where the bullet velocity is
first relatively constant then undergoes a slow decay, and
finally an ending phase where the bullet slows down.
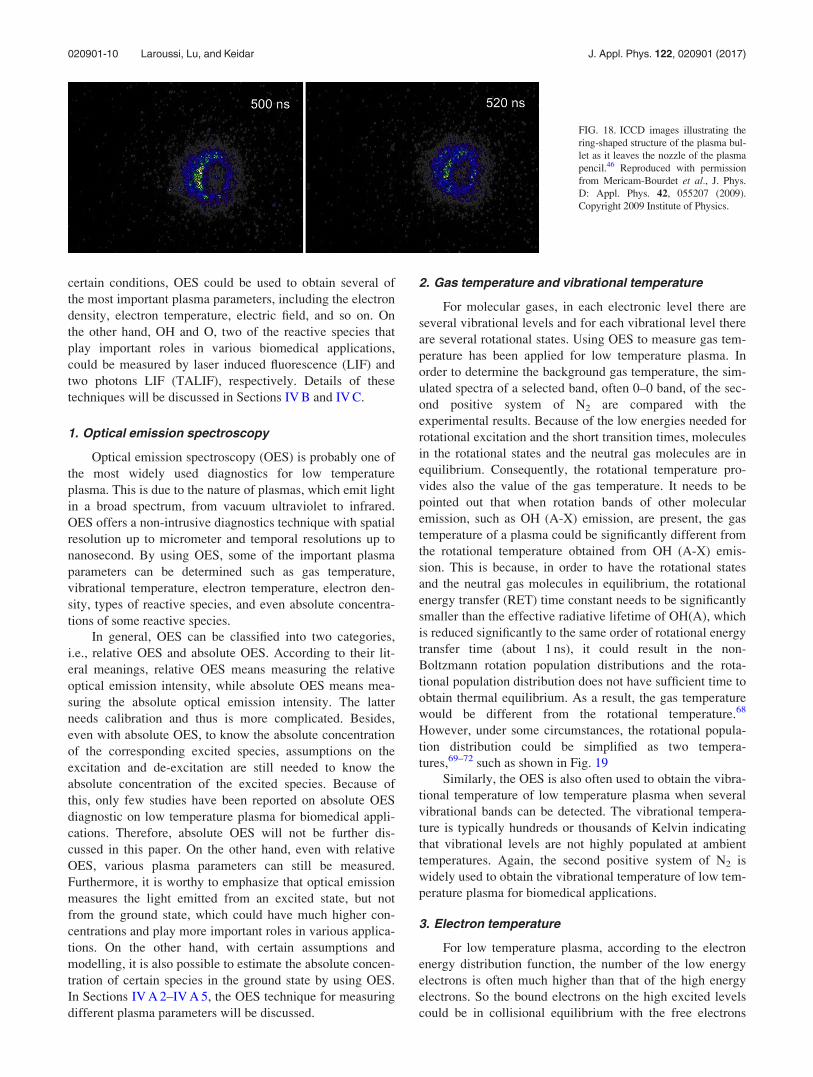
B. Structure of the plasma bullets
Using head-on fast photography, Mericam-Bourdet
et al. were able to show that the plasma bullets leave the jet
nozzle with a hollow/ring structure (donut, ring shape).46
Modeling work by Sakiyama et al.60 supported this observa-
tion. The ring-like structure of the plasma bullet can be visu-
ally observed due to the emission coming from excited
species at the boundary between the flowing gas channel and
the ambient air. There, reactions between metastable helium
and nitrogen lead to Penning type ionization. As the plasma
bullet travels away from the jet nozzle and due to air diffu-
sion, the molar fraction of helium relative to that of air falls
below a threshold value. When this happens, it leads to
plasma quenching and collapse of the ring shape, ultimately
leading to the end the bullet propagation.51 Figure 18 is an
illustration of the annular shape of the plasma bullet.
IV. REACTIVE SPECIES OF RELEVANCE TO PLASMAMEDICINE AND THEIR DIAGNOSTICS
Mounting experimental evidence has shown that LTP
interacts with biological cells and tissues mostly via the reac-
tive species it produces. These include reactive oxygen spe-
cies (ROS) and reactive nitrogen species (RNS). It is well
known from cell biology that both ROS and RNS play
important biological roles in cell function but can also have
cytotoxic effects that can be detrimental to the cell. For
example, the hydroxyl radical (OH), which is produced by
plasma as it interacts with air moisture, causes peroxidation
of unsaturated fatty acids which are a major component of
the lipids constituting the cell membrane. Another byproduct
of plasma application is hydrogen peroxide (H2O2).
Hydrogen peroxide possesses strong oxidative properties
that affect, via the peroxide ions, lipids, proteins, and DNA.
In the presence of nitrites, H2O2 can react to form peroxyni-
trite. Interaction of peroxynitrite with biological cells leads
to either caspase activation followed by apoptosis or to lipid
peroxidation, protein nitration, or oxidation, which can result
in necrosis. Nitric oxide (NO) is another species that can be
generated by plasma as it interacts with air. The NO mole-
cule is known to have several biological effects which
include the regulation of immune-deficiencies, induction of
phagocytosis, proliferation of keratinocytes, and regulation
of collagen synthesis. Therefore, it is of the utmost impor-
tance to quantitatively measure the concentrations/fluxes of
all reactive species known to play potential roles when LTP
interacts with biological matter.
Sections IV A–IV C briefly present various diagnostics
techniques used in LTP studies to determine important
plasma parameters such as gas temperature, electron density,
electric field, and chemical species concentrations. In addi-
tion and as illustrative cases, we present experimental
FIG. 15. Average electric field at the head of the plasma bullet.63
FIG. 16. Jet current versus time measured at different axial locations along
the plasma jet. Gas: helium at 5 slm; Pulse width: 2 ls.58
020901-8 Laroussi, Lu, and Keidar J. Appl. Phys. 122, 020901 (2017)
measurements of hydroxyl, OH, and atomic oxygen, O. For
extensive measurements, under various plasma operating
conditions, of many other relevant species (such as O2(1D),
O2�, NO, and others) the reader can consult Ref. 67.
A. Diagnostics for atmospheric pressure lowtemperature plasmas
Because most of the atmospheric pressure low tempera-
ture plasmas have relatively small dimensions and significant
non-uniformity, invasive techniques with low spatial resolu-
tion are not suitable as they yield incorrect mean values and
significantly disturb the plasma properties. Non-invasive
optical diagnostic techniques are thus the methods of choice
for the diagnostics of atmospheric pressure low temperature
plasmas. These techniques include optical emission spectros-
copy (OES), laser induced fluorescence (LIF), two photons
LIF (TALIF) techniques, scattering techniques such as
Rayleigh-, Raman-, and Thomson scattering, and optical
absorption spectroscopy measurements (VUV to MIR) and
cavity ring down spectroscopy. Other commonly used tech-
niques are known from chemical analysis such as mass spec-
trometry, gas chromatography or electron paramagnetic
resonance spectroscopy, and some others. Details about these
techniques can be found in Ref. 67.
In this paper, only several mature diagnostic techniques
that were widely applied are introduced, which are OES,
LIF, and TALIF. As we will discuss in the following, under
FIG. 17. Plasma bullet velocity versus axial distance showing the three propagation phases (Top figure). The lower figure shows ICCD images of the plasma
bullet corresponding to the three propagation phases. Gas: helium at 5 slm; Pulse width: 2 ls.58
020901-9 Laroussi, Lu, and Keidar J. Appl. Phys. 122, 020901 (2017)
certain conditions, OES could be used to obtain several of
the most important plasma parameters, including the electron
density, electron temperature, electric field, and so on. On
the other hand, OH and O, two of the reactive species that
play important roles in various biomedical applications,
could be measured by laser induced fluorescence (LIF) and
two photons LIF (TALIF), respectively. Details of these
techniques will be discussed in Sections IV B and IV C.
1. Optical emission spectroscopy
Optical emission spectroscopy (OES) is probably one of
the most widely used diagnostics for low temperature
plasma. This is due to the nature of plasmas, which emit light
in a broad spectrum, from vacuum ultraviolet to infrared.
OES offers a non-intrusive diagnostics technique with spatial
resolution up to micrometer and temporal resolutions up to
nanosecond. By using OES, some of the important plasma
parameters can be determined such as gas temperature,
vibrational temperature, electron temperature, electron den-
sity, types of reactive species, and even absolute concentra-
tions of some reactive species.
In general, OES can be classified into two categories,
i.e., relative OES and absolute OES. According to their lit-
eral meanings, relative OES means measuring the relative
optical emission intensity, while absolute OES means mea-
suring the absolute optical emission intensity. The latter
needs calibration and thus is more complicated. Besides,
even with absolute OES, to know the absolute concentration
of the corresponding excited species, assumptions on the
excitation and de-excitation are still needed to know the
absolute concentration of the excited species. Because of
this, only few studies have been reported on absolute OES
diagnostic on low temperature plasma for biomedical appli-
cations. Therefore, absolute OES will not be further dis-
cussed in this paper. On the other hand, even with relative
OES, various plasma parameters can still be measured.
Furthermore, it is worthy to emphasize that optical emission
measures the light emitted from an excited state, but not
from the ground state, which could have much higher con-
centrations and play more important roles in various applica-
tions. On the other hand, with certain assumptions and
modelling, it is also possible to estimate the absolute concen-
tration of certain species in the ground state by using OES.
In Sections IV A 2–IV A 5, the OES technique for measuring
different plasma parameters will be discussed.
2. Gas temperature and vibrational temperature
For molecular gases, in each electronic level there are
several vibrational levels and for each vibrational level there
are several rotational states. Using OES to measure gas tem-
perature has been applied for low temperature plasma. In
order to determine the background gas temperature, the sim-
ulated spectra of a selected band, often 0–0 band, of the sec-
ond positive system of N2 are compared with the
experimental results. Because of the low energies needed for
rotational excitation and the short transition times, molecules
in the rotational states and the neutral gas molecules are in
equilibrium. Consequently, the rotational temperature pro-
vides also the value of the gas temperature. It needs to be
pointed out that when rotation bands of other molecular
emission, such as OH (A-X) emission, are present, the gas
temperature of a plasma could be significantly different from
the rotational temperature obtained from OH (A-X) emis-
sion. This is because, in order to have the rotational states
and the neutral gas molecules in equilibrium, the rotational
energy transfer (RET) time constant needs to be significantly
smaller than the effective radiative lifetime of OH(A), which
is reduced significantly to the same order of rotational energy
transfer time (about 1 ns), it could result in the non-
Boltzmann rotation population distributions and the rota-
tional population distribution does not have sufficient time to
obtain thermal equilibrium. As a result, the gas temperature
would be different from the rotational temperature.68
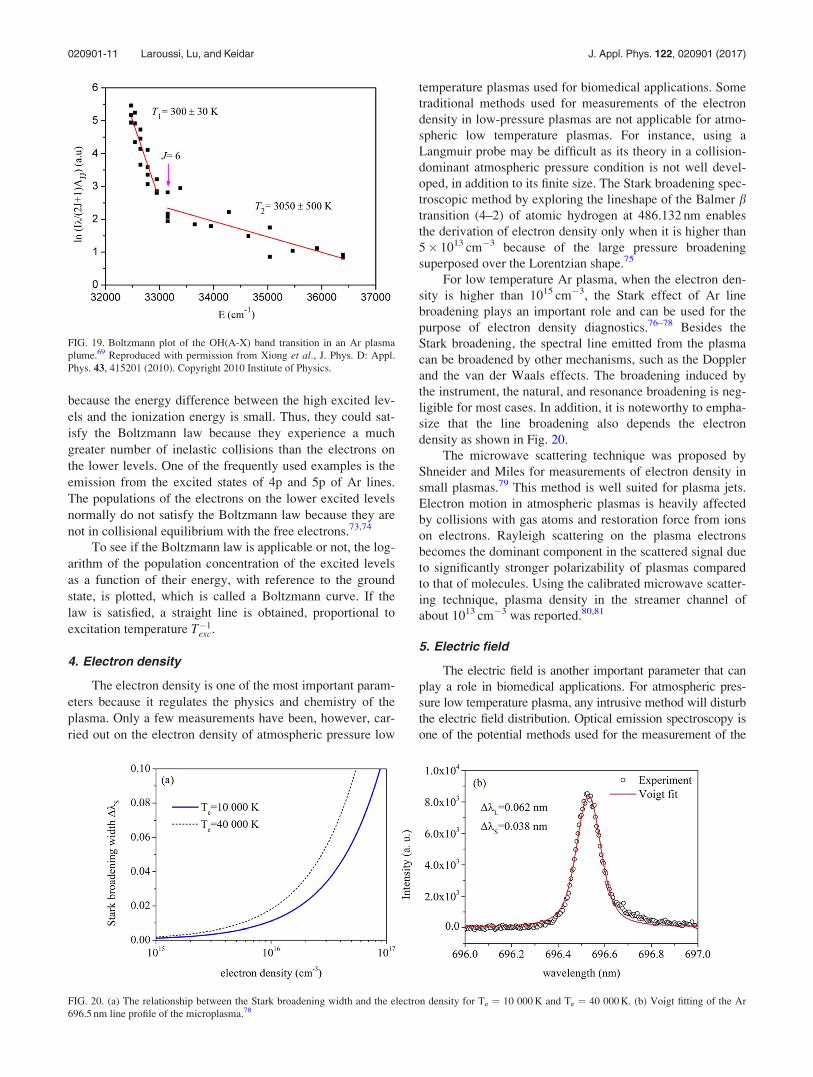
However, under some circumstances, the rotational popula-
tion distribution could be simplified as two tempera-
tures,69–72 such as shown in Fig. 19
Similarly, the OES is also often used to obtain the vibra-
tional temperature of low temperature plasma when several
vibrational bands can be detected. The vibrational tempera-
ture is typically hundreds or thousands of Kelvin indicating
that vibrational levels are not highly populated at ambient
temperatures. Again, the second positive system of N2 is
widely used to obtain the vibrational temperature of low tem-
perature plasma for biomedical applications.
3. Electron temperature
For low temperature plasma, according to the electron
energy distribution function, the number of the low energy
electrons is often much higher than that of the high energy
electrons. So the bound electrons on the high excited levels
could be in collisional equilibrium with the free electrons
FIG. 18. ICCD images illustrating the
ring-shaped structure of the plasma bul-
let as it leaves the nozzle of the plasma
pencil.46 Reproduced with permission
from Mericam-Bourdet et al., J. Phys.
D: Appl. Phys. 42, 055207 (2009).
Copyright 2009 Institute of Physics.
020901-10 Laroussi, Lu, and Keidar J. Appl. Phys. 122, 020901 (2017)
because the energy difference between the high excited lev-
els and the ionization energy is small. Thus, they could sat-
isfy the Boltzmann law because they experience a much
greater number of inelastic collisions than the electrons on
the lower levels. One of the frequently used examples is the
emission from the excited states of 4p and 5p of Ar lines.
The populations of the electrons on the lower excited levels
normally do not satisfy the Boltzmann law because they are
not in collisional equilibrium with the free electrons.73,74
To see if the Boltzmann law is applicable or not, the log-
arithm of the population concentration of the excited levels
as a function of their energy, with reference to the ground
state, is plotted, which is called a Boltzmann curve. If the
law is satisfied, a straight line is obtained, proportional to
excitation temperature T�1exc.
4. Electron density
The electron density is one of the most important param-
eters because it regulates the physics and chemistry of the
plasma. Only a few measurements have been, however, car-
ried out on the electron density of atmospheric pressure low
temperature plasmas used for biomedical applications. Some
traditional methods used for measurements of the electron
density in low-pressure plasmas are not applicable for atmo-
spheric low temperature plasmas. For instance, using a
Langmuir probe may be difficult as its theory in a collision-
dominant atmospheric pressure condition is not well devel-
oped, in addition to its finite size. The Stark broadening spec-
troscopic method by exploring the lineshape of the Balmer btransition (4–2) of atomic hydrogen at 486.132 nm enables
the derivation of electron density only when it is higher than
5� 1013 cm�3 because of the large pressure broadening
superposed over the Lorentzian shape.75
For low temperature Ar plasma, when the electron den-
sity is higher than 1015 cm�3, the Stark effect of Ar line
broadening plays an important role and can be used for the
purpose of electron density diagnostics.76–78 Besides the
Stark broadening, the spectral line emitted from the plasma
can be broadened by other mechanisms, such as the Doppler
and the van der Waals effects. The broadening induced by
the instrument, the natural, and resonance broadening is neg-
ligible for most cases. In addition, it is noteworthy to empha-
size that the line broadening also depends the electron
density as shown in Fig. 20.
The microwave scattering technique was proposed by
Shneider and Miles for measurements of electron density in
small plasmas.79 This method is well suited for plasma jets.
Electron motion in atmospheric plasmas is heavily affected
by collisions with gas atoms and restoration force from ions
on electrons. Rayleigh scattering on the plasma electrons
becomes the dominant component in the scattered signal due
to significantly stronger polarizability of plasmas compared
to that of molecules. Using the calibrated microwave scatter-
ing technique, plasma density in the streamer channel of
about 1013 cm�3 was reported.80,81
5. Electric field
The electric field is another important parameter that can
play a role in biomedical applications. For atmospheric pres-
sure low temperature plasma, any intrusive method will disturb
the electric field distribution. Optical emission spectroscopy is
one of the potential methods used for the measurement of the
FIG. 19. Boltzmann plot of the OH(A-X) band transition in an Ar plasma
plume.69 Reproduced with permission from Xiong et al., J. Phys. D: Appl.
Phys. 43, 415201 (2010). Copyright 2010 Institute of Physics.
FIG. 20. (a) The relationship between the Stark broadening width and the electron density for Te ¼ 10 000 K and Te ¼ 40 000 K. (b) Voigt fitting of the Ar
696.5 nm line profile of the microplasma.78
020901-11 Laroussi, Lu, and Keidar J. Appl. Phys. 122, 020901 (2017)
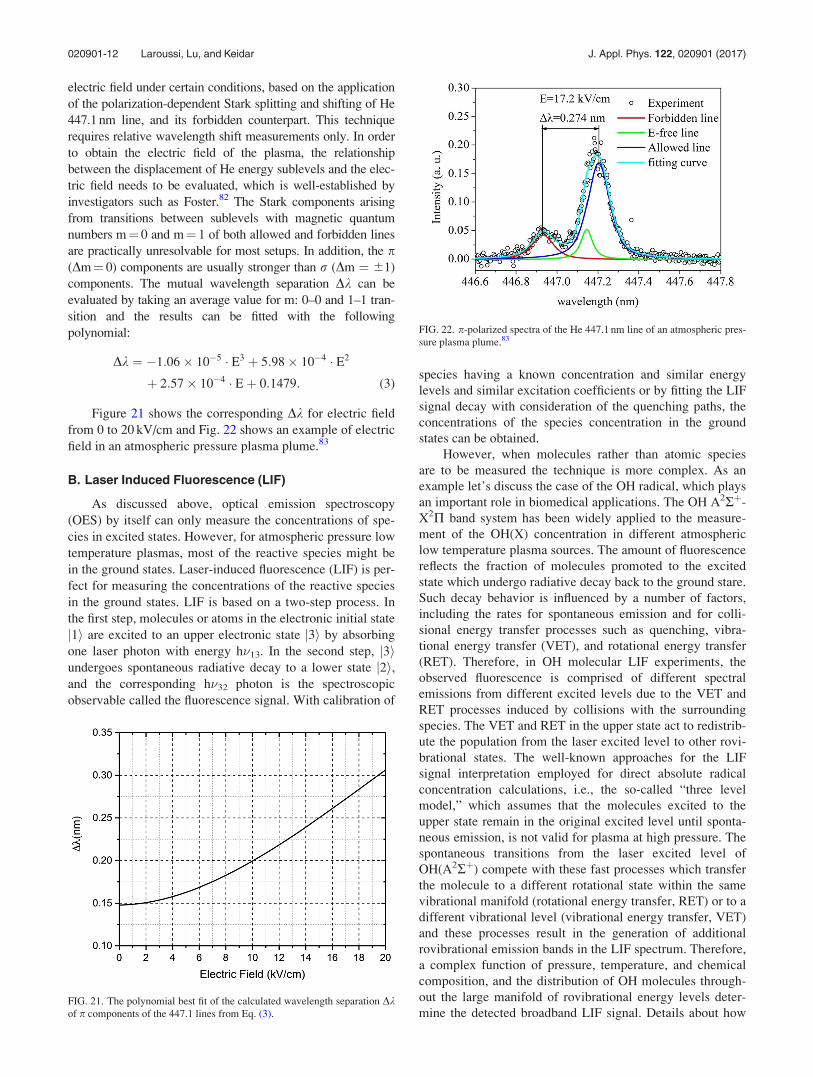
electric field under certain conditions, based on the application
of the polarization-dependent Stark splitting and shifting of He
447.1 nm line, and its forbidden counterpart. This technique
requires relative wavelength shift measurements only. In order
to obtain the electric field of the plasma, the relationship
between the displacement of He energy sublevels and the elec-
tric field needs to be evaluated, which is well-established by
investigators such as Foster.82 The Stark components arising
from transitions between sublevels with magnetic quantum
numbers m¼ 0 and m¼ 1 of both allowed and forbidden lines
are practically unresolvable for most setups. In addition, the p(Dm¼ 0) components are usually stronger than r (Dm ¼ 61)
components. The mutual wavelength separation Dk can be
evaluated by taking an average value for m: 0–0 and 1–1 tran-
sition and the results can be fitted with the following
polynomial:
Dk ¼ �1:06� 10�5 � E3 þ 5:98� 10�4 � E2
þ 2:57� 10�4 � Eþ 0:1479: (3)
Figure 21 shows the corresponding Dk for electric field
from 0 to 20 kV/cm and Fig. 22 shows an example of electric
field in an atmospheric pressure plasma plume.83
B. Laser Induced Fluorescence (LIF)
As discussed above, optical emission spectroscopy
(OES) by itself can only measure the concentrations of spe-
cies in excited states. However, for atmospheric pressure low
temperature plasmas, most of the reactive species might be
in the ground states. Laser-induced fluorescence (LIF) is per-
fect for measuring the concentrations of the reactive species
in the ground states. LIF is based on a two-step process. In
the first step, molecules or atoms in the electronic initial state
j1i are excited to an upper electronic state j3i by absorbing
one laser photon with energy h�13. In the second step, j3iundergoes spontaneous radiative decay to a lower state j2i,and the corresponding h�32 photon is the spectroscopic
observable called the fluorescence signal. With calibration of
species having a known concentration and similar energy
levels and similar excitation coefficients or by fitting the LIF
signal decay with consideration of the quenching paths, the
concentrations of the species concentration in the ground
states can be obtained.
However, when molecules rather than atomic species
are to be measured the technique is more complex. As an
example let’s discuss the case of the OH radical, which plays
an important role in biomedical applications. The OH A2Rþ-
X2P band system has been widely applied to the measure-
ment of the OH(X) concentration in different atmospheric
low temperature plasma sources. The amount of fluorescence
reflects the fraction of molecules promoted to the excited
state which undergo radiative decay back to the ground stare.
Such decay behavior is influenced by a number of factors,
including the rates for spontaneous emission and for colli-
sional energy transfer processes such as quenching, vibra-
tional energy transfer (VET), and rotational energy transfer
(RET). Therefore, in OH molecular LIF experiments, the
observed fluorescence is comprised of different spectral
emissions from different excited levels due to the VET and
RET processes induced by collisions with the surrounding
species. The VET and RET in the upper state act to redistrib-
ute the population from the laser excited level to other rovi-
brational states. The well-known approaches for the LIF
signal interpretation employed for direct absolute radical
concentration calculations, i.e., the so-called “three level
model,” which assumes that the molecules excited to the
upper state remain in the original excited level until sponta-
neous emission, is not valid for plasma at high pressure. The
spontaneous transitions from the laser excited level of
OH(A2Rþ) compete with these fast processes which transfer
the molecule to a different rotational state within the same
vibrational manifold (rotational energy transfer, RET) or to a
different vibrational level (vibrational energy transfer, VET)
and these processes result in the generation of additional
rovibrational emission bands in the LIF spectrum. Therefore,
a complex function of pressure, temperature, and chemical
composition, and the distribution of OH molecules through-
out the large manifold of rovibrational energy levels deter-
mine the detected broadband LIF signal. Details about howFIG. 21. The polynomial best fit of the calculated wavelength separation Dkof p components of the 447.1 lines from Eq. (3).
FIG. 22. p-polarized spectra of the He 447.1 nm line of an atmospheric pres-
sure plasma plume.83
020901-12 Laroussi, Lu, and Keidar J. Appl. Phys. 122, 020901 (2017)
to obtain the OH(X) concentration from LIF for atmospheric
pressure low temperature can be found in Refs. 84–91.
Furthermore, for atmospheric pressure plasma jet, one
of the widely used LTP sources for biomedical applications,
because of the gas flow, the OH loss mechanisms are even
more complicated than the static discharge (no gas flow)
because gas flow can blow the OH generated in the upstream
to the downstream thus resulting in the redistribution of the
OH radicals.
As shown in Fig. 23, when the gas flow effect is consid-
ered in the model, a better fit between the experimental data
and the simulated decay curve can be achieved when the ini-
tial OH density is 2.4� 1013 cm�3. According to Fig. 5, it
can be concluded that the OH lifetime under those experi-
mental conditions is on the order of millisecond. Because of
this relatively longer lifetime, the OH concentration should
increase after each discharge pulse after the first discharge
and saturate after a certain number of pulses.
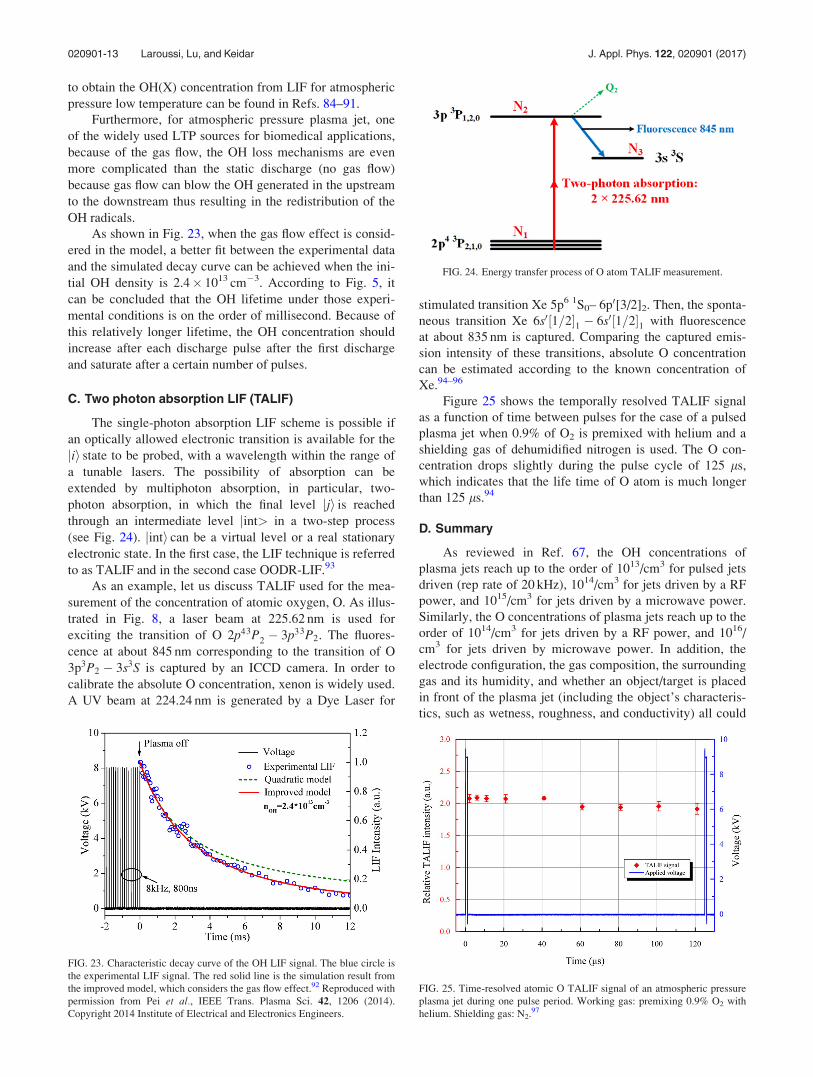
C. Two photon absorption LIF (TALIF)
The single-photon absorption LIF scheme is possible if
an optically allowed electronic transition is available for the
jii state to be probed, with a wavelength within the range of
a tunable lasers. The possibility of absorption can be
extended by multiphoton absorption, in particular, two-
photon absorption, in which the final level jji is reached
through an intermediate level jint> in a two-step process
(see Fig. 24). jinti can be a virtual level or a real stationary
electronic state. In the first case, the LIF technique is referred
to as TALIF and in the second case OODR-LIF.93
As an example, let us discuss TALIF used for the mea-
surement of the concentration of atomic oxygen, O. As illus-
trated in Fig. 8, a laser beam at 225.62 nm is used for
exciting the transition of O 2p43P2 � 3p33P2. The fluores-
cence at about 845 nm corresponding to the transition of O
3p3P2 � 3s3S is captured by an ICCD camera. In order to
calibrate the absolute O concentration, xenon is widely used.
A UV beam at 224.24 nm is generated by a Dye Laser for
stimulated transition Xe 5p6 1S0– 6p0[3/2]2. Then, the sponta-
neous transition Xe 6s0½1=2�1 � 6s0½1=2�1 with fluorescence
at about 835 nm is captured. Comparing the captured emis-
sion intensity of these transitions, absolute O concentration
can be estimated according to the known concentration of
Xe.94–96
Figure 25 shows the temporally resolved TALIF signal
as a function of time between pulses for the case of a pulsed
plasma jet when 0.9% of O2 is premixed with helium and a
shielding gas of dehumidified nitrogen is used. The O con-
centration drops slightly during the pulse cycle of 125 ls,
which indicates that the life time of O atom is much longer
than 125 ls.94
D. Summary
As reviewed in Ref. 67, the OH concentrations of
plasma jets reach up to the order of 1013/cm3 for pulsed jets
driven (rep rate of 20 kHz), 1014/cm3 for jets driven by a RF
power, and 1015/cm3 for jets driven by a microwave power.
Similarly, the O concentrations of plasma jets reach up to the
order of 1014/cm3 for jets driven by a RF power, and 1016/
cm3 for jets driven by microwave power. In addition, the
electrode configuration, the gas composition, the surrounding
gas and its humidity, and whether an object/target is placed
in front of the plasma jet (including the object’s characteris-
tics, such as wetness, roughness, and conductivity) all could
FIG. 23. Characteristic decay curve of the OH LIF signal. The blue circle is
the experimental LIF signal. The red solid line is the simulation result from
the improved model, which considers the gas flow effect.92 Reproduced with
permission from Pei et al., IEEE Trans. Plasma Sci. 42, 1206 (2014).
Copyright 2014 Institute of Electrical and Electronics Engineers.
FIG. 24. Energy transfer process of O atom TALIF measurement.
FIG. 25. Time-resolved atomic O TALIF signal of an atmospheric pressure
plasma jet during one pulse period. Working gas: premixing 0.9% O2 with
helium. Shielding gas: N2.97
020901-13 Laroussi, Lu, and Keidar J. Appl. Phys. 122, 020901 (2017)
affect significantly the reactive species distributions and
concentrations.
V. BIOMEDICAL APPLICATIONS OF ATMOSPHERICPRESSURE LOW TEMPERATURE PLASMAS
The unique chemical and physical properties of LTP
technology have enabled its recent biomedical applications
including sterilization, polymer material preparation, wound
healing, tissue or cellular removal, dental treatment, and can-
cer therapy. It is becoming increasingly evident that the
advantages of LTP are due to the production and efficient
delivery of reactive oxygen and nitrogen species, RONS,
analogous to those naturally produced by cells.27,40,98–100
Thus, LTP is capable of gentle non-thermal modification of
the radical balance in cells leading to apoptosis rather than
necrosis. In Sections V A–V E, brief reviews of select appli-
cations of LTP in biology and medicine are presented, start-
ing with cancer applications which are experiencing
remarkable advances.
A. LTP in cancer therapy
Recent research indicates that LTP selectively eradicates
brain tumor cancer cells in vitro without damaging normal
cells and significantly reduces tumor size in vivo. These
results indicate that LTP can lead to a new paradigm in can-
cer therapy by offering a minimally invasive surgery tech-
nique which allows specific cell removal without affecting
the entire surrounding tissue. Reactive oxygen and nitrogen
species (ROS/RNS) metabolism and oxidative stress-
responsive genes are shown to be markedly regulated in
tumor cells in response to LTP treatment.101 It is envisioned
that this technology could be adapted for clinical use and
would fundamentally enhance treatment of brain tumors.
The main goal of anti-cancer therapies (“Holy Grail”) has
been to selectively kill cancer cells without damaging the
normal cells of that tissue, i.e., maximize the therapeutic out-
come for the cancer patients. Normal cells were shown to be
less sensitive to the effects of LTP treatment than cancer
cells, supporting the notion that LTP treatment is likely to
play a pivotal role as an anti-cancer therapeutic tool.
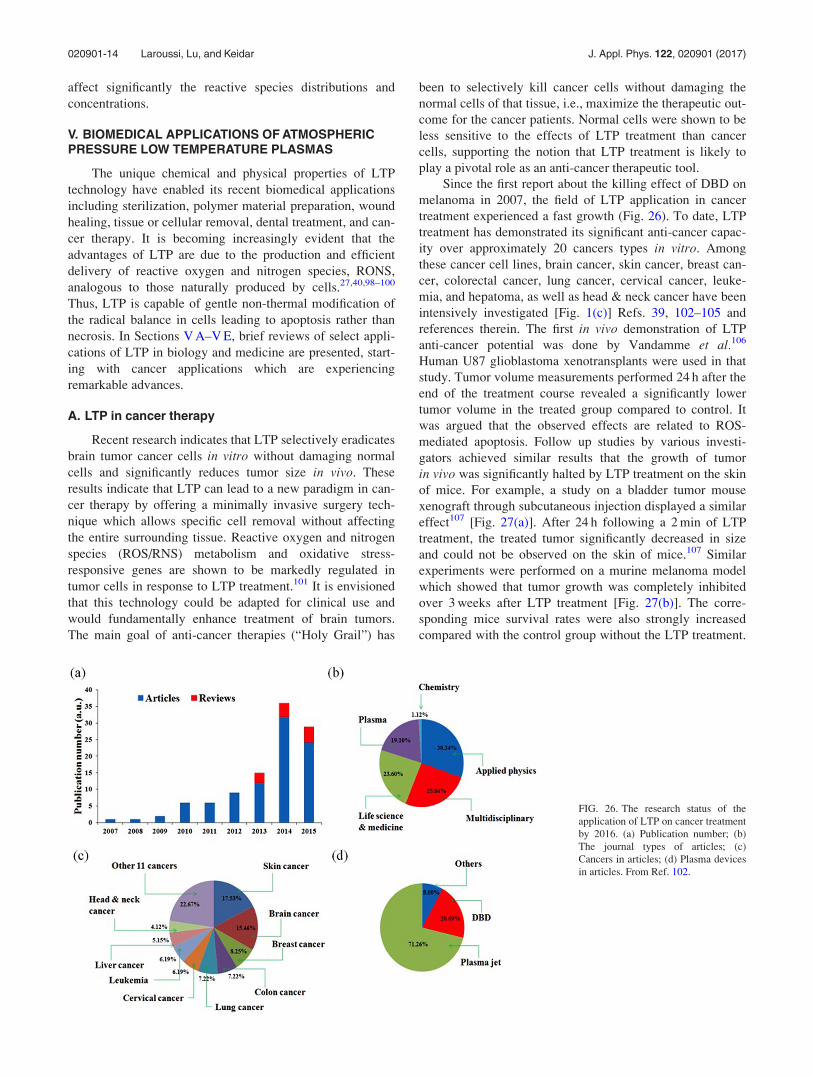
Since the first report about the killing effect of DBD on
melanoma in 2007, the field of LTP application in cancer
treatment experienced a fast growth (Fig. 26). To date, LTP
treatment has demonstrated its significant anti-cancer capac-
ity over approximately 20 cancers types in vitro. Among
these cancer cell lines, brain cancer, skin cancer, breast can-
cer, colorectal cancer, lung cancer, cervical cancer, leuke-
mia, and hepatoma, as well as head & neck cancer have been
intensively investigated [Fig. 1(c)] Refs. 39, 102–105 and
references therein. The first in vivo demonstration of LTP
anti-cancer potential was done by Vandamme et al.106
Human U87 glioblastoma xenotransplants were used in that
study. Tumor volume measurements performed 24 h after the
end of the treatment course revealed a significantly lower
tumor volume in the treated group compared to control. It
was argued that the observed effects are related to ROS-
mediated apoptosis. Follow up studies by various investi-
gators achieved similar results that the growth of tumor
in vivo was significantly halted by LTP treatment on the skin
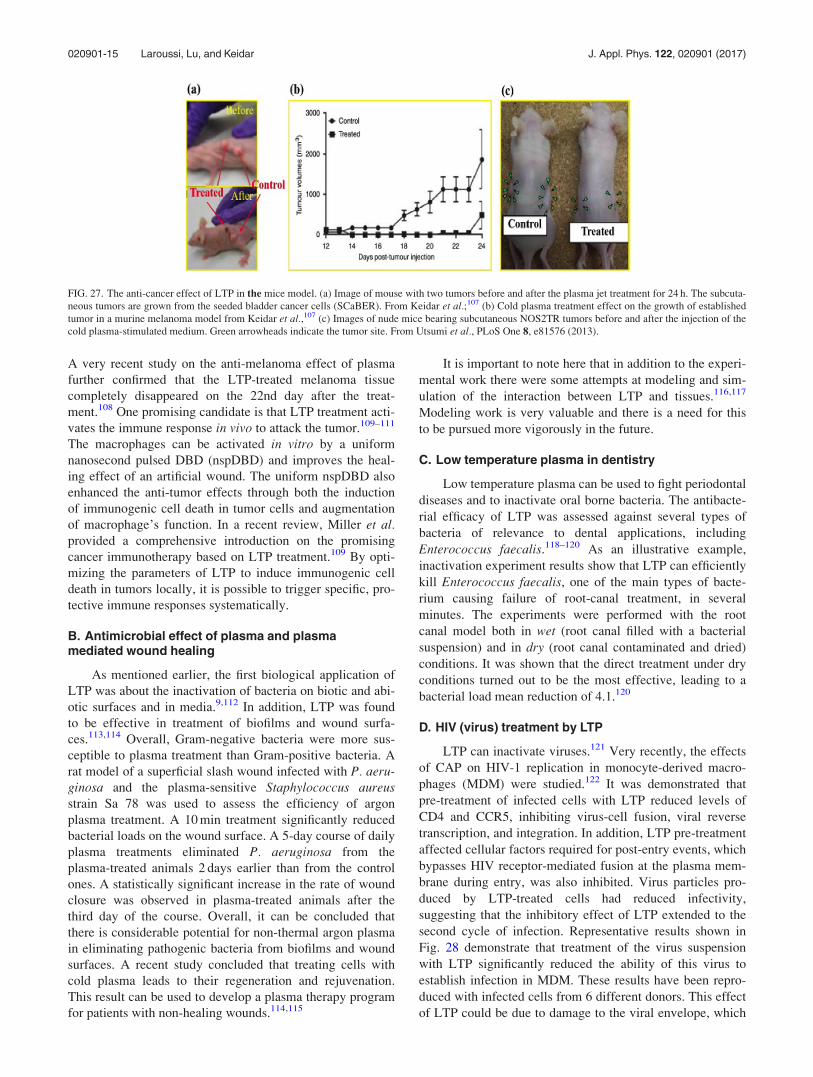
of mice. For example, a study on a bladder tumor mouse
xenograft through subcutaneous injection displayed a similar
effect107 [Fig. 27(a)]. After 24 h following a 2 min of LTP
treatment, the treated tumor significantly decreased in size
and could not be observed on the skin of mice.107 Similar
experiments were performed on a murine melanoma model
which showed that tumor growth was completely inhibited
over 3 weeks after LTP treatment [Fig. 27(b)]. The corre-
sponding mice survival rates were also strongly increased
compared with the control group without the LTP treatment.
FIG. 26. The research status of the
application of LTP on cancer treatment
by 2016. (a) Publication number; (b)
The journal types of articles; (c)
Cancers in articles; (d) Plasma devices
in articles. From Ref. 102.
020901-14 Laroussi, Lu, and Keidar J. Appl. Phys. 122, 020901 (2017)
A very recent study on the anti-melanoma effect of plasma
further confirmed that the LTP-treated melanoma tissue
completely disappeared on the 22nd day after the treat-
ment.108 One promising candidate is that LTP treatment acti-
vates the immune response in vivo to attack the tumor.109–111
The macrophages can be activated in vitro by a uniform
nanosecond pulsed DBD (nspDBD) and improves the heal-
ing effect of an artificial wound. The uniform nspDBD also
enhanced the anti-tumor effects through both the induction
of immunogenic cell death in tumor cells and augmentation
of macrophage’s function. In a recent review, Miller et al.provided a comprehensive introduction on the promising
cancer immunotherapy based on LTP treatment.109 By opti-
mizing the parameters of LTP to induce immunogenic cell
death in tumors locally, it is possible to trigger specific, pro-
tective immune responses systematically.
B. Antimicrobial effect of plasma and plasmamediated wound healing
As mentioned earlier, the first biological application of
LTP was about the inactivation of bacteria on biotic and abi-
otic surfaces and in media.9,112 In addition, LTP was found
to be effective in treatment of biofilms and wound surfa-
ces.113,114 Overall, Gram-negative bacteria were more sus-
ceptible to plasma treatment than Gram-positive bacteria. A
rat model of a superficial slash wound infected with P. aeru-ginosa and the plasma-sensitive Staphylococcus aureusstrain Sa 78 was used to assess the efficiency of argon
plasma treatment. A 10 min treatment significantly reduced
bacterial loads on the wound surface. A 5-day course of daily
plasma treatments eliminated P. aeruginosa from the
plasma-treated animals 2 days earlier than from the control
ones. A statistically significant increase in the rate of wound
closure was observed in plasma-treated animals after the
third day of the course. Overall, it can be concluded that
there is considerable potential for non-thermal argon plasma
in eliminating pathogenic bacteria from biofilms and wound
surfaces. A recent study concluded that treating cells with
cold plasma leads to their regeneration and rejuvenation.
This result can be used to develop a plasma therapy program
for patients with non-healing wounds.114,115
It is important to note here that in addition to the experi-
mental work there were some attempts at modeling and sim-
ulation of the interaction between LTP and tissues.116,117
Modeling work is very valuable and there is a need for this
to be pursued more vigorously in the future.
C. Low temperature plasma in dentistry
Low temperature plasma can be used to fight periodontal
diseases and to inactivate oral borne bacteria. The antibacte-
rial efficacy of LTP was assessed against several types of
bacteria of relevance to dental applications, including
Enterococcus faecalis.118–120 As an illustrative example,
inactivation experiment results show that LTP can efficiently
kill Enterococcus faecalis, one of the main types of bacte-
rium causing failure of root-canal treatment, in several
minutes. The experiments were performed with the root
canal model both in wet (root canal filled with a bacterial
suspension) and in dry (root canal contaminated and dried)
conditions. It was shown that the direct treatment under dry
conditions turned out to be the most effective, leading to a
bacterial load mean reduction of 4.1.120
D. HIV (virus) treatment by LTP
LTP can inactivate viruses.121 Very recently, the effects
of CAP on HIV-1 replication in monocyte-derived macro-
phages (MDM) were studied.122 It was demonstrated that
pre-treatment of infected cells with LTP reduced levels of
CD4 and CCR5, inhibiting virus-cell fusion, viral reverse
transcription, and integration. In addition, LTP pre-treatment
affected cellular factors required for post-entry events, which
bypasses HIV receptor-mediated fusion at the plasma mem-
brane during entry, was also inhibited. Virus particles pro-
duced by LTP-treated cells had reduced infectivity,
suggesting that the inhibitory effect of LTP extended to the
second cycle of infection. Representative results shown in
Fig. 28 demonstrate that treatment of the virus suspension
with LTP significantly reduced the ability of this virus to
establish infection in MDM. These results have been repro-
duced with infected cells from 6 different donors. This effect
of LTP could be due to damage to the viral envelope, which
FIG. 27. The anti-cancer effect of LTP in the mice model. (a) Image of mouse with two tumors before and after the plasma jet treatment for 24 h. The subcuta-
neous tumors are grown from the seeded bladder cancer cells (SCaBER). From Keidar et al.;107 (b) Cold plasma treatment effect on the growth of established
tumor in a murine melanoma model from Keidar et al.,107 (c) Images of nude mice bearing subcutaneous NOS2TR tumors before and after the injection of the
cold plasma-stimulated medium. Green arrowheads indicate the tumor site. From Utsumi et al., PLoS One 8, e81576 (2013).
020901-15 Laroussi, Lu, and Keidar J. Appl. Phys. 122, 020901 (2017)
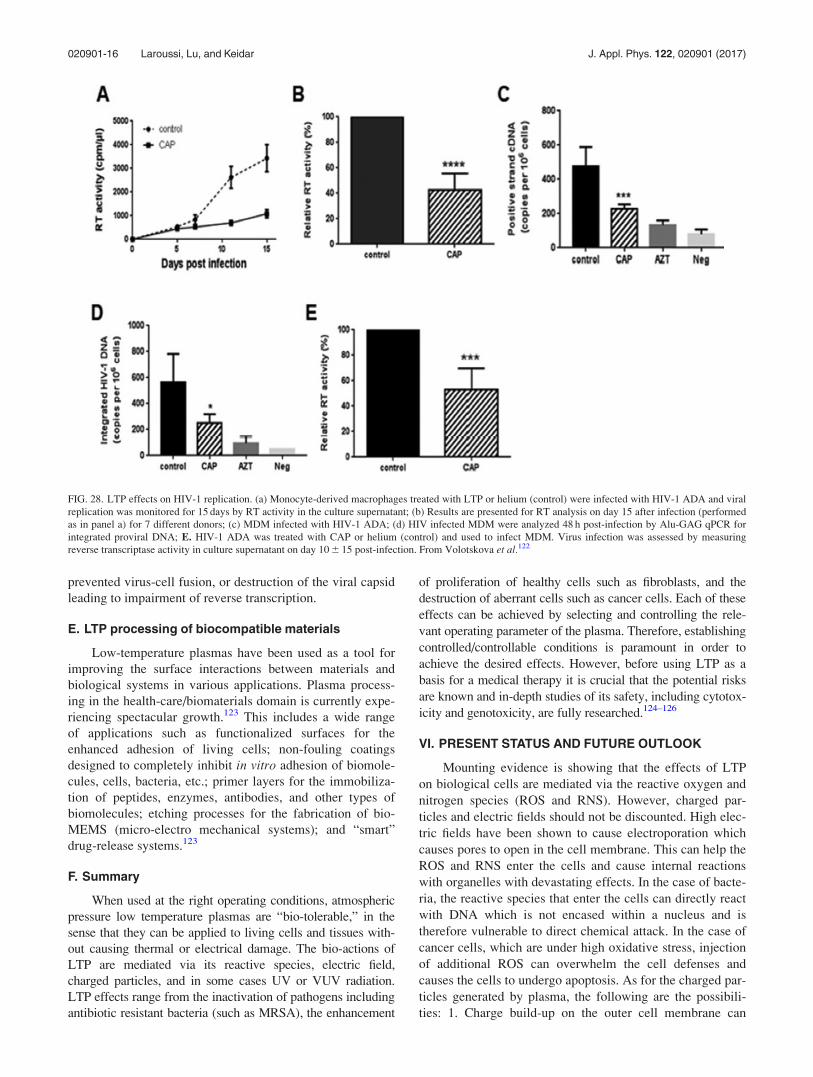
prevented virus-cell fusion, or destruction of the viral capsid
leading to impairment of reverse transcription.
E. LTP processing of biocompatible materials
Low-temperature plasmas have been used as a tool for
improving the surface interactions between materials and
biological systems in various applications. Plasma process-
ing in the health-care/biomaterials domain is currently expe-
riencing spectacular growth.123 This includes a wide range
of applications such as functionalized surfaces for the
enhanced adhesion of living cells; non-fouling coatings
designed to completely inhibit in vitro adhesion of biomole-
cules, cells, bacteria, etc.; primer layers for the immobiliza-
tion of peptides, enzymes, antibodies, and other types of
biomolecules; etching processes for the fabrication of bio-
MEMS (micro-electro mechanical systems); and “smart”
drug-release systems.123
F. Summary
When used at the right operating conditions, atmospheric
pressure low temperature plasmas are “bio-tolerable,” in the
sense that they can be applied to living cells and tissues with-
out causing thermal or electrical damage. The bio-actions of
LTP are mediated via its reactive species, electric field,
charged particles, and in some cases UV or VUV radiation.
LTP effects range from the inactivation of pathogens including
antibiotic resistant bacteria (such as MRSA), the enhancement
of proliferation of healthy cells such as fibroblasts, and the
destruction of aberrant cells such as cancer cells. Each of these
effects can be achieved by selecting and controlling the rele-
vant operating parameter of the plasma. Therefore, establishing
controlled/controllable conditions is paramount in order to
achieve the desired effects. However, before using LTP as a
basis for a medical therapy it is crucial that the potential risks
are known and in-depth studies of its safety, including cytotox-
icity and genotoxicity, are fully researched.124–126
VI. PRESENT STATUS AND FUTURE OUTLOOK
Mounting evidence is showing that the effects of LTP
on biological cells are mediated via the reactive oxygen and
nitrogen species (ROS and RNS). However, charged par-
ticles and electric fields should not be discounted. High elec-
tric fields have been shown to cause electroporation which
causes pores to open in the cell membrane. This can help the
ROS and RNS enter the cells and cause internal reactions
with organelles with devastating effects. In the case of bacte-
ria, the reactive species that enter the cells can directly react
with DNA which is not encased within a nucleus and is
therefore vulnerable to direct chemical attack. In the case of
cancer cells, which are under high oxidative stress, injection
of additional ROS can overwhelm the cell defenses and
causes the cells to undergo apoptosis. As for the charged par-
ticles generated by plasma, the following are the possibili-
ties: 1. Charge build-up on the outer cell membrane can
FIG. 28. LTP effects on HIV-1 replication. (a) Monocyte-derived macrophages treated with LTP or helium (control) were infected with HIV-1 ADA and viral
replication was monitored for 15 days by RT activity in the culture supernatant; (b) Results are presented for RT analysis on day 15 after infection (performed
as in panel a) for 7 different donors; (c) MDM infected with HIV-1 ADA; (d) HIV infected MDM were analyzed 48 h post-infection by Alu-GAG qPCR for
integrated proviral DNA; E. HIV-1 ADA was treated with CAP or helium (control) and used to infect MDM. Virus infection was assessed by measuring
reverse transcriptase activity in culture supernatant on day 10 6 15 post-infection. From Volotskova et al.122
020901-16 Laroussi, Lu, and Keidar J. Appl. Phys. 122, 020901 (2017)
change the membrane potential and/or cause electrostatic
forces that can challenge the tensile strength of the mem-
brane; 2. changing electric charge balance at the cell mem-
brane by partially neutralizing positive charges associated
with ion channels.
Some of the remarkable achievements of plasma medi-
cine can be summarized as follows:
1. Inactivation of bacteria: with the rise of antibiotic resis-
tant strains serious health challenges are on the rise.
Nosocomial infections are causing a high level of mortal-
ity in patients with a compromised immune system. LTP
was shown to be able to inactivate antibiotic resistant bac-
teria such as MRSA. So far, there have been no reports
that bacteria can build up resistance to LTP exposure.
2. LTP has been shown to be able to help in the treatment of
chronic wounds, such as diabetic ulcers, which could not
be treated by other conventional therapies. LTP’s actions
are two-fold. One is the reduction of infection by killing a
high number of bacterial cells infecting the wound.
Second is the enhancement of proliferation of fibroblasts
and angiogenesis.
3. LTP has shown excellent selectivity in killing cancer cells
while not harming normal healthy cells. One of the
hypotheses explaining this selectivity is that cancer cells
exhibit much higher metabolic rates than normal cells and
therefore are under high oxidative stress. Adding extra
ROS to the cancer cells leads to apoptosis as the cells
becomes unable to cope. However, other investigations
showed that other mechanisms are in action, such cell as
cycle arrest and/or activation of caspases that can end up
in apoptosis.
As of the present many mechanisms of interaction of
LTP with prokaryotic and eukaryotic cells have been eluci-
dated. However, much more work and careful investigations
are still needed in order to generate a coherent and complete
picture. Amongst these are: 1. Accurate measurements of the
concentrations and fluxes of the relevant species both in the
gaseous and liquid phases; 2. Investigations of the role of the
plasma-generated electric field which can open pores in the
cell membrane; 3. Elucidation of the plasma-triggered bio-
chemical pathways whereby apoptosis can occur in cancer
cells; 4. Conduct more investigations on the effects of LTP
on macromolecules such as DNA and proteins; 5.
Identification of any possible long-term cytotoxic effects that
LTP can cause to healthy cells; 6. Investigation of possible
genotoxic effects, especially on healthy cells, since any such
effects could have serious implications (such as mutation); 7.
Figuring out what other possible effects plasma could induce
in tissues and tumors, such as change in blood flow, variation
in the oxygen level, etc.; 8. Assessing the extent of the
impact of LTP exposure on the immune system.
In addition to empirical data, mathematical modeling of
the interaction of LTP with biological cells and tissues needs
to be further developed. One of the interesting approaches
being investigated in the case of cancer applications is the
use of plasma activated media (PAM) instead of direct
plasma treatment. Many encouraging results have been
reported by several groups using this modality. These studies
require a good understanding of the interaction of plasma
with liquids, a branch of plasma applications that is experi-
encing heightened interest and is being pursued both experi-
mentally and computationally. One of the advantages of
using PAM is that it can be stored for later use. Investigators
have reported that PAM can remain efficacious in killing
cancer cells even after several hours of storage.
At this juncture, plasma medicine seems to have a very
encouraging outlook. Many important milestones have been
achieved during the last two decades and the field has experi-
enced exponential growth both in the quality and quantity of
data and knowledge generated by a global research commu-
nity. Plasma medicine seems to be at the stage when it is
almost ready to move out of the research laboratory and
enter into the health care arena. The involvement and collab-
orations with medical doctors and biology experts have been
crucial to the remarkable advancement experienced by the
field. In the near future, extensive clinical trials need to be
carried out for a final push of this technology to be adopted
as the basis of various medical therapies. These include
wound healing, dentistry, oncology, and others.
1R. Mogul, A. A. Bolaposshakov, S. L. Chan, R. M. Stevens, B. N. Khare,
M. Meyyappan, and J. D. Trent, Biotechnol. Prog. 19, 776 (2003).2A. A. Bol’shakov, B. A. Cruden, R. Mogul, M. V. V. S. Rao, A. P.
Sharma, B. N. Khare, and M. Meyyappan, AIAA J. 42, 823 (2004).3K. R. Stalder, “Plasma characteristics of electrosurgical discharges,” in
Proceedings of the Gaseous Electronics Conference, San Francisco, CA(2003), p. 16.
4M. Moisan, J. Barbeau, S. Moreau, J. Pelletier, M. Tabrizian, and L. H.
Yahia, Int. J. Pharm. 226, 1 (2001).5D. A. Drossman, N. J. Shaheen, and I. S. Grimm, “Argon plasma coagu-
lation,” in Handbook of Gastroenterology Procedures, 4th ed.
(Lippincotts Williams & Wilkins, Philadelphia, 2005), p. 235.6S. Kanazawa, M. Kogoma, T. Moriwaki, and S. Okazaki, J. Phys. D:
Appl. Phys. 21, 838 (1988).7F. Massines, C. Mayoux, R. Messaoudi, A. Rabehi, and P. S�egur, in
Proceedings of the GD-92, Swansea, UK (1992), Vol. 2, p. 730.8J. R. Roth, M. Laroussi, and C. Liu, in Proceedings of the IEEEInternational Conference on Plasma Science (1992), p. 170.
9M. Laroussi, IEEE Trans. Plasma Sci. 24, 1188 (1996).10A. B. Shekhter, R. K. Kabisov, A. V. Pekshev, N. P. Kozlov, and Y. L.
Perov, Bull. Exp. Biol. Med. 126, 829 (1998).11E. Stoffels, A. J. Flikweert, W. W. Stoffels, and G. M. W. Kroesen,
Plasma Sources. Sci. Technol. 11, 383 (2002).12M. Laroussi and T. Akan, Plasma Processes Polym. 4, 777 (2007).13X. Lu, M. Laroussi, and V. Puech, Plasma Sources Sci. Technol. 21,
034005 (2012).14M. Laroussi and X. Lu, Appl. Phys. Lett. 87, 113902 (2005).15K.-D. Weltmann, R. Brandenburg, T. Von Woedtke, J. Ehlbeck, R. Foest,
M. Stieber, and E. Kindel, J. Phys. D: Appl. Phys. 41, 194008 (2008).16T. Du Moncel, Notice sur l’appareil d’induction electrique de Ruhmkorff
et sur les experiences que l’on peut faire avec cet instrument (Hachette et
Cie Publishers, 1855).17W. von Siemens, Poggendorfs Ann. Phys. Chem. 12, 66 (1857).18A. Von Engel, R. Seelinger, and M. Steenbeck, Z. Phys. 85, 144 (1933).19U. Kogelschatz, Pure Appl. Chem. 62, 1667 (1990).20U. Kogelschatz, B. Eliasson, and W. Egli, J. Phys. IV 7(C4), 47 (1997).21U. Kogelschatz, IEEE Trans. Plasma Sci. 30, 1400 (2002).22R. P. Mildren and R. J. Carman, J. Phys. D: Appl. Phys. 34, 3378 (2001).23X. Duten, D. Packan, L. Yu, C. O. Laux, and C. H. Kruger, IEEE Trans.
Plasma Sci. 30, 178 (2002).24M. Laroussi, X. Lu, V. Kolobov, and R. Arslanbekov, J. Appl. Phys. 96,
3028 (2004).25X. Lu and M. Laroussi, J. Phys. D: Appl. Phys. 39, 1127 (2006).26M. Laroussi and A. Fridman, Plasma Processes Polym. 5, 501 (2008).27G. Fridman, G. Friedman, A. Gutsol, A. B. Shekhter, V. N. Vasilets, and
A. Fridman, Plasma Processes Polym. 5, 503 (2008).
020901-17 Laroussi, Lu, and Keidar J. Appl. Phys. 122, 020901 (2017)

28M. Laroussi, IEEE Trans. Plasma Sci. 37, 714 (2009).29T. Yokoyama, M. Kogoma, T. Moriwaki, and S. Okazaki, J. Phys. D:
Appl. Phys. 23, 1125 (1990).30F. Massines, A. Rabehi, P. Decomps, R. B. Gadri, P. S�egur, and C.
Mayoux, J. Appl. Phys. 82, 2950 (1998).31S. Okazaki, M. Kogoma, M. Uehara, and Y. Kimura, J. Phys. D: Appl.
Phys. 26, 889 (1993).32N. Gherardi, G. Gouda, E. Gat, A. Ricard, and F. Massines, Plasma
Sources Sci. Technol. 9, 340 (2000).33M. Laroussi, I. Alexeff, J. P. Richardson, and F. F. Dyer, IEEE Trans.
Plasma Sci. 30, 158 (2002).34N. Gherardi and F. Massines, IEEE Trans. Plasma Sci. 29, 536
(2001).35J. J. Shi, X. T. Deng, R. Hall, J. D. Punnett, and M. Kong, J. Appl. Phys.
94, 6303 (2003).36F. Massines, N. Gherardi, N. Naude, and P. Segur, Plasma Phys.
Controlled Fusion 47, B557 (2005).37A. Schutze, J. Y. Jeong, S. E. Babyan, J. Park, G. S. Selwyn, and R. F.
Hicks, IEEE Trans. Plasma Sci. 26, 1685 (1998).38M. Laroussi, C. Tendero, X. Lu, S. Alla, and W. L. Hynes, Plasma Proc.
Polym. 3, 470 (2006).39N. Barekzi and M. Laroussi, Plasma Processes Polym. 10, 1039
(2013).40D. Graves, J. Phys. D: Appl. Phys. 45, 263001 (2012).41A. Shashurin, M. Keidar, S. Bronnikov, R. A. Jurjus, and M. A. Stepp,
Appl. Phys. Lett. 93, 181501 (2008).42M. Keidar, A. Shashurin, O. Volotskova, M. A. Stepp, P. Srinivasan, A.
Sandler, and B. Trink, Phys. Plasmas 20, 057101 (2013).43M. Laroussi, S. Mohades, and N. Barekzi, Biointerphases 10, 029401
(2015).44M. Teschke, J. Kedzierski, E. G. Finantu-Dinu, D. Korzec, and J.
Engemann, IEEE Trans. Plasma Sci. 33, 310 (2005).45X. Lu and M. Laroussi, J. Appl. Phys. 100, 063302 (2006).46N. Mericam-Bourdet, M. Laroussi, A. Begum, and E. Karakas, J. Phys.
D: Appl. Phys. 42, 055207 (2009).47B. L. Sands, B. N. Ganguly, and K. Tachibana, Appl. Phys. Lett. 92,
151503 (2008).48J. L. Walsh and M. G. Kong, Appl. Phys. Lett. 93, 111501 (2008).49Q. Xiong, X. Lu, J. Liu, Y. Xian, Z. Xiong, F. Zou, C. Zou, W. Gong, J.
Hu, K. Chen, X. Pei, Z. Jiang, and Y. Pan, J. Appl. Phys. 106, 083302
(2009).50M. Laroussi and X. Lu, “Spatial and temporal behavior of a plasma bul-
let launched by a pulsed cold plasma device,” in Proceedings of the
IEEE Pulse Power Plasma Science Conference, Albuquerque, NM, June
2007.51E. Karakas, M. Koklu, and M. Laroussi, J. Phys. D: Appl. Phys. 43,
155202 (2010).52G. V. Naidis, J. Phys. D: Appl. Phys. 44, 215203 (2011).53G. V. Naidis, J. Phys. D: Appl. Phys. 43, 402001 (2010).54J.-P. Boeuf, L. Yang, and L. Pitchford, J. Phys. D: Appl. Phys. 46,
015201 (2013).55M. Yousfi, O. Eichwald, N. Merbahi, and N. Jomma, Plasma Sources Sci.
Technol. 21, 045003 (2012).56D. Breden, K. Miki, and L. L. Raja, Plasma Sources Sci. Technol. 21,
034011 (2012).57D. Breden, K. Miki, and L. L. Raja, Appl. Phys. Lett. 99, 111501
(2011).58E. Karakas and M. Laroussi, J. Appl. Phys. 108, 063305 (2010).59J. Jarrige, M. Laroussi, and R. Karakas, Plasma Sources Sci. Technol. 19,
065005 (2010).60Y. Sakiyama, D. B. Graves, J. Jarrige, and M. Laroussi, Appl. Phys. Lett.
96, 041501 (2010).61X. Pei, Y. Lu, S. Wu, Q. Xiaong, and X. Lu, Plasma Sources Sci.
Technol. 22, 025023 (2013).62A. Shashurin, M. N. Schneider, and M. Keidar, Plasma Sources. Sci.
Technol. 21, 049601 (2012).63A. Begum, M. Laroussi, and M. R. Pervez, AIP Adv. 3, 062117
(2013).64G. B. Stretenovic, I. B. Krstic, V. V. Kovacevic, A. M. Obradovic, and
M. M. Kuraica, J. Phys. D: Appl. Phys. 47, 102001 (2014).65A. Sobota, O. Guaitella, and E. Garcia-Caurel, J. Phys. D: Appl. Phys. 46,
372001 (2013).66X. Lu, G. Naidis, M. Laroussi, and K. Ostrikov, Phys. Rep. 540, 123
(2014).
67X. Lu, G. V. Naidis, M. Laroussi, S. Reuter, D. B. Graves, and K.
Ostrikov, Phys. Rep. 630, 1 (2016).68P. Bruggeman, D. C. Schram, M. G. Kong, and C. Leys, Plasma
Processes Polym. 6, 751 (2009).69Q. Xiong, A. Nikiforov, X. Lu, and C. Leys, J. Phys. D: Appl. Phys. 43,
415201 (2010).70P. Bruggeman, D. C. Schram, M. A. Gonzalez, R. Rego, M. G.
Kong, and C. Leys, Plasma Sources Sci. Technol. 18, 025017
(2009).71S. Tsurubuchi, Chem. Phys. 10, 335 (1975).72G. R. Mohlmann, C. I. M. Beenakker, and F. J. De Heer, Chem. Phys. 13,
375 (1976)73K. Bartschat and V. Zeman, Phys. Rev. A 59, R2552 (1999).74A. Dasgupta, M. Blaha, and L. J. Giuliani, Phys. Rev. A 61, 012703
(1999).75I. Hutchinson, Principles of Plasma Diagnostics (Cambridge University
Press, 1987), pp. 216–221.76J. Torres et al., J. Phys. D: Appl. Phys. 40, 5929 (2007).77R. Konjevic and N. Konjevic, Spectrochim. Acta, Part B 52, 2077–2084
(1997).78X. Lu, S. Wu, J. Gou, and Y. Pan, Sci. Rep. 4, 7488 (2014).79M. N. Shneider and R. B. Miles, J. Appl. Phys. 98, 033301
(2005).80A. Shashurin, M. N. Shneider, A. Dogariu, R. B. Miles, and M. Keidar,
Appl. Phys. Lett. 94, 231504 (2009).81A. Shashurin, M. N. Shneider, and M. Keidar, Appl. Phys. Lett. 96,
171502 (2010).82J. S. Foster, Proc. R. Soc. London, Ser. A 117, 137 (1927).83S. Wu and X. Lu, Phys. Plasmas 21, 023501 (2014).84Q. Xiong, A. Nikiforov, L. Li, P. Vanraes, N. Britun, R. Snyders, X. Lu,
and C. Leys, Eur. Phys. J. D 66, 281 (2012).85R. Kienle, M. P. Lee, and K. Kohse-H€oinghaus, Appl. Phys. B 63, 403
(1996).86A. Ershov and J. Borysow, J. Phys. D: Appl. Phys. 28, 68 (1995).87R. Ono and T. Oda, J. Phys. D: Appl. Phys. 35, 2133 (2002).88S. Yonemori, Y. Nakagawa, R. Ono, and T. Oda, J. Phys. D: Appl. Phys.
45, 225202 (2012).89G. Dilecce, P. F. Ambrico, M. Simek, and S. De Benedictis, Chem. Phys.
398, 142 (2012).90F. Tochikubo, S. Uchida, and T. Watanabe, Jpn. J. Appl. Phys., Part 1 43,
315 (2004).91T. Verreycken, R. M. van der Horst, A. H. F. M. Baede, E. M. van
Veldhuizen, and P. J. Bruggeman, J. Phys. D: Appl. Phys. 45, 045205
(2012).92X. Pei, S. Wu, Y. Xian, X. Lu, and Y. Pan, IEEE Trans. Plasma Sci. 42,
1206 (2014).93P. Chu and X. Lu, Low Temperature Plasma Technology: Methods and
Applications (CRC Press/Taylor & Francis Group, 2014).94A. Van Gessel, S. Van Grootel, and P. Bruggeman, Plasma Sources Sci.
Technol. 22, 055010 (2013).95S. Reuter, J. Winter, A. Schmidt-Bleker, D. Schroeder, H. Lange, N.
Knake, V. Schulz-von der Gathen, and K.-D. Weltmann, Plasma Sources
Sci. Technol. 21, 024005 (2012).96Y. Sakiyama, N. Knake, D. Schroder, J. Winter, V. Schulz-von der
Gathen, and D. B. Graves, Appl. Phys. Lett. 97, 151501 (2010).97Y. Yue, Y. Xian, X. Pei, and X. Lu, Phys. Plasmas 23, 123503
(2016).98M. Laroussi, M. Kong, G. Morfill, and W. Stolz, Plasma Medicine:
Applications of Low Temperature Gas Plasma in Medicine and Biology(Cambridge University Press, Cambridge, UK, 2012).
99M. Keidar and I. I. Beilis, Plasma Engineering: Application inAerospace, Nanotechnology and Bio-Nanotechnology (Elsevier, Oxford,
UK, 2013).100M. Keidar and E. Robert, “Preface to Special Topic: Plasmas for medical
applications,” Phys. Plasmas 22, 121901 (2015).101M. Keidar, Plasma Source Sci. Technol. 24, 033001 (2015).102D. Yan, J. Sherman, and M. Keidar, Oncotarget 8, 15977 (2017).103M. Laroussi, Plasma Processes Polym. 11, 1138 (2014).104J. Schlegel, J. Koritzer, and V. Boxhammer, Clin. Plasma Med. 1, 2
(2013).105H. Tanaka, M. Mizuno, K. Ishikawa, K. Takeda, K. Nakamura, F.
Utsumi, H. Kajiyama, H. Kano, Y. Okazaki, S. Toyokuni, S.
Maruyama, F. Kikkawa, and M. Hori, IEEE Trans. Plasma Sci. 42,
3760 (2014).
020901-18 Laroussi, Lu, and Keidar J. Appl. Phys. 122, 020901 (2017)
106M. Vandamme, E. Robert, S. Dozias, J. Sobilo, S. Lerondel, A. Le Pape,
and J.-M. Pouvesle, Plasma Med. 1, 27 (2011).107M. Keidar, R. Walk, A. Shashurin, P. Srinivasan, A. Sandler, S.
Dasgupta, R. Ravi, R. Guerrero-Preston, and B. Trink, Br. J. Cancer. 105,
1295 (2011).108N. Chernets, D. S. Kurpad, V. Alexeev, D. B. Rodrigues, and T. A.
Freeman, Plasma Processes Polym. 12, 1400 (2015).109V. Miller, A. Lin, and A. Fridman, Plasma Chem. Plasma Process. 36,
259 (2016).110A. Lin, B. Truong, A. Pappas, K. Kirifides, A. Oubarri, S. Chen, D.
Dobrynin, G. Fridman, A. Fridman, N. Sang, and V. Miller, Plasma
Processes Polym. 12, 1392 (2015).111V. Miller, A. Lin, G. Fridman, D. Dobrynin, and A. Fridman, Plasma
Processes Polym. 11, 1193 (2014).112M. Laroussi, Plasma Processes Polym. 2, 391 (2005).113S. A. Ermolaeva et al., J. Med. Microbiol. 60, 75 (2011).114G. Isbary, G. Morfill, H. U. Schmidt, M. Georgi, K. Ramrath, J. Heinlin
et al., Br. J. Dermatol. 163, 78 (2010).115E. Sysolyatina, M. Vasiliev, M. Kurnaeva, I. Kornienko, O. Petrov, V.
Fortov, A. Gintsburg, E. Petersen, and S. Ermolaeva, J. Phys. D: Appl.
Phys. 49, 294002 (2016).
116N. Y. Babaeva, W. Tian, and M. J. Kushner, J. Phys D: Appl. Phys. 47,
235201 (2014).117A. Bogaerts, M. Yusupov, J. van der Paal, C. C. W. Verlackt, and E. C.
Neyts, Plasma Processes Polym. 11, 1156 (2014).118X. Lu, Z. Jiang, Q. Xiong, Z. Y. Tang, and Y. Pan, Appl. Phys. Lett. 92,
151504 (2008).119A. D. Morris, G. B. McCombs, T. Akan, W. Hynes, M. Laroussi, and S.
L. Tolle, J. Dent. Hyg. 83, 55 (2009).120E. Simoncelli, Clin. Plasma Med. 3, 77 (2015).121H. A. Aboubakr, U. Gangal, M. M. Youssef, S. M. Goyal, and P. J.
Bruggeman, J. Phys. D: Appl. Phys. 49, 204001 (2016).122O. Volotskova, L. Dubrovsky, M. Keidar, and M. Bukrinsky, PloS One
11(10), e0165322 (2016).123R. d’Agostino, P. Favia, C. Oehr, and M. R. Wertheimer, Plasma
Processes Polym. 2, 7 (2005).124A. Antoniu, T. Nakajima, H. Kurita, and A. Mizuno, J. Electrostat. 72,
210 (2014).125S. Kos, T. Blagus, M. Cemazar, G. Filipic, G. Sersa, and U. Cvelbar,
PloS One 12(4), e0174966 (2017).126H. Kurita, S. Miyachika, H. Yasuda, K. Takashima, and A. Mizuno,
Appl. Phys. Lett. 107, 263702 (2015).
020901-19 Laroussi, Lu, and Keidar J. Appl. Phys. 122, 020901 (2017)