temperature-dependent changes in the soil bacterial community in limed and unlimed soil
TRANSCRIPT
Temperature-dependent changes in the soil bacterial community inlimed and unlimed soil
Marie Pettersson �, Erland BafiafithDepartment of Microbial Ecology, Ecology Building, Lund University, SE-223 62 Lund, Sweden
Received 5 February 2003; received in revised form 21 March 2003; accepted 21 March 2003
First published online 23 April 2003
Abstract
A humus soil with a pH(H2O) of 4.9 was limed to a pH of 7.5 and was incubated together with samples from unlimed and field limed(pH 6.1) soils at 5, 20 and 30‡C for up to 80 days. The changes in the phospholipid fatty acid (PLFA) pattern were most rapid for thebacterial community of the soil incubated at 30‡C, while no changes were found in the soil incubated at 5‡C. The response of thecommunity activity to temperature was measured using the thymidine incorporation method on bacteria extracted from the soil. Thebacterial community in soil incubated at 30‡C became more adapted to high temperature than that in soil samples incubated at 5‡C.When soil samples incubated at 30‡C and 20‡C were returned to 5‡C for 35 days, only small changes in the PLFA pattern were found. Nosignificant shift in community temperature adaptation was found. Thus, higher temperatures (with higher turnover) led to higher rates ofchange in both the PLFA pattern and the activity response to temperature, compared with lower temperatures. No effect of liming as away of increasing substrate availability and turnover on the rate of change was observed. Changes in the PLFA pattern appeared soonerthan changes in the activity response to temperature, indicating that changes in the PLFA pattern were mainly due to phenotypicacclimation and not to species replacement.7 2003 Federation of European Microbiological Societies. Published by Elsevier Science B.V. All rights reserved.
Keywords: Temperature response; Phenotypic plasticity ; Phospholipid fatty acid analysis ; Thymidine incorporation
1. Introduction
Temperature is one of the most important environmen-tal factors regulating the activity and determining thecomposition of the bacterial community. Bacterial com-munities inhabiting environments with di¡erent tempera-ture regimes therefore have di¡erent temperature relation-ships with cardinal points (minimum, optimum andmaximum) related to the environmental conditions [1^5].
If the temperature is changed, a selection pressure willbe applied, altering the bacterial community. Bacterialspecies more adapted to the new conditions will growfaster, while those not well adapted will be outcompeted.Initially, this will be seen as a change in the temperaturerelationship of the bacterial community with cardinalpoints more suitable to the new conditions. With time,the bacterial community structure will change.
The e¡ect of temperature actually consists of two parts.First, the greater the temperature shift, the greater magni-tude of the selection pressure, and thus the increase incommunity adaptation. However, temperature may alsoa¡ect the rate of change of the community. Petterssonand Bafiafith [6] found that the rate of community adapta-tion to pH was faster at 30‡C than at 5‡C. They explainedthis as an increased turnover of bacteria, where a higherturnover would enable the more rapid replacement of lessadapted species by more adapted ones. Similar results re-garding the e¡ect of temperature on the rate of commu-nity adaptation to heavy metals were found by Diaz-Ra-vin‹a et al. [7].
Another way of in£uencing the rate of communityadaptation by increasing the turnover of the communityis to add substrate (carbon) to the soil. This would avoidthe two confounding e¡ects of temperature describedabove. One way of increasing substrate availability is byliming an acid soil, since the increase in pH releases or-ganic matter in forms more available for microorganisms[8,9], thereby increasing the activity and growth (and turn-over) of the microbial community.
0168-6496 / 03 / $22.00 7 2003 Federation of European Microbiological Societies. Published by Elsevier Science B.V. All rights reserved.doi :10.1016/S0168-6496(03)00106-5
* Corresponding author. Tel. : +46 (46) 222 3760;Fax: +46 (46) 222 4158.E-mail address: [email protected] (M. Pettersson).
FEMSEC 1517 2-6-03
FEMS Microbiology Ecology 45 (2003) 13^21
www.fems-microbiology.org
To measure the adaptation of the bacterial communityto di¡erent temperatures we used a technique based ondirect measurement of the bacterial activity, the thymidine(TdR) incorporation technique. The basic technique forsoil has been described by Bafiafith [10]. When the techniqueis used to measure community adaptation to temperature,the TdR incorporation of a bacterial community is mea-sured at di¡erent temperatures [11]. Since TdR incorpora-tion measures instant activity, dormant and inactive cellswill have no in£uence. The TdR incorporation techniquehas previously been used to measure the in£uence of tem-perature change on the activity of the bacterial communityin soil [12,13] and to measure temperature as a regulatingfactor in aquatic systems [14^17].
The phospholipid fatty acid (PLFA) pattern has previ-ously been used to study changes in the soil bacterial com-munity. By studying PLFAs one can determine changes inthe community without determining the exact species com-position, since a change in the PLFA pattern is supposedto indicate an altered community. The technique has beenused to measure community dynamics during temperaturechanges in compost and heated peat [18,19] and microbialcommunity development to elevated atmospheric temper-ature in a model terrestrial ecosystem [20].
The e¡ect of temperature on bacterial communities hasalso been studied using molecular approaches. For exam-ple, the soil bacterial community structure measured usingDGGE was altered after a geothermal heating event in theYellowstone National Park [21]. T-RFLP has been used tomeasure how di¡erent temperature stress a¡ected thestructure of the methanogenic archaeal community ofrice ¢eld soil [22,23].
In a study of bacteria in peat [24] it was shown that thechange in the community temperature relationship was, asexpected, dependent on the extent of the environmentaltemperature change. However, since they studied self-heated peat, the temperature range was quite extreme,with temperatures rising to those well outside the temper-ature range of the initial community. The objective of ourwork was therefore to study the e¡ect of temperature onthe soil bacterial community using a more relevant tem-perature range.
In the present study we have compared the e¡ect oftemperature changes on the PLFA pattern and the tem-perature response based on activity measurements. Thee¡ects of both increasing and decreasing temperaturewere studied. Several hypotheses were tested in this paper.First, the change in bacterial PLFA pattern and commu-nity tolerance to a new temperature would be most rapidwhen the turnover of the community was highest. Theturnover was a¡ected by both temperature and substrate(liming). Regarding the latter treatment we hypothesizedthat the shift in PLFA pattern and community tolerancewould be faster for limed soil than for unlimed soil, sincethe activity and turnover are higher in the former soil [6].Secondly, we hypothesized that changes in the PLFA pat-
tern and community tolerance with temperature would befaster when changing the soil temperature from 5 to 30‡C,than from 30 to 5‡C, since the turnover of the soil bacte-rial community is lower at low temperatures. Further-more, we wanted to compare how rapid changes in themicrobial community due to temperature were detectedbased on activity measurements and PLFA compositionto try and elucidate to what extent the changes in thePLFA pattern were due to changes in species compositionor to phenotypic changes.
2. Materials and methods
2.1. Soils
Two humus soils from an experimental liming area ofconiferous trees (mainly spruce) in Hasslo«v (56‡24PN,13‡0PE), southern Sweden, with an approximate yearlysoil temperature ranging between frozen and 20‡C wereused. One of the soils was unlimed and had a pH(H2O)of 4.9. The other had been limed in the ¢eld 15 years agowith 8750 kg ha31 dolomite and had a pH(H2O) of 6.1.The soils were collected at the end of August (soil temper-ature approximately 10‡C), sieved the same day (2.8 mmmesh size) and used immediately.
2.2. Experiments
Samples of the unlimed soil were limed with 2.2 gCaCO3 per 100 g soil. The pH(H2O) was 7.5 in this ex-perimentally limed soil. The following abbreviations willbe used for the di¡erent soil samples : UL=unlimed soil,FL=¢eld limed soil and EL= experimentally limed soil.Subscripts indicate soil incubation temperature, e.g. EL30
indicates experimentally limed soil that was incubated at30‡C. When two temperatures are given, the ¢rst indicatesthe initial incubation temperature, while the second indi-cates the ¢nal incubation temperature. For example,EL30; 5 indicates an experimentally limed soil ¢rst incuba-ted at 30‡C and then at 5‡C.
We performed two di¡erent types of temperature experi-ments. The increased temperature (IT) experiment wasperformed twice. In the initial (¢rst) experiment, two ELsamples were incubated at 5‡C, 20‡C and 30‡C, and twoUL and two FL samples were incubated at 5‡C. The ULsamples were used as a low-pH control, giving the baselineof the measurements, while the FL samples were used as ahigh-pH control with an already high-pH-tolerant commu-nity in order to be able to di¡erentiate between pH- andtemperature-related e¡ects. In the main (second) IT ex-periment the same treatment as above was applied, butthe UL and FL soils were also incubated at 30‡C.
In the other type of experiment we decreased the tem-perature. The decreased temperature (DT) experiment wasalso performed twice (Fig. 1). In the ¢rst DT experiment
FEMSEC 1517 2-6-03
M. Pettersson, E. Bafiafith / FEMS Microbiology Ecology 45 (2003) 13^2114
we took advantage of the main IT experiment. After 83days of the main IT experiment the samples incubated at30‡C were incubated at 5‡C and followed for another 34days. In the second DT experiment replicate samples fromthe EL (limed on day 0), UL and FL soils were incubatedat 5, 20 and 30‡C. After 36 days, half of the samples wereincubated at 5‡C, while the other half remained at theoriginal temperature for a further 35 days.
2.3. PLFA analysis
Samples of 0.5 g were taken and stored at 318‡C. Anal-yses were performed on samples taken at eight occasionsat intervals up to 50 days in the initial experiment and at11 occasions up to 82 days in the main IT experiment.Samples were taken at six occasions up to 34 days in the¢rst and up to 35 days in the second DT experiment.Lipids were extracted and PLFAs quanti¢ed by a proce-dure described previously [25].
2.4. Bacterial community temperature response based onactivity measurements
Bacterial activity was measured on bacteria extractedfrom soil. TdR incorporation was measured according toBafiafith [10] in the initial experiment. In the main IT and¢rst and second DT experiments the modi¢ed method ofBafiafith et al. [26] was used. Brie£y, 1 g of soil was put intoa glass £ask and 40 ml of Milli Q water was added. Thesamples were shaken on a rotary shaker (200 rpm) for 15min and then centrifuged at 1000Ug for 10 min. Thesupernatant with the extracted bacteria was then used.1.5 ml of each sample was put in an Eppendorf tubeand 15 Wl methyl[3H]TdR (926 GBq mmol31, Amersham)diluted 1:3 was added. Isotope dilution [27] was not takeninto account. Incubation was terminated after 1 h at 30and 35‡C, 2 h at 25‡C, 4 h at 17‡C and 24 h at 5‡C byadding 75 Wl cold 100% TCA. Non-incorporated TdR wasremoved with repeated centrifugation washings(13 000Ug) with 1.5 ml of cold 5% TCA and 1.5 ml cold80% ethanol. Then 0.2 ml of NaOH was added and thesamples were incubated at 90‡C for 60 min. Finally 1 ml
of scintillation cocktail (Ultima Gold, Canberra-Packard)was added before scintillation counting.
After 44 days of the initial IT experiment the temper-ature response of the bacterial community was measured.Bacterial suspensions, extracted from the EL30, EL20 andEL5 soils, were incubated at 5, 20 and 30‡C, using threereplicates of each at each incubation temperature. Similartemperature response tests were performed after 35 and 69days in the main IT experiment using a range of temper-atures (5^35‡C). The TdR incorporation rates were nor-malized to that found at 25‡C in order to facilitate com-parisons. In the ¢rst and second DT experiments thetemperature tolerance was measured at intervals up to35 days after the change to the lower temperature. TdRincorporation was only measured at two temperatures(5 and 35‡C) and the log of the ratio of these values (TdRincorporation at 35‡C/TdR incorporation at 5‡C) wasused as an index of the community response to temper-ature. A high value of this ratio indicates a communitybetter adapted to high temperature.
2.5. Statistics
Concentrations of the individual PLFAs (expressed asmol%) were subjected to principal component analysis(PCA) after scaling to unit variance. Thirty-one bacterialPLFAs in the initial and 33 in the main IT experimentwere identi¢ed and used to compare the e¡ects of thedi¡erent forms of treatment. Thirty-two bacterial PLFAsin the ¢rst and 33 in the second DT experiment were usedto compare the di¡erent kinds of treatment. For thePLFA analysis n=1 and for the TdR analysis n=3, exceptfor the initial experiment (n=2). In the second DT experi-ment a two-way analysis of variance (ANOVA) with timeas one factor and treatment (UL, EL and FL) as the otherwas made for the scores of the ¢rst principal component.The response of the bacterial community activity to tem-perature for the measurements on days 35 and 69 wasanalyzed with a paired t-test where similar treatments(UL, EL and FL) were compared.
3. Results
3.1. PLFA pattern
A shift in the PLFA pattern with incubation tem-perature was evident when the di¡erent treatments werecompared using PCA (Fig. 2). The low-temperature treat-ment (5‡C incubation) resulted in low values for the ¢rstcomponent in both IT experiments, while increasing tem-perature (20 and 30‡C) gave higher values along the com-ponent. The second principal component mainly di¡eren-tiated between soils with di¡erent pH, with low values forlow-pH treatment. The ¢rst principal component ac-counted for 35.0% of the variation in the initial IT experi-
UL EL FL
5 oC 20 oC 30 oC 5 oC 20 oC 30 oC 5 oC 20 oC 30 oC
5 oC* 20 oC 5 oC 30 oC 5 oC* 5 oC* 20 oC 5 oC 30 oC 5 oC* 5 oC* 20 oC 5 oC 30 oC 5 oC*
A
B
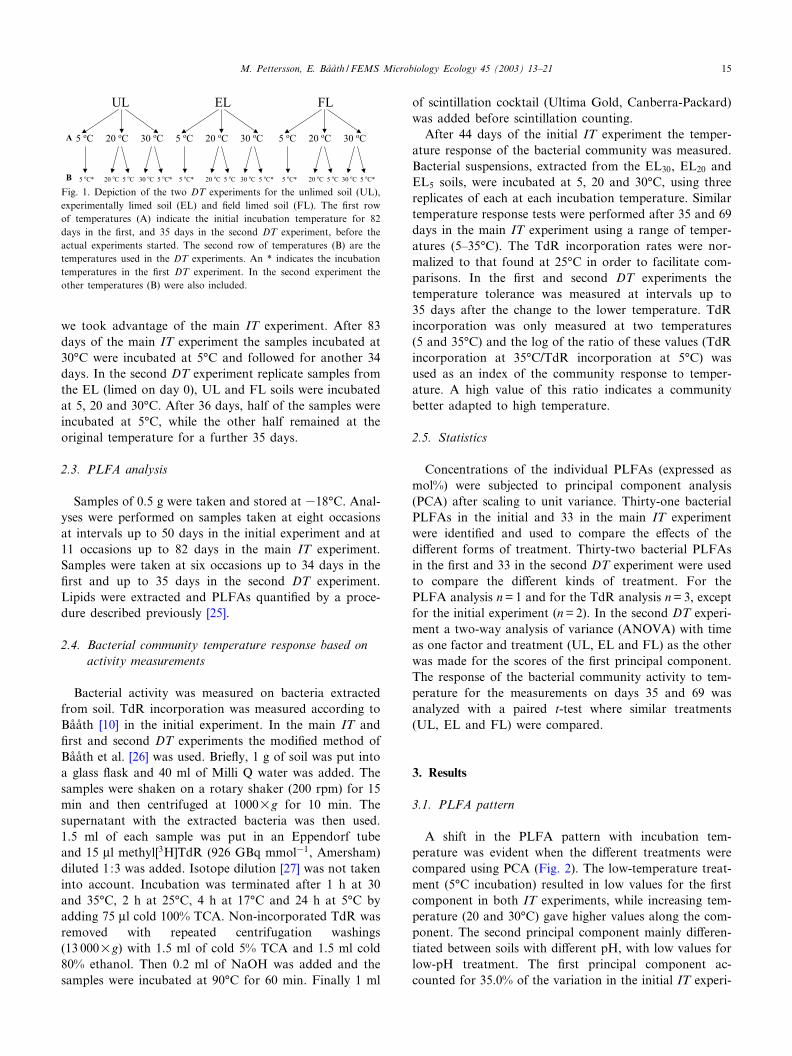
Fig. 1. Depiction of the two DT experiments for the unlimed soil (UL),experimentally limed soil (EL) and ¢eld limed soil (FL). The ¢rst rowof temperatures (A) indicate the initial incubation temperature for 82days in the ¢rst, and 35 days in the second DT experiment, before theactual experiments started. The second row of temperatures (B) are thetemperatures used in the DT experiments. An * indicates the incubationtemperatures in the ¢rst DT experiment. In the second experiment theother temperatures (B) were also included.
FEMSEC 1517 2-6-03
M. Pettersson, E. Bafiafith / FEMS Microbiology Ecology 45 (2003) 13^21 15
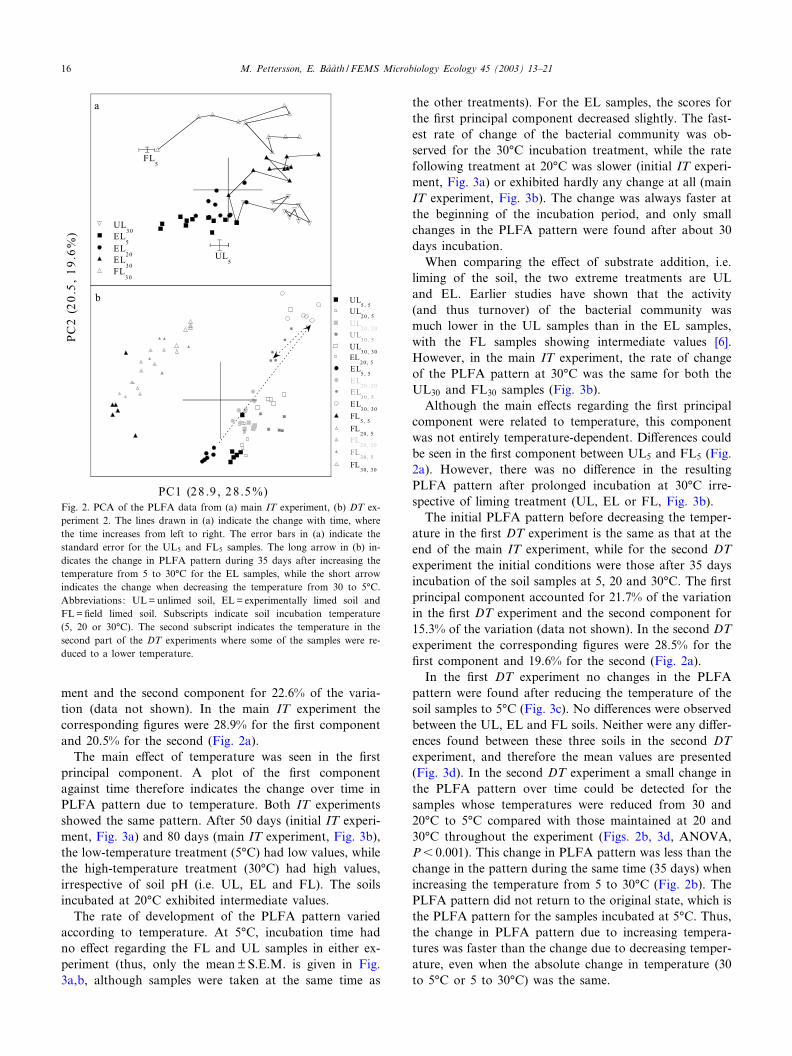
ment and the second component for 22.6% of the varia-tion (data not shown). In the main IT experiment thecorresponding ¢gures were 28.9% for the ¢rst componentand 20.5% for the second (Fig. 2a).
The main e¡ect of temperature was seen in the ¢rstprincipal component. A plot of the ¢rst componentagainst time therefore indicates the change over time inPLFA pattern due to temperature. Both IT experimentsshowed the same pattern. After 50 days (initial IT experi-ment, Fig. 3a) and 80 days (main IT experiment, Fig. 3b),the low-temperature treatment (5‡C) had low values, whilethe high-temperature treatment (30‡C) had high values,irrespective of soil pH (i.e. UL, EL and FL). The soilsincubated at 20‡C exhibited intermediate values.
The rate of development of the PLFA pattern variedaccording to temperature. At 5‡C, incubation time hadno e¡ect regarding the FL and UL samples in either ex-periment (thus, only the meanTS.E.M. is given in Fig.3a,b, although samples were taken at the same time as
the other treatments). For the EL samples, the scores forthe ¢rst principal component decreased slightly. The fast-est rate of change of the bacterial community was ob-served for the 30‡C incubation treatment, while the ratefollowing treatment at 20‡C was slower (initial IT experi-ment, Fig. 3a) or exhibited hardly any change at all (mainIT experiment, Fig. 3b). The change was always faster atthe beginning of the incubation period, and only smallchanges in the PLFA pattern were found after about 30days incubation.
When comparing the e¡ect of substrate addition, i.e.liming of the soil, the two extreme treatments are ULand EL. Earlier studies have shown that the activity(and thus turnover) of the bacterial community wasmuch lower in the UL samples than in the EL samples,with the FL samples showing intermediate values [6].However, in the main IT experiment, the rate of changeof the PLFA pattern at 30‡C was the same for both theUL30 and FL30 samples (Fig. 3b).
Although the main e¡ects regarding the ¢rst principalcomponent were related to temperature, this componentwas not entirely temperature-dependent. Di¡erences couldbe seen in the ¢rst component between UL5 and FL5 (Fig.2a). However, there was no di¡erence in the resultingPLFA pattern after prolonged incubation at 30‡C irre-spective of liming treatment (UL, EL or FL, Fig. 3b).
The initial PLFA pattern before decreasing the temper-ature in the ¢rst DT experiment is the same as that at theend of the main IT experiment, while for the second DTexperiment the initial conditions were those after 35 daysincubation of the soil samples at 5, 20 and 30‡C. The ¢rstprincipal component accounted for 21.7% of the variationin the ¢rst DT experiment and the second component for15.3% of the variation (data not shown). In the second DTexperiment the corresponding ¢gures were 28.5% for the¢rst component and 19.6% for the second (Fig. 2a).
In the ¢rst DT experiment no changes in the PLFApattern were found after reducing the temperature of thesoil samples to 5‡C (Fig. 3c). No di¡erences were observedbetween the UL, EL and FL soils. Neither were any di¡er-ences found between these three soils in the second DTexperiment, and therefore the mean values are presented(Fig. 3d). In the second DT experiment a small change inthe PLFA pattern over time could be detected for thesamples whose temperatures were reduced from 30 and20‡C to 5‡C compared with those maintained at 20 and30‡C throughout the experiment (Figs. 2b, 3d, ANOVA,P6 0.001). This change in PLFA pattern was less than thechange in the pattern during the same time (35 days) whenincreasing the temperature from 5 to 30‡C (Fig. 2b). ThePLFA pattern did not return to the original state, which isthe PLFA pattern for the samples incubated at 5‡C. Thus,the change in PLFA pattern due to increasing tempera-tures was faster than the change due to decreasing temper-ature, even when the absolute change in temperature (30to 5‡C or 5 to 30‡C) was the same.
UL5 , 5
UL20 , 5
UL20, 20
UL30 , 5
UL30, 30
EL5 , 5
EL20 , 5
EL20, 20
EL30 , 5
EL30, 30
FL5 , 5
FL20 , 5
FL20, 20
FL30 , 5
FL30, 30
UL5UL30
EL5
EL20
EL30
FL5
FL30
UL5
FL5
a
b
PC1 (28 .9 , 28 .5%)
PC
2 (
20
.5,
19
.6%
)
Fig. 2. PCA of the PLFA data from (a) main IT experiment, (b) DT ex-periment 2. The lines drawn in (a) indicate the change with time, wherethe time increases from left to right. The error bars in (a) indicate thestandard error for the UL5 and FL5 samples. The long arrow in (b) in-dicates the change in PLFA pattern during 35 days after increasing thetemperature from 5 to 30‡C for the EL samples, while the short arrowindicates the change when decreasing the temperature from 30 to 5‡C.Abbreviations: UL=unlimed soil, EL= experimentally limed soil andFL=¢eld limed soil. Subscripts indicate soil incubation temperature(5, 20 or 30‡C). The second subscript indicates the temperature in thesecond part of the DT experiments where some of the samples were re-duced to a lower temperature.
FEMSEC 1517 2-6-03
M. Pettersson, E. Bafiafith / FEMS Microbiology Ecology 45 (2003) 13^2116
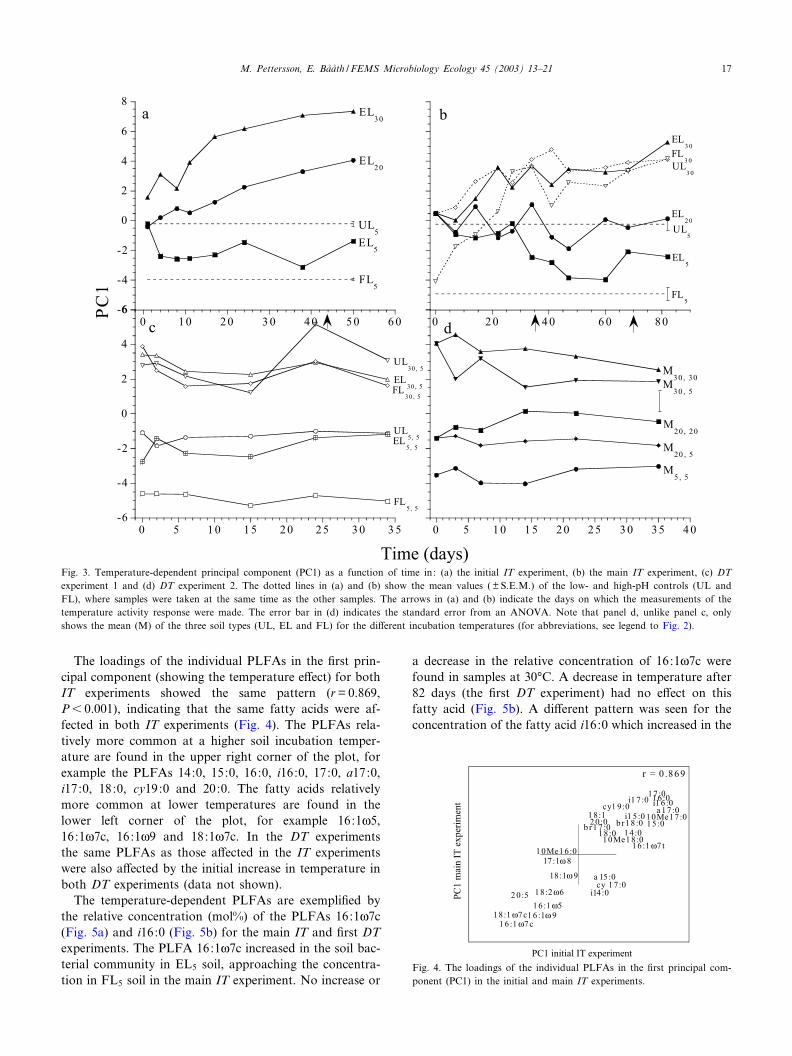
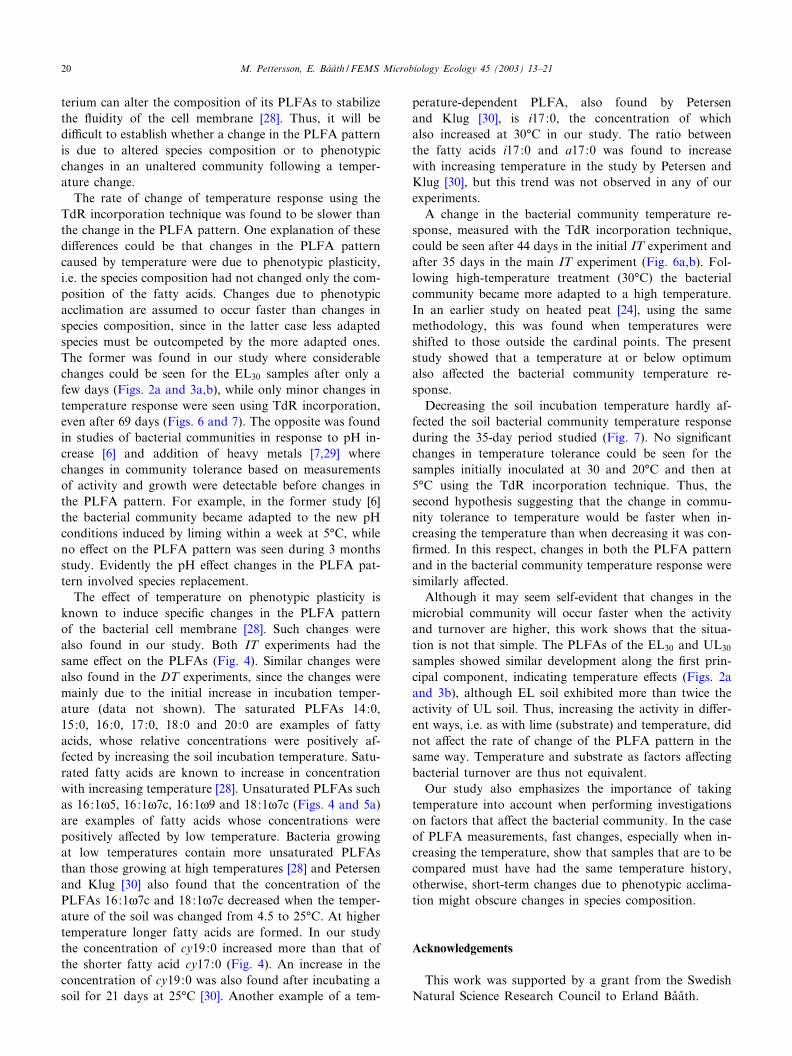
The loadings of the individual PLFAs in the ¢rst prin-cipal component (showing the temperature e¡ect) for bothIT experiments showed the same pattern (r=0.869,P6 0.001), indicating that the same fatty acids were af-fected in both IT experiments (Fig. 4). The PLFAs rela-tively more common at a higher soil incubation temper-ature are found in the upper right corner of the plot, forexample the PLFAs 14:0, 15:0, 16:0, i16:0, 17:0, a17:0,i17:0, 18:0, cy19:0 and 20:0. The fatty acids relativelymore common at lower temperatures are found in thelower left corner of the plot, for example 16:1g5,16:1g7c, 16:1g9 and 18:1g7c. In the DT experimentsthe same PLFAs as those a¡ected in the IT experimentswere also a¡ected by the initial increase in temperature inboth DT experiments (data not shown).
The temperature-dependent PLFAs are exempli¢ed bythe relative concentration (mol%) of the PLFAs 16:1g7c(Fig. 5a) and i16:0 (Fig. 5b) for the main IT and ¢rst DTexperiments. The PLFA 16:1g7c increased in the soil bac-terial community in EL5 soil, approaching the concentra-tion in FL5 soil in the main IT experiment. No increase or
a decrease in the relative concentration of 16:1g7c werefound in samples at 30‡C. A decrease in temperature after82 days (the ¢rst DT experiment) had no e¡ect on thisfatty acid (Fig. 5b). A di¡erent pattern was seen for theconcentration of the fatty acid i16:0 which increased in the
Fig. 4. The loadings of the individual PLFAs in the ¢rst principal com-ponent (PC1) in the initial and main IT experiments.
0 5 1 0 1 5 2 0 2 5 3 0 3 5-6
-4
-2
0
2
4
6
UL30 , 5
EL30, 5FL
3 0, 5
EL5, 5
UL5, 5
FL5, 5
0 5 1 0 1 5 2 0 2 5 3 0 3 5 4 0
M30, 30
M30 , 5
M20, 20
M20 , 5
M5 , 5
0 2 0 4 0 6 0 8 0
UL5
FL5
EL3 0
UL3 0
FL3 0
EL2 0
EL5
-6
-4
-2
0
2
4
6
8
0 1 0 2 0 3 0 4 0 5 0 6 0
FL5
UL5
EL30
EL20
EL5
a b
c d
PC
1
Time (days)Fig. 3. Temperature-dependent principal component (PC1) as a function of time in: (a) the initial IT experiment, (b) the main IT experiment, (c) DTexperiment 1 and (d) DT experiment 2. The dotted lines in (a) and (b) show the mean values ( T S.E.M.) of the low- and high-pH controls (UL andFL), where samples were taken at the same time as the other samples. The arrows in (a) and (b) indicate the days on which the measurements of thetemperature activity response were made. The error bar in (d) indicates the standard error from an ANOVA. Note that panel d, unlike panel c, onlyshows the mean (M) of the three soil types (UL, EL and FL) for the di¡erent incubation temperatures (for abbreviations, see legend to Fig. 2).
FEMSEC 1517 2-6-03
M. Pettersson, E. Bafiafith / FEMS Microbiology Ecology 45 (2003) 13^21 17
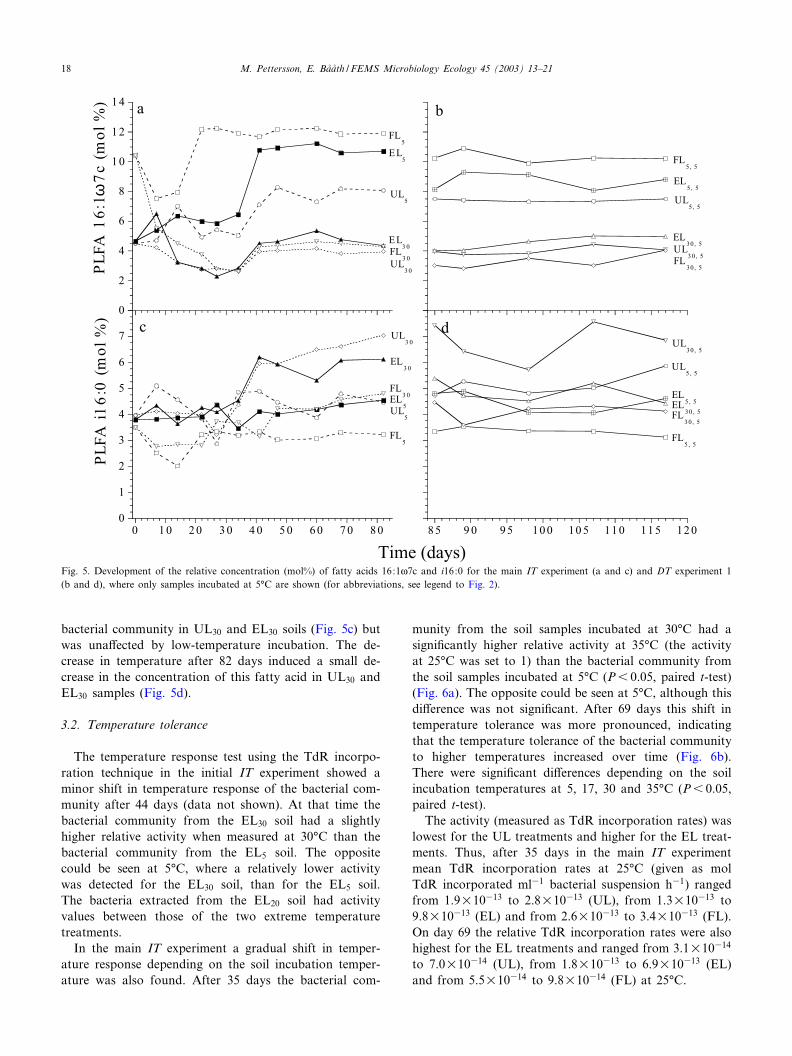
bacterial community in UL30 and EL30 soils (Fig. 5c) butwas una¡ected by low-temperature incubation. The de-crease in temperature after 82 days induced a small de-crease in the concentration of this fatty acid in UL30 andEL30 samples (Fig. 5d).
3.2. Temperature tolerance
The temperature response test using the TdR incorpo-ration technique in the initial IT experiment showed aminor shift in temperature response of the bacterial com-munity after 44 days (data not shown). At that time thebacterial community from the EL30 soil had a slightlyhigher relative activity when measured at 30‡C than thebacterial community from the EL5 soil. The oppositecould be seen at 5‡C, where a relatively lower activitywas detected for the EL30 soil, than for the EL5 soil.The bacteria extracted from the EL20 soil had activityvalues between those of the two extreme temperaturetreatments.
In the main IT experiment a gradual shift in temper-ature response depending on the soil incubation temper-ature was also found. After 35 days the bacterial com-
munity from the soil samples incubated at 30‡C had asigni¢cantly higher relative activity at 35‡C (the activityat 25‡C was set to 1) than the bacterial community fromthe soil samples incubated at 5‡C (P6 0.05, paired t-test)(Fig. 6a). The opposite could be seen at 5‡C, although thisdi¡erence was not signi¢cant. After 69 days this shift intemperature tolerance was more pronounced, indicatingthat the temperature tolerance of the bacterial communityto higher temperatures increased over time (Fig. 6b).There were signi¢cant di¡erences depending on the soilincubation temperatures at 5, 17, 30 and 35‡C (P6 0.05,paired t-test).
The activity (measured as TdR incorporation rates) waslowest for the UL treatments and higher for the EL treat-ments. Thus, after 35 days in the main IT experimentmean TdR incorporation rates at 25‡C (given as molTdR incorporated ml31 bacterial suspension h31) rangedfrom 1.9U10313 to 2.8U10313 (UL), from 1.3U10313 to9.8U10313 (EL) and from 2.6U10313 to 3.4U10313 (FL).On day 69 the relative TdR incorporation rates were alsohighest for the EL treatments and ranged from 3.1U10314
to 7.0U10314 (UL), from 1.8U10313 to 6.9U10313 (EL)and from 5.5U10314 to 9.8U10314 (FL) at 25‡C.
0
1
2
3
4
5
6
7
0 1 0 2 0 3 0 4 0 5 0 6 0 7 0 8 0
UL3 0
EL3 0
UL5
EL5
FL3 0
FL5
8 5 9 0 9 5 10 0 10 5 11 0 11 5 12 0
UL30, 5
UL5, 5
EL5, 5EL30, 5FL3 0, 5
FL5 , 5
FL5, 5
EL5, 5
UL5, 5
EL30, 5
UL3 0, 5
FL30, 5
0
2
4
6
8
1 0
1 2
1 4
FL5
EL5
UL5
EL3 0
FL3 0
UL3 0
a b
c d
Time (days)
PL
FA
16
:17
c (
mo
l %
)P
LF
A i
16
:0 (
mo
l %
)ω
Fig. 5. Development of the relative concentration (mol%) of fatty acids 16:1g7c and i16:0 for the main IT experiment (a and c) and DT experiment 1(b and d), where only samples incubated at 5‡C are shown (for abbreviations, see legend to Fig. 2).
FEMSEC 1517 2-6-03
M. Pettersson, E. Bafiafith / FEMS Microbiology Ecology 45 (2003) 13^2118
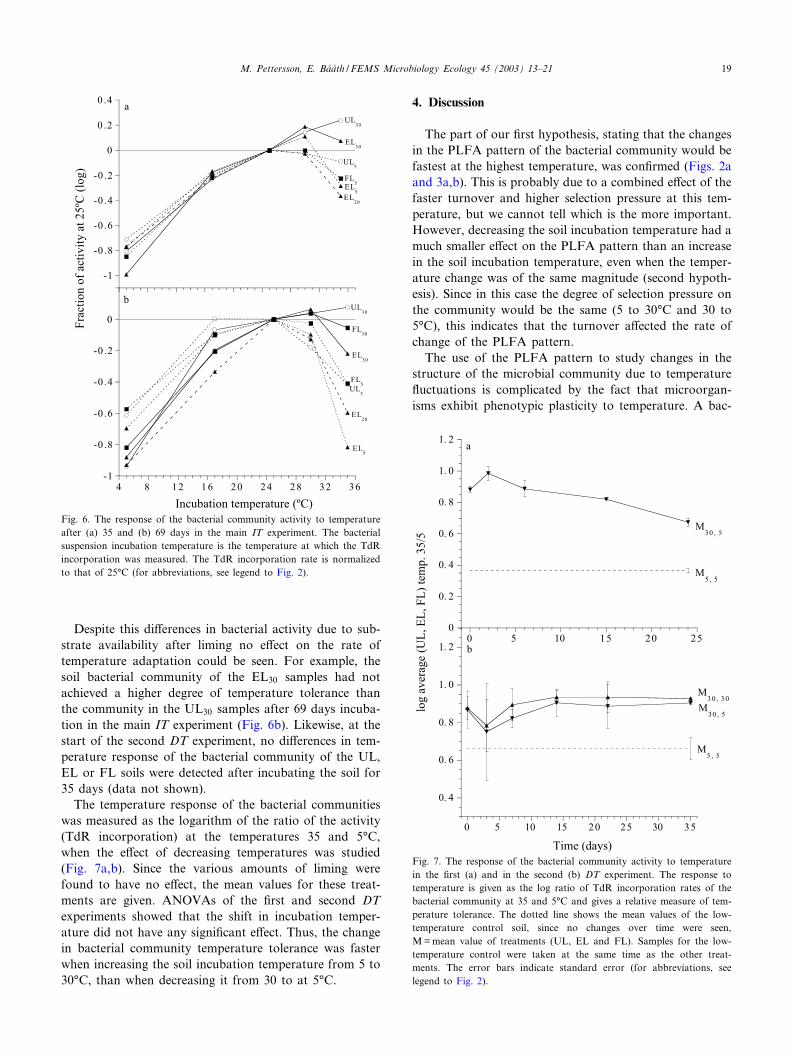
Despite this di¡erences in bacterial activity due to sub-strate availability after liming no e¡ect on the rate oftemperature adaptation could be seen. For example, thesoil bacterial community of the EL30 samples had notachieved a higher degree of temperature tolerance thanthe community in the UL30 samples after 69 days incuba-tion in the main IT experiment (Fig. 6b). Likewise, at thestart of the second DT experiment, no di¡erences in tem-perature response of the bacterial community of the UL,EL or FL soils were detected after incubating the soil for35 days (data not shown).
The temperature response of the bacterial communitieswas measured as the logarithm of the ratio of the activity(TdR incorporation) at the temperatures 35 and 5‡C,when the e¡ect of decreasing temperatures was studied(Fig. 7a,b). Since the various amounts of liming werefound to have no e¡ect, the mean values for these treat-ments are given. ANOVAs of the ¢rst and second DTexperiments showed that the shift in incubation temper-ature did not have any signi¢cant e¡ect. Thus, the changein bacterial community temperature tolerance was fasterwhen increasing the soil incubation temperature from 5 to30‡C, than when decreasing it from 30 to at 5‡C.
4. Discussion
The part of our ¢rst hypothesis, stating that the changesin the PLFA pattern of the bacterial community would befastest at the highest temperature, was con¢rmed (Figs. 2aand 3a,b). This is probably due to a combined e¡ect of thefaster turnover and higher selection pressure at this tem-perature, but we cannot tell which is the more important.However, decreasing the soil incubation temperature had amuch smaller e¡ect on the PLFA pattern than an increasein the soil incubation temperature, even when the temper-ature change was of the same magnitude (second hypoth-esis). Since in this case the degree of selection pressure onthe community would be the same (5 to 30‡C and 30 to5‡C), this indicates that the turnover a¡ected the rate ofchange of the PLFA pattern.
The use of the PLFA pattern to study changes in thestructure of the microbial community due to temperature£uctuations is complicated by the fact that microorgan-isms exhibit phenotypic plasticity to temperature. A bac-
0. 4
0. 6
0. 8
1. 0
1. 2
0 5 10 15 20 25 30 35
M3 0, 3 0
M30 , 5
M5 , 5
0
0. 2
0. 4
0. 6
0. 8
1. 0
1. 2
0 5 10 15 20 25
M5 , 5
M30 , 5
a
b
Time (days)
log a
ver
age
(UL
, E
L, F
L)
tem
p. 35/5
Fig. 7. The response of the bacterial community activity to temperaturein the ¢rst (a) and in the second (b) DT experiment. The response totemperature is given as the log ratio of TdR incorporation rates of thebacterial community at 35 and 5‡C and gives a relative measure of tem-perature tolerance. The dotted line shows the mean values of the low-temperature control soil, since no changes over time were seen,M=mean value of treatments (UL, EL and FL). Samples for the low-temperature control were taken at the same time as the other treat-ments. The error bars indicate standard error (for abbreviations, seelegend to Fig. 2).
-1
-0 .8
-0 .6
-0 .4
-0 .2
0
4 8 1 2 1 6 20 24 28 32 36
UL5
UL30
EL5
EL20
EL30
FL5
FL30
-1
-0 .8
-0 .6
-0 .4
-0 .2
0
0 .2
0 .4
UL5
UL30
EL5
EL20
EL30
FL5
a
b
Incubation temperature (ºC)
Fra
ctio
n o
f ac
tiv
ity
at
25
ºC (
log
)
Fig. 6. The response of the bacterial community activity to temperatureafter (a) 35 and (b) 69 days in the main IT experiment. The bacterialsuspension incubation temperature is the temperature at which the TdRincorporation was measured. The TdR incorporation rate is normalizedto that of 25‡C (for abbreviations, see legend to Fig. 2).
FEMSEC 1517 2-6-03
M. Pettersson, E. Bafiafith / FEMS Microbiology Ecology 45 (2003) 13^21 19
terium can alter the composition of its PLFAs to stabilizethe £uidity of the cell membrane [28]. Thus, it will bedi⁄cult to establish whether a change in the PLFA patternis due to altered species composition or to phenotypicchanges in an unaltered community following a temper-ature change.
The rate of change of temperature response using theTdR incorporation technique was found to be slower thanthe change in the PLFA pattern. One explanation of thesedi¡erences could be that changes in the PLFA patterncaused by temperature were due to phenotypic plasticity,i.e. the species composition had not changed only the com-position of the fatty acids. Changes due to phenotypicacclimation are assumed to occur faster than changes inspecies composition, since in the latter case less adaptedspecies must be outcompeted by the more adapted ones.The former was found in our study where considerablechanges could be seen for the EL30 samples after only afew days (Figs. 2a and 3a,b), while only minor changes intemperature response were seen using TdR incorporation,even after 69 days (Figs. 6 and 7). The opposite was foundin studies of bacterial communities in response to pH in-crease [6] and addition of heavy metals [7,29] wherechanges in community tolerance based on measurementsof activity and growth were detectable before changes inthe PLFA pattern. For example, in the former study [6]the bacterial community became adapted to the new pHconditions induced by liming within a week at 5‡C, whileno e¡ect on the PLFA pattern was seen during 3 monthsstudy. Evidently the pH e¡ect changes in the PLFA pat-tern involved species replacement.
The e¡ect of temperature on phenotypic plasticity isknown to induce speci¢c changes in the PLFA patternof the bacterial cell membrane [28]. Such changes werealso found in our study. Both IT experiments had thesame e¡ect on the PLFAs (Fig. 4). Similar changes werealso found in the DT experiments, since the changes weremainly due to the initial increase in incubation temper-ature (data not shown). The saturated PLFAs 14:0,15:0, 16:0, 17:0, 18:0 and 20:0 are examples of fattyacids, whose relative concentrations were positively af-fected by increasing the soil incubation temperature. Satu-rated fatty acids are known to increase in concentrationwith increasing temperature [28]. Unsaturated PLFAs suchas 16:1g5, 16:1g7c, 16:1g9 and 18:1g7c (Figs. 4 and 5a)are examples of fatty acids whose concentrations werepositively a¡ected by low temperature. Bacteria growingat low temperatures contain more unsaturated PLFAsthan those growing at high temperatures [28] and Petersenand Klug [30] also found that the concentration of thePLFAs 16:1g7c and 18:1g7c decreased when the temper-ature of the soil was changed from 4.5 to 25‡C. At highertemperature longer fatty acids are formed. In our studythe concentration of cy19:0 increased more than that ofthe shorter fatty acid cy17:0 (Fig. 4). An increase in theconcentration of cy19:0 was also found after incubating asoil for 21 days at 25‡C [30]. Another example of a tem-
perature-dependent PLFA, also found by Petersenand Klug [30], is i17:0, the concentration of whichalso increased at 30‡C in our study. The ratio betweenthe fatty acids i17:0 and a17:0 was found to increasewith increasing temperature in the study by Petersen andKlug [30], but this trend was not observed in any of ourexperiments.
A change in the bacterial community temperature re-sponse, measured with the TdR incorporation technique,could be seen after 44 days in the initial IT experiment andafter 35 days in the main IT experiment (Fig. 6a,b). Fol-lowing high-temperature treatment (30‡C) the bacterialcommunity became more adapted to a high temperature.In an earlier study on heated peat [24], using the samemethodology, this was found when temperatures wereshifted to those outside the cardinal points. The presentstudy showed that a temperature at or below optimumalso a¡ected the bacterial community temperature re-sponse.
Decreasing the soil incubation temperature hardly af-fected the soil bacterial community temperature responseduring the 35-day period studied (Fig. 7). No signi¢cantchanges in temperature tolerance could be seen for thesamples initially inoculated at 30 and 20‡C and then at5‡C using the TdR incorporation technique. Thus, thesecond hypothesis suggesting that the change in commu-nity tolerance to temperature would be faster when in-creasing the temperature than when decreasing it was con-¢rmed. In this respect, changes in both the PLFA patternand in the bacterial community temperature response weresimilarly a¡ected.
Although it may seem self-evident that changes in themicrobial community will occur faster when the activityand turnover are higher, this work shows that the situa-tion is not that simple. The PLFAs of the EL30 and UL30
samples showed similar development along the ¢rst prin-cipal component, indicating temperature e¡ects (Figs. 2aand 3b), although EL soil exhibited more than twice theactivity of UL soil. Thus, increasing the activity in di¡er-ent ways, i.e. as with lime (substrate) and temperature, didnot a¡ect the rate of change of the PLFA pattern in thesame way. Temperature and substrate as factors a¡ectingbacterial turnover are thus not equivalent.
Our study also emphasizes the importance of takingtemperature into account when performing investigationson factors that a¡ect the bacterial community. In the caseof PLFA measurements, fast changes, especially when in-creasing the temperature, show that samples that are to becompared must have had the same temperature history,otherwise, short-term changes due to phenotypic acclima-tion might obscure changes in species composition.
Acknowledgements
This work was supported by a grant from the SwedishNatural Science Research Council to Erland Bafiafith.
FEMSEC 1517 2-6-03
M. Pettersson, E. Bafiafith / FEMS Microbiology Ecology 45 (2003) 13^2120
References
[1] Boylen, C.W. and Brock, T.D. (1973) Bacterial decomposition pro-cesses in Lake Wingra sediments during winter. Limnol. Oceanogr.18, 628^634.
[2] Li, W.K.W. and Dickie, P.M. (1987) Temperature characteristics ofphotosynthetic and heterotrophic activities : seasonal variation intemperate microbial plankton. Appl. Environ. Microbiol. 53, 2282^2295.
[3] McKinley, V.L. and Vestal, R.J. (1984) Biokinetic analyses of adap-tation and succession: microbial activity in composting municipalsewage sludge. Appl. Environ. Microbiol. 47, 933^941.
[4] Nedwell, D.B. and Floodgate, G.D. (1971) The seasonal selection bytemperature of heterotrophic bacteria in an intertidal sediment. Mar.Biol. 11, 306^311.
[5] Zeikus, J.G. and Brock, T.D. (1971) E¡ects of thermal additionsfrom the Yellowstone geyser basins on the bacteriology of the ¢reholeriver. Ecology 53, 283^290.
[6] Pettersson, M. and Bafiafith, E. (2003) The rate of pH adaptation of asoil bacterial community after liming as a function of temperature.Microb. Ecol. 43 (in press).
[7] Diaz-Ravin‹a, M. and Bafiafith, E. (1996) Development of metal toler-ance in bacterial communities exposed to experimentally increasedmetal levels. Appl. Environ. Microbiol. 62, 2970^2977.
[8] Persson, T., Wiren, A. and Andersson, S. (1991) E¡ects of liming oncarbon and nitrogen mineralization in coniferous forests. Water AirSoil Pollut. 54, 351^364.
[9] Shah, Z., Adams, W.A. and Haven, C.D.V. (1989) Composition andactivity of the microbial population in an acidic upland soil ande¡ects of liming. Soil Biol. Biochem. 22, 257^263.
[10] Bafiafith, E. (1992) Thymidine incorporation into macromolecules ofbacteria extracted from soil by homogenization-centrifugation. SoilBiol. Biochem. 24, 1157^1165.
[11] Diaz-Ravin‹a, M., Frostegafird, AY . and Bafiafith, E. (1994) Thymidine,leucine and acetate incorporation into soil bacterial assemblages atdi¡erent temperatures. FEMS Microb. Ecol. 14, 221^232.
[12] Andersson, S. and Nilsson, S.I. (2001) In£uence of pH and temper-ature on microbial activity, substrate availability of soil-solution bac-teria and leaching of dissolved organic carbon in a mor humus. SoilBiol. Biochem. 33, 1181^1191.
[13] Andersson, S., Nilsson, I. and Saetre, P. (2000) Leaching of organiccarbon (DOC) and dissolved organic nitrogen (DON) in mor humusas a¡ected by temperature and pH. Soil Biol. Biochem. 32, 1^10.
[14] Shiah, F.K. and Ducklow, H.W. (1994) Temperature and substrateregulation of bacterial abundance, production, and a speci¢c growthrate in Chesapeake Bay, USA. Mar. Ecol. Prog. Ser. 103, 297^308.
[15] Shiah, F.K. and Ducklow, H.W. (1997) Bacterioplankton growthresponses to temperature and chlorophyll variations in estuaries mea-sured by thymidine:leucine incorporation ratio. Aquat. Microb. Ecol.13, 151^159.
[16] Simon, M. and Wu«nsch, C. (1998) Temperature control of bacterio-plankton growth in a temperate large lake. Aquat. Microb. Ecol. 16,119^130.
[17] Tibbles, B.J. (1996) E¡ect of temperature on the incorporation ofleucine and thymidine by bacterioplankton and bacterial isolates.Aquat. Microb. Ecol. 11, 239^250.
[18] Klamer, M. and Bafiafith, E. (1998) Microbial community dynamicsduring composting of straw material studied using phospholipid fattyacid analysis. FEMS Microb. Ecol. 27, 9^20.
[19] Ranneklev, S.B. and Bafiafith, E. (2003) The use of phospholipid fattyacids to detect previous self-heating events in stored peat. Appl. En-viron. Microbiol., 69 (in press).
[20] Bardgett, R.D., Kandeler, E., Tscherko, D., Hobbs, P.J., Bezemer,T.M., Jones, T.H. and Thompson, L.J. (1999) Below-ground micro-bial community development in a high temperature world. Oikos 85,193^203.
[21] Norris, T.B., Wraith, J.M., Castenholz, R.W. and McDermott, T.R.(2002) Soil microbial community structure across a thermal gradientfollowing a geothermal heating event. Appl. Environ. Microbiol. 68,6300^6309.
[22] Chin, K.J., Lukow, T. and Conrad, R. (1999) E¡ect of temperatureon structure and function of the methanogenic archaeal communityin an anoxic rice ¢eld soil. Appl. Environ. Microbiol. 65, 2341^2349.
[23] Wu, X.L., Chin, K.L. and Conrad, R. (2002) E¡ect of temperaturestress on structure and function of the methanogenic archaeal com-munity in a rice ¢eld soil. FEMS Microb. Ecol. 39, 211^218.
[24] Ranneklev, S.B. and Bafiafith, E. (2001) Temperature-driven adaptationof the bacterial community in peat measured by thymidine and leu-cine incorporation. Appl. Environ. Microbiol. 67, 1116^1122.
[25] Frostegafird, AY ., Bafiafith, E. and Tunlid, A. (1993) Shifts in the struc-ture of soil microbial communities in limed forests as revealed byphospholipid fatty acid analysis. Soil Biol. Biochem. 25, 723^730.
[26] Bafiafith, E., Pettersson, M. and So«derberg, K.H. (2001) Adaptation ofa rapid and economical microcentrifugation method to measure thy-midine and leucine incorporation by soil bacteria. Soil Biol. Biochem.33, 1571^1574.
[27] Robarts, D.R. and Zohary, T. (1993) Fact or ¢ction ^ bacterialgrowth rates and production as determined by [methyl-3H]-thymi-dine? Adv. Microb. Ecol. 13, 371^425.
[28] Russell, N.J. and Fukunaga, N. (1990) A comparison of thermaladaptation of membrane lipids in psychrophilic and thermophilicbacteria. FEMS Microbiol. Rev. 75, 171^182.
[29] Frostegafird, AY ., Tunlid, A. and Bafiafith, E. (1996) Changes in microbialcommunity structure during long-term incubation in two soils exper-imentally contaminated with metals. Soil Biol. Biochem. 28, 55^63.
[30] Petersen, S.O. and Klug, M.J. (1994) E¡ects of sieving, storage andincubation temperature on the phospholipid fatty acid pro¢le of asoil microbial community. Appl. Environ. Microbiol. 60, 2421^2430.
FEMSEC 1517 2-6-03
M. Pettersson, E. Bafiafith / FEMS Microbiology Ecology 45 (2003) 13^21 21