temperature dependence of helium-implantation … dependence of helium-implantation-induced lattice...
TRANSCRIPT
Temperature Dependence of Helium-Implantation-Induced Lattice Swelling in
Polycrystalline Tungsten: X-ray Micro-Diffraction and Eigenstrain Modelling
I. de Broglie1, 2, C. E. Beck3, W. Liu4, F. Hofmann1*
1 Department of Engineering Science, University of Oxford, Parks Road, Oxford OX1 3PJ, UK 2 École Polytechnique, Route de Saclay, 91128 Palaiseau, France 3 Department of Materials,University of Oxford, Parks Road, Oxford OX1 3PH, UK 4 Advanced Photon Source, Argonne National Laboratory, 9700 South Cass Ave., Argonne, IL
60439, USA
* [email protected] +44 1865 283446
Using synchrotron X-ray micro-diffraction and Eigenstrain analysis we measure the
distribution of lattice swelling in the vicinity of grain boundaries in helium-implanted
tungsten samples. As-implanted specimens and specimens heat-treated at up to 1473 K
after implantation show significant differences. In heat-treated samples lattice swelling is
less uniform and varies significantly from grain to grain. Furthermore an increase of lattice
swelling is found in the vicinity of some grain boundaries, even at depths beyond the
implanted layer thickness. These findings are discussed in the context of the migration of
helium-ion-implantation-induced defects.
Tungsten-based alloys are the most promising materials for plasma facing divertor
components in future nuclear fusion reactors [1, 2]. During operation they will be exposed
to high temperatures ( > 1500 K), high neutron flux (~2 MW/m2) and intense bombardment
with hydrogen isotopes and helium (~10 MW/m2) [3]. Their mechanical behaviour is strongly
influenced by the interaction of helium with irradiation-induced defects. Indeed nano-
indentation showed that the combined effect of helium and cascade damage is much more
prominent than that of cascade damage alone [4].
The interaction of retained helium with collision cascade induced defects can be studied
using helium ion implantation. In metals the defect microstructure is dominated by the
propensity of helium to form tightly bound configurations with vacancies [5, 6]. At
temperatures below ~550 K vacancies in tungsten are immobile and do not cluster [7, 8].

Indeed previous transmission electron microscopy (TEM) of tungsten implanted with 3000
atomic parts per million (appm) of helium at 573 K showed no visible defects [4]. This
suggests that all vacancy and self interstitial atom (SIA) defects were smaller than the TEM
resolution limit.
At higher temperatures vacancies become mobile, and clustering of vacancies and SIAs
occurs [9]. It is also expected that these defects will migrate deeper into the material,
beyond the depth of the originally implanted layer, escape at free surfaces and accumulate
at grain boundaries. A particular concern is the accumulation of helium at grain boundaries,
resulting in embrittlement [10].
The objective of this work is to explore experimentally the migration of defects in helium-
implanted tungsten at fusion relevant temperatures. Synchrotron X-ray micro-beam Laue
diffraction (Fig. 1 (a)) provides a non-destructive means of probing helium-implantation-
induced defects, invisible in the TEM, by measuring the lattice distortions associated with
them [11]. We use this technique to quantify near grain boundary lattice strains in
polycrystalline tungsten implanted with helium at 298 K, followed by heat treatment up to
1473 K. The experimental data is interpreted using an Eigenstrain modelling approach to
recover lattice swelling and allow conclusions about defect migration to be reached.
Rolled, ultra high purity (99.99%) tungsten was recrystallized for 24 hours at 1673 K in
vacuum. Three 1.3 mm thick samples were mechanically polished to produce a flat, defect-
free surface finish. Electron Backscatter Diffraction (EBSD) showed large grains (30 to 300
μm diameter) with negligible texture. Helium-ion implantation at 298 K was carried out at
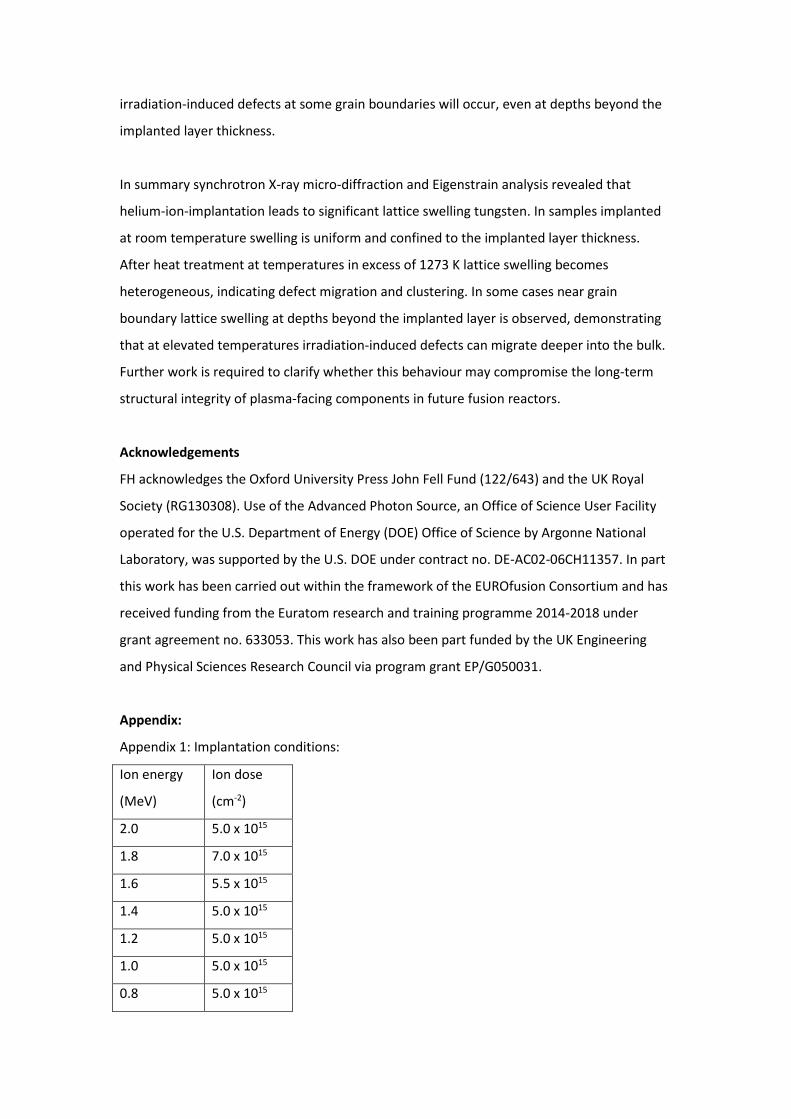
the National Ion Beam Facility, University of Surrey, UK. 13 ion energies from 0.05 MeV to
2.0 MeV (see table in Appendix 1) were used to build up a near uniform calculated helium
concentration of 3180 ± 220 appm within a 2.7 μm thick surface layer. The implantation
profile, predicted using the Stopping Range of Ions in Matter (SRIM) code [12], with a
displacement threshold of 68 eV [13], is shown in Fig. 1 (b). The calculated displacement
damage in the implanted layer is 0.21 ± 0.03 displacements per atom (dpa). Sample T298
remained as implanted. Samples T1273 and T1473 were heat treated for 12 hours in vacuum
at 1273 K and 1473 K respectively.

Micro-beam Laue diffraction was performed at beamline 34-ID-E at the Advanced Photon
Source (APS), Argonne National Lab, USA. Fig. 1 (a) shows a schematic of the experimental
setup [14, 15]. A polychromatic X-ray beam (7 – 30 keV) was focussed to a 0.4 x 0.6 μm2 spot
(full width at half maximum, horizontal x vertical) on the sample. Single crystal Laue patterns
containing 20+ peaks were recorded on an area detector mounted above the sample.
Diffraction patterns were fitted using the LaueGo software (J.Z. Tischler: [email protected]) to
determine lattice orientation and the deviatoric elastic strain tensor, e*. The full elastic
strain tensor, e, is not accessible since no monochromatic measurements were performed
[16]. Differential Aperture X-ray Microscopy (DAXM) was used to gain spatial resolution
along the incident beam direction by scanning a 50 μm diameter platinum wire through the
diffracted beams [17, 18]. Triangulating using the wire edge allowed depth-resolved Laue
patterns to be reconstructed with 0.5 μm nominal resolution along the incident beam
direction.
Fig. 1 (c) shows the deviatoric strains measured in sample T298 as a function of depth from
the sample surface (mean and standard deviation computed from measurement shown in
Fig. 2(b)). At depths beyond the implanted layer all strain components are small. In the
implanted layer (at depths up to 2.7 μm), out-of plane deviatoric strain is large and positive
(ezz* = (7.6 ± 1.3) x 10-4), whilst the in-plane deviatoric strains are similar in magnitude and
negative (exx* = (-3.7 ± 1.3) x 10-4; eyy
* = (-3.9 ± 1.9) x 10-4). This suggests a lattice swelling of
the implanted layer. Compatibility of the unimplanted substrate and the implanted layer
requires the in-plane total elastic strains to be zero (i.e. exx = eyy = 0). As tungsten is
elastically isotropic at room temperature [19-21], ezz is approximately given by:
. (1)
The volumetric lattice strain, ev, is:
, (2)
where ν is the Poisson ratio (ν = 0.28 [19-21]). Eqn. 2 yields ev = (1.93 ± 0.49) x 10-3, in good
agreement with our previous measurements of a helium-implanted tungsten-rhenium alloy
[11].
To probe changes of lattice swelling near grain boundaries due to heat treatment, two grain
boundaries (straight, longer than 100 μm and near perpendicular to sample surface) were
selected in each sample. At each boundary DAXM measurements were carried out at 0.5 μm
increments along a 20 μm long line perpendicular to the boundary (Fig. 2(a) for boundary B1
in sample T298, referred to as T298_B1). The measurement plane is inclined at 45° to the
sample surface (Fig. 1(a)). Since the grain boundaries are long, variation of strains along the
grain boundary is expected to be small. Hence, for further analysis, strain were projected
onto a vertical slice through the grain boundary, with a width of 20 μm parallel to the
sample surface (41 measurement points) and a height of 9 μm in the depth direction (27
measurement points).
Fig. 2 (b) shows the measured map of ezz* for T298_B1. Near the sample surface an increase
in ezz* due to helium-implantation-induced lattice swelling is evident. The profile varies little
as a function of distance from the grain boundary. The minor axis width of Laue diffraction
peaks provides information about the variation of lattice distortion in the gauge volume
[22]. It is plotted in Fig 2(c), averaged over all diffraction peaks, for boundary T298_B1. Peak
width is substantially increased in the implanted layer due to implantation-induced point
defects. The extent of this region agrees well with the lattice strain profile (Fig. 2 (b)) and the
SRIM-predicted implantation profile (Fig. 1 (b)).
Determining the lattice swelling distribution that causes a measured deviatoric strain
distribution becomes less straightforward when lattice swelling is not only a function of
depth (sample T298), but also of position perpendicular to the grain boundary (samples
T1273 and T1473). Here we develop an Eigenstrain approach [23], to solve the inverse
problem of recovering the lattice swelling distribution from a measured deviatoric strain
distribution. Eigenstrain refers to a permanent, heterogeneous inelastic strain distribution
(in our case defect-induced lattice swelling) that results in a non-uniform residual elastic
strain field. Our analysis broadly follows the treatment of Jun et al. [24].
In the small strain approximation, total strain is the sum of Eigenstrain, ε*, and residual
elastic strain, e. From measurements we know residual deviatoric elastic strain, e*, at N
points xi. We call ε*(x) the unknown Eigenstrain distribution at position x, which creates an

unknown deviatoric elastic strain field E* = f(ε*). We aim to find an Eigenstrain distribution,
ε*(x), such that:
(3)
is minimised. This summation can be extended to include several strain components kl. The
unknown Eigenstrain distribution is approximated as:
, (4)
where ξ j=1..M are M basis functions and c j=1..M are unknown coefficients. Each basis function
produces a residual deviatoric elastic strain field . Using superposition we obtain
. To solve the inverse Eigenstrain problem a set of coefficients cj=1..M
that minimise Eqn. 3 is required.
As Eigenstrain basis functions, ξ j(x), we chose a localised swelling of 10-6 (i.e. ξ j = 1/3x10-6 I,
where I is the identity matrix) imposed at each experimental measurement point, within a
volume of side length equal to the measurement point spacing. The determined coefficients
then correspond to volumetric lattice strain, ev, in microstrain (10-6).
Residual deviatoric elastic strain fields, , were computed using the CAST3M finite
element software (http://www-cast3m.cea.fr) with QUA4 constant strain elements. Remote
from the grain boundary we imposed exx = 0 to enforce compatibility between the implanted
layer and the unimplanted substrate. For long straight grain boundaries no significant
variation along the grain boundary is expected (eyy = 0). ezz = 0 was imposed at a depth of 20
μm, much deeper than then implanted layer thickness. Results were insensitive to exact
boundary conditions, provided they were imposed sufficiently far from the grain boundary
intersection with the sample surface.
Several fitting schemes were considered (see supplementary section 1). In the following
both exx* and ezz* strain components were taken into account when determining

coefficients cj. Tikhonov regularization was used to reduce the influence of experimental
noise by penalising the gradient of lattice swelling in both x and z directions. Thus we
actually minimised a more complicated expression for J than Eqn. 3:
, (5)
where and . and are the
discrete gradient matrices in the x and z directions respectively. Lattice swelling implies an
expansion of the lattice. To reflect this we must have coefficients cj >= 0, which was
enforced by using the lsqnonneg function in Matlab to minimise Eqn. 5. A value of λ =
2.6*10-7 was used in Eqn. 5, determined by considering experimental uncertainties as
described in more detail in the supplementary section 2.
The reconstructed e*zz strain field from Eigenstrain analysis of boundary T298_B1 and the
corresponding Eigenstrain distribution are shown in Fig. 2 (d) and (e) respectively.
Agreement between the experimentally measured (Fig. 2 (b)) and reconstructed (Fig. 2 (d))
e*zz strain fields is very good. Tikhonov regularisation means that the reconstructed strain
field is a low-pass-filtered version of the measured one, but retains the salient features. The
Eigenstrain map (Fig. 2(e)) show localised swelling in the implanted layer. The average value
of ev up to 2.7 μm depth is (1890 ± 340) x 10-6, in good agreement with out previous
estimate of (1930 ± 490) x 10-6 from Fig. 1 (c).
Fig. 3 shows the Eigenstrain maps reconstructed for all six measurements: two in sample
T298 (Fig. 3 (a), (b)), two in sample T1273 (Fig. 3 (c), (d)) and two in sample T1473 (Fig. 3 (e),
(f)). All maps show volumetric lattice strain, ev = ε*(x), on the same scale. Grain boundaries
are indicated by dashed lines.
In sample T298 swelling of the implanted layer is relatively homogeneous and largely
confined to the SRIM-predicted implantation depth of ~3 μm. In comparison both maps in
sample T1273 (Fig. 3 (c), (d)) show a reduction of swelling and an increase in heterogeneity.
One of the grain boundaries also shows a clear increase in near boundary swelling (Fig. 3

(c)), whilst no such localisation is seen in the other (Fig. 3 (d)). The T1473 grain boundaries
(Fig. 3 (e), (f)) show a similar, though more pronounced, behaviour.
TEM [4], positron annihilation spectroscopy [5], thermal desorption spectroscopy [25] and
ab-initio calculations [6] suggest that under our implantation conditions (298K, He-ions with
up to 2 MeV) helium-filled vacancies and SIA defects will be formed. At 298 K significant
clustering of these defects is not expected. Indeed even in tungsten samples implanted with
helium at 573 K at similar ion energy and dose, TEM showed no visible defect clusters [4].
The uniform distribution of swelling in the implanted layer in sample T0 is consistent with
this view of a defect microstructure dominated by uniformly distributed point defects much
smaller than the sampling volume size ( ~ 0.5 x 0.5 x 0.5 μm3).
Above ~600 K vacancies in tungsten become mobile [7, 26] and clustering of SIAs and
vacancies is expected. Consistent with this, both T1273 and T1473 show a less uniform
lattice swelling distribution than T298, indicating the migration and clustering of defects.
The reduced swelling in T1273 and T1473 can be understood in two ways: First the lattice
strain (and hence swelling) associated with N point defects is larger than that associated
with a cluster of the same N defects. For N isolated SIAs, the lattice volume increase is NΩr ,
where Ωr is the SIA relaxation volume. For large N, a cluster of N SIAs will form the well-
known 1/2 <111> prismatic dislocation loop with volume approaching NΩ0, where Ω0 is the
atomic volume. For SIAs in tungsten Ωr > Ω0 [11] and hence SIA clustering will lead to a
reduction in lattice swelling. Second mobility of vacancies and SIAs at elevated temperatures
allows their migration to sinks, such as the sample surface and grain boundaries. This
provides a second pathway for lattice swelling reduction in T1273 and T1473. In T1473 (Fig.
3 (e) and (f)) lattice swelling also varies strongly from grain to grain, indicating that the
migration and clustering of helium-implantation-induced defects is highly dependent on
lattice orientation.
One map in each T1273 and T1473 (Fig. 3 (c) and (e) respectively) shows a significant
increase of lattice swelling at the grain boundary. This suggests an accumulation of defects
at the grain boundary during heat treatment. The other two maps in T1273 and T1473 (Fig. 3
(d) and (f) respectively) do not show this effect. A clear link between the grain boundary
structure and the increased lattice swelling after heat treatment could not be found.
However we can unambiguously state that at elevated temperatures accumulation of
irradiation-induced defects at some grain boundaries will occur, even at depths beyond the
implanted layer thickness.
In summary synchrotron X-ray micro-diffraction and Eigenstrain analysis revealed that
helium-ion-implantation leads to significant lattice swelling tungsten. In samples implanted
at room temperature swelling is uniform and confined to the implanted layer thickness.
After heat treatment at temperatures in excess of 1273 K lattice swelling becomes
heterogeneous, indicating defect migration and clustering. In some cases near grain
boundary lattice swelling at depths beyond the implanted layer is observed, demonstrating
that at elevated temperatures irradiation-induced defects can migrate deeper into the bulk.
Further work is required to clarify whether this behaviour may compromise the long-term
structural integrity of plasma-facing components in future fusion reactors.
Acknowledgements
FH acknowledges the Oxford University Press John Fell Fund (122/643) and the UK Royal
Society (RG130308). Use of the Advanced Photon Source, an Office of Science User Facility
operated for the U.S. Department of Energy (DOE) Office of Science by Argonne National
Laboratory, was supported by the U.S. DOE under contract no. DE-AC02-06CH11357. In part
this work has been carried out within the framework of the EUROfusion Consortium and has
received funding from the Euratom research and training programme 2014-2018 under
grant agreement no. 633053. This work has also been part funded by the UK Engineering
and Physical Sciences Research Council via program grant EP/G050031.
Appendix:
Appendix 1: Implantation conditions:
Ion energy
(MeV)
Ion dose
(cm-2)
2.0 5.0 x 10¹⁵
1.8 7.0 x 10¹⁵
1.6 5.5 x 10¹⁵
1.4 5.0 x 10¹⁵
1.2 5.0 x 10¹⁵
1.0 5.0 x 10¹⁵
0.8 5.0 x 10¹⁵
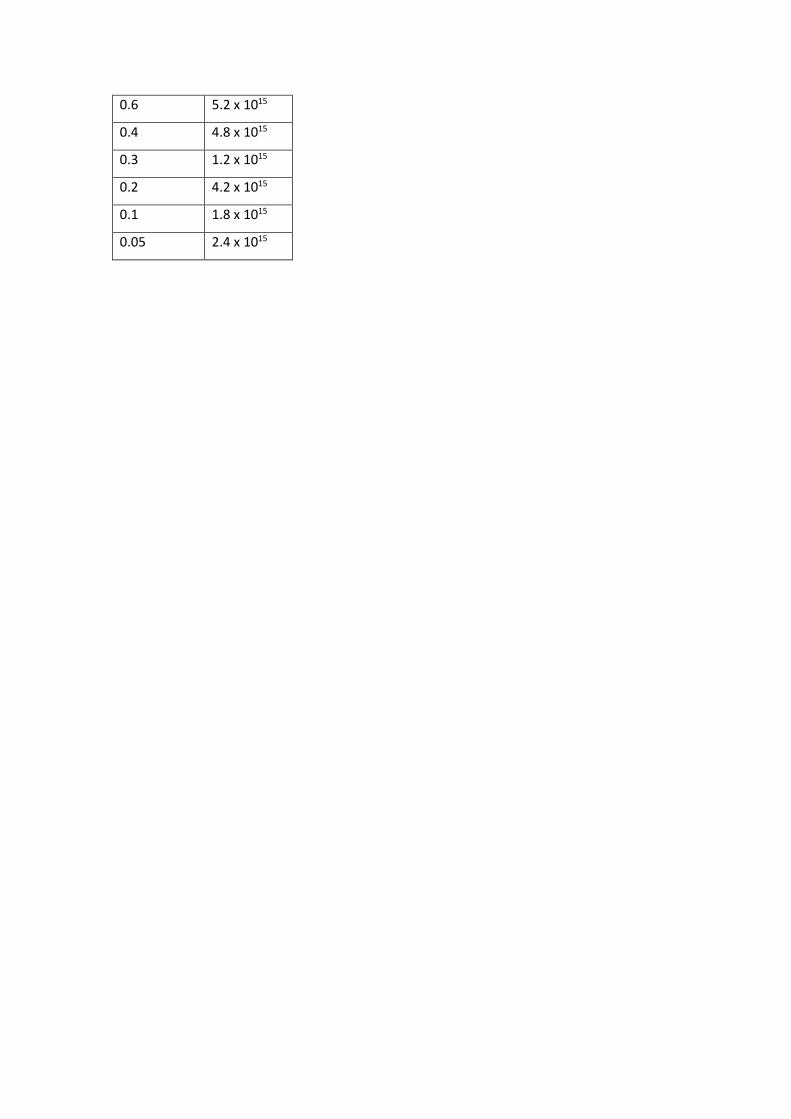
0.6 5.2 x 10¹⁵
0.4 4.8 x 10¹⁵
0.3 1.2 x 10¹⁵
0.2 4.2 x 10¹⁵
0.1 1.8 x 10¹⁵
0.05 2.4 x 10¹⁵
Figures
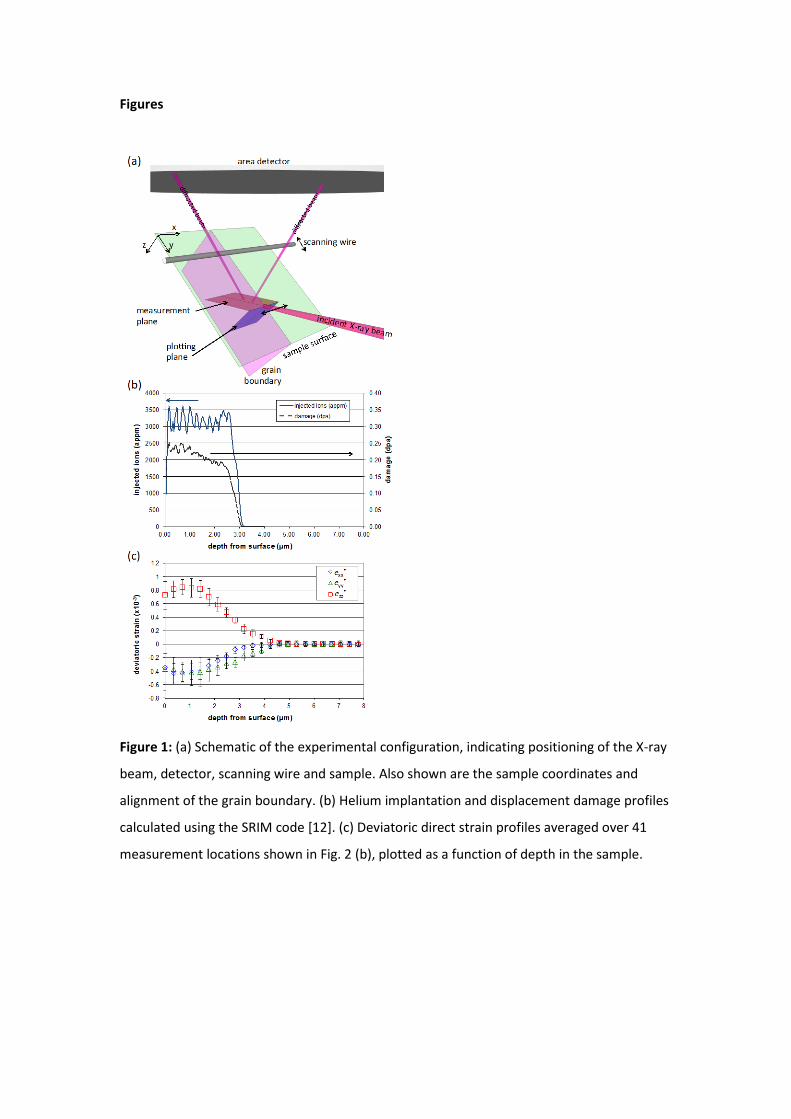
Figure 1: (a) Schematic of the experimental configuration, indicating positioning of the X-ray
beam, detector, scanning wire and sample. Also shown are the sample coordinates and
alignment of the grain boundary. (b) Helium implantation and displacement damage profiles
calculated using the SRIM code [12]. (c) Deviatoric direct strain profiles averaged over 41
measurement locations shown in Fig. 2 (b), plotted as a function of depth in the sample.

Figure 2: Boundary B1 in sample T298. (a) Optical micrograph of the boundary showing also
the intersection of the measured slice with the sample surface (black line). The scale bar
corresponds to 50 μm. (b) Measured out of plane deviatoric strain, e*zz. (c) Laue peak minor
axis full width at half maximum in pixels. (d) Out of plane deviatoric strain, e*zz,
reconstructed by Eigenstrain. (e) Swelling, ev, determined from Eigenstrain (x 10-6). Maps (b)
– (e) are in the x-z plane, the dashed lines indicate the position of the grain boundary and
the scale bar corresponds to 5 μm.
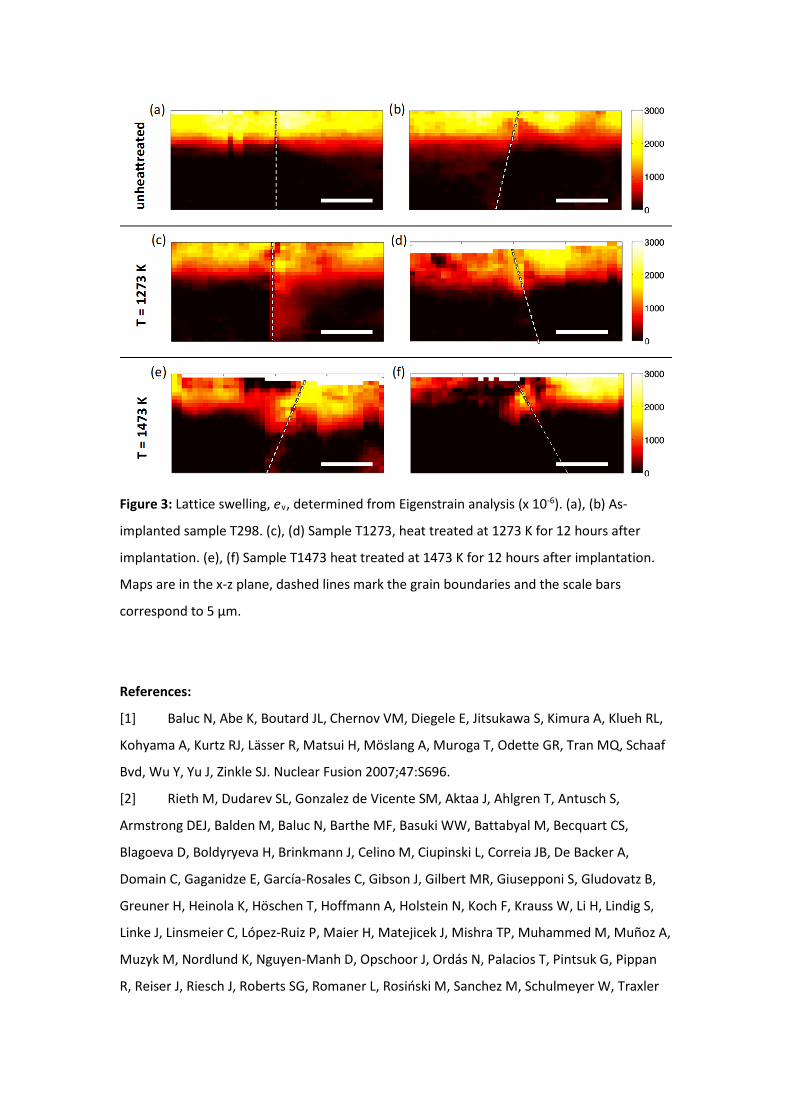
Figure 3: Lattice swelling, ev, determined from Eigenstrain analysis (x 10-6). (a), (b) As-
implanted sample T298. (c), (d) Sample T1273, heat treated at 1273 K for 12 hours after
implantation. (e), (f) Sample T1473 heat treated at 1473 K for 12 hours after implantation.
Maps are in the x-z plane, dashed lines mark the grain boundaries and the scale bars
correspond to 5 μm.
References:
[1] Baluc N, Abe K, Boutard JL, Chernov VM, Diegele E, Jitsukawa S, Kimura A, Klueh RL,
Kohyama A, Kurtz RJ, Lässer R, Matsui H, Möslang A, Muroga T, Odette GR, Tran MQ, Schaaf
Bvd, Wu Y, Yu J, Zinkle SJ. Nuclear Fusion 2007;47:S696.
[2] Rieth M, Dudarev SL, Gonzalez de Vicente SM, Aktaa J, Ahlgren T, Antusch S,
Armstrong DEJ, Balden M, Baluc N, Barthe MF, Basuki WW, Battabyal M, Becquart CS,
Blagoeva D, Boldyryeva H, Brinkmann J, Celino M, Ciupinski L, Correia JB, De Backer A,
Domain C, Gaganidze E, García-Rosales C, Gibson J, Gilbert MR, Giusepponi S, Gludovatz B,
Greuner H, Heinola K, Höschen T, Hoffmann A, Holstein N, Koch F, Krauss W, Li H, Lindig S,
Linke J, Linsmeier C, López-Ruiz P, Maier H, Matejicek J, Mishra TP, Muhammed M, Muñoz A,
Muzyk M, Nordlund K, Nguyen-Manh D, Opschoor J, Ordás N, Palacios T, Pintsuk G, Pippan
R, Reiser J, Riesch J, Roberts SG, Romaner L, Rosiński M, Sanchez M, Schulmeyer W, Traxler

H, Ureña A, van der Laan JG, Veleva L, Wahlberg S, Walter M, Weber T, Weitkamp T, Wurster
S, Yar MA, You JH, Zivelonghi A. Journal of Nuclear Materials 2013;432:482.
[3] Maisonnier D, Campbell D, Cook I, Pace LD, Giancarli L, Hayward J, Puma AL,
Medrano M, Norajitra P, Roccella M, Sardain P, Tran MQ, Ward D. Nuclear Fusion
2007;47:1524.
[4] Armstrong DEJ, Edmondson PD, Roberts SG. Applied Physics Letters 2013;102:1.
[5] Lhuillier PE, Belhabib T, Desgardin P, Courtois B, Sauvage T, Barthe MF, Thomann AL,
Brault P, Tessier Y. Journal of Nuclear Materials 2011;416:13.
[6] Fu C-C, Willaime F. Physical Review B 2005;72:064117.
[7] Rasch KD, Siegel RW, Schultz H. Philosophical Magazine A 1980;41:91.
[8] Debelle A, Barthe MF, Sauvage T. Journal of Nuclear Materials 2008;376:216.
[9] De Backer A, Lhuillier PE, Becquart CS, Barthe MF. Journal of Nuclear Materials
2012;429:78.
[10] Gerasimenko VI, Mikhailovskii IM, Neklyudov IM, Parkhomenko AA, Velikodnaya OA.
Tech. Phys. 1998;43:803.
[11] Hofmann F, Nguyen-Manh D, Gilbert M, Beck C, Eliason J, Maznev A, Liu W,
Armstrong D, Nelson K, Dudarev S. Acta Materialia 2015;in press.
[12] Ziegler JF, Ziegler MD, Biersack JP. Nuclear Instruments and Methods in Physics
Research, Section B: Beam Interactions with Materials and Atoms 2010;268:1818.
[13] International A. E521 Standard Practice for Neutron Radiation Damage Simulation by
Charged-Particle Irradiation. 2009.
[14] Liu W, Zschack P, Tischler J, Ice G, Larson B. AIP Conference Proceedings
2011;1365:108.
[15] Hofmann F, Abbey B, Liu W, Xu R, Usher BF, Balaur E, Liu Y. Nat Commun 2013;4.
[16] Chung J-S, Ice GE. Journal of Applied Physics 1999;86:5249.
[17] Larson BC, Yang W, Ice GE, Budai JD, Tischler JZ. Nature 2002;415:887.
[18] Liu W, Ice G, Larson B, Yang W, Tischler J, Budai J. Metallurgical and Materials
Transactions A 2004;35:1963.
[19] Bolef DI, De Klerk J. Journal of Applied Physics 1962;33:2311.
[20] Featherston FH, Neighbours JR. Physical Review 1963;130:1324.
[21] Lowrie R, Gonas AM. Journal of Applied Physics 1967;38:4505.
[22] Barabash R, Ice GE, Larson BC, Pharr GM, Chung KS, Yang W. Applied Physics Letters
2001;79:749.

[23] Mura T. Micromechanics of Defects in Solids. Dordrecht, Netherlands: Kluwer
Academic Publishers, 1987.
[24] Jun T-S, Korsunsky AM. International Journal of Solids and Structures 2010;47:1678.
[25] Kornelsen EV. Radiation Effects 1972;13:227.
[26] Nguyen-Manh D, Horsfield AP, Dudarev SL. Physical Review B 2006;73:020101.