temperature calculations and lidar positions - … calculations and lidar positions . ... randy...
TRANSCRIPT
A presentation to;
2011 PLS-CADD™ advanced training and user group meeting
Presented by;
Paul Richardson, Network Mapping 07/19/11
Temperature calculations and LiDAR positions
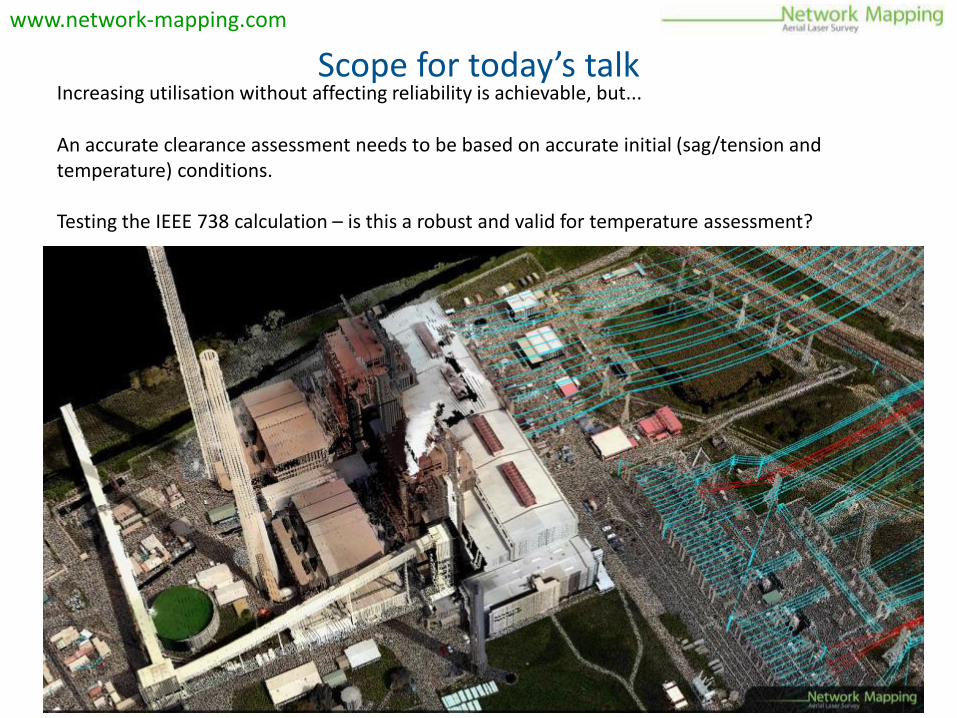
Increasing utilisation without affecting reliability is achievable, but... An accurate clearance assessment needs to be based on accurate initial (sag/tension and
temperature) conditions. Testing the IEEE 738 calculation – is this a robust and valid for temperature assessment?
www.network-mapping.com
Scope for today’s talk

www.network-mapping.com
IEEE 738 temperature calculations
Reliability of the technique
Effects of temperature increase on conductor sag -predicted and measured

• Network Mapping wished to trial the adequacy of the IEEE-738 equation for determining conductor temperature.
• Our intention was to fly a line with the conductor at a lower temperature, where we
could very accurately determine the effects of electrical load, solar radiation and wind speed. This would mean flying at a time of low electrical load, solar radiation and wind speed.
• The intention was to re-fly the same line and to compare the ‘predicted’ conductor
sags against the ‘measured’ conductor sags.
www.network-mapping.com
The approach…
• Network Mapping set up a trial site in North East US. • We flew a section in the morning, expecting low ambient temperature, low electrical
load and low solar radiation. We re-flew the same section in the afternoon expecting higher ambient temperature, higher electrical load and higher solar radiation.
www.network-mapping.com
The survey flights

• Electrical load was broadly similar to the afternoon reading. Also the solar radiation was not as low as we would have wished.
• Wind speed and direction was captured on both occasions using our ultrasonic weather
stations, which unlike traditional anemometers do not suffer from stalling at low wind speed.
• The cooling effect of the wind was broadly similar, slightly higher in the afternoon. • The effect of these was that the difference in temperature between the morning and the
afternoon flight was not as large as we would have wished to trial the IEEE 738 calculation method.
• The IEEE-738 calculation of conductor temperature for the morning flight was 96 deg F. • The IEEE-738 calculation of conductor temperature for the afternoon flight was 105 deg F.
www.network-mapping.com
The survey flights
• We had one of our guys capturing wire positions from a total station early on Sunday morning 03rd July 2011.
• At 06.30 EDT on Sunday morning we had low ambient temperature, low solar radiation
and low electrical load. • The IEEE-738 calculated conductor temperature was 69 degrees F. • We considered this would give us a reasonable temperature shift to get a representative
trial of the technique.
www.network-mapping.com
The control
www.network-mapping.com
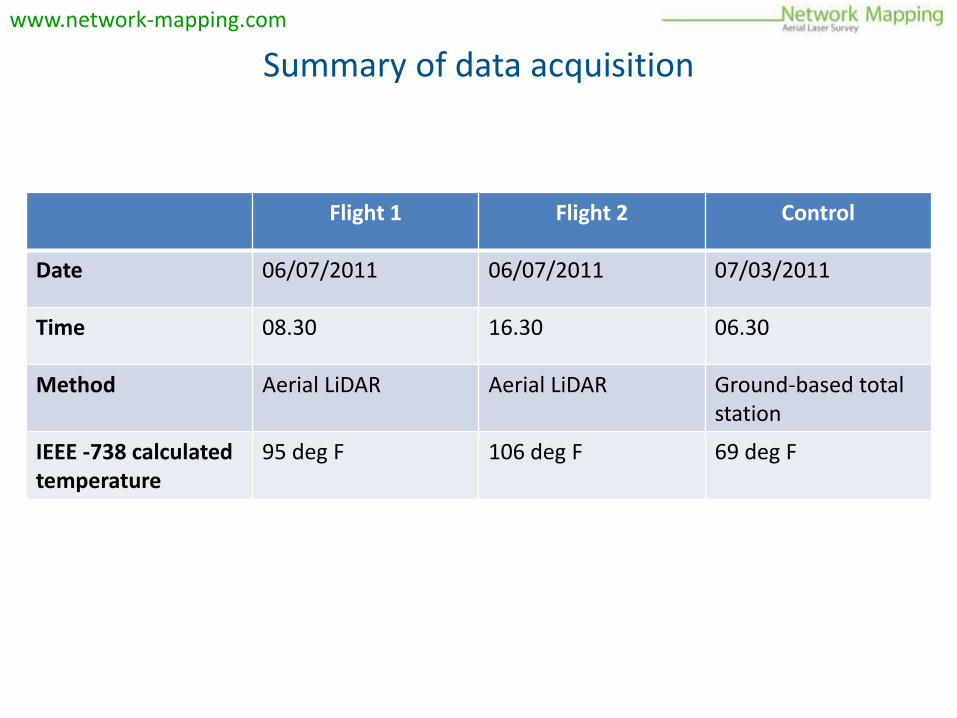
Summary of data acquisition
Flight 1 Flight 2 Control
Date 06/07/2011 06/07/2011 07/03/2011
Time 08.30 16.30 06.30
Method Aerial LiDAR Aerial LiDAR Ground-based total station
IEEE -738 calculated temperature
95 deg F 106 deg F 69 deg F

www.network-mapping.com
IEEE 738 temperature calculations - Control data 06.30 - 07/03/11
Wire position at 69 deg F.

We used the points captured by the total station to set the ‘sagging basis’ for the conductor. We graphically sagged the conductor at the temperature of 69 deg F (creep Finite Element (FE)) to the total station points. We then displayed the conductor at the two comparison conditions. 1. At 105 deg F. (creep FE) 2. At 96 deg F. (creep FE)
The ‘predicted’ conductor position could then be compared against the ‘measured’ sags using the points captured on our two LiDAR flights.
www.network-mapping.com
IEEE 738 temperature calculations Control data 06.30 – 07/03/2011
www.network-mapping.com
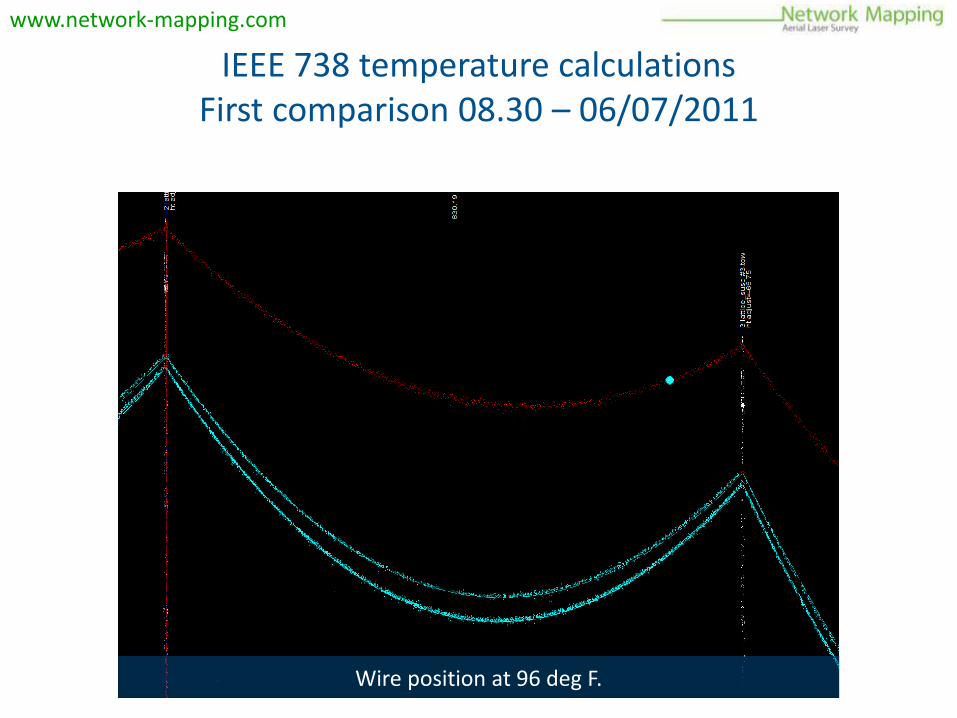
IEEE 738 temperature calculations First comparison 08.30 – 06/07/2011
Wire position at 96 deg F.

• At the 96 degree condition the comparison between predicted and measured results showed good agreement.
• All the LiDAR points were compared with the catenary from PLS-CADD™.
The results show a mean of 0.135 feet, with a standard deviation of 0.13 feet.
-5
0
5
10
15
20
25
30
-0.4 -0.2 0 0.2 0.4 0.6 0.8 1 1.2 1.4
www.network-mapping.com
IEEE 738 temperature calculations First comparison 08.30 - 06/07/2011

www.network-mapping.com
IEEE 738 temperature calculations Second comparison 16.30 on 06/07/2011
Wire position at 105 deg F.

• At the 105 degree condition the comparison between predicted and measured results showed excellent agreement.
• All the LiDAR points were compared with the catenary from PLS-CADD™.
0
10
20
30
40
50
60
-0.6 -0.4 -0.2 0 0.2 0.4 0.6 0.8
The results show a mean of 0.035 feet, with a standard deviation of 0.15 feet.
www.network-mapping.com
IEEE 738 temperature calculations Second comparison 16.30 on 06/07/2011
www.network-mapping.com
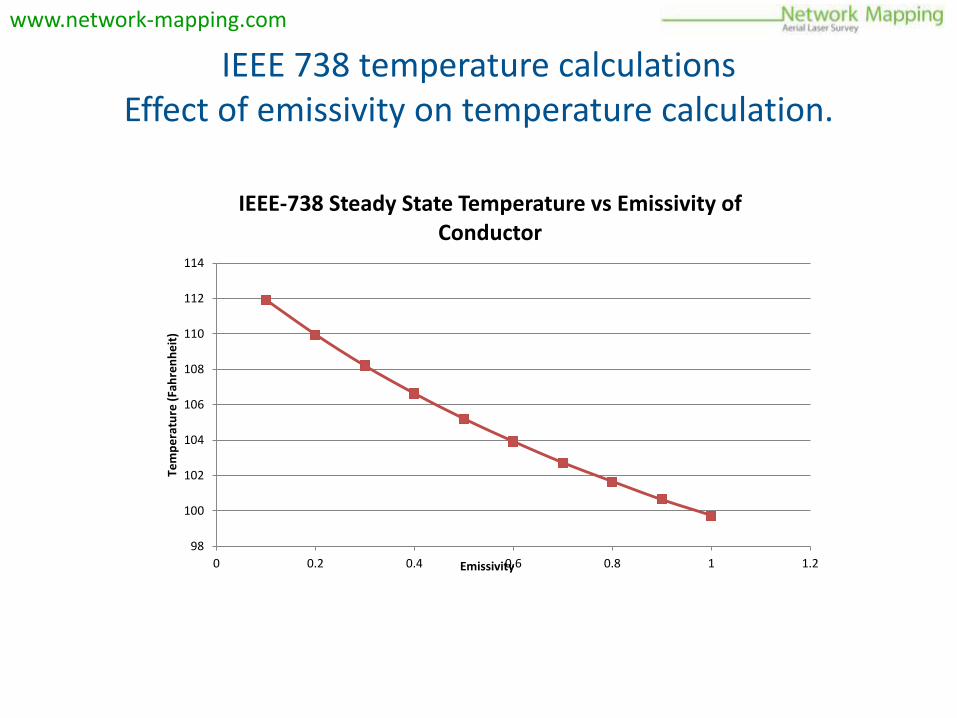
IEEE 738 temperature calculations Effect of emissivity on temperature calculation.
98
100
102
104
106
108
110
112
114
0 0.2 0.4 0.6 0.8 1 1.2
Tem
pe
ratu
re (
Fah
ren
he
it)
Emissivity
IEEE-738 Steady State Temperature vs Emissivity of Conductor

www.network-mapping.com
IEEE 738 temperature calculations By way of comparison the effect of emissivity on IR
recordings.
0
50
100
150
200
250
300
350
1 2 3 4 5 6 7 8 9
Infe
rred
tem
per
atu
re D
eg F
.
Emissivity
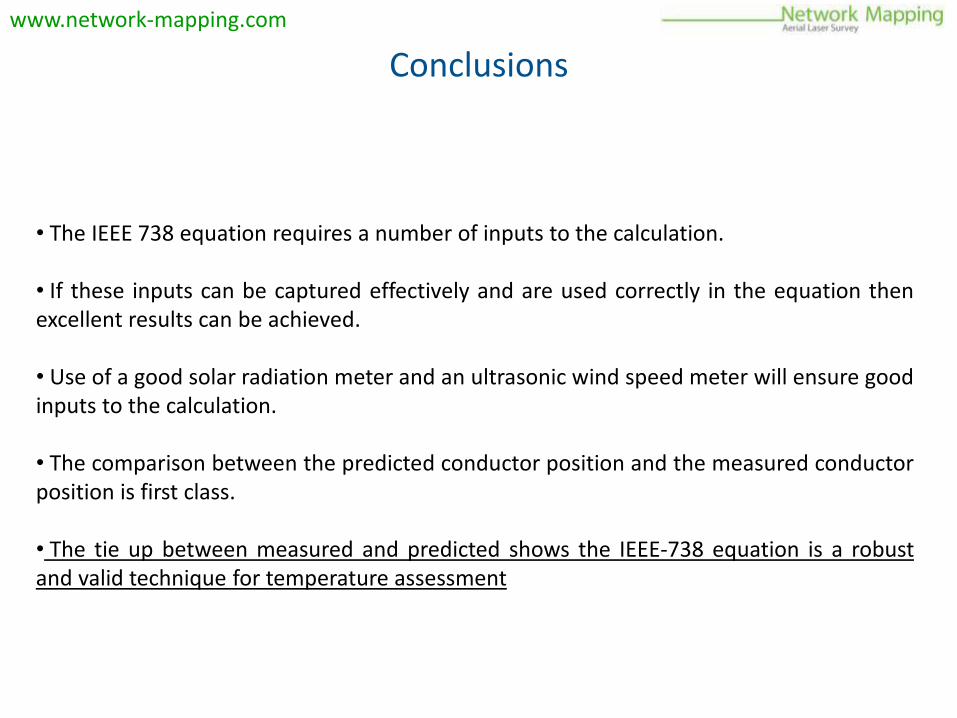
• The IEEE 738 equation requires a number of inputs to the calculation. • If these inputs can be captured effectively and are used correctly in the equation then excellent results can be achieved. • Use of a good solar radiation meter and an ultrasonic wind speed meter will ensure good inputs to the calculation. • The comparison between the predicted conductor position and the measured conductor position is first class. • The tie up between measured and predicted shows the IEEE-738 equation is a robust and valid technique for temperature assessment
www.network-mapping.com
Conclusions

Thank you for your time
www.network-mapping.com
Randy Rhoads Chief Operations Officer GSM: 310-560-4142 Email: [email protected]
Paul Richardson Technical Director GSM: +44 (0)7787 152202 Email: [email protected]
Address; Postal Network Mapping Inc 42905 Secretariat Ct Ashburn, VA 20147 Registered 1220 North Market Street Suite 804 Wilmington Delaware 19801
Contacts and questions