teeb incentive measures by patrick ten brink of ieep stromstadt 7 september final
Upload: patrick-ten-brink-of-the-institute-for-european-environmental-policy
Post on 14-Jul-2015
1.135 views
TRANSCRIPT
9/10/2009 1
Incentives and Financing to integrate the value of biodiversity and ecosystems into our economies
Working insights from TEEB
Patrick ten BrinkTEEB for Policy Makers Co-ordinator
Head of Brussels Office
Institute for European Environmental Policy (IEEP)
Session: 5.3 Financing and incentives
Vision for Biodiversity Beyond 2010: People, Ecosystem Services & the Climate CrisisStrömstad, Sweden7th September 2009
Building on and borrowing from the work & insights of the wider TEEB team
and contributors of supporting studies, call for evidence and other contributions
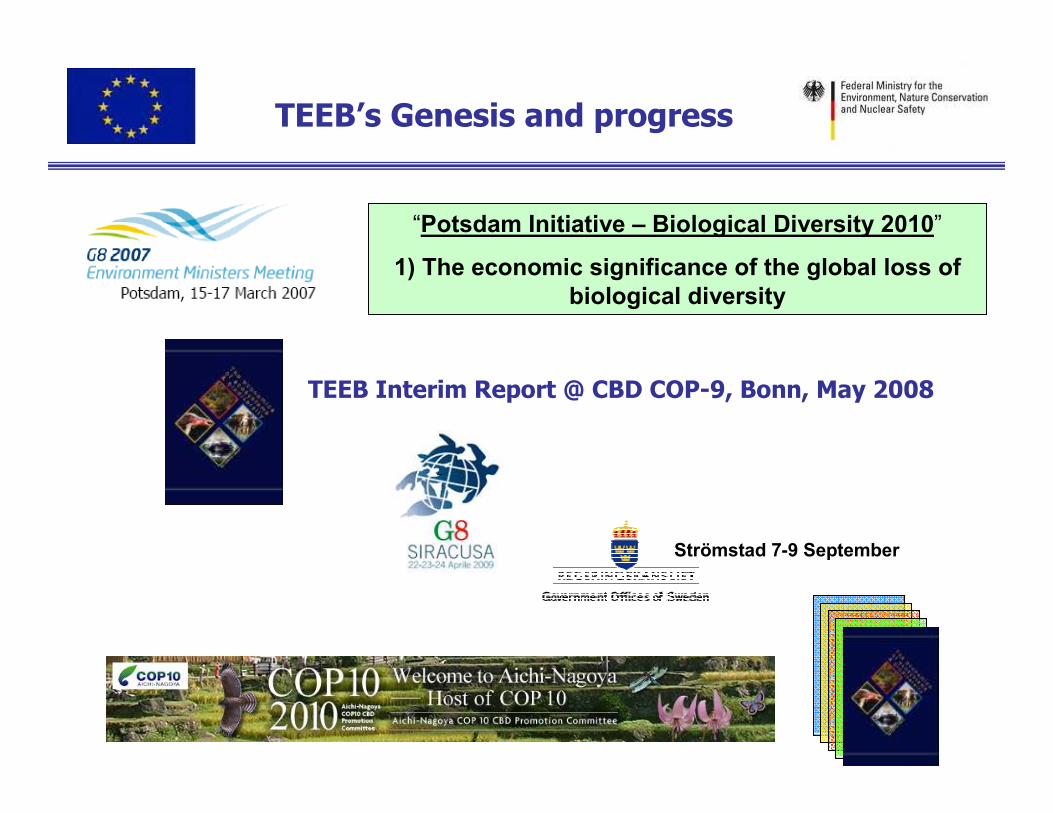
TEEB’s Genesis and progress
“Potsdam Initiative – Biological Diversity 2010”
1) The economic significance of the global loss of biological diversity
TEEB Interim Report @ CBD COP-9, Bonn, May 2008
Strömstad 7-9 September
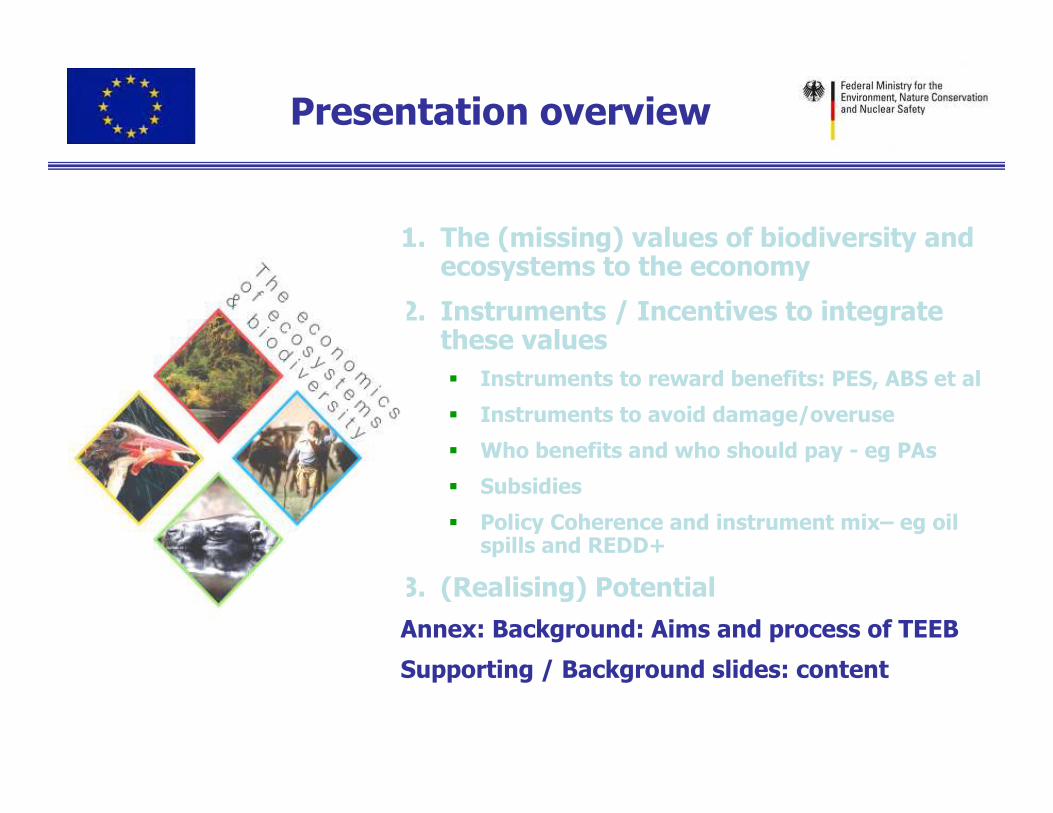
Presentation overview
1. The (missing) values of biodiversity and ecosystems to the economy
2. Instruments to integrate these values
� Instruments to reward benefits: PES, ABS et al
� Instruments to avoid damage/overuse
� Who benefits and who should pay - eg PAs
� Environmental Harmful Subsidies
� Policy Coherence and instrument mix
3. (Realising) Potential
Annex: Background: Aims and process of TEEB
Supporting / Background slides
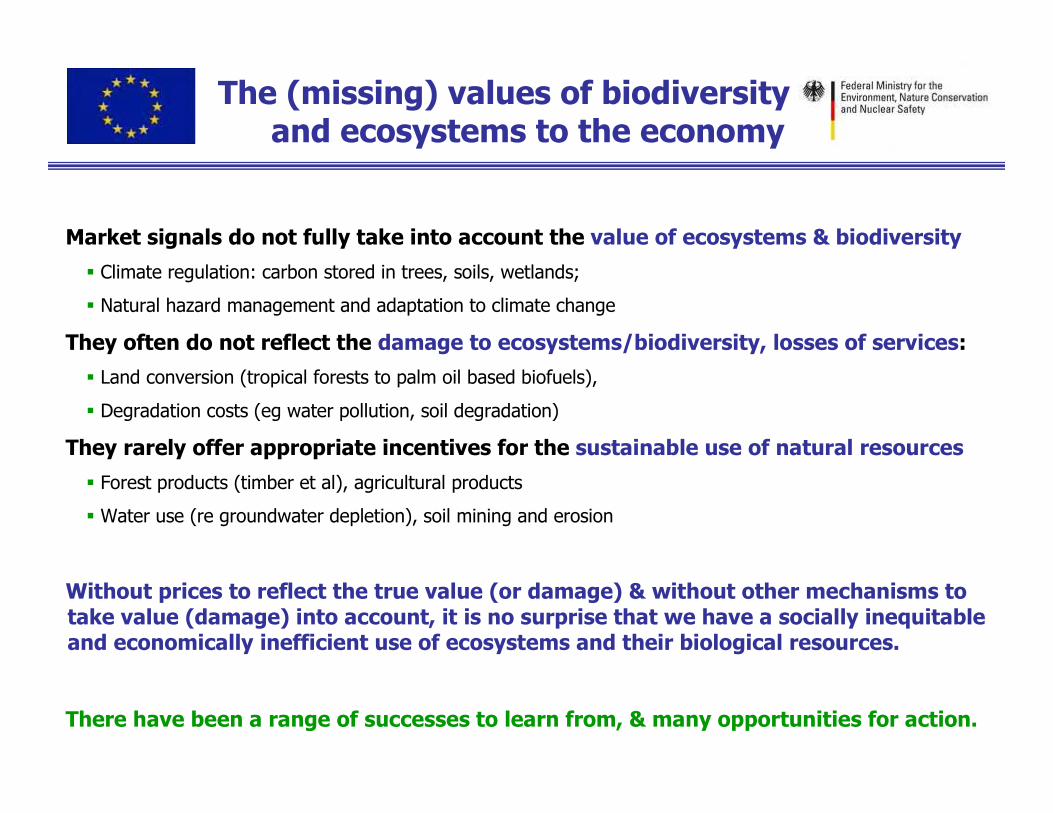
The (missing) values of biodiversity and ecosystems to the economy
Market signals do not fully take into account the value of ecosystems & biodiversity
� Climate regulation: carbon stored in trees, soils, wetlands;
� Natural hazard management and adaptation to climate change
They often do not reflect the damage to ecosystems/biodiversity, losses of services:
� Land conversion (tropical forests to palm oil based biofuels),
� Degradation costs (eg water pollution, soil degradation)
They rarely offer appropriate incentives for the sustainable use of natural resources
� Forest products (timber et al), agricultural products
� Water use (re groundwater depletion), soil mining and erosion
Without prices to reflect the true value (or damage) & without other mechanisms to take value (damage) into account, it is no surprise that we have a socially inequitable and economically inefficient use of ecosystems and their biological resources.
There have been a range of successes to learn from, & many opportunities for action.
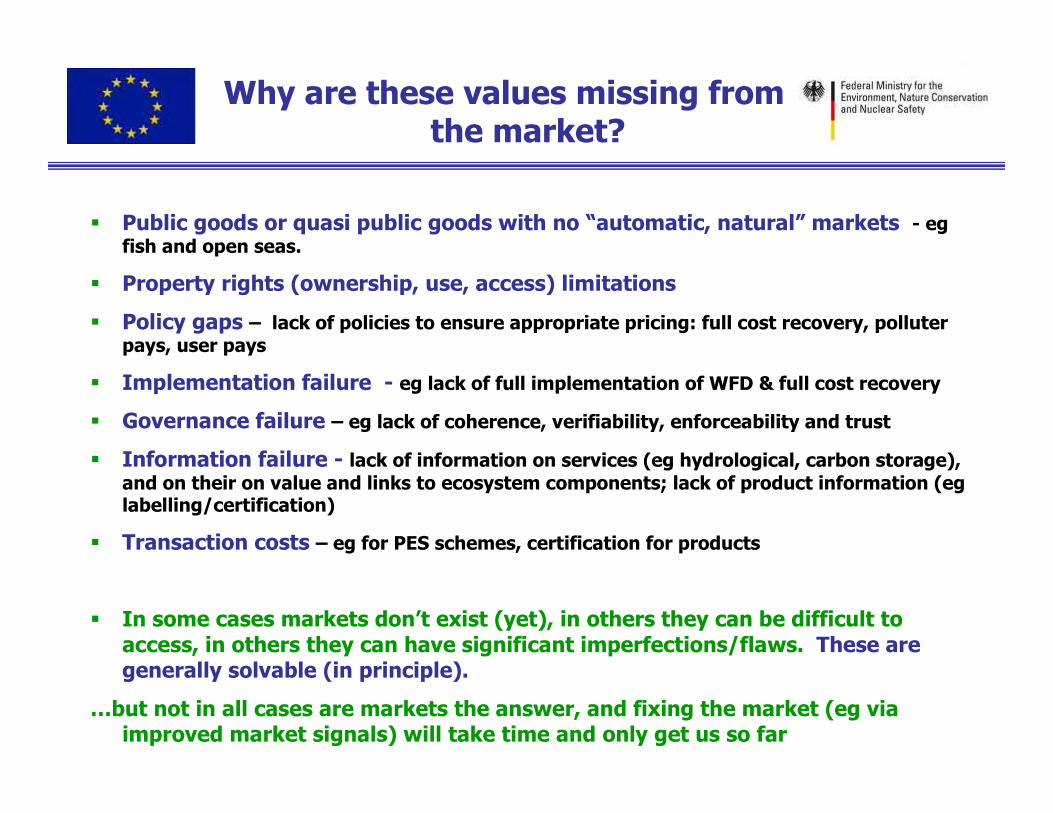
Why are these values missing from the market?
� Public goods or quasi public goods with no “automatic, natural” markets - eg fish and open seas.
� Property rights (ownership, use, access) limitations
� Policy gaps – lack of policies to ensure appropriate pricing: full cost recovery, polluter pays, user pays
� Implementation failure - eg lack of full implementation of WFD & full cost recovery
� Governance failure – eg lack of coherence, verifiability, enforceability and trust
� Information failure - lack of information on services (eg hydrological, carbon storage),
and on their on value and links to ecosystem components; lack of product information (eg labelling/certification)
� Transaction costs – eg for PES schemes, certification for products
� In some cases markets don’t exist (yet), in others they can be difficult to access, in others they can have significant imperfections/flaws. These are generally solvable (in principle).
…but not in all cases are markets the answer, and fixing the market (eg via improved market signals) will take time and only get us so far
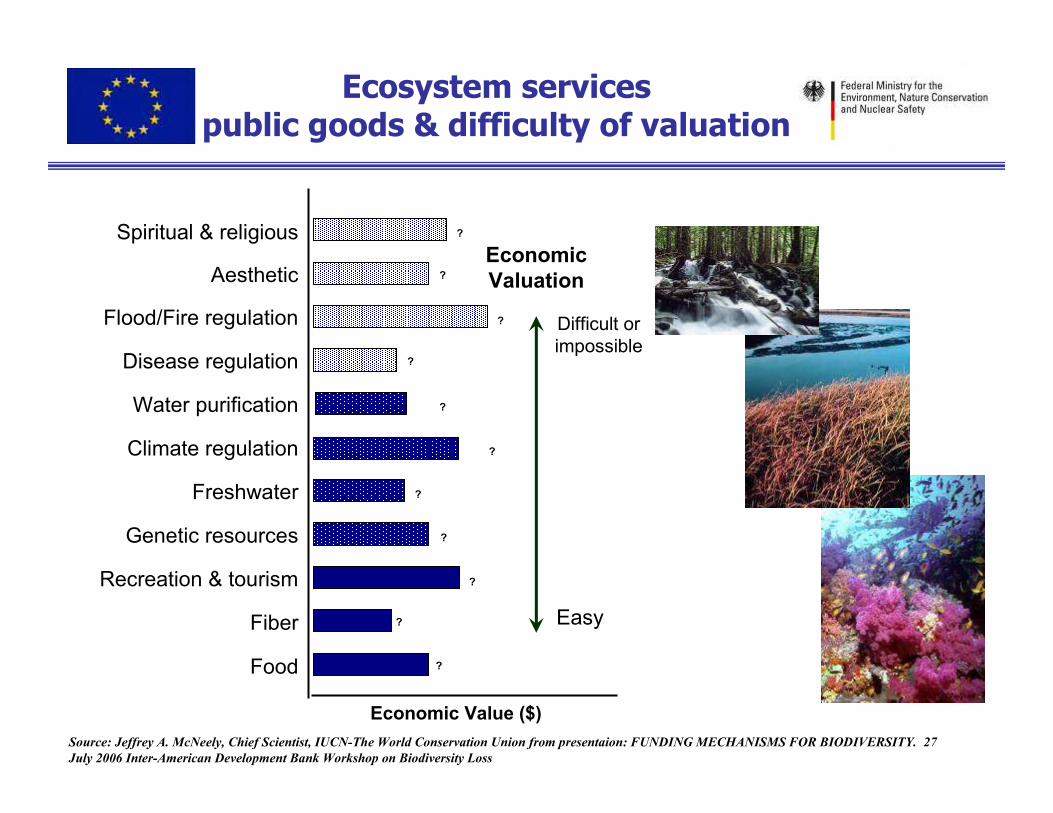
Fiber
Food
Spiritual & religious
Freshwater
Genetic resources
Climate regulation
Water purification
Disease regulation
Flood/Fire regulation
Recreation & tourism
Aesthetic
Economic Value ($)
Economic Valuation
Difficult or
impossible
Easy
?
?
?
?
?
?
?
?
?
?
?
Ecosystem services public goods & difficulty of valuation
Source: Jeffrey A. McNeely, Chief Scientist, IUCN-The World Conservation Union from presentaion: FUNDING MECHANISMS FOR BIODIVERSITY. 27
July 2006 Inter-American Development Bank Workshop on Biodiversity Loss
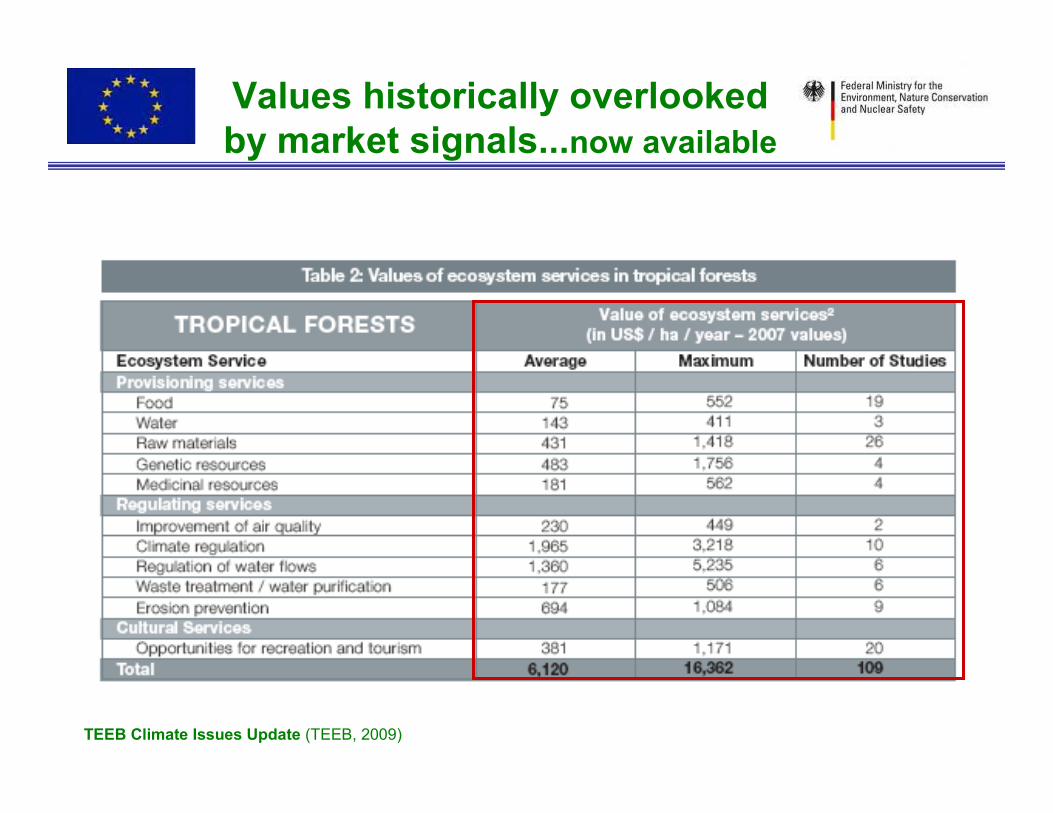
Values historically overlooked by market signals...now available
TEEB Climate Issues Update (TEEB, 2009)
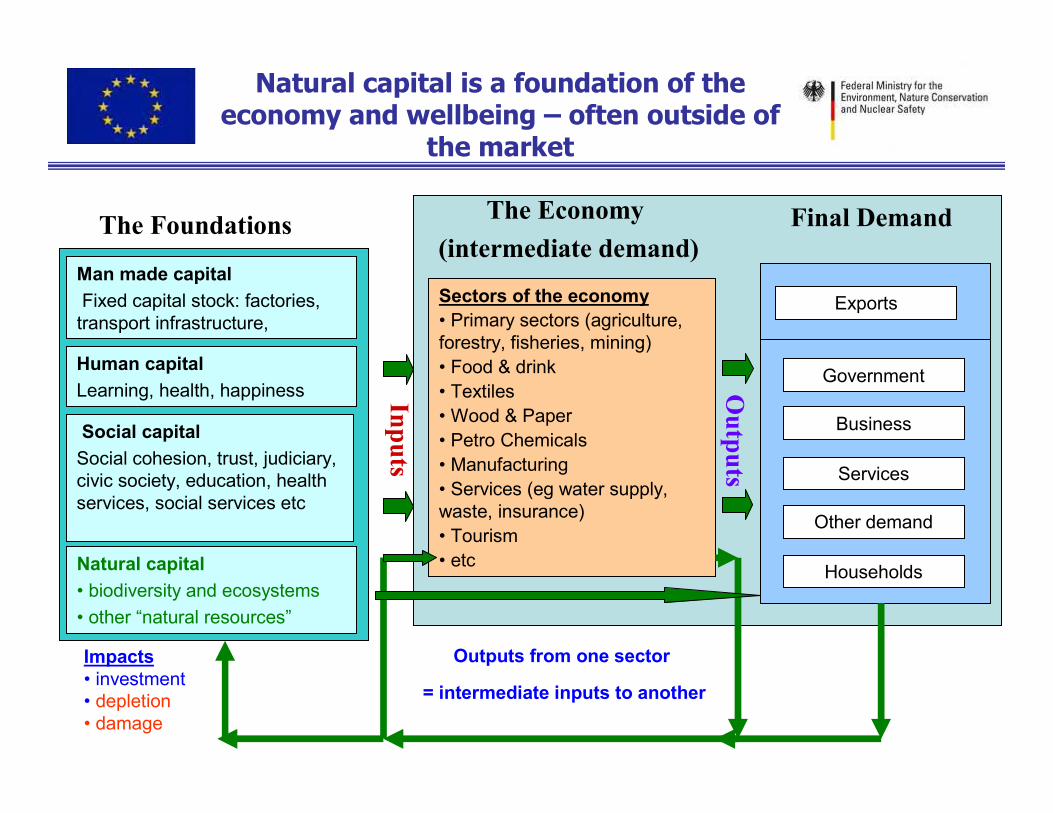
Natural capital is a foundation of the economy and wellbeing – often outside of
the market
Sectors of the economy
• Primary sectors (agriculture,
forestry, fisheries, mining)
• Food & drink
• Textiles
• Wood & Paper
• Petro Chemicals
• Manufacturing
• Services (eg water supply,
waste, insurance)
• Tourism
• etcNatural capital
• biodiversity and ecosystems
• other “natural resources”
Outputs from one sector
= intermediate inputs to another
Impacts• investment
• depletion
• damage
Man made capital
Fixed capital stock: factories,
transport infrastructure,
The Foundations
Human capital
Learning, health, happiness
Social capital
Social cohesion, trust, judiciary,
civic society, education, health
services, social services etc
The Economy
(intermediate demand)
Final Demand
Government
Households
Services
Exports
Business
Other demand
Inputs
Outputs
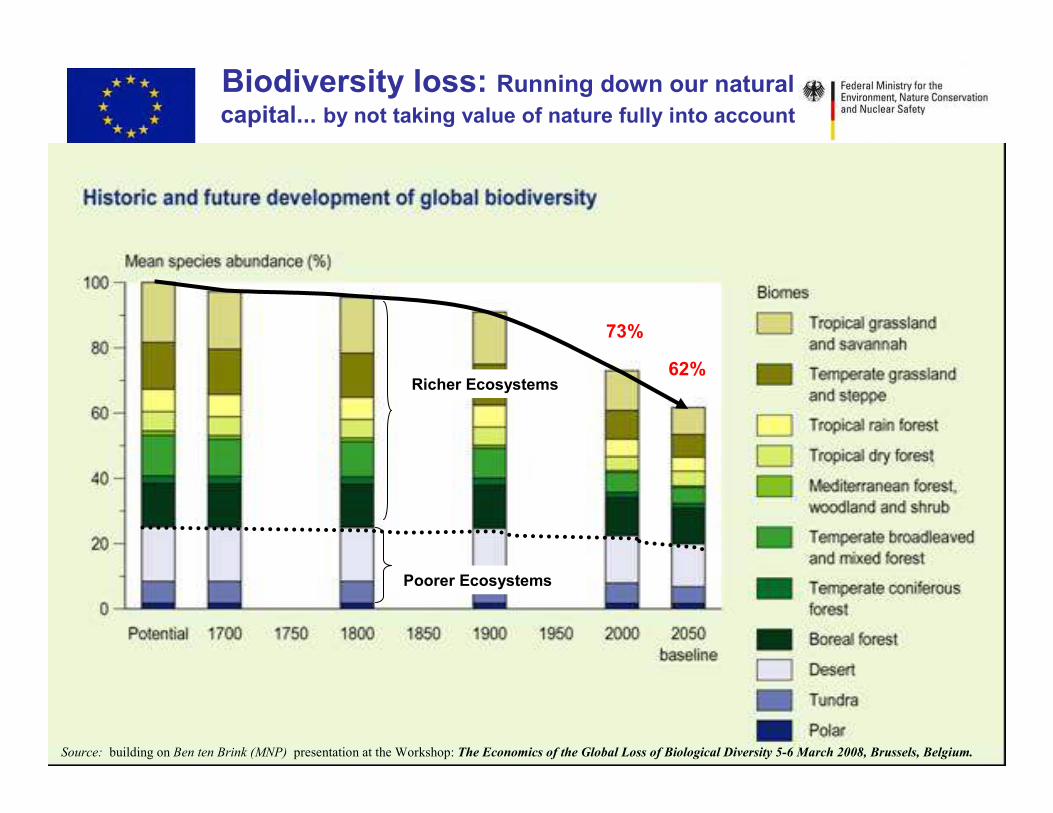
Biodiversity loss: Running down our natural
capital... by not taking value of nature fully into account
Poorer Ecosystems
Richer Ecosystems
Source: building on Ben ten Brink (MNP) presentation at the Workshop: The Economics of the Global Loss of Biological Diversity 5-6 March 2008, Brussels, Belgium.
73%
62%
1. The (missing) values of biodiversity and ecosystems to the economy
2. Instruments to integrate these values
� Instruments to reward benefits: PES, ABS et al
� Instruments to avoid damage/overuse
� Who benefits and who should pay - eg PAs
� Environmental Harmful Subsidies
� Policy Coherence and instrument mix
3. (Realising) Potential
Annex: Background: Aims and process of TEEB
Supporting / Background slides
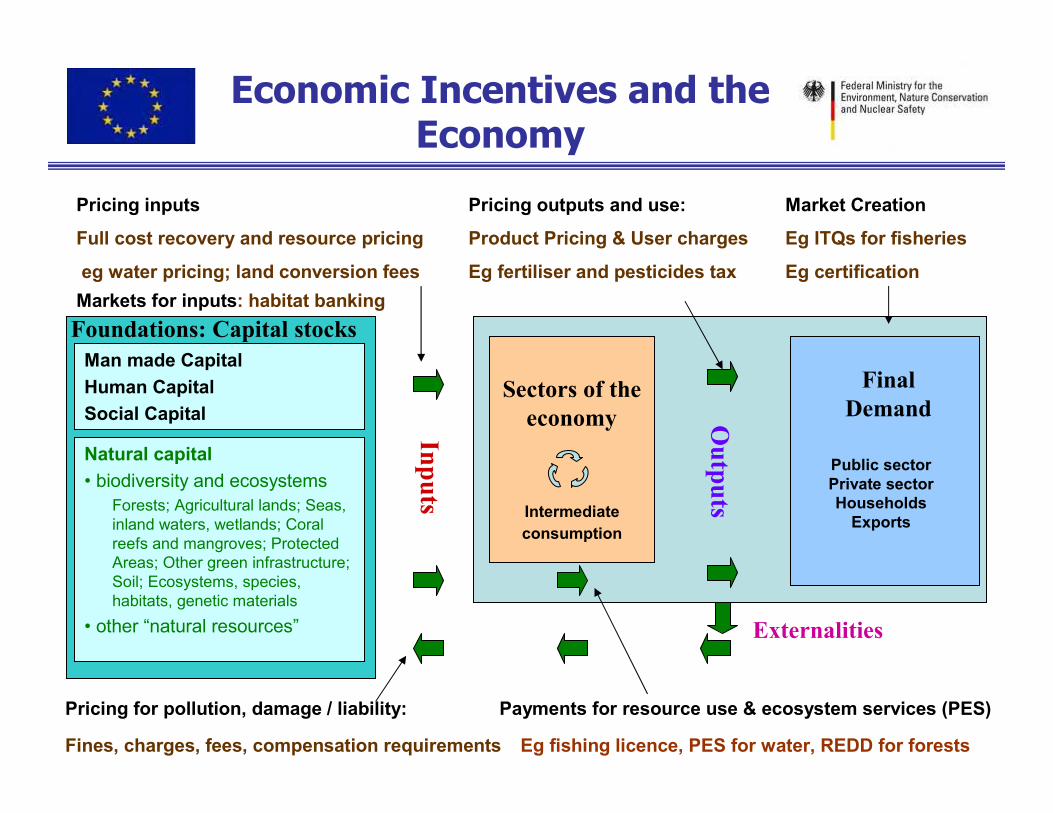
Economic Incentives and the Economy
Sectors of the
economy
Natural capital
• biodiversity and ecosystems
Forests; Agricultural lands; Seas,
inland waters, wetlands; Coral
reefs and mangroves; Protected
Areas; Other green infrastructure;
Soil; Ecosystems, species,
habitats, genetic materials
• other “natural resources”
Man made Capital
Human Capital
Social Capital
Final
Demand
Inputs
Outputs
Foundations: Capital stocks
Pricing outputs and use:
Product Pricing & User charges
Eg fertiliser and pesticides tax
Pricing for pollution, damage / liability:
Fines, charges, fees, compensation requirements
Pricing inputs
Full cost recovery and resource pricing
eg water pricing; land conversion fees
Intermediate
consumption
Public sectorPrivate sector Households
Exports
Payments for resource use & ecosystem services (PES)
Eg fishing licence, PES for water, REDD for forests
Market Creation
Eg ITQs for fisheries
Eg certification
Externalities
Markets for inputs: habitat banking
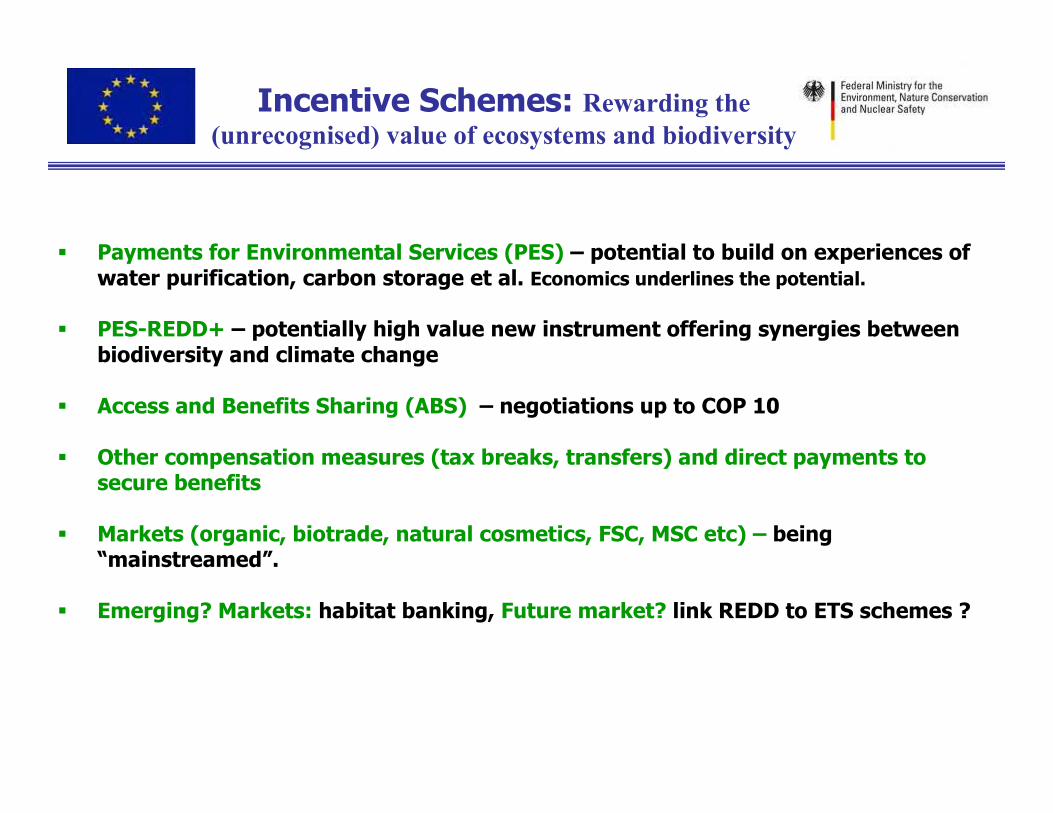
Incentive Schemes: Rewarding the (unrecognised) value of ecosystems and biodiversity
� Payments for Environmental Services (PES) – potential to build on experiences of water purification, carbon storage et al. Economics underlines the potential.
� PES-REDD+ – potentially high value new instrument offering synergies between biodiversity and climate change
� Access and Benefits Sharing (ABS) – negotiations up to COP 10
� Other compensation measures (tax breaks, transfers) and direct payments to secure benefits
� Markets (organic, biotrade, natural cosmetics, FSC, MSC etc) – being “mainstreamed”.
� Emerging? Markets: habitat banking, Future market? link REDD to ETS schemes ?
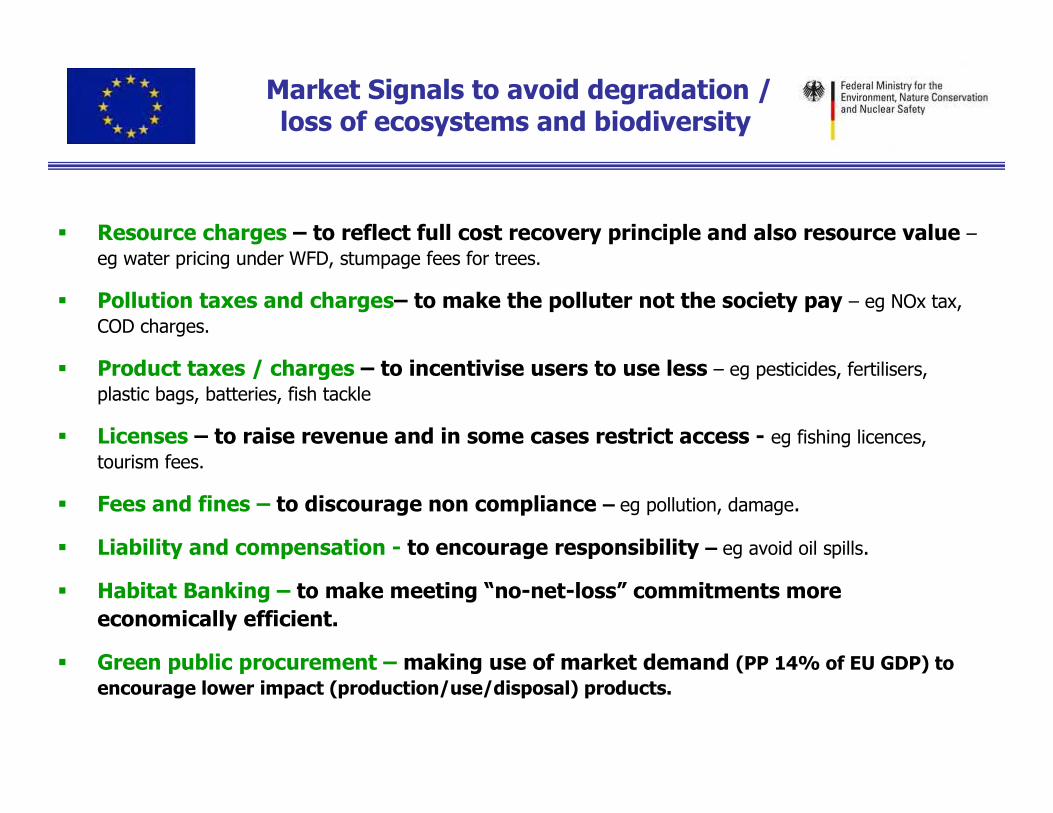
Market Signals to avoid degradation / loss of ecosystems and biodiversity
� Resource charges – to reflect full cost recovery principle and also resource value –
eg water pricing under WFD, stumpage fees for trees.
� Pollution taxes and charges– to make the polluter not the society pay – eg NOx tax,
COD charges.
� Product taxes / charges – to incentivise users to use less – eg pesticides, fertilisers,
plastic bags, batteries, fish tackle
� Licenses – to raise revenue and in some cases restrict access - eg fishing licences,
tourism fees.
� Fees and fines – to discourage non compliance – eg pollution, damage.
� Liability and compensation - to encourage responsibility – eg avoid oil spills.
� Habitat Banking – to make meeting “no-net-loss” commitments more
economically efficient.
� Green public procurement – making use of market demand (PP 14% of EU GDP) to
encourage lower impact (production/use/disposal) products.
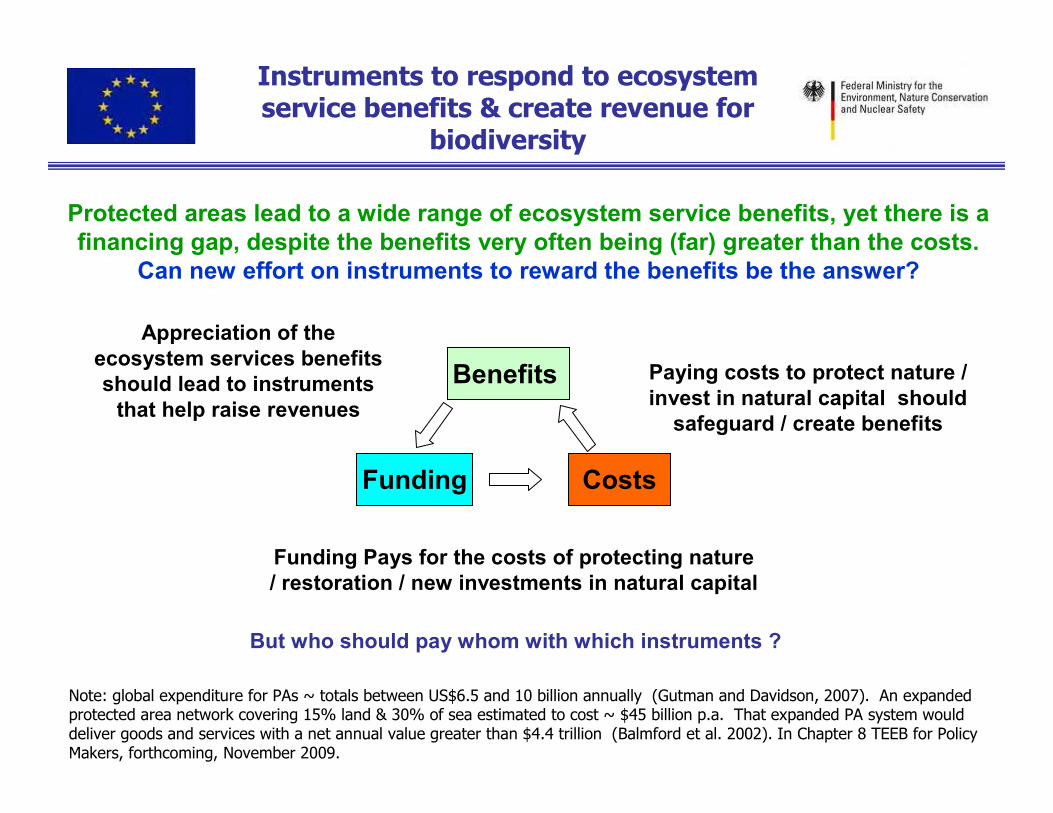
Instruments to respond to ecosystem service benefits & create revenue for
biodiversity
Benefits
Funding Costs
Appreciation of the ecosystem services benefits should lead to instruments
that help raise revenues
Funding Pays for the costs of protecting nature / restoration / new investments in natural capital
Paying costs to protect nature / invest in natural capital should
safeguard / create benefits
But who should pay whom with which instruments ?
Protected areas lead to a wide range of ecosystem service benefits, yet there is a financing gap, despite the benefits very often being (far) greater than the costs.
Can new effort on instruments to reward the benefits be the answer?
Note: global expenditure for PAs ~ totals between US$6.5 and 10 billion annually (Gutman and Davidson, 2007). An expanded protected area network covering 15% land & 30% of sea estimated to cost ~ $45 billion p.a. That expanded PA system would deliver goods and services with a net annual value greater than $4.4 trillion (Balmford et al. 2002). In Chapter 8 TEEB for Policy Makers, forthcoming, November 2009.
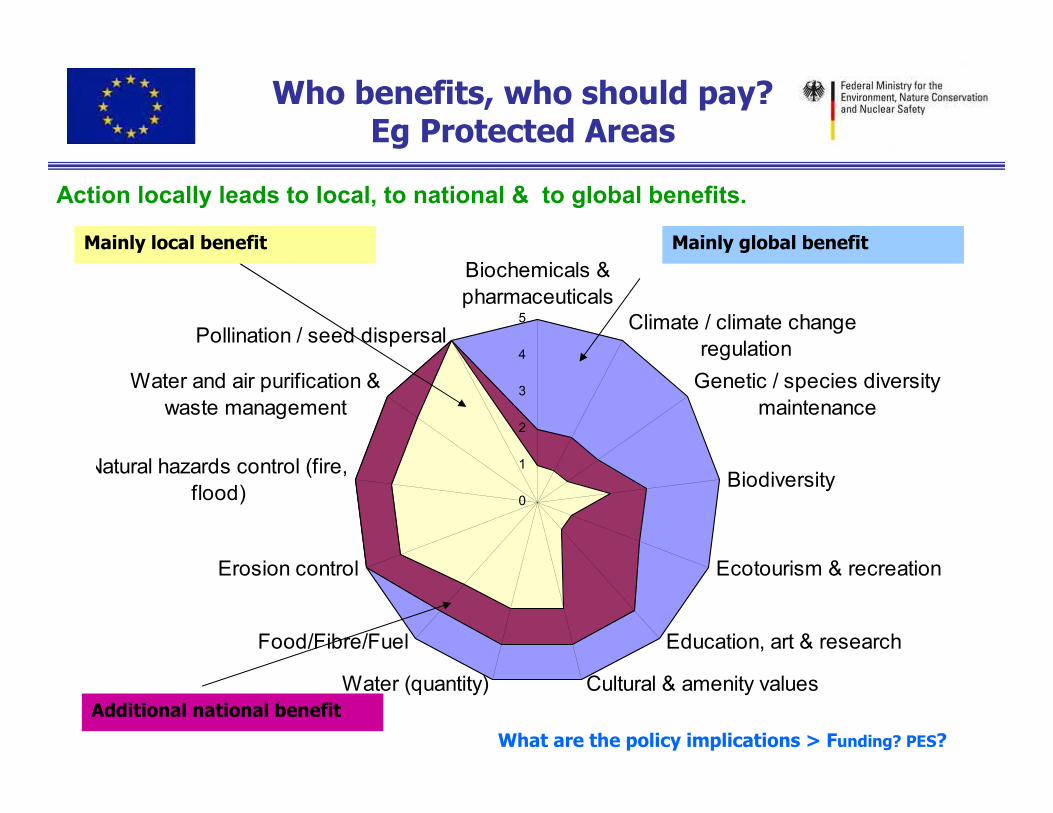
Who benefits, who should pay? Eg Protected Areas
What are the policy implications > Funding? PES?
0
1
2
3
4
5
Biochemicals &
pharmaceuticals
Climate / climate change
regulation
Genetic / species diversity
maintenance
Biodiversity
Ecotourism & recreation
Education, art & research
Cultural & amenity valuesWater (quantity)
Food/Fibre/Fuel
Erosion control
Natural hazards control (fire,
flood)
Water and air purification &
waste management
Pollination / seed dispersal
Mainly local benefit
Additional national benefit
Mainly global benefit
Action locally leads to local, to national & to global benefits.
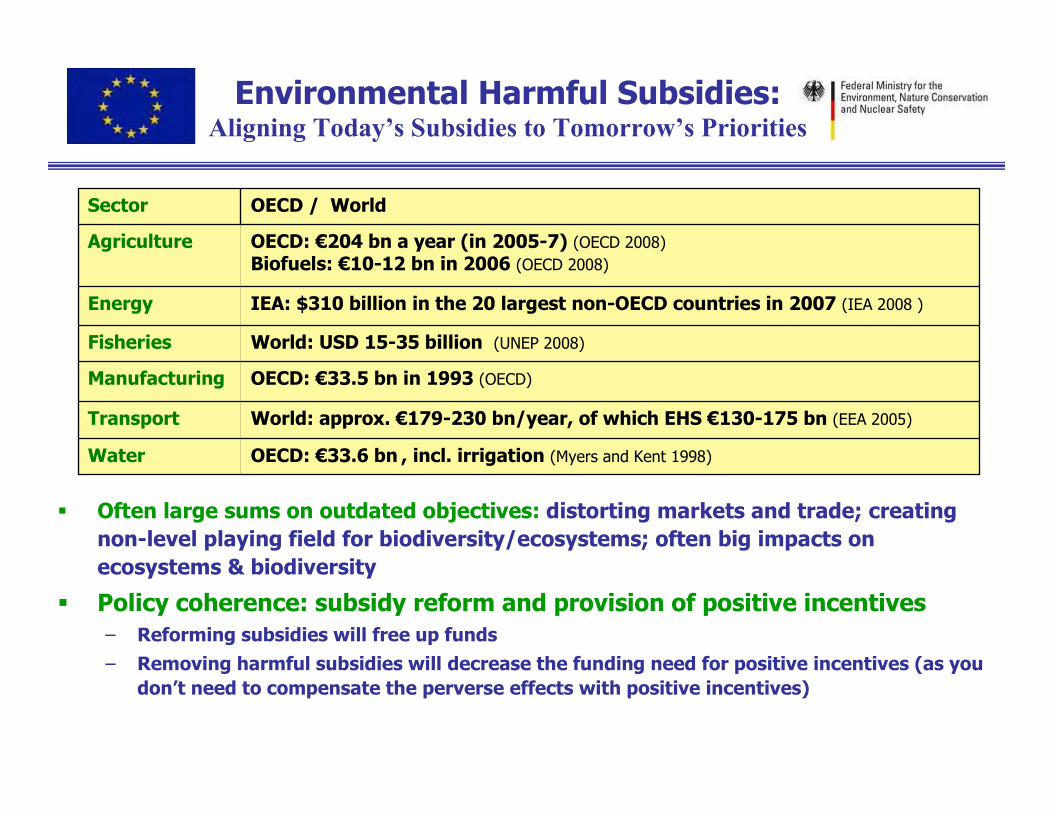
Environmental Harmful Subsidies: Aligning Today’s Subsidies to Tomorrow’s Priorities
OECD: €33.6 bn , incl. irrigation (Myers and Kent 1998)Water
World: approx. €179-230 bn/year, of which EHS €130-175 bn (EEA 2005) Transport
OECD: €33.5 bn in 1993 (OECD)Manufacturing
World: USD 15-35 billion (UNEP 2008)Fisheries
IEA: $310 billion in the 20 largest non-OECD countries in 2007 (IEA 2008 )Energy
OECD: €204 bn a year (in 2005-7) (OECD 2008)Biofuels: €10-12 bn in 2006 (OECD 2008)
Agriculture
OECD / WorldSector
We are fishing down the foodweb – D. Pauly (UBC, Canada)2010
40 %
40 %
20 %
1950
� Often large sums on outdated objectives: distorting markets and trade; creating
non-level playing field for biodiversity/ecosystems; often big impacts on
ecosystems & biodiversity
� Policy coherence: subsidy reform and provision of positive incentives
– Reforming subsidies will free up funds
– Removing harmful subsidies will decrease the funding need for positive incentives (as you
don’t need to compensate the perverse effects with positive incentives)
9/10/2009 17
Policy coherence and instrument mix
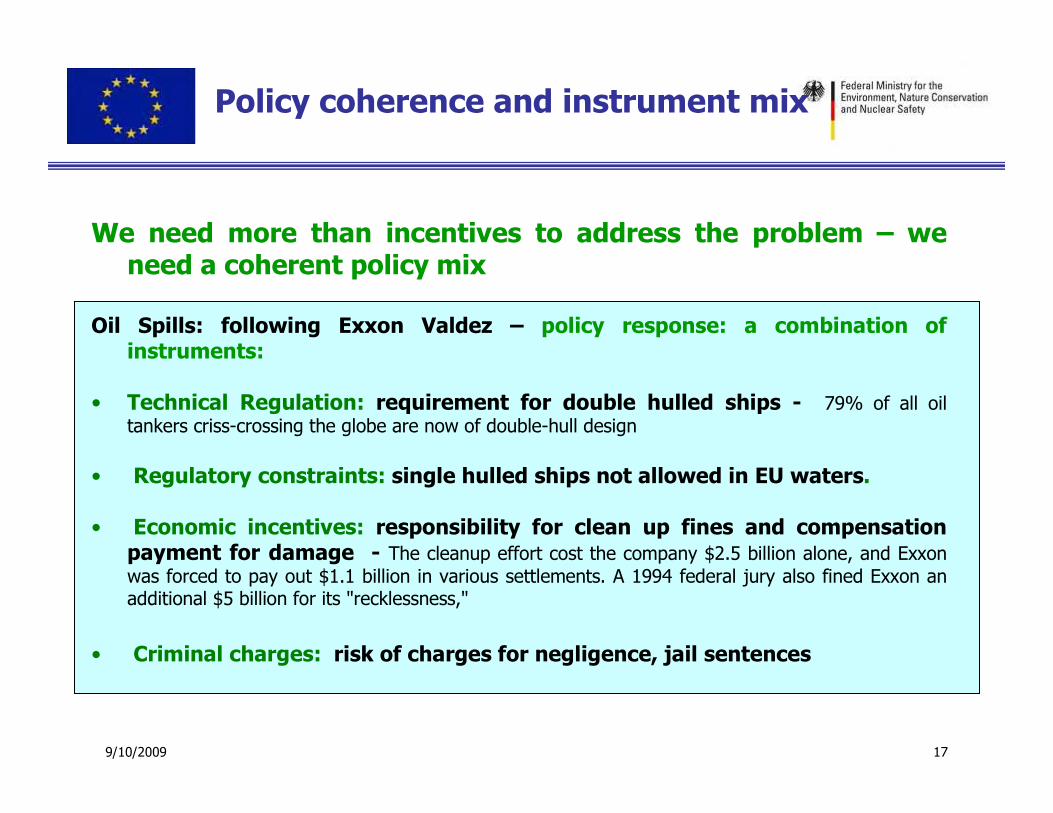
We need more than incentives to address the problem – we need a coherent policy mix
Oil Spills: following Exxon Valdez – policy response: a combination of instruments:
• Technical Regulation: requirement for double hulled ships - 79% of all oil tankers criss-crossing the globe are now of double-hull design
• Regulatory constraints: single hulled ships not allowed in EU waters.
• Economic incentives: responsibility for clean up fines and compensation payment for damage - The cleanup effort cost the company $2.5 billion alone, and Exxon
was forced to pay out $1.1 billion in various settlements. A 1994 federal jury also fined Exxon an additional $5 billion for its "recklessness,"
• Criminal charges: risk of charges for negligence, jail sentences
9/10/2009 18
A further example: REDD+
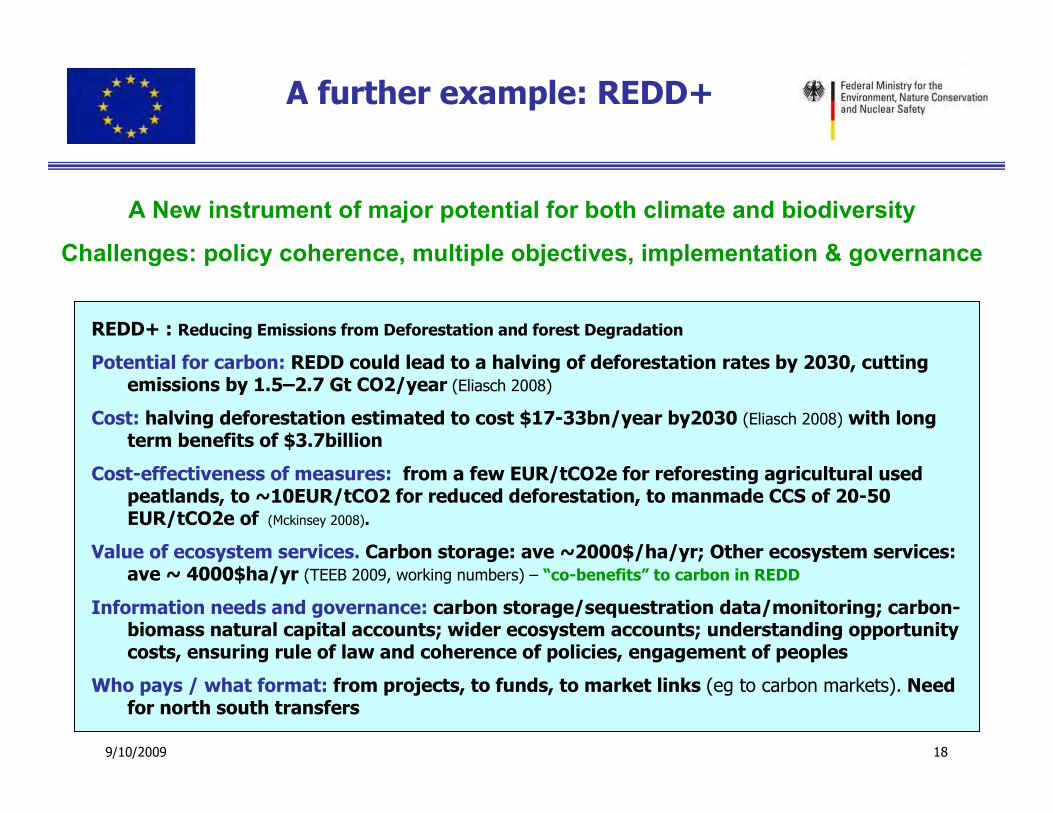
REDD+ : Reducing Emissions from Deforestation and forest Degradation
Potential for carbon: REDD could lead to a halving of deforestation rates by 2030, cutting emissions by 1.5–2.7 Gt CO2/year (Eliasch 2008)
Cost: halving deforestation estimated to cost $17-33bn/year by2030 (Eliasch 2008) with long term benefits of $3.7billion
Cost-effectiveness of measures: from a few EUR/tCO2e for reforesting agricultural used peatlands, to ~10EUR/tCO2 for reduced deforestation, to manmade CCS of 20-50 EUR/tCO2e of (Mckinsey 2008).
Value of ecosystem services. Carbon storage: ave ~2000$/ha/yr; Other ecosystem services: ave ~ 4000$ha/yr (TEEB 2009, working numbers) – “co-benefits” to carbon in REDD
Information needs and governance: carbon storage/sequestration data/monitoring; carbon-biomass natural capital accounts; wider ecosystem accounts; understanding opportunity costs, ensuring rule of law and coherence of policies, engagement of peoples
Who pays / what format: from projects, to funds, to market links (eg to carbon markets). Need for north south transfers
A New instrument of major potential for both climate and biodiversity
Challenges: policy coherence, multiple objectives, implementation & governance
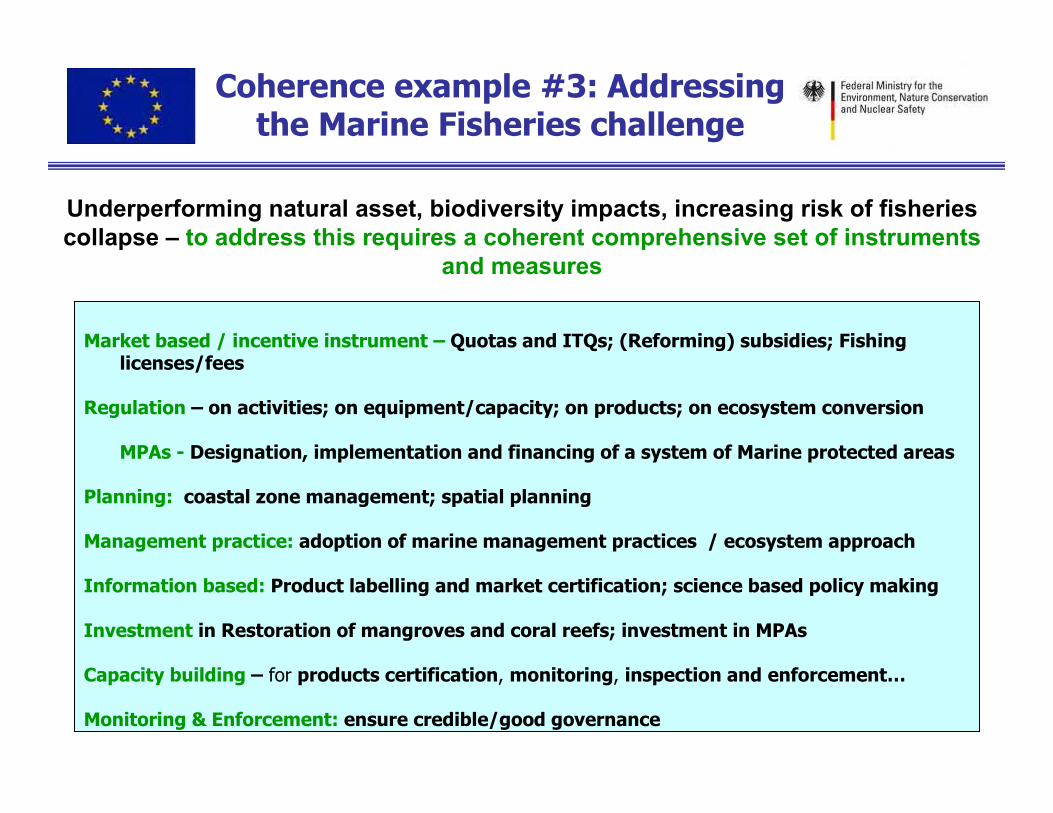
Coherence example #3: Addressing the Marine Fisheries challenge
Market based / incentive instrument – Quotas and ITQs; (Reforming) subsidies; Fishing licenses/fees
Regulation – on activities; on equipment/capacity; on products; on ecosystem conversion
MPAs - Designation, implementation and financing of a system of Marine protected areas
Planning: coastal zone management; spatial planning
Management practice: adoption of marine management practices / ecosystem approach
Information based: Product labelling and market certification; science based policy making
Investment in Restoration of mangroves and coral reefs; investment in MPAs
Capacity building – for products certification, monitoring, inspection and enforcement…
Monitoring & Enforcement: ensure credible/good governance
Underperforming natural asset, biodiversity impacts, increasing risk of fisheries collapse – to address this requires a coherent comprehensive set of instruments
and measures
1. The (missing) values of biodiversity and ecosystems to the economy
2. Instruments / Incentives to integrate these values
� Instruments to reward benefits: PES, ABS et al
� Instruments to avoid damage/overuse
� Who benefits and who should pay - eg PAs
� Subsidies
� Policy Coherence and instrument mix– eg oil spills and REDD+
3. (Realising) Potential
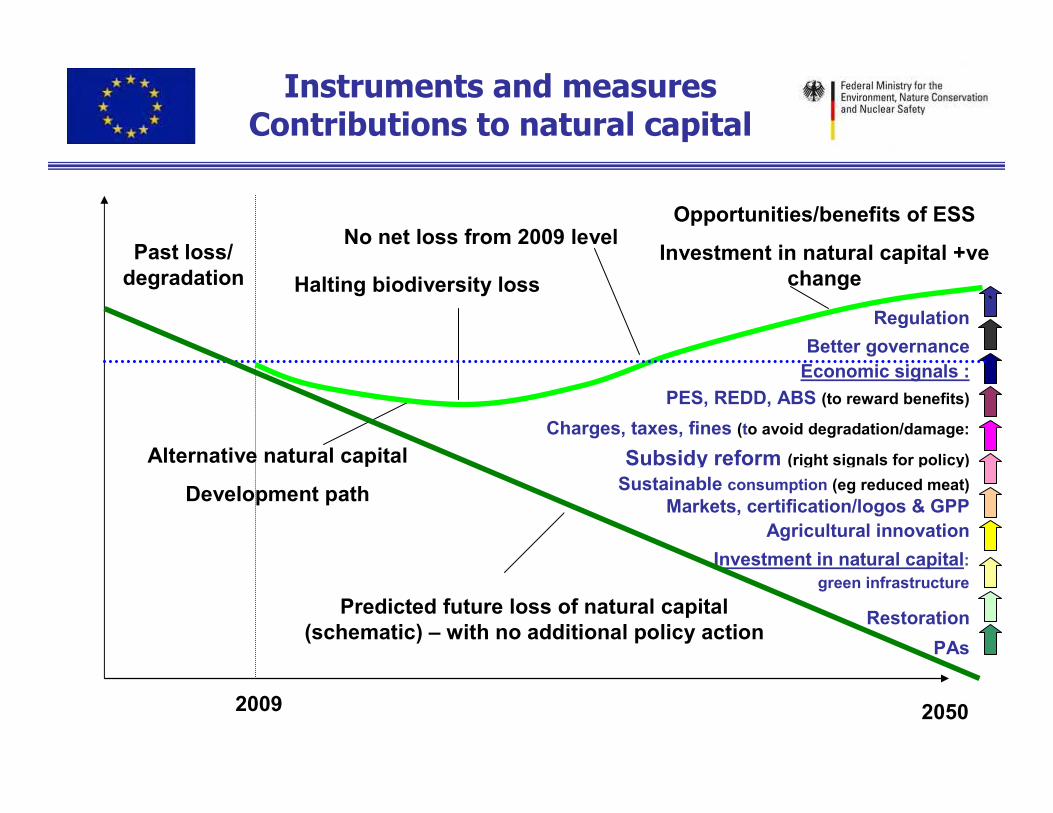
Instruments and measures Contributions to natural capital
Past loss/ degradation
Predicted future loss of natural capital (schematic) – with no additional policy action
2009 2050
Halting biodiversity loss
Opportunities/benefits of ESS
Investment in natural capital +ve change
Alternative natural capital
Development path
Regulation
PAs
Restoration
Investment in natural capital: green infrastructure
Economic signals :
PES, REDD, ABS (to reward benefits)
Charges, taxes, fines (to avoid degradation/damage:
Subsidy reform (right signals for policy)
Better governance
`
Sustainable consumption (eg reduced meat)
Markets, certification/logos & GPP
Agricultural innovation
No net loss from 2009 level
9/10/2009 22
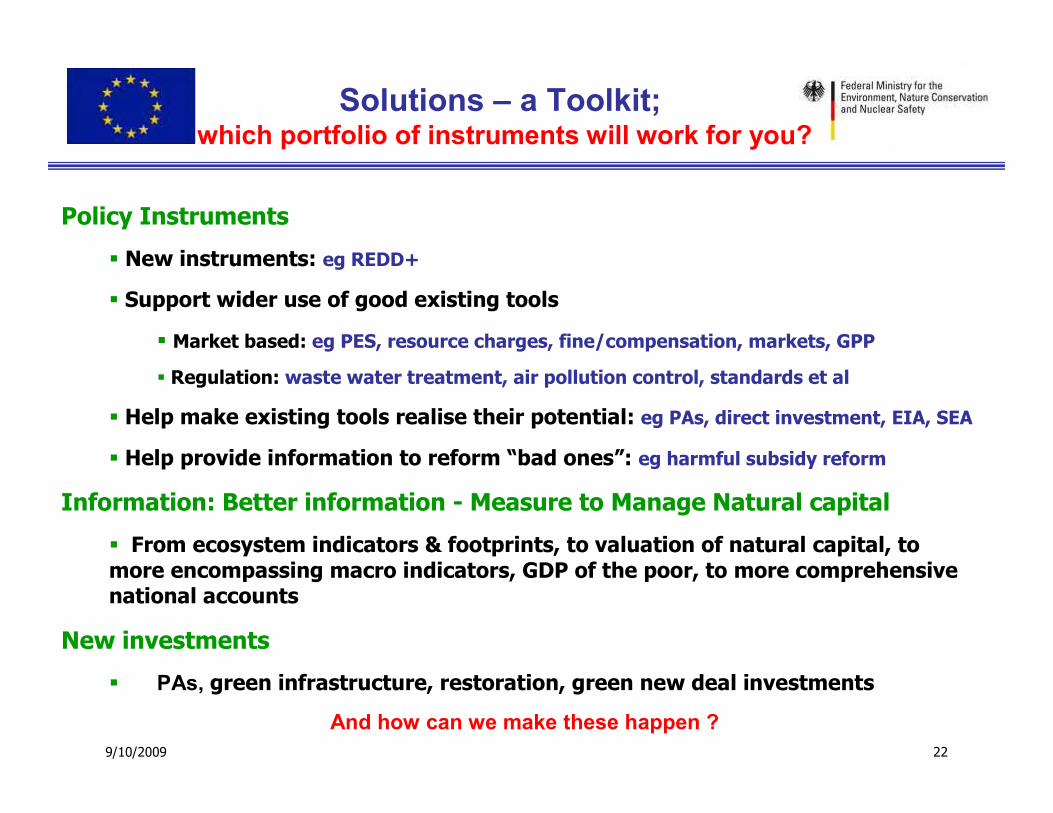
Solutions – a Toolkit; which portfolio of instruments will work for you?
Policy Instruments
� New instruments: eg REDD+
� Support wider use of good existing tools
� Market based: eg PES, resource charges, fine/compensation, markets, GPP
� Regulation: waste water treatment, air pollution control, standards et al
� Help make existing tools realise their potential: eg PAs, direct investment, EIA, SEA
� Help provide information to reform “bad ones”: eg harmful subsidy reform
Information: Better information - Measure to Manage Natural capital
� From ecosystem indicators & footprints, to valuation of natural capital, to more encompassing macro indicators, GDP of the poor, to more comprehensive national accounts
New investments
� PAs, green infrastructure, restoration, green new deal investments
And how can we make these happen ?
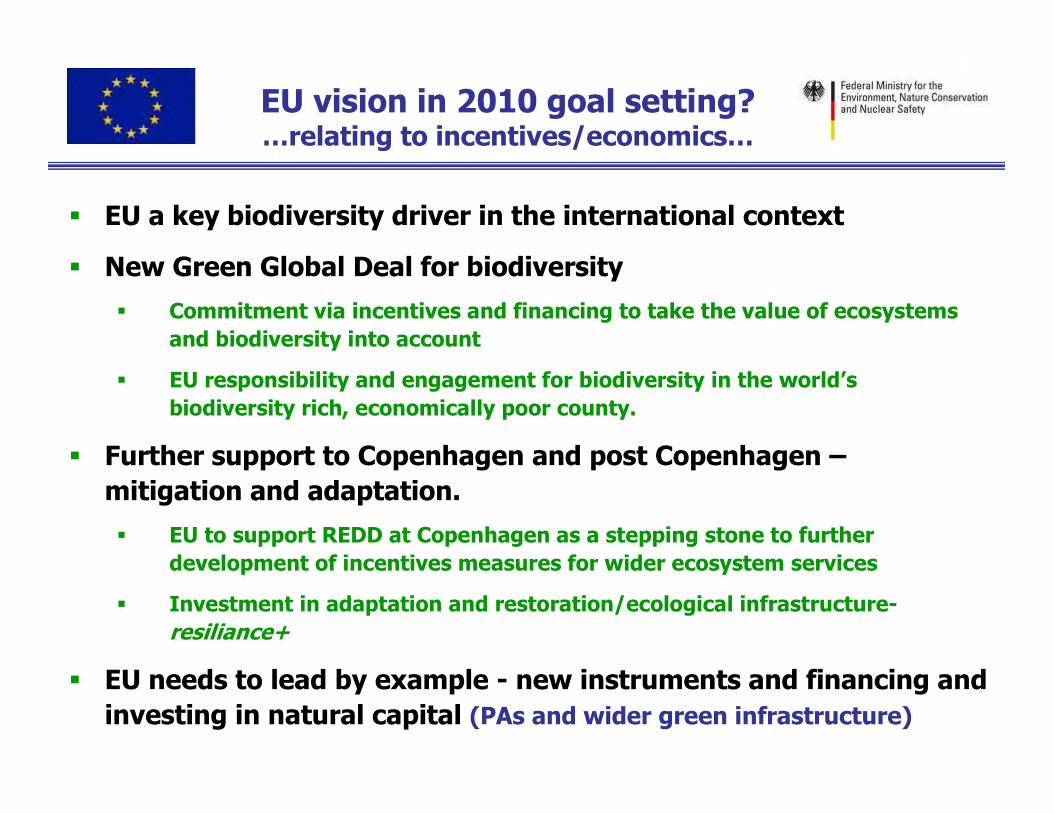
EU vision in 2010 goal setting?…relating to incentives/economics…
� EU a key biodiversity driver in the international context
� New Green Global Deal for biodiversity
� Commitment via incentives and financing to take the value of ecosystems
and biodiversity into account
� EU responsibility and engagement for biodiversity in the world’s
biodiversity rich, economically poor county.
� Further support to Copenhagen and post Copenhagen –
mitigation and adaptation.
� EU to support REDD at Copenhagen as a stepping stone to further
development of incentives measures for wider ecosystem services
� Investment in adaptation and restoration/ecological infrastructure-
resiliance+
� EU needs to lead by example - new instruments and financing and
investing in natural capital (PAs and wider green infrastructure)
9/10/2009 24
Thank You
� What do you see as the potential for incentive measures?
� What targets are ambitious but achievable?
� Governance challenges and solutions?
� What could be a Practical Roadmap?
Patrick ten Brink
IEEP is an independent, notIEEP is an independent, notIEEP is an independent, notIEEP is an independent, not----forforforfor----profit institute dedicated to the profit institute dedicated to the profit institute dedicated to the profit institute dedicated to the
analysis, understanding and promotion of policies for a analysis, understanding and promotion of policies for a analysis, understanding and promotion of policies for a analysis, understanding and promotion of policies for a
sustainable environment in Europesustainable environment in Europesustainable environment in Europesustainable environment in Europe
Presentation overview
1. The (missing) values of biodiversity and ecosystems to the economy
2. Instruments / Incentives to integrate these values
� Instruments to reward benefits: PES, ABS et al
� Instruments to avoid damage/overuse
� Who benefits and who should pay - eg PAs
� Subsidies
� Policy Coherence and instrument mix– eg oil spills and REDD+
3. (Realising) Potential
Annex: Background: Aims and process of TEEB
Supporting / Background slides: content
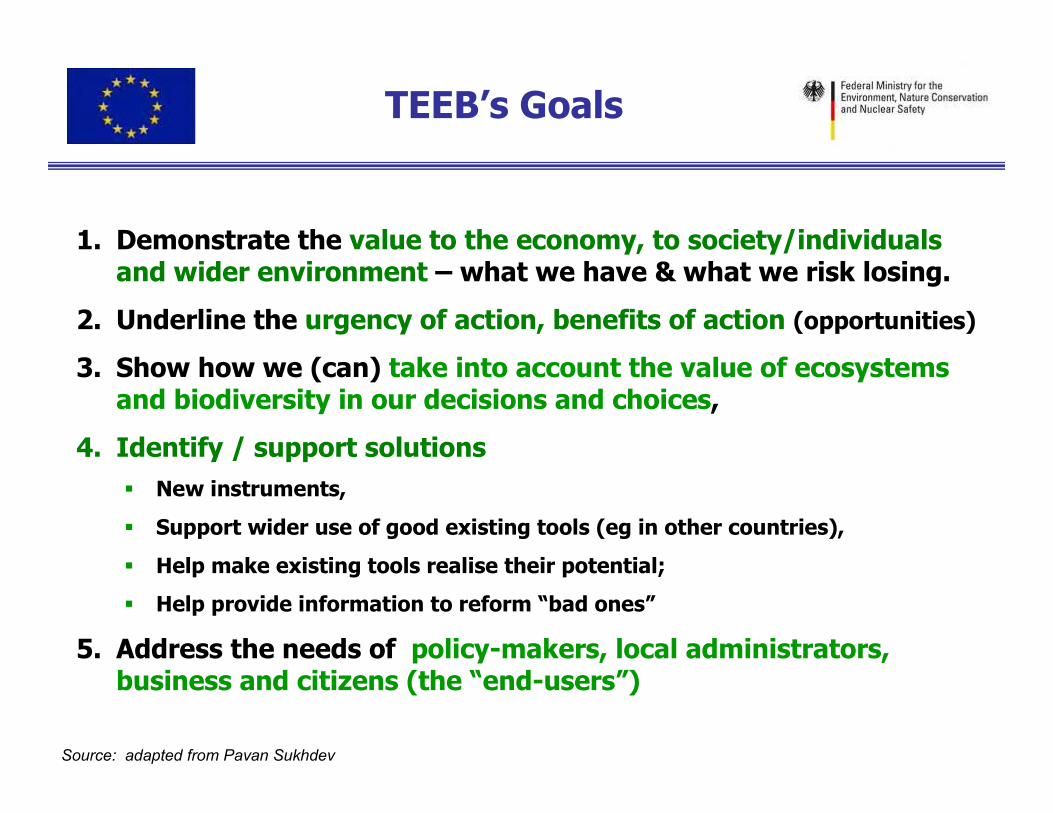
TEEB’s Goals
1. Demonstrate the value to the economy, to society/individuals and wider environment – what we have & what we risk losing.
2. Underline the urgency of action, benefits of action (opportunities)
3. Show how we (can) take into account the value of ecosystems and biodiversity in our decisions and choices,
4. Identify / support solutions
� New instruments,
� Support wider use of good existing tools (eg in other countries),
� Help make existing tools realise their potential;
� Help provide information to reform “bad ones”
5. Address the needs of policy-makers, local administrators, business and citizens (the “end-users”)
Source: adapted from Pavan Sukhdev
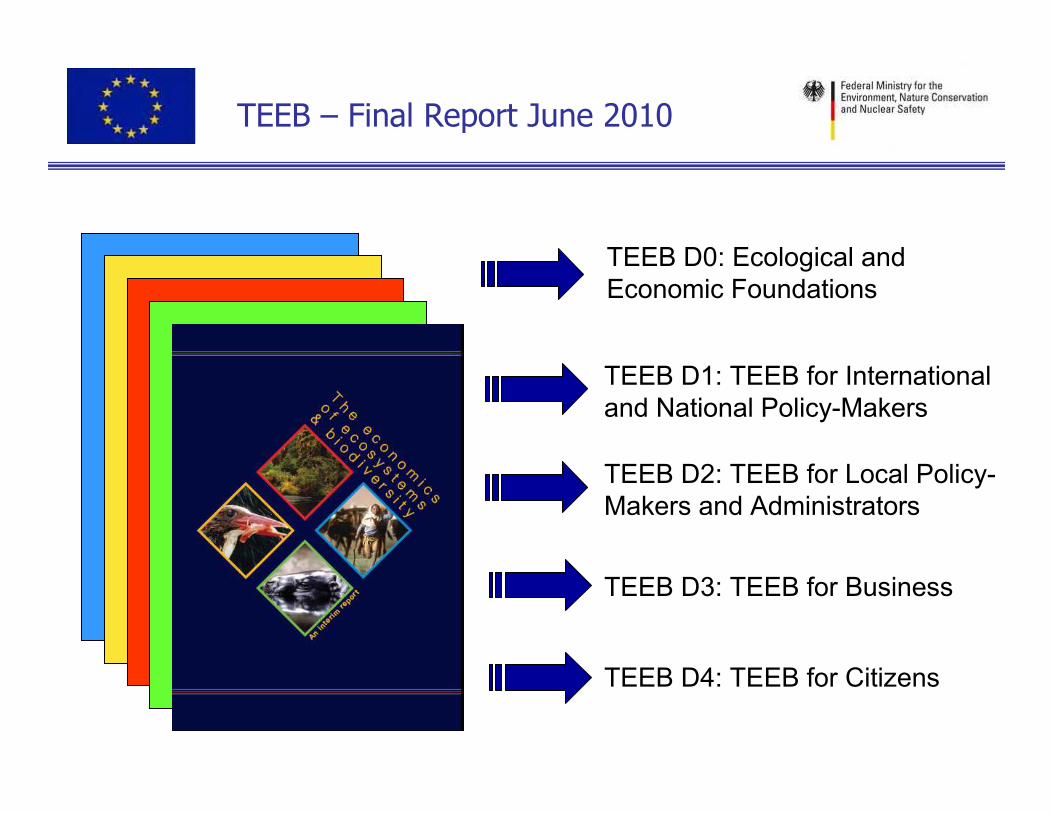
TEEB – Final Report June 2010
TEEB D4: TEEB for Citizens
TEEB D3: TEEB for Business
TEEB D2: TEEB for Local Policy-
Makers and Administrators
TEEB D1: TEEB for International
and National Policy-Makers
TEEB D0: Ecological and
Economic Foundations
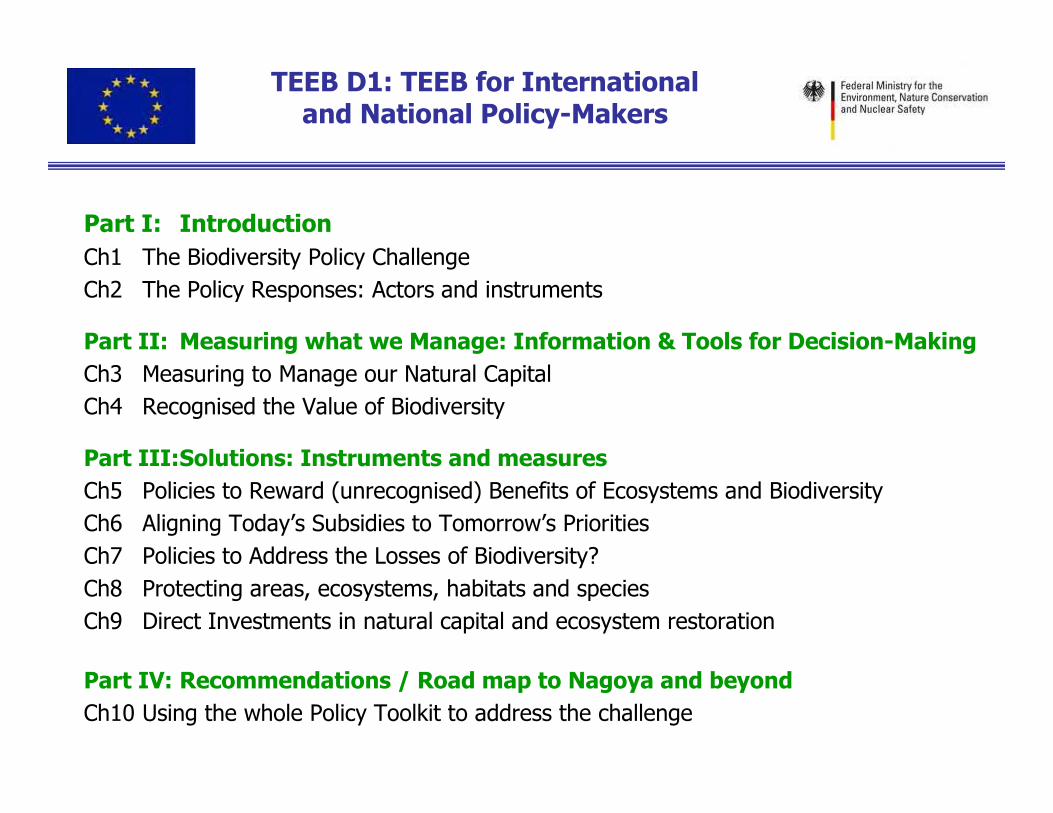
TEEB D1: TEEB for International and National Policy-Makers
Part I: Introduction
Ch1 The Biodiversity Policy Challenge
Ch2 The Policy Responses: Actors and instruments
Part II: Measuring what we Manage: Information & Tools for Decision-Making
Ch3 Measuring to Manage our Natural Capital
Ch4 Recognised the Value of Biodiversity
Part III:Solutions: Instruments and measures
Ch5 Policies to Reward (unrecognised) Benefits of Ecosystems and Biodiversity
Ch6 Aligning Today’s Subsidies to Tomorrow’s Priorities
Ch7 Policies to Address the Losses of Biodiversity?
Ch8 Protecting areas, ecosystems, habitats and species
Ch9 Direct Investments in natural capital and ecosystem restoration
Part IV: Recommendations / Road map to Nagoya and beyond
Ch10 Using the whole Policy Toolkit to address the challenge
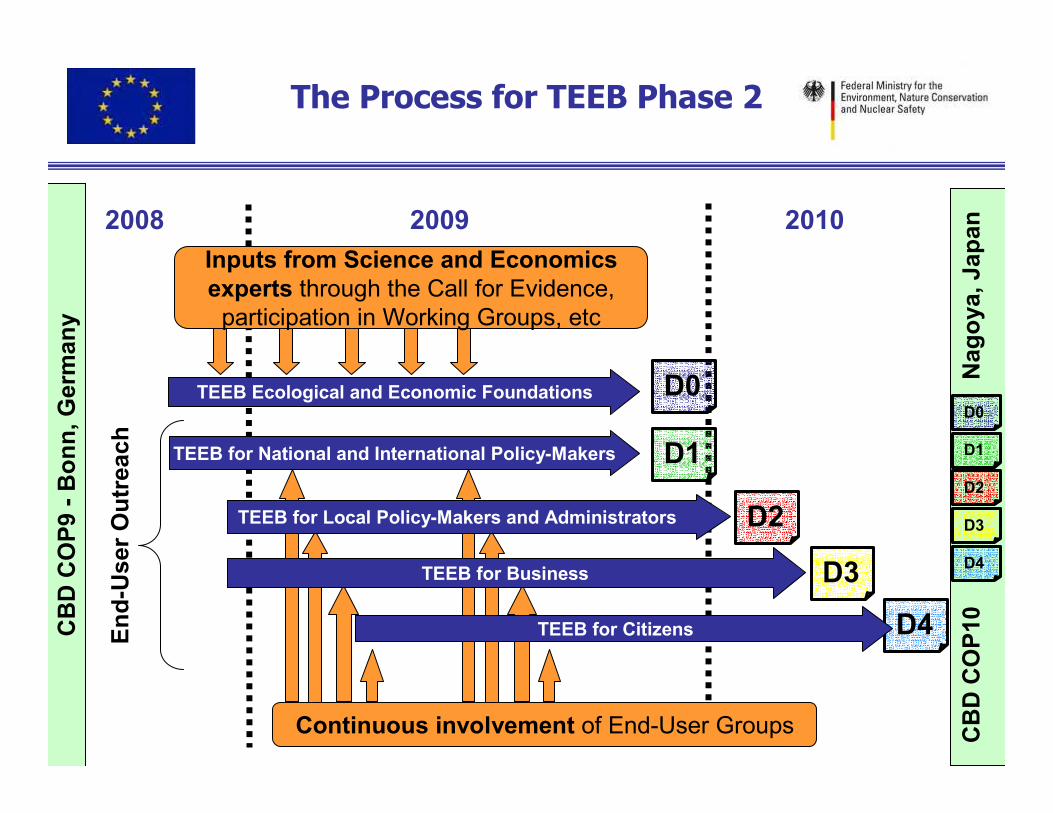
Inputs from Science and Economicsexperts through the Call for Evidence, participation in Working Groups, etc
D0
2008 2009 2010
Continuous involvement of End-User Groups
D4
D3
D2
D1
TEEB Ecological and Economic Foundations
TEEB for National and International Policy-Makers
TEEB for Citizens
TEEB for Business
TEEB for Local Policy-Makers and Administrators
End-U
ser O
utr
each
CB
D C
OP10 N
agoya, Japan
CB
D C
OP9 -
Bonn, G
erm
any
D0
D4
D3
D2
D1
The Process for TEEB Phase 2
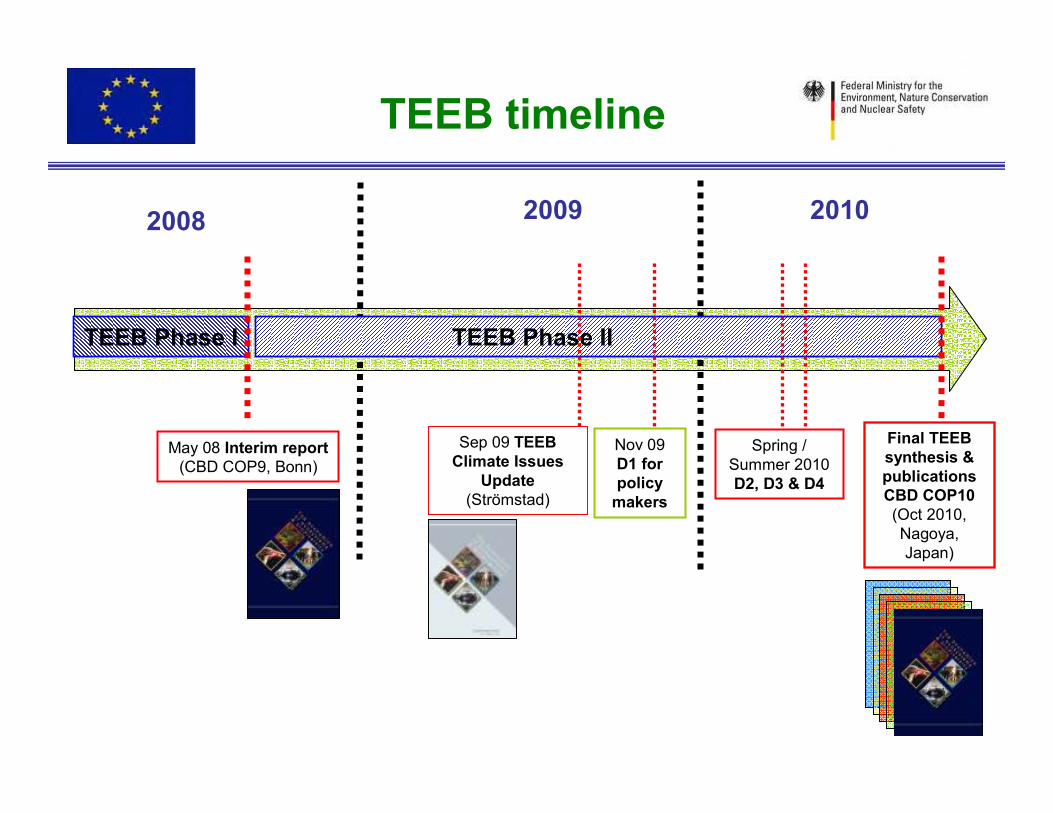
TEEB timeline
2008 2009 2010
TEEB Phase I TEEB Phase II
May 08 Interim report(CBD COP9, Bonn)
Final TEEB synthesis & publicationsCBD COP10(Oct 2010,
Nagoya,
Japan)
Sep 09 TEEB Climate Issues
Update(Strömstad)
Nov 09
D1 for policy makers
Spring /
Summer 2010
D2, D3 & D4
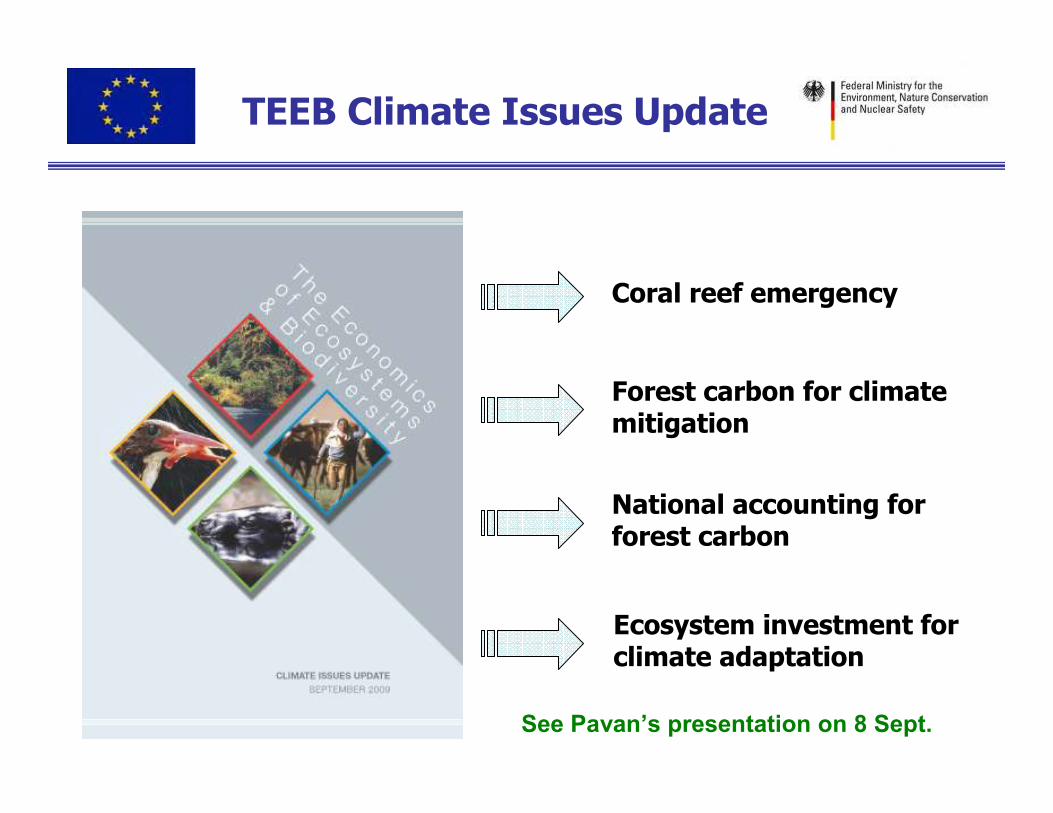
TEEB Climate Issues Update
Coral reef emergency
Ecosystem investment for climate adaptation
National accounting for forest carbon
Forest carbon for climate mitigation
See Pavan’s presentation on 8 Sept.
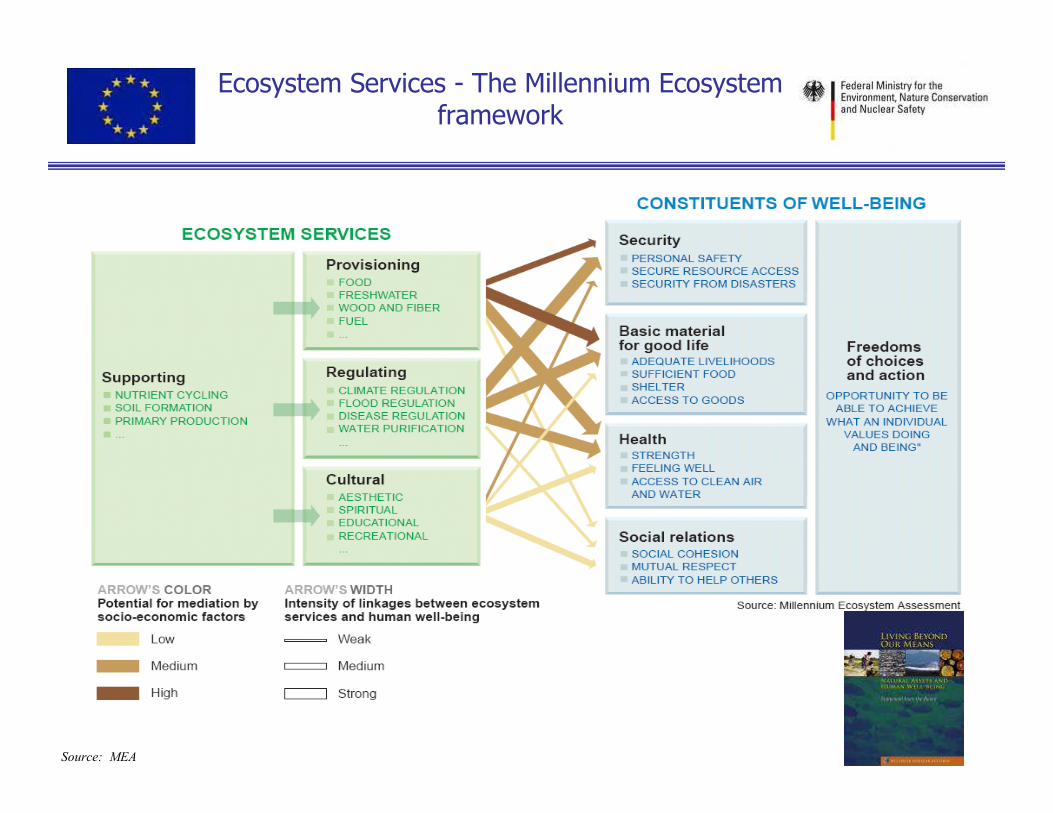
Ecosystem Services - The Millennium Ecosystem framework
Source: MEA
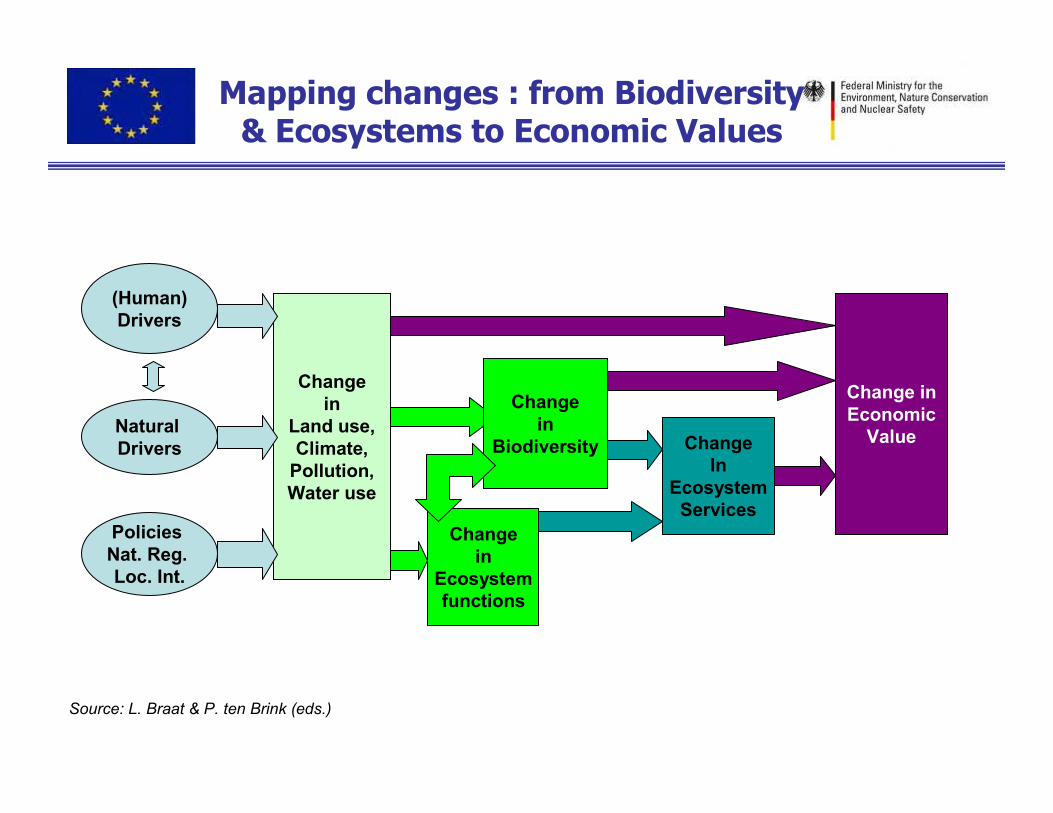
Mapping changes : from Biodiversity & Ecosystems to Economic Values
Source: L. Braat & P. ten Brink (eds.)
Change inEconomic
Value
Policies Nat. Reg. Loc. Int.
Changein
Land use,Climate,Pollution,Water use
(Human)Drivers
ChangeIn
EcosystemServices
Changein
Biodiversity
Changein
Ecosystemfunctions
Natural Drivers
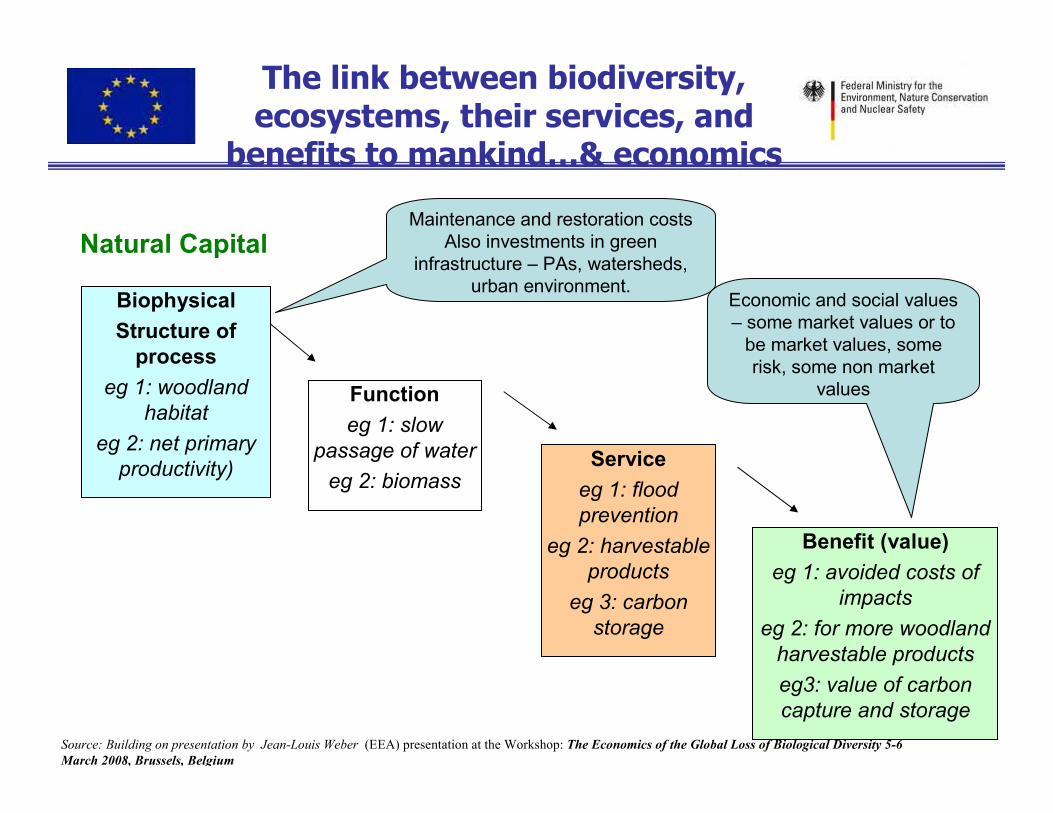
The link between biodiversity, ecosystems, their services, and
benefits to mankind…& economics
Function
eg 1: slow
passage of water
eg 2: biomass
Biophysical
Structure of process
eg 1: woodland
habitat
eg 2: net primary
productivity) Service
eg 1: flood
prevention
eg 2: harvestable
products
eg 3: carbon
storage
Benefit (value)
eg 1: avoided costs of
impacts
eg 2: for more woodland
harvestable products
eg3: value of carbon
capture and storage
Source: Building on presentation by Jean-Louis Weber (EEA) presentation at the Workshop: The Economics of the Global Loss of Biological Diversity 5-6
March 2008, Brussels, Belgium
Maintenance and restoration costs
Also investments in green
infrastructure – PAs, watersheds,
urban environment.Economic and social values
– some market values or to
be market values, some
risk, some non market
values
Natural Capital
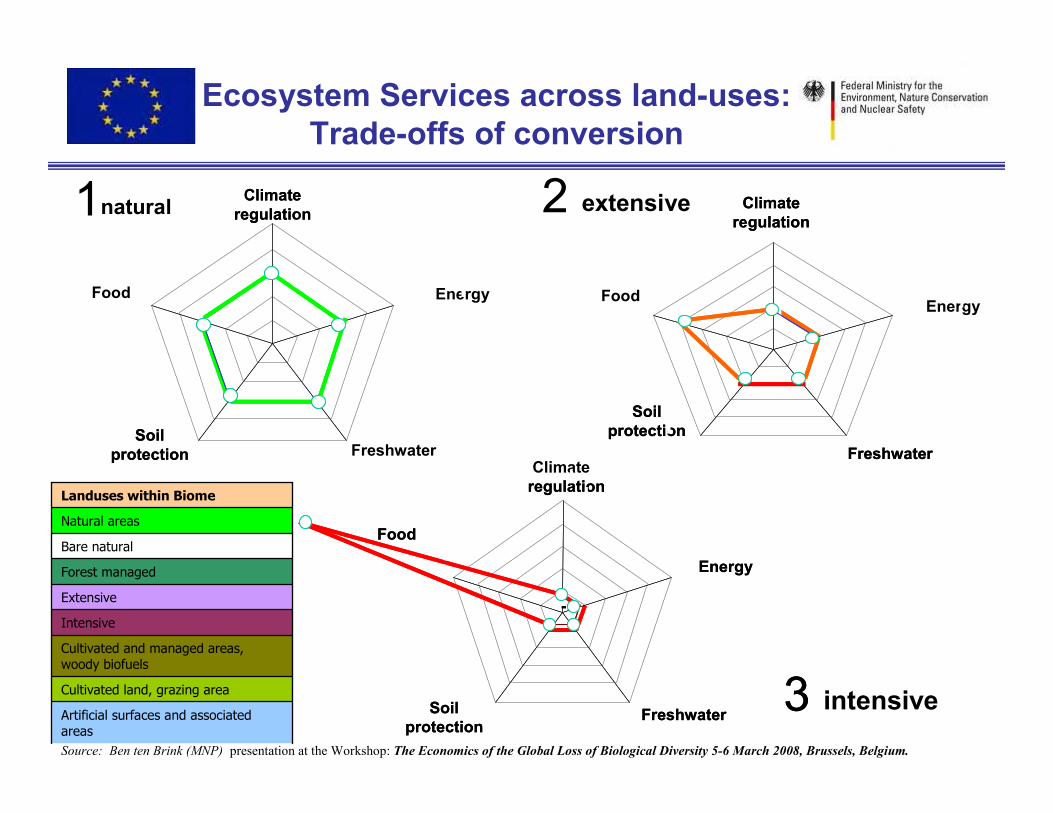
Ecosystem Services across land-uses: Trade-offs of conversion
Source: Ben ten Brink (MNP) presentation at the Workshop: The Economics of the Global Loss of Biological Diversity 5-6 March 2008, Brussels, Belgium.
Energy
Soil protection
Food
regulation
Energy
Soil protection
Food
-
Freshwater
Soil protection
Food
Climate regulation
Climate regulation
Energy
Freshwater
1natural extensive
3 intensive
Freshwater
Energy
Soil protection
Food
Climate regulation
Energy
Soil protection
Food
-
Freshwater
Soil protection
Climate regulation
Climate regulation
2
3
Freshwater
Artificial surfaces and associated areas
Cultivated land, grazing area
Cultivated and managed areas, woody biofuels
Intensive
Extensive
Forest managed
Bare natural
Natural areas
Landuses within Biome
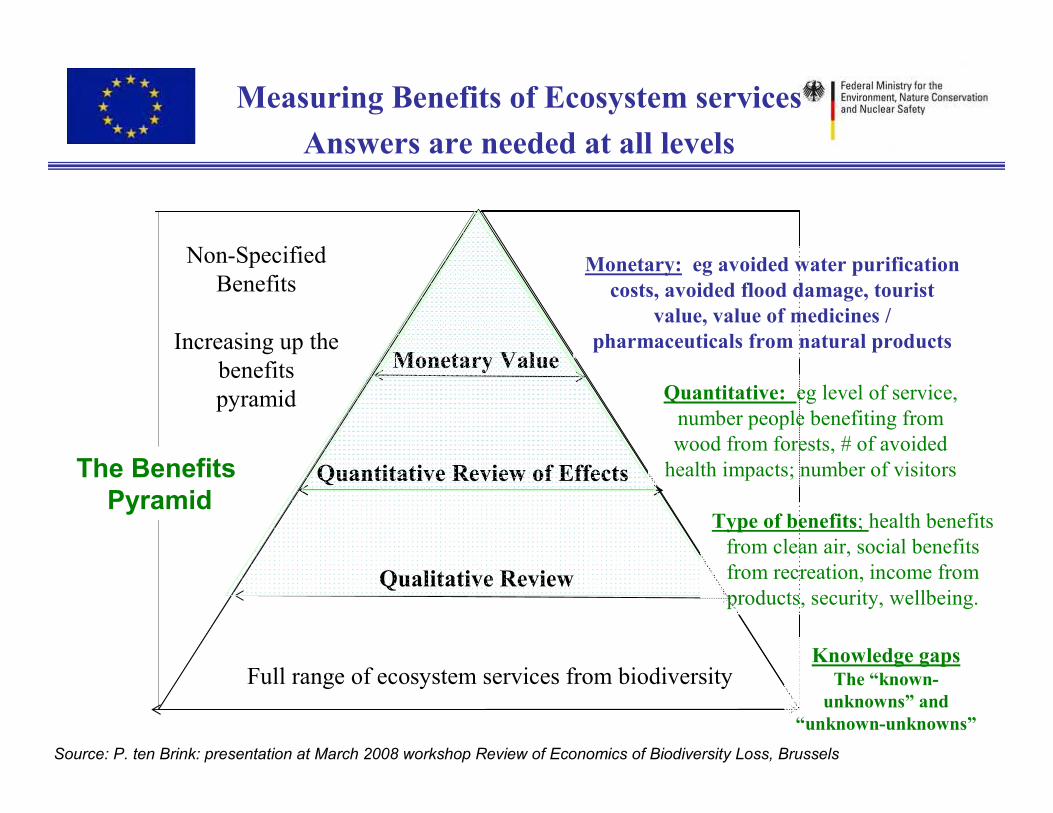
Monetary Value
Quantitative Review of Effects
Qualitative Review
Non-Specified
Benefits
Increasing up the
benefits
pyramid
Measuring Benefits of Ecosystem services
Answers are needed at all levels
Full range of ecosystem services from biodiversity
Type of benefits; health benefits
from clean air, social benefits
from recreation, income from
products, security, wellbeing.
Quantitative: eg level of service,
number people benefiting from
wood from forests, # of avoided
health impacts; number of visitors
Monetary: eg avoided water purification
costs, avoided flood damage, tourist
value, value of medicines /
pharmaceuticals from natural products
Knowledge gaps The “known-
unknowns” and
“unknown-unknowns”
Source: P. ten Brink: presentation at March 2008 workshop Review of Economics of Biodiversity Loss, Brussels
The BenefitsPyramid
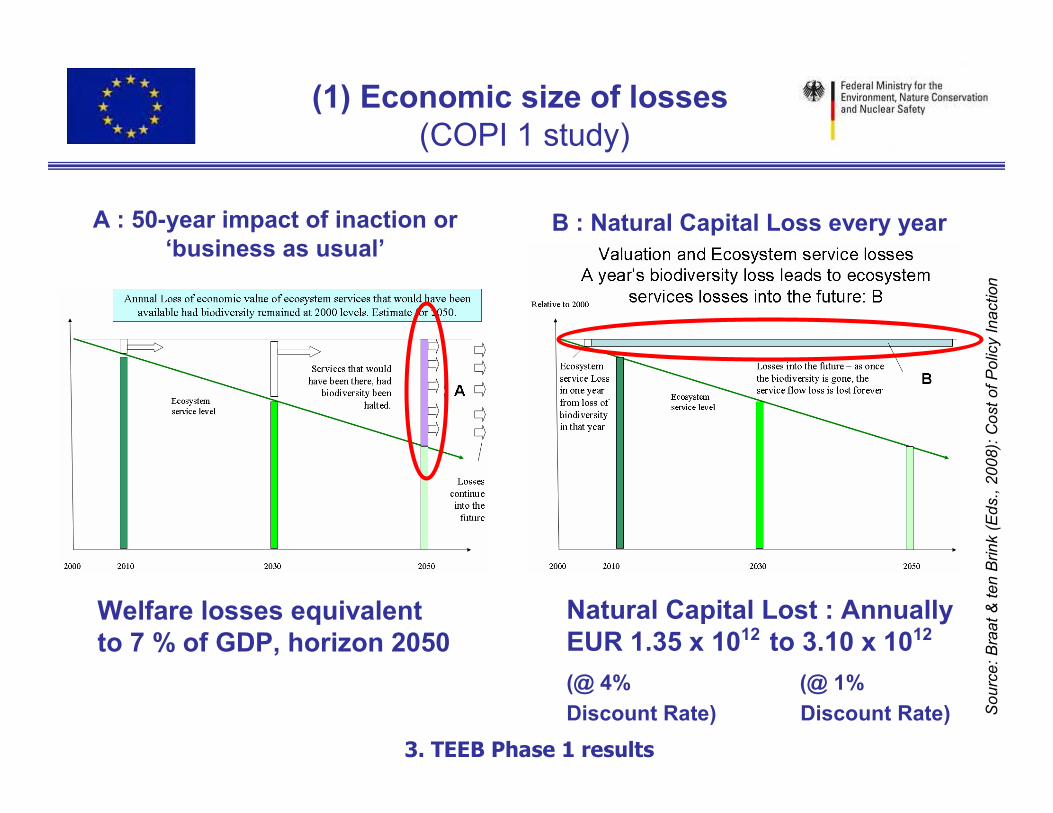
(1) Economic size of losses (COPI 1 study)
A : 50-year impact of inaction or ‘business as usual’
B : Natural Capital Loss every year
Welfare losses equivalent to 7 % of GDP, horizon 2050
Natural Capital Lost : AnnuallyEUR 1.35 x 10¹² to 3.10 x 10¹²
(@ 4% (@ 1%
Discount Rate) Discount Rate)
3. TEEB Phase 1 results
Source: Braat& ten Brink(Eds., 2008): Costof PolicyInaction
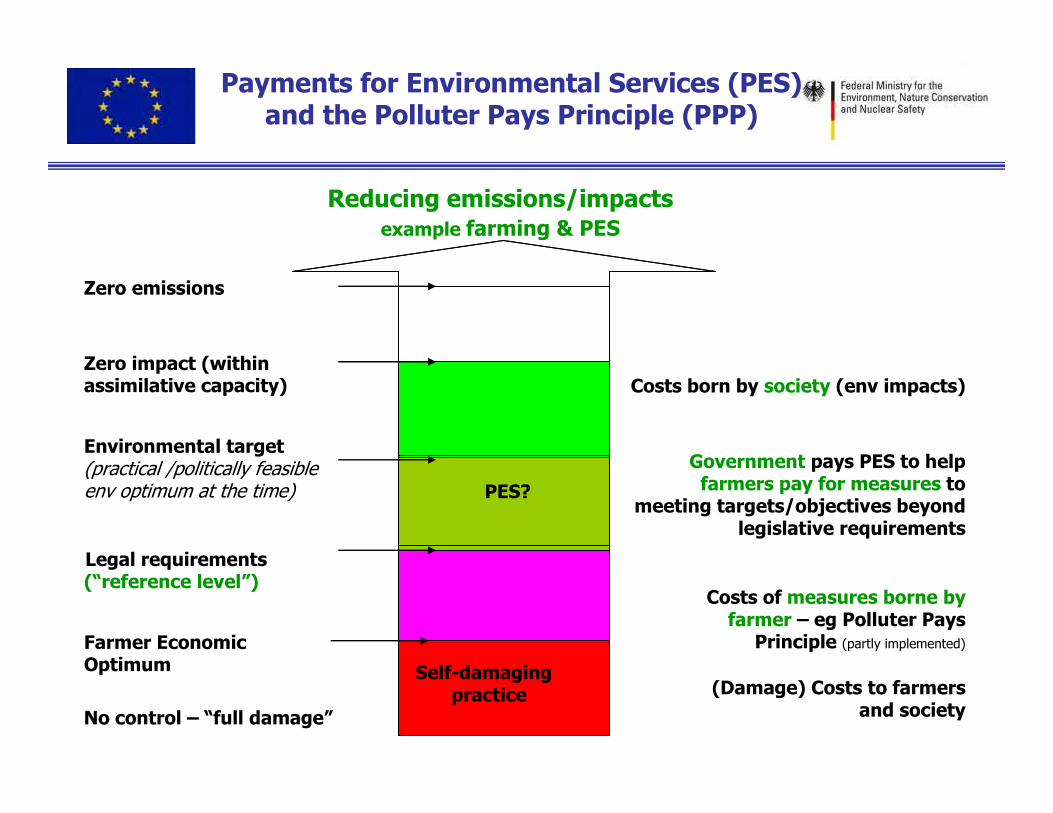
Payments for Environmental Services (PES) and the Polluter Pays Principle (PPP)
Farmer Economic Optimum
Legal requirements (“reference level”)
Environmental target (practical /politically feasible env optimum at the time)
Zero impact (within assimilative capacity)
Zero emissions
Costs of measures borne by farmer – eg Polluter Pays
Principle (partly implemented)
Government pays PES to help farmers pay for measures to
meeting targets/objectives beyond legislative requirements
Self-damaging practice (Damage) Costs to farmers
and society
Costs born by society (env impacts)
Reducing emissions/impactsexample farming & PES
No control – “full damage”
PES?
39
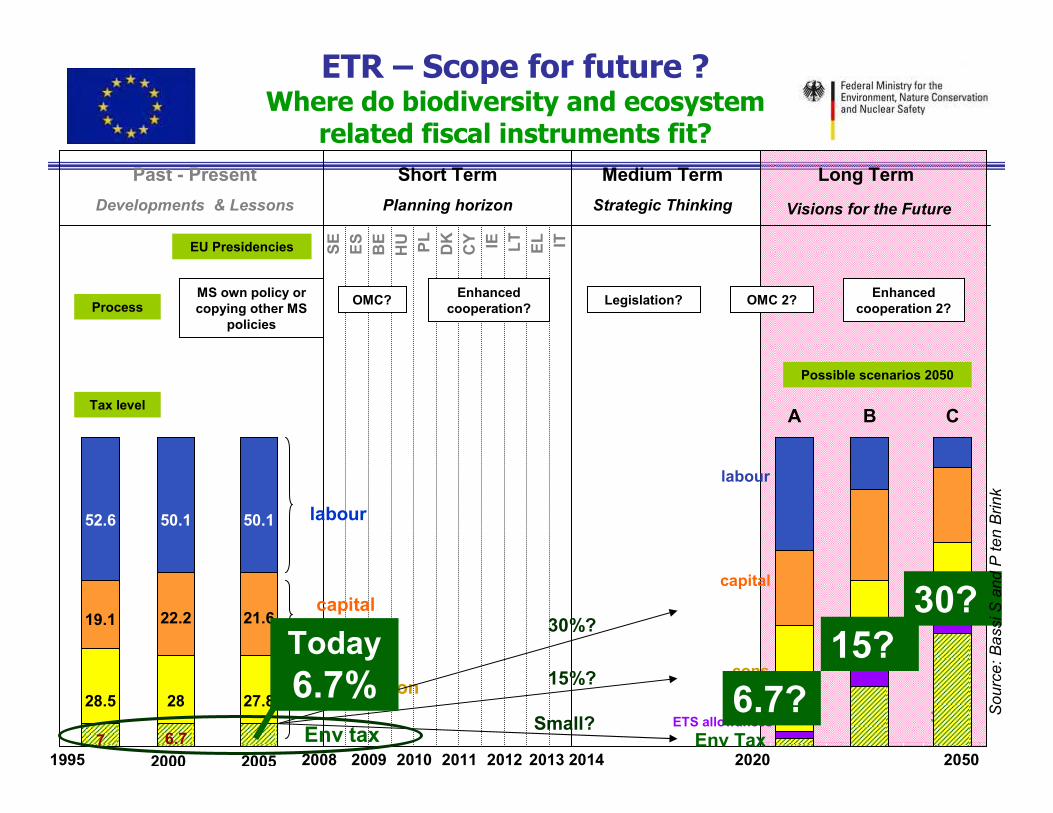
ETR – Scope for future ?Where do biodiversity and ecosystem
related fiscal instruments fit?
1995 2009
Past - Present
Developments & Lessons
2013 2014 2020 2050
Long Term
Visions for the Future
Short Term
Planning horizon
Medium Term
Strategic Thinking
20122008 2010 2011
SE
ES
HU
PL
DK
CY
BE IE LT
20052000
52.6 50.1 50.1
19.1
28.5 28
22.2 21.6
27.8
7 6.7
labour
capital
consumption
Env tax
Possible scenarios 2050
A B C
MS own policy or copying other MS
policies
OMC? Legislation?Enhanced
cooperation?OMC 2?
Enhanced cooperation 2?Process
Tax level
EU Presidencies
labour
capital
ETS allowances
Env Tax
cons.
Small?
15%?
30%?
EL IT
Today
6.7% 6.7?
30?15?
Source: Bassi S and P ten Brink