teeb & freshwater ecosystem services in china · teeb & freshwater ecosystem services in...
TRANSCRIPT
Ph.D. Dissertation
TEEB & Freshwater Ecosystem Services in China
Prof. MENG Wei
Chinese Research Academy of Environmental
Sciences (CRAES)
Ph.D. Dissertation
CONTENTS
1. The Economics of Ecosystems and Biodiversity (TEEB)
3. Assessment of Water Environmental Carrying Capacity of Fuxian Lake
2. Case Study of Ecological Assets Assessment of the Three Rivers Source
1

Ph.D. Dissertation
1.TEEB
2
Ph.D. Dissertation
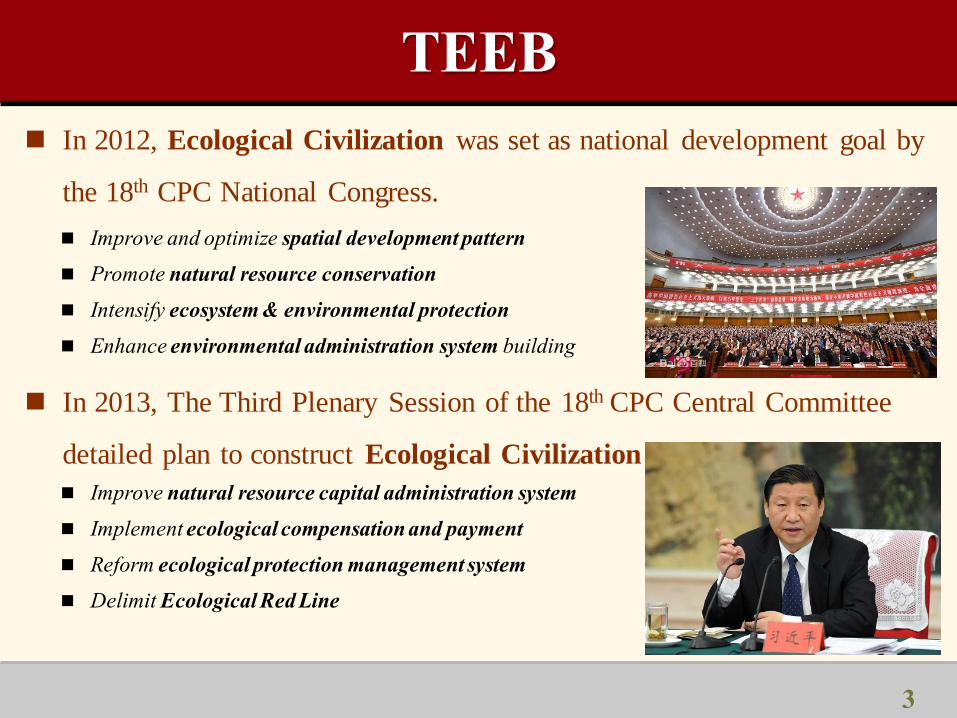
In 2013, The Third Plenary Session of the 18th CPC Central Committee
detailed plan to construct Ecological Civilization
In 2012, Ecological Civilization was set as national development goal by
the 18th CPC National Congress.
Improve and optimize spatial development pattern
Promote natural resource conservation
Intensify ecosystem & environmental protection
Enhance environmental administration system building
Improve natural resource capital administration system
Implement ecological compensation and payment
Reform ecological protection management system
Delimit Ecological Red Line
TEEB
3
Ph.D. Dissertation
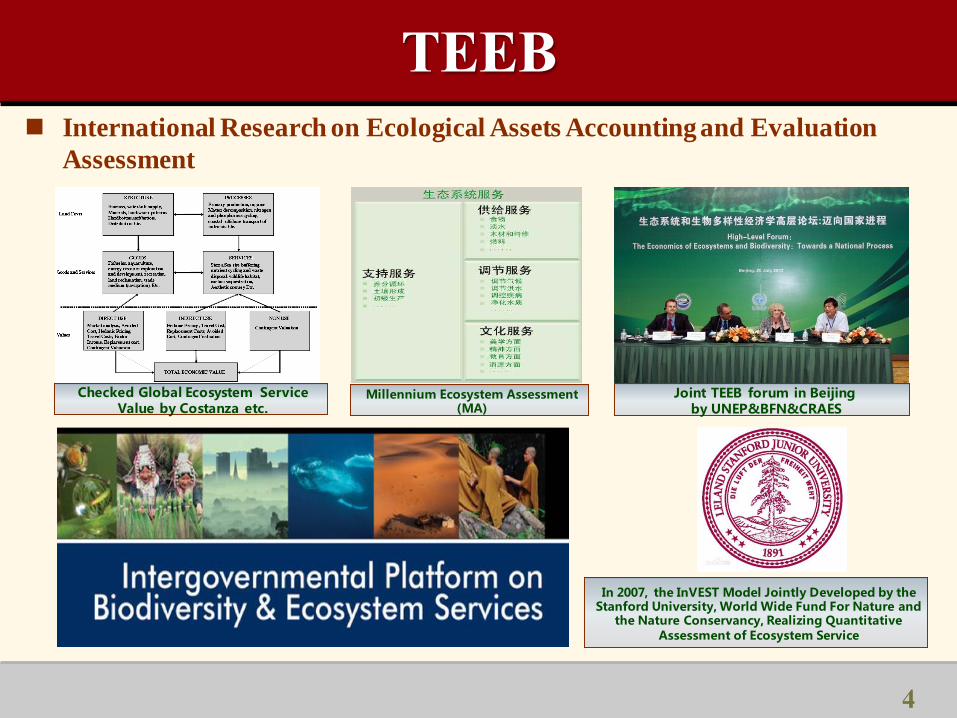
TEEB International Research on Ecological Assets Accounting and Evaluation
Assessment
Joint TEEB forum in Beijing by UNEP&BFN&CRAES
Millennium Ecosystem Assessment (MA)
Checked Global Ecosystem Service Value by Costanza etc.
In 2007, the InVEST Model Jointly Developed by the Stanford University, World Wide Fund For Nature and
the Nature Conservancy, Realizing Quantitative Assessment of Ecosystem Service
4
Ph.D. Dissertation
TEEB
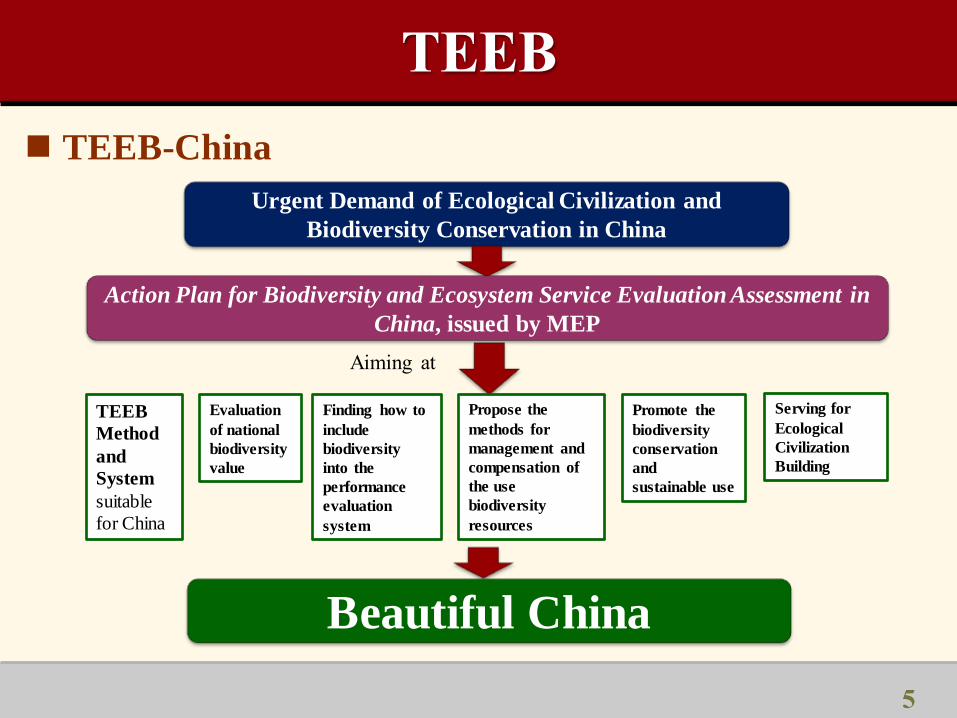
TEEB-China
Urgent Demand of Ecological Civilization and
Biodiversity Conservation in China
Action Plan for Biodiversity and Ecosystem Service Evaluation Assessment in
China, issued by MEP
TEEB
Method
and
System
suitable
for China
Aiming at
Evaluation
of national
biodiversity
value
Finding how to
include
biodiversity
into the
performance
evaluation
system
Propose the
methods for
management and
compensation of
the use
biodiversity
resources
Promote the
biodiversity
conservation
and
sustainable use
Serving for
Ecological
Civilization
Building
Beautiful China
5
Ph.D. Dissertation
TEEB
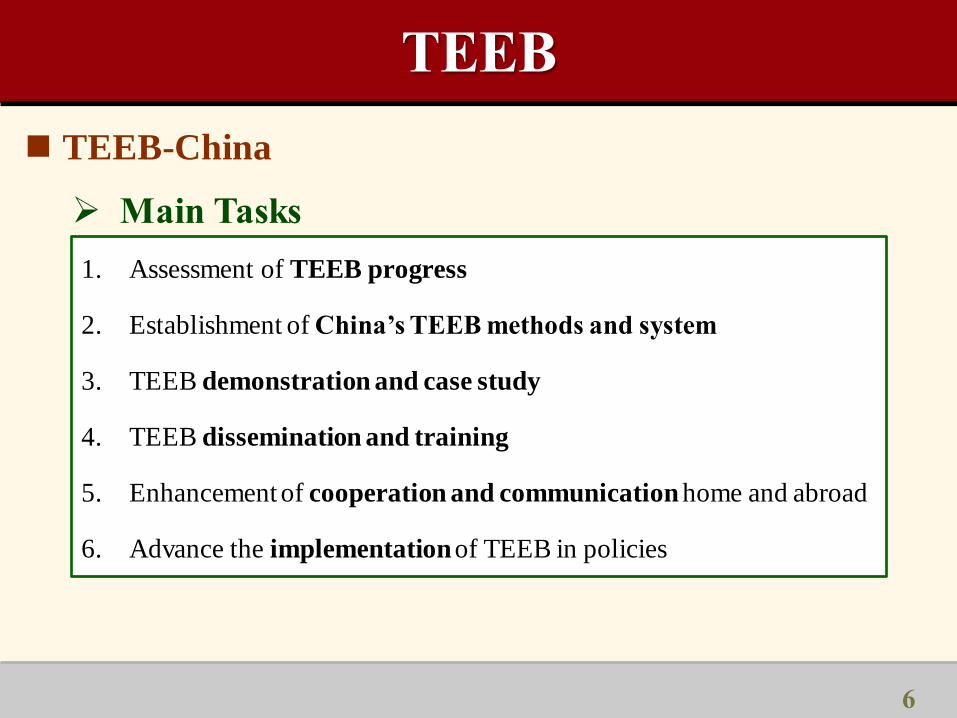
1. Assessment of TEEB progress
2. Establishment of China’s TEEB methods and system
3. TEEB demonstration and case study
4. TEEB dissemination and training
5. Enhancement of cooperation and communication home and abroad
6. Advance the implementation of TEEB in policies
TEEB-China
Main Tasks
6
Ph.D. Dissertation
TEEB
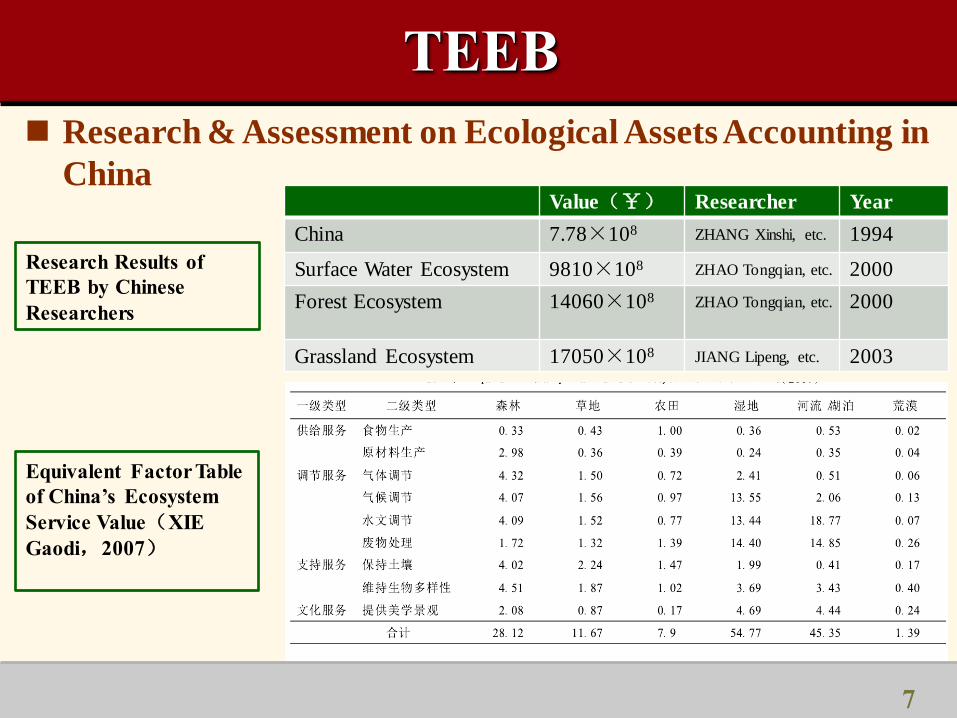
Research & Assessment on Ecological Assets Accounting in
China
Value(¥) Researcher Year
China 7.78×10⁸ ZHANG Xinshi, etc. 1994
Surface Water Ecosystem 9810×108 ZHAO Tongqian, etc. 2000
Forest Ecosystem 14060×108
ZHAO Tongqian, etc.
2000
Grassland Ecosystem 17050×108 JIANG Lipeng, etc. 2003
Research Results of
TEEB by Chinese
Researchers
Equivalent Factor Table
of China’s Ecosystem
Service Value(XIE
Gaodi,2007)
7
Ph.D. Dissertation
0
200
400
600
800
1000
森林
灌丛
草地
湿地
农田
城镇
荒漠
冰川
/永久积
雪
单位存量价值 单位服务价值 单位产品价值
TEEB
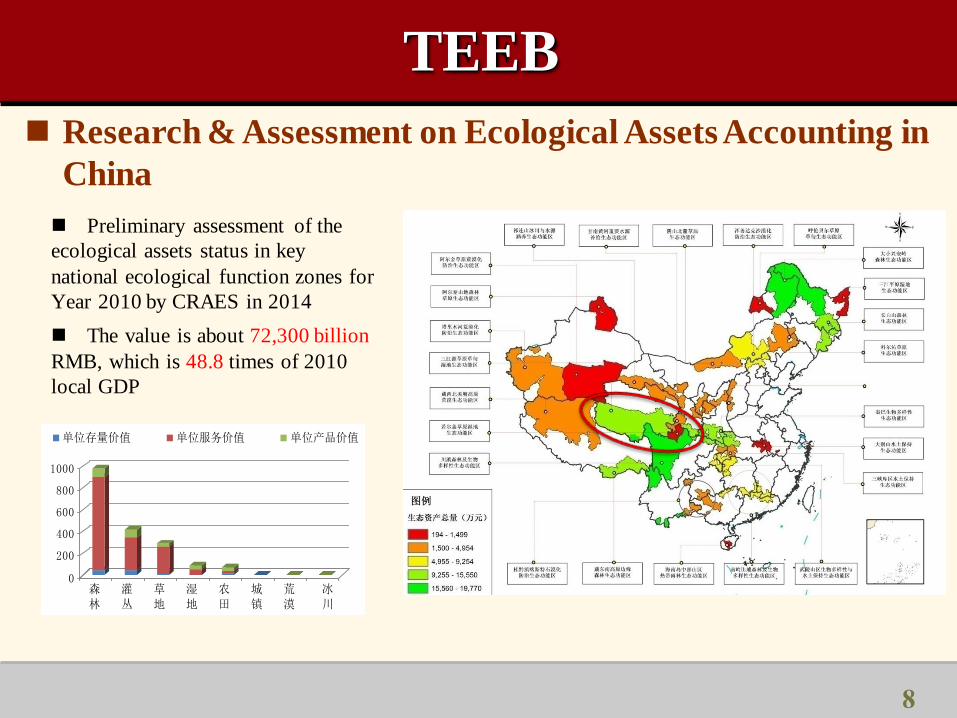
Preliminary assessment of the
ecological assets status in key
national ecological function zones for
Year 2010 by CRAES in 2014
The value is about 72,300 billion
RMB, which is 48.8 times of 2010
local GDP
Research & Assessment on Ecological Assets Accounting in
China
8
Ph.D. Dissertation
2. Case Study of Ecological Assets Assessment of the Three Rivers Source
9
Ph.D. Dissertation
Precipitation Distribution in Three Rivers Source Source of the Yangtze River, Yellow River and Lancang River
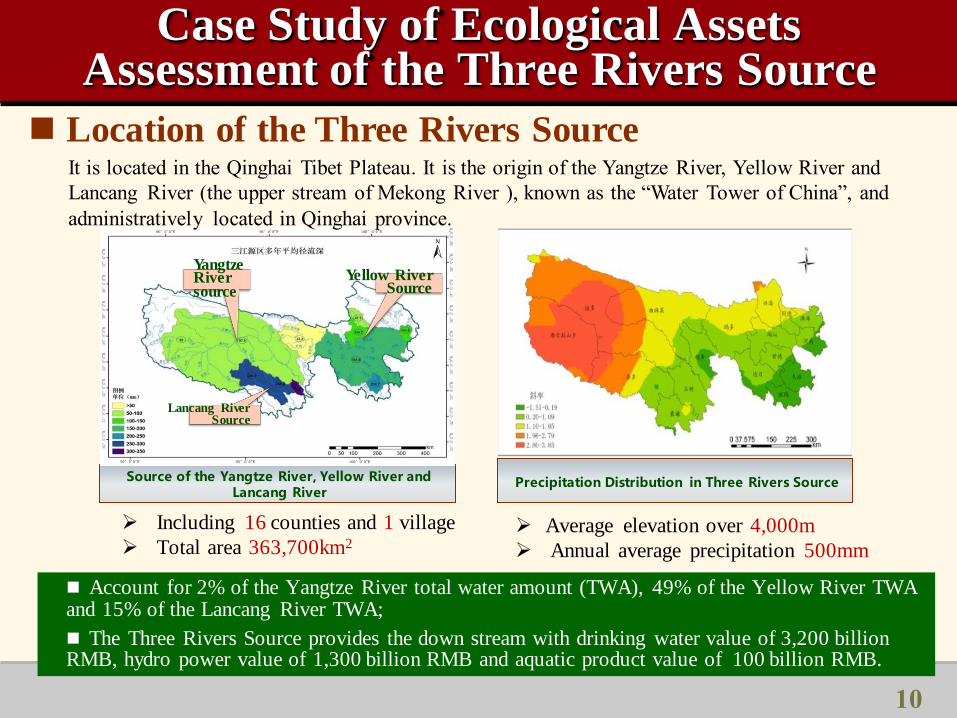
Case Study of Ecological Assets Assessment of the Three Rivers Source
Location of the Three Rivers Source
Yellow River Source
Yangtze River source
Lancang River Source
Including 16 counties and 1 village
Total area 363,700km2 Average elevation over 4,000m
Annual average precipitation 500mm
Account for 2% of the Yangtze River total water amount (TWA), 49% of the Yellow River TWA and 15% of the Lancang River TWA;
The Three Rivers Source provides the down stream with drinking water value of 3,200 billion RMB, hydro power value of 1,300 billion RMB and aquatic product value of 100 billion RMB.
It is located in the Qinghai Tibet Plateau. It is the origin of the Yangtze River, Yellow River and
Lancang River (the upper stream of Mekong River ), known as the “Water Tower of China”, and
administratively located in Qinghai province.
10
Ph.D. Dissertation
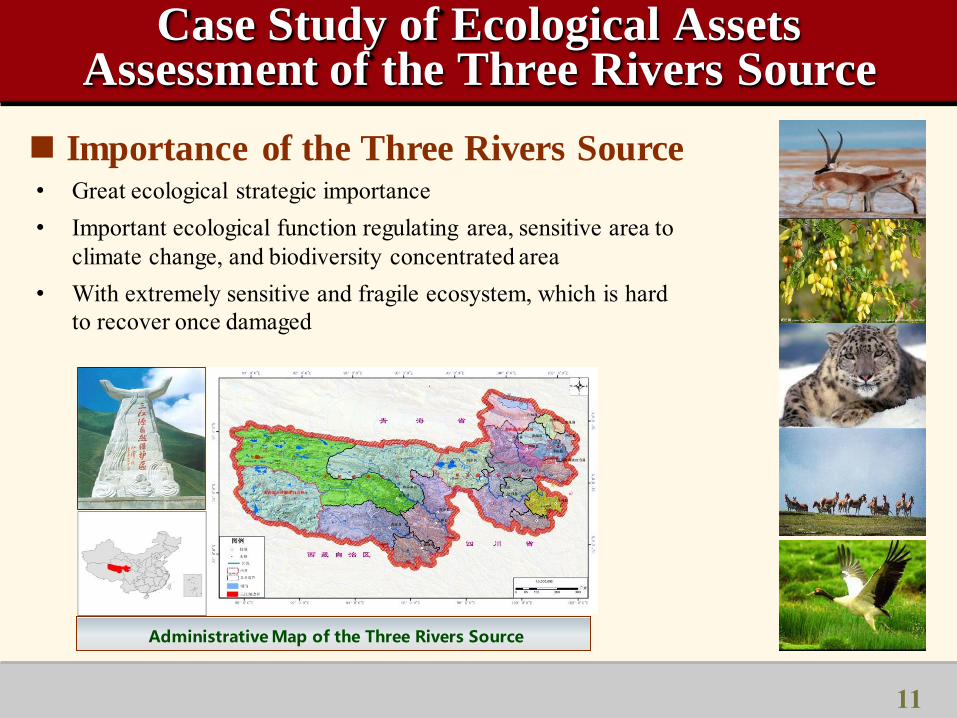
Importance of the Three Rivers Source
Administrative Map of the Three Rivers Source
• Great ecological strategic importance
• Important ecological function regulating area, sensitive area to
climate change, and biodiversity concentrated area
• With extremely sensitive and fragile ecosystem, which is hard
to recover once damaged
Case Study of Ecological Assets Assessment of the Three Rivers Source
11
Ph.D. Dissertation
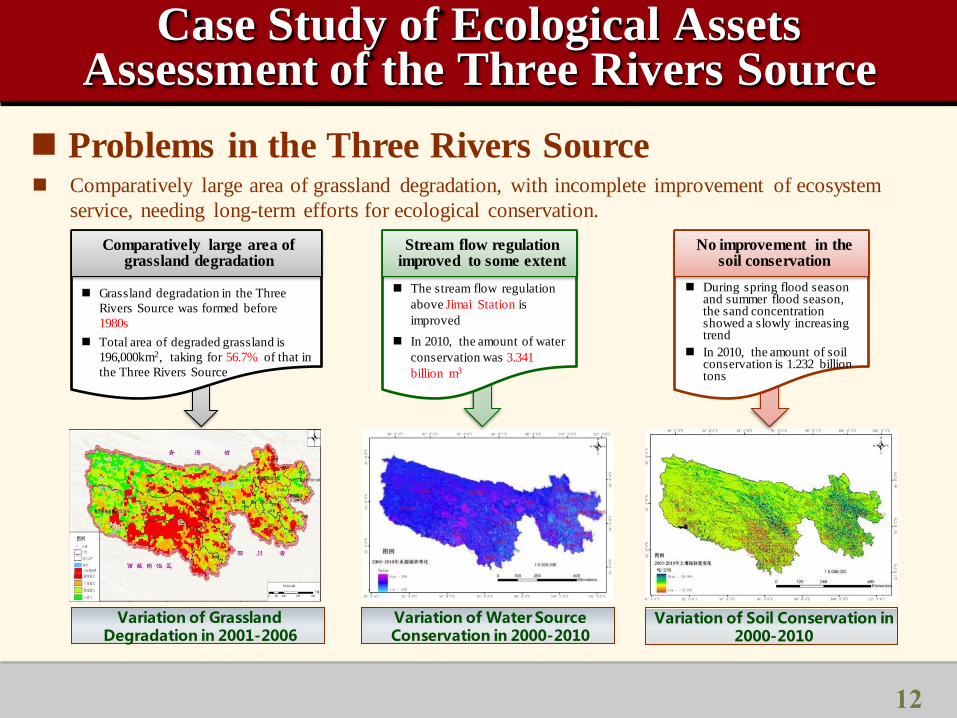
Comparatively large area of grassland degradation, with incomplete improvement of ecosystem
service, needing long-term efforts for ecological conservation.
Variation of Water Source Conservation in 2000-2010
Variation of Soil Conservation in 2000-2010
Grassland degradation in the Three
Rivers Source was formed before
1980s
Total area of degraded grassland is
196,000km2, taking for 56.7% of that in
the Three Rivers Source
Comparatively large area of grassland degradation
The stream flow regulation
above Jimai Station is
improved
In 2010, the amount of water
conservation was 3.341
billion m3
Stream flow regulation improved to some extent
During spring flood season and summer flood season, the sand concentration showed a slowly increasing trend
In 2010, the amount of soil conservation is 1.232 billion tons
No improvement in the soil conservation
Variation of Grassland Degradation in 2001-2006
Problems in the Three Rivers Source
Case Study of Ecological Assets Assessment of the Three Rivers Source
12
Ph.D. Dissertation
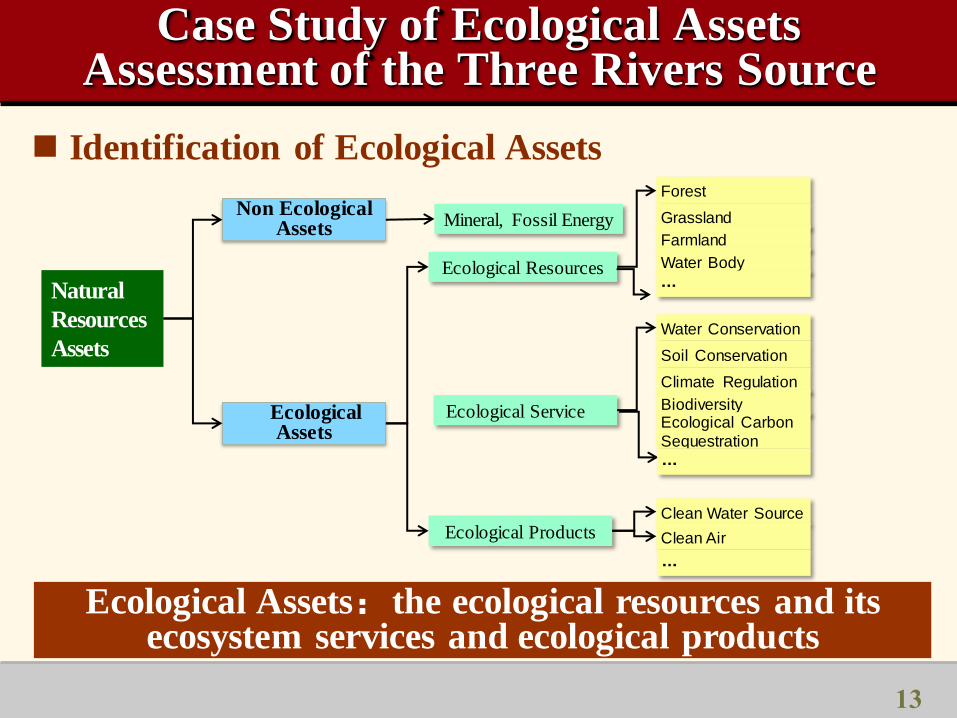
Natural
Resources
Assets
Ecological Assets
Non Ecological Assets Mineral, Fossil Energy
Ecological Resources
Water Conservation
Soil Conservation
Climate Regulation
Forest
Ecological Service
Ecological Products
Grassland
Farmland
Water Body
Ecological Assets:the ecological resources and its ecosystem services and ecological products
Biodiversity Ecological Carbon Sequestration
Clean Water Source
Clean Air
Identification of Ecological Assets
…
…
…
Case Study of Ecological Assets Assessment of the Three Rivers Source
13
Ph.D. Dissertation
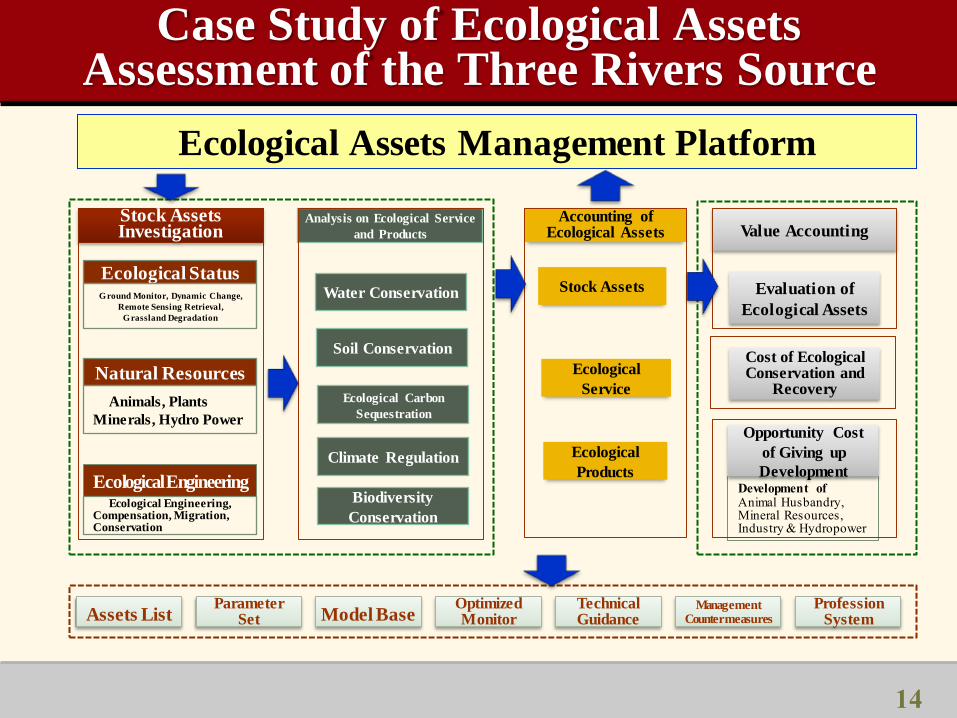
Ecological Assets Management Platform
Value Accounting Accounting of
Ecological Assets Analysis on Ecological Service
and Products
Stock Assets Investigation
Ecological Status Ground Monitor, Dynamic Change,
Remote Sensing Retrieval,
Grassland Degradation
Natural Resources
Animals, Plants
Minerals, Hydro Power
Ecological Engineering Ecological Engineering, Compensation, Migration, Conservation
Soil Conservation
Water Conservation
Climate Regulation
Biodiversity
Conservation
Ecological Carbon
Sequestration
Evaluation of
Ecological Assets
Cost of Ecological Conservation and
Recovery
Development of Animal Husbandry, Mineral Resources, Industry & Hydropower
Opportunity Cost
of Giving up
Development
Assets List Parameter
Set Model Base Technical Guidance
Management Countermeasures
Profession System
Optimized Monitor
Ecological
Service
Ecological
Products
Stock Assets
Case Study of Ecological Assets Assessment of the Three Rivers Source
14
Ph.D. Dissertation
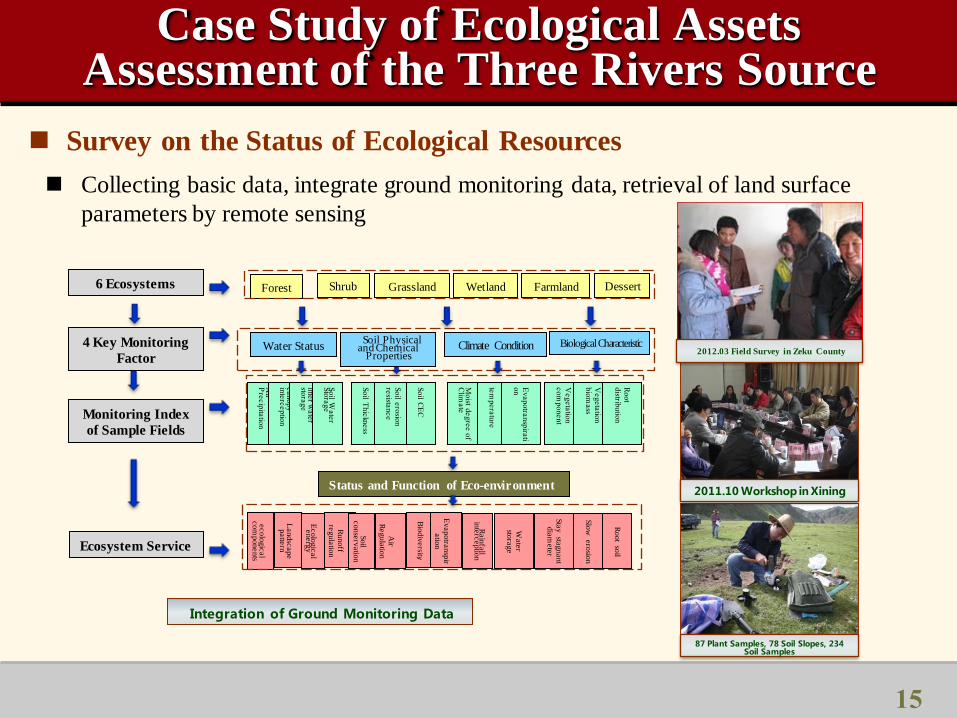
Integration of Ground Monitoring Data
6 Ecosystems
4 Key Monitoring
Factor
Monitoring Index
of Sample Fields
Ecosystem Service
Forest Shrub Grassland Wetland Farmland Dessert
Water Status Soil Physical and Chemical
Properties Climate Condition Biological Characteristic
Air
Pre
cip
itatio
n
canopy
in
terc
eptio
n
litter w
ate
r sto
rage
Soil W
ate
r Sto
rage
Soil T
hic
kness
Soil e
rosio
n
resista
nce
Soil C
EC
Moist d
egre
e o
f C
limate
tem
pera
ture
Evapotra
nsp
irati
on
Ve
ge
tatio
n
co
mp
on
en
t
Vegeta
tion
bio
mass
Root
distrib
utio
n
Status and Function of Eco-environment
ecolo
gic
al
com
ponents
Landsc
ape
patte
rn
Ecolo
gic
al
energ
y
Ru
no
ff re
gu
latio
n
Soil
conse
rvatio
n
Air
Regula
tion
Bio
div
ersity
Evapotra
nsp
iratio
n
Rain
fall
inte
rceptio
n
Wate
r sto
rage
Root
soil
Sta
y sta
gnant
dia
mete
r
Slo
w
ero
sion
Collecting basic data, integrate ground monitoring data, retrieval of land surface
parameters by remote sensing
Survey on the Status of Ecological Resources
•2011.10 Workshop in Xining
87 Plant Samples, 78 Soil Slopes, 234 Soil Samples
•2012.03 Field Survey in Zeku County
Case Study of Ecological Assets Assessment of the Three Rivers Source
15
Ph.D. Dissertation
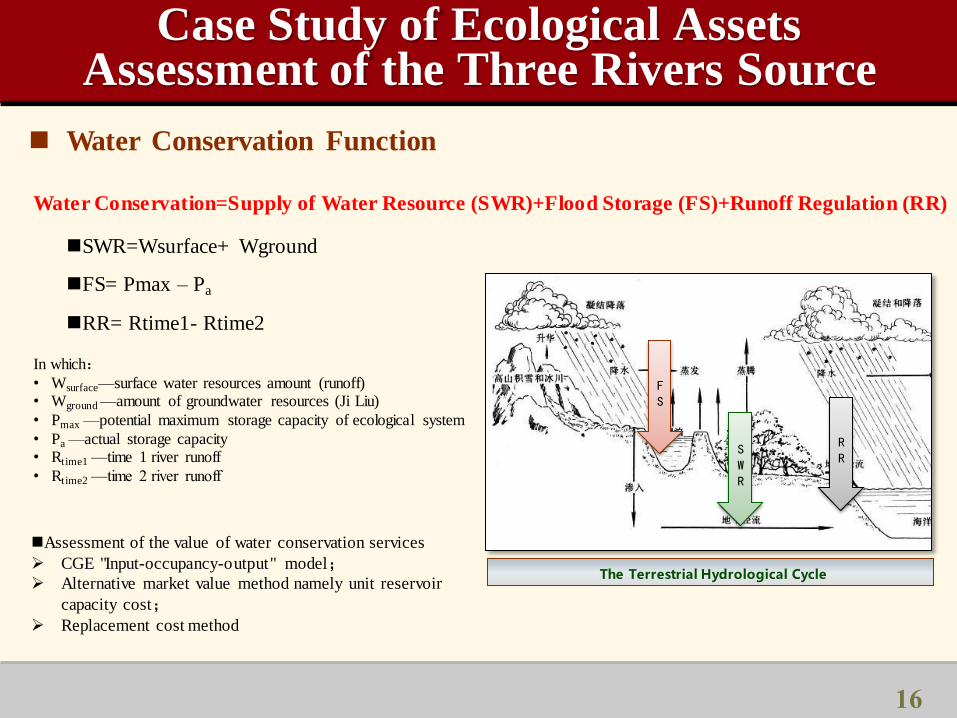
Water Conservation Function
Water Conservation=Supply of Water Resource (SWR)+Flood Storage (FS)+Runoff Regulation (RR)
SWR=Wsurface+ Wground
FS= Pmax – Pa
RR= Rtime1- Rtime2
In which:
• Wsurface—surface water resources amount (runoff) • Wground —amount of groundwater resources (Ji Liu)
• Pmax —potential maximum storage capacity of ecological system
• Pa —actual storage capacity • Rt ime1 —time 1 river runoff • Rt ime2 —time 2 river runoff
The Terrestrial Hydrological Cycle
SWR
FS
RR
Assessment of the value of water conservation services
CGE "Input-occupancy-output" model;
Alternative market value method namely unit reservoir
capacity cost;
Replacement cost method
Case Study of Ecological Assets Assessment of the Three Rivers Source
16
Ph.D. Dissertation
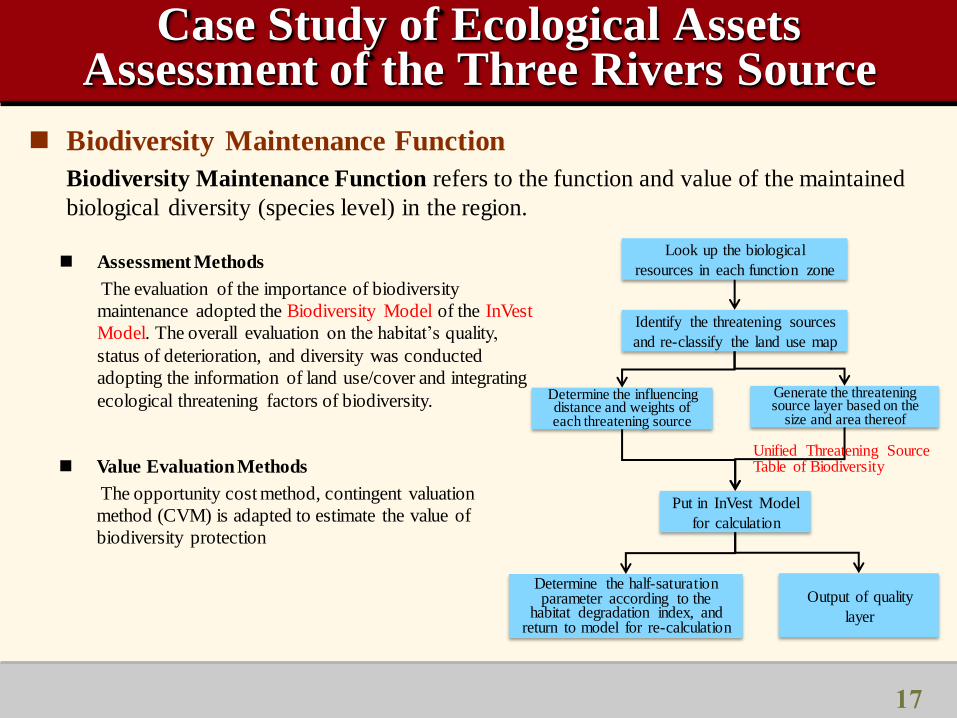
Biodiversity Maintenance Function
Biodiversity Maintenance Function refers to the function and value of the maintained
biological diversity (species level) in the region.
Assessment Methods
The evaluation of the importance of biodiversity
maintenance adopted the Biodiversity Model of the InVest
Model. The overall evaluation on the habitat’s quality,
status of deterioration, and diversity was conducted
adopting the information of land use/cover and integrating
ecological threatening factors of biodiversity.
Unified Threatening Source Table of Biodiversity
Look up the biological
resources in each function zone
Identify the threatening sources
and re-classify the land use map
Determine the influencing distance and weights of each threatening source
Generate the threatening source layer based on the
size and area thereof
Put in InVest Model
for calculation
Determine the half-saturation parameter according to the
habitat degradation index, and return to model for re-calculation
Output of quality
layer
Value Evaluation Methods
The opportunity cost method, contingent valuation
method (CVM) is adapted to estimate the value of
biodiversity protection
Case Study of Ecological Assets Assessment of the Three Rivers Source
17
Ph.D. Dissertation
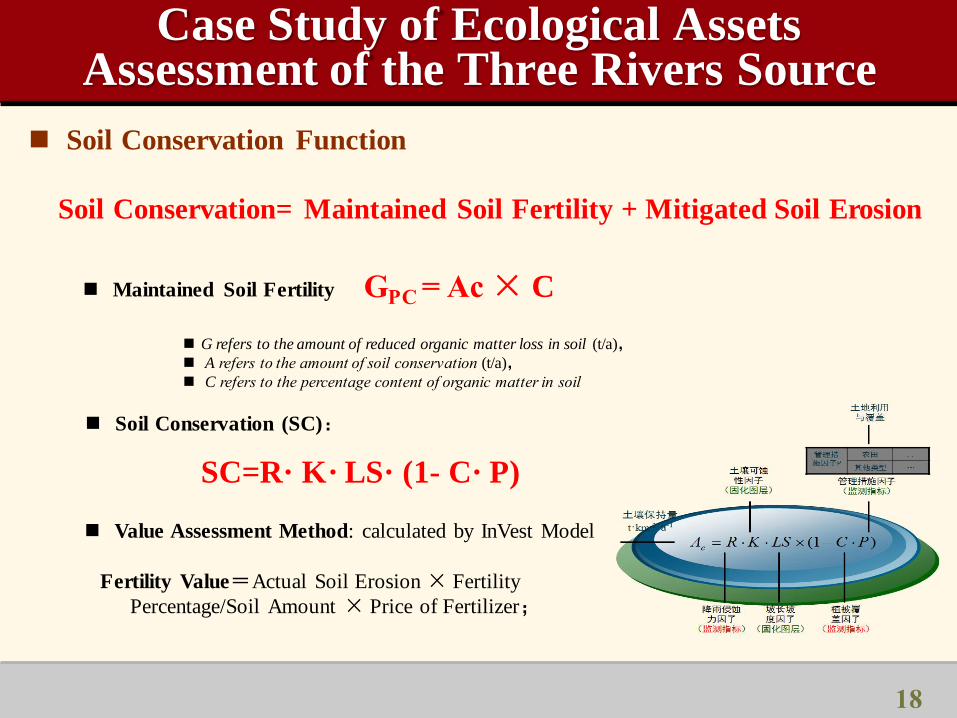
Soil Conservation Function
Maintained Soil Fertility GPC = Ac × C
G refers to the amount of reduced organic matter loss in soil (t/a),
A refers to the amount of soil conservation (t/a),
C refers to the percentage content of organic matter in soil
Soil Conservation= Maintained Soil Fertility + Mitigated Soil Erosion
Soil Conservation (SC):
SC=R· K· LS· (1- C· P)
Value Assessment Method: calculated by InVest Model
Fertility Value=Actual Soil Erosion × Fertility
Percentage/Soil Amount × Price of Fertilizer;
Case Study of Ecological Assets Assessment of the Three Rivers Source
18
Ph.D. Dissertation
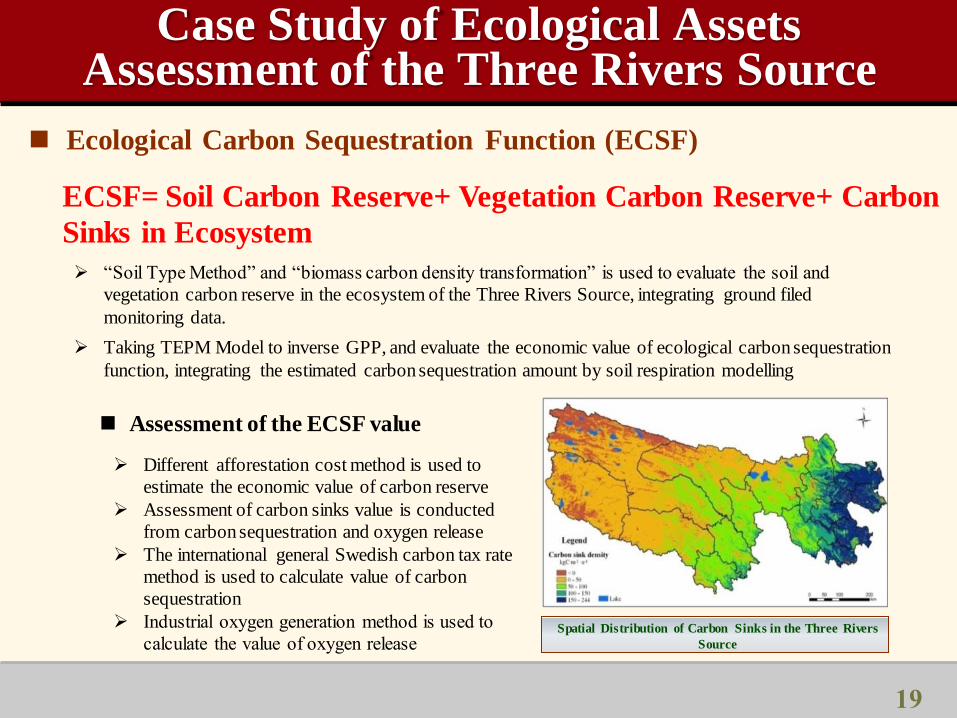
ECSF= Soil Carbon Reserve+ Vegetation Carbon Reserve+ Carbon
Sinks in Ecosystem
Ecological Carbon Sequestration Function (ECSF)
“Soil Type Method” and “biomass carbon density transformation” is used to evaluate the soil and
vegetation carbon reserve in the ecosystem of the Three Rivers Source, integrating ground filed
monitoring data.
Taking TEPM Model to inverse GPP, and evaluate the economic value of ecological carbon sequestration
function, integrating the estimated carbon sequestration amount by soil respiration modelling
Different afforestation cost method is used to
estimate the economic value of carbon reserve
Assessment of carbon sinks value is conducted
from carbon sequestration and oxygen release
The international general Swedish carbon tax rate
method is used to calculate value of carbon
sequestration
Industrial oxygen generation method is used to
calculate the value of oxygen release
Assessment of the ECSF value
Spatial Distribution of Carbon Sinks in the Three Rivers
Source
Case Study of Ecological Assets Assessment of the Three Rivers Source
19
Ph.D. Dissertation
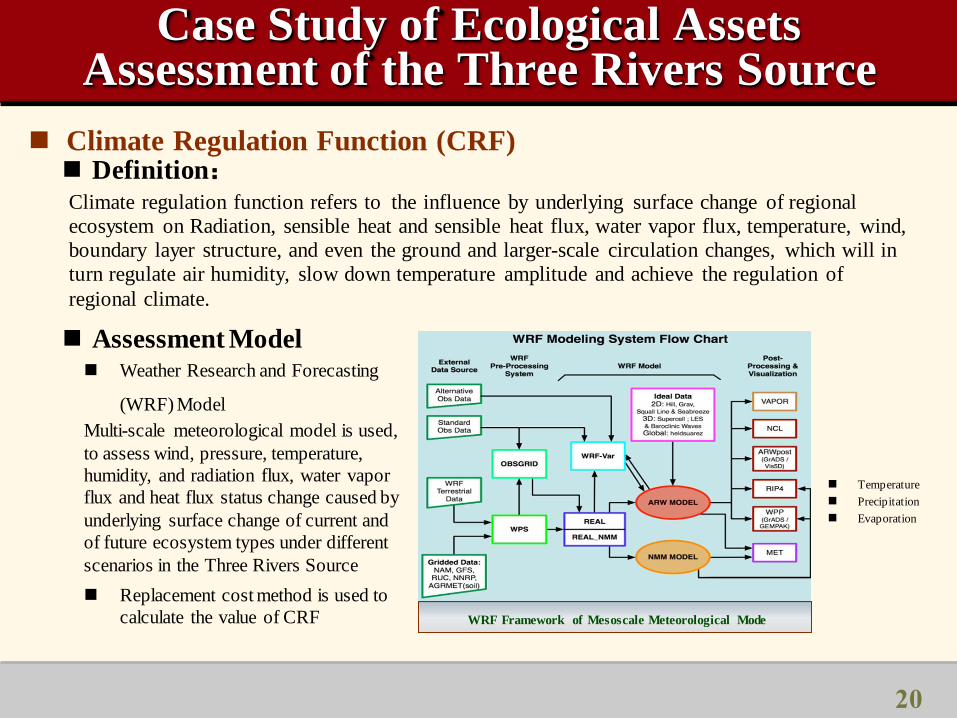
Climate regulation function refers to the influence by underlying surface change of regional
ecosystem on Radiation, sensible heat and sensible heat flux, water vapor flux, temperature, wind,
boundary layer structure, and even the ground and larger-scale circulation changes, which will in
turn regulate air humidity, slow down temperature amplitude and achieve the regulation of
regional climate.
Weather Research and Forecasting
(WRF) Model
Multi-scale meteorological model is used,
to assess wind, pressure, temperature,
humidity, and radiation flux, water vapor
flux and heat flux status change caused by
underlying surface change of current and
of future ecosystem types under different
scenarios in the Three Rivers Source
Replacement cost method is used to
calculate the value of CRF
Climate Regulation Function (CRF) Definition:
WRF Framework of Mesoscale Meteorological Mode
Temperature
Precipitation
Evaporation
Assessment Model
Case Study of Ecological Assets Assessment of the Three Rivers Source
20
Ph.D. Dissertation
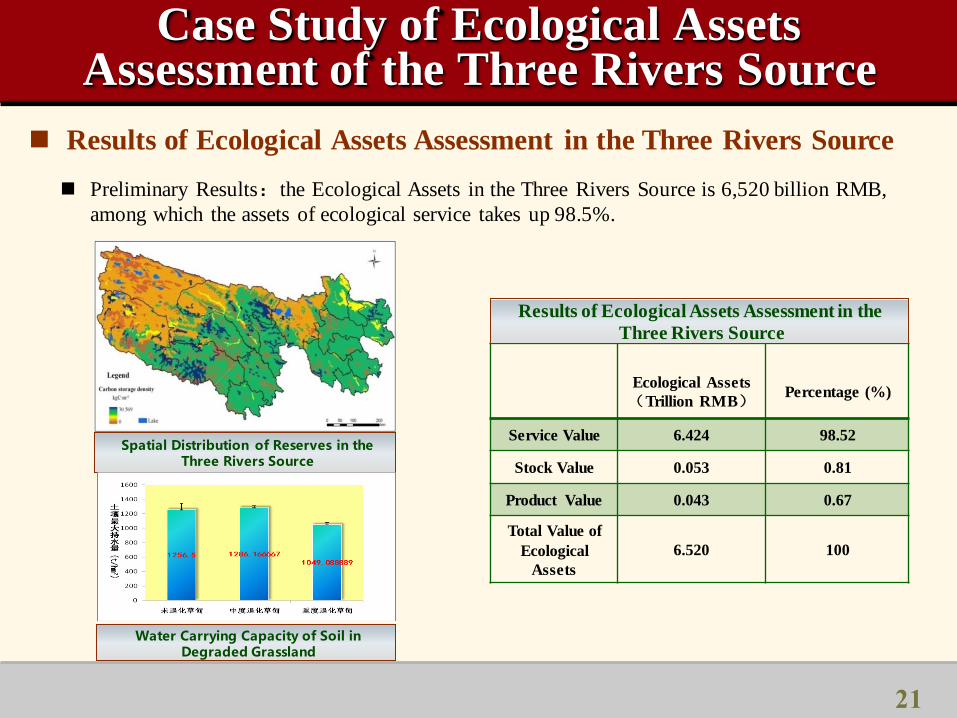
Results of Ecological Assets Assessment in the Three Rivers Source
Preliminary Results:the Ecological Assets in the Three Rivers Source is 6,520 billion RMB,
among which the assets of ecological service takes up 98.5%.
Ecological Assets
(Trillion RMB)
Percentage (%)
Service Value 6.424 98.52
Stock Value 0.053 0.81
Product Value 0.043 0.67
Total Value of
Ecological
Assets
6.520 100
Results of Ecological Assets Assessment in the
Three Rivers Source
Spatial Distribution of Reserves in the Three Rivers Source
Water Carrying Capacity of Soil in Degraded Grassland
Case Study of Ecological Assets Assessment of the Three Rivers Source
21
Ph.D. Dissertation
3. Assessment of Water Environmental
Carrying Capacity of Fuxian Lake
22
Ph.D. Dissertation
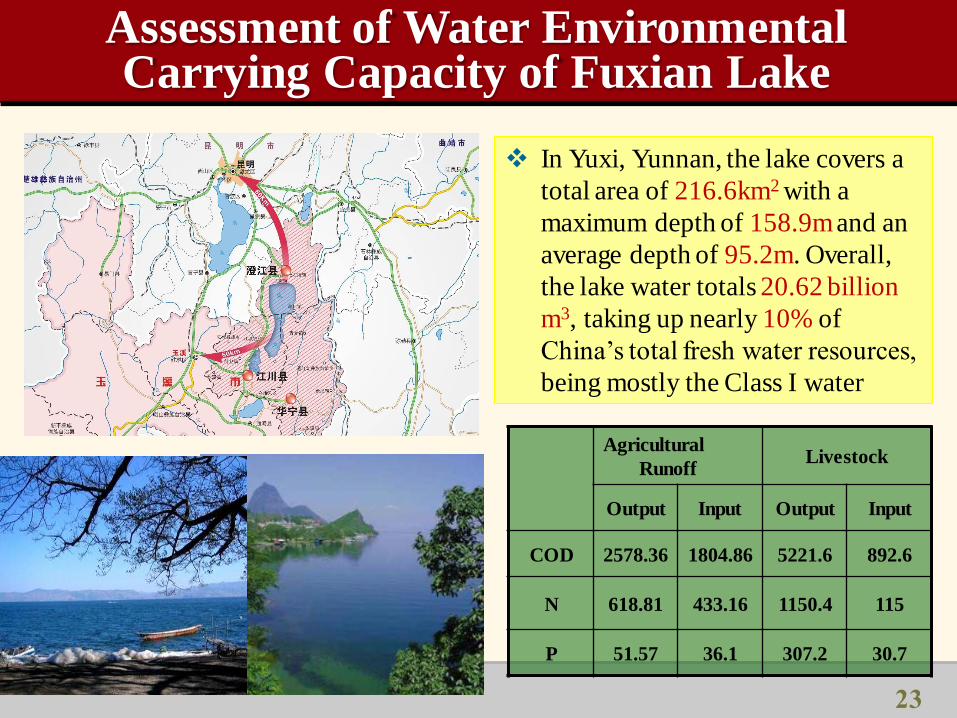
In Yuxi, Yunnan, the lake covers a
total area of 216.6km2 with a
maximum depth of 158.9m and an
average depth of 95.2m. Overall,
the lake water totals 20.62 billion
m3, taking up nearly 10% of
China’s total fresh water resources,
being mostly the Class I water
Agricultural
Runoff Livestock
Output Input Output Input
COD 2578.36 1804.86 5221.6 892.6
N 618.81 433.16 1150.4 115
P 51.57 36.1 307.2 30.7
23
Assessment of Water Environmental Carrying Capacity of Fuxian Lake
Ph.D. Dissertation
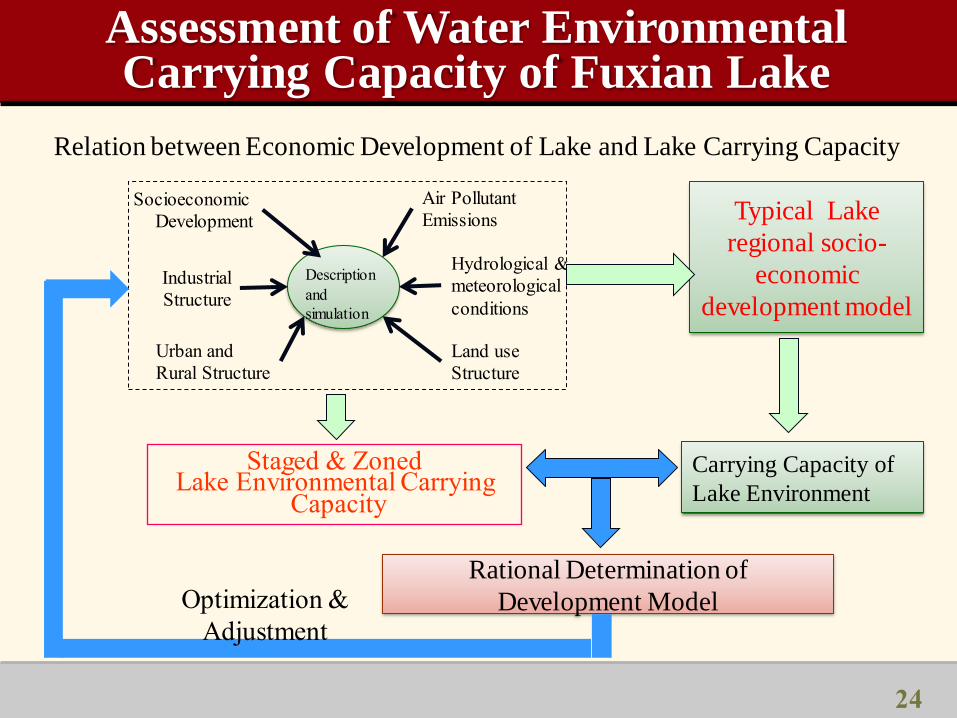
Staged & Zoned Lake Environmental Carrying
Capacity
Rational Determination of
Development Model
Typical Lake
regional socio-
economic
development model
Carrying Capacity of
Lake Environment
Description
and
simulation
Air Pollutant
Emissions Socioeconomic
Development
Hydrological &
meteorological
conditions
Land use
Structure
Industrial
Structure
Urban and
Rural Structure
Optimization &
Adjustment
Relation between Economic Development of Lake and Lake Carrying Capacity
Assessment of Water Environmental Carrying Capacity of Fuxian Lake
24
Ph.D. Dissertation
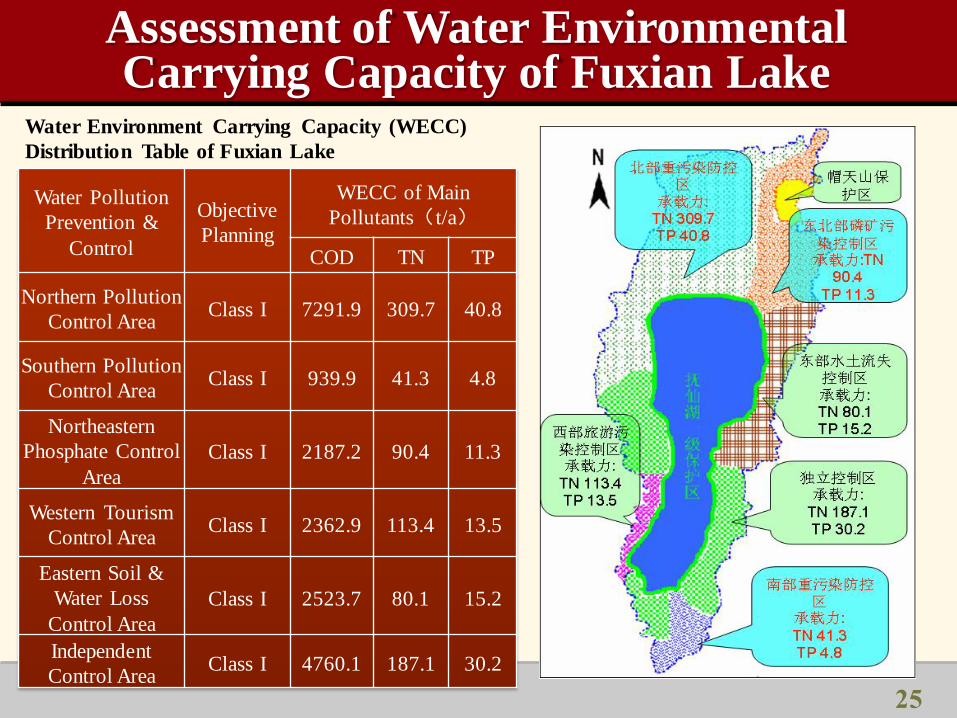
Water Pollution
Prevention &
Control
Objective
Planning
WECC of Main
Pollutants(t/a)
COD TN TP
Northern Pollution
Control Area Class I 7291.9 309.7 40.8
Southern Pollution
Control Area Class I 939.9 41.3 4.8
Northeastern
Phosphate Control
Area
Class I 2187.2 90.4 11.3
Western Tourism
Control Area Class I 2362.9 113.4 13.5
Eastern Soil &
Water Loss
Control Area
Class I 2523.7 80.1 15.2
Independent
Control Area Class I 4760.1 187.1 30.2
Water Environment Carrying Capacity (WECC)
Distribution Table of Fuxian Lake
Assessment of Water Environmental Carrying Capacity of Fuxian Lake
25
Ph.D. Dissertation
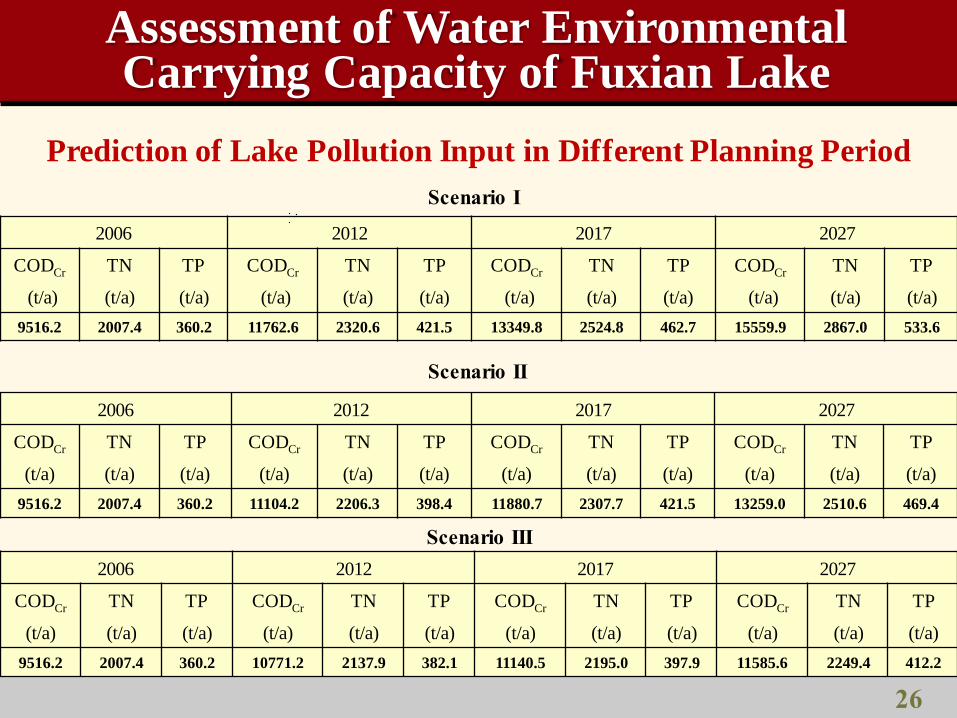
2006 2012 2017 2027
CODCr TN TP CODCr TN TP CODCr TN TP CODCr TN TP
(t/a) (t/a) (t/a) (t/a) (t/a) (t/a) (t/a) (t/a) (t/a) (t/a) (t/a) (t/a)
9516.2 2007.4 360.2 11762.6 2320.6 421.5 13349.8 2524.8 462.7 15559.9 2867.0 533.6
2006 2012 2017 2027
CODCr TN TP CODCr TN TP CODCr TN TP CODCr TN TP
(t/a) (t/a) (t/a) (t/a) (t/a) (t/a) (t/a) (t/a) (t/a) (t/a) (t/a) (t/a)
9516.2 2007.4 360.2 11104.2 2206.3 398.4 11880.7 2307.7 421.5 13259.0 2510.6 469.4
2006 2012 2017 2027
CODCr TN TP CODCr TN TP CODCr TN TP CODCr TN TP
(t/a) (t/a) (t/a) (t/a) (t/a) (t/a) (t/a) (t/a) (t/a) (t/a) (t/a) (t/a)
9516.2 2007.4 360.2 10771.2 2137.9 382.1 11140.5 2195.0 397.9 11585.6 2249.4 412.2
Scenario III
Scenario II
Scenario I
Prediction of Lake Pollution Input in Different Planning Period
Assessment of Water Environmental Carrying Capacity of Fuxian Lake
26
Ph.D. Dissertation
2000
2200
2400
2600
2800
3000
2007 2012 2017 2027
t/a
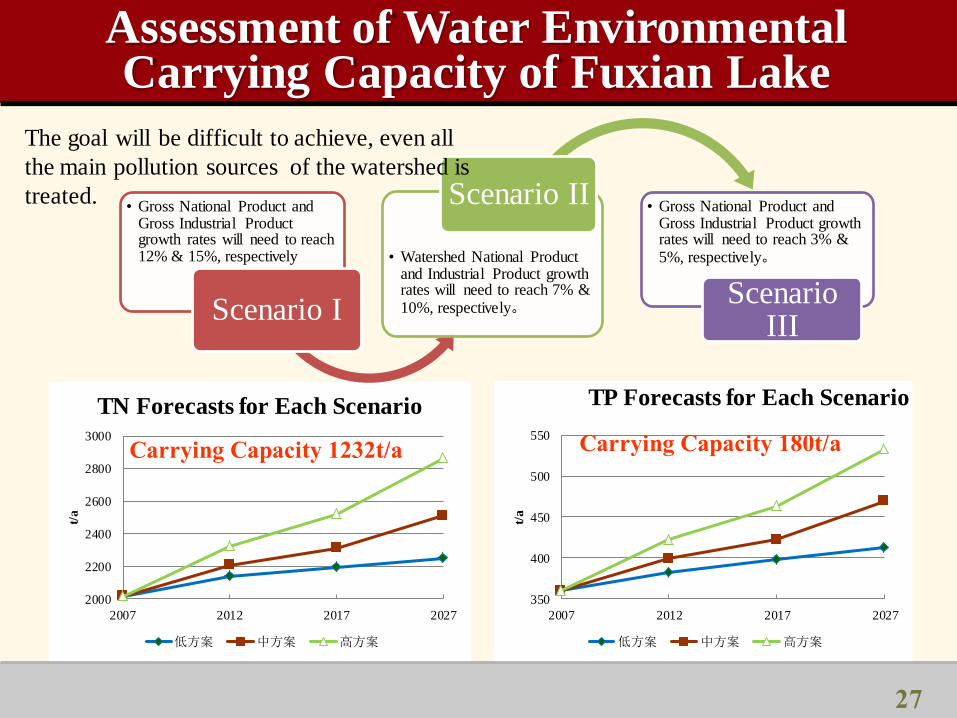
TN Forecasts for Each Scenario
低方案 中方案 高方案
350
400
450
500
550
2007 2012 2017 2027
t/a
TP Forecasts for Each Scenario
低方案 中方案 高方案
Carrying Capacity 180t/a Carrying Capacity 1232t/a
• Gross National Product and Gross Industrial Product growth rates will need to reach 12% & 15%, respectively
Scenario I
• Watershed National Product and Industrial Product growth rates will need to reach 7% & 10%, respectively。
Scenario II • Gross National Product and Gross Industrial Product growth rates will need to reach 3% & 5%, respectively。
Scenario III
The goal will be difficult to achieve, even all
the main pollution sources of the watershed is
treated.
Assessment of Water Environmental Carrying Capacity of Fuxian Lake
27
Ph.D. Dissertation
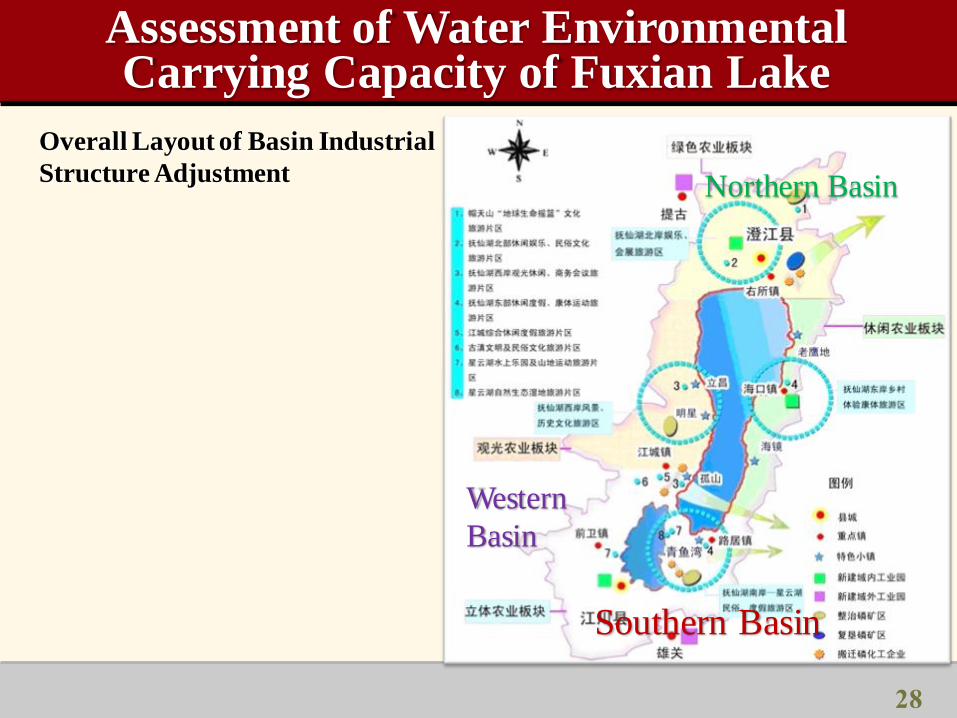
Northern Basin
Western
Basin
Southern Basin
Assessment of Water Environmental Carrying Capacity of Fuxian Lake
Overall Layout of Basin Industrial
Structure Adjustment
28
Ph.D. Dissertation 29
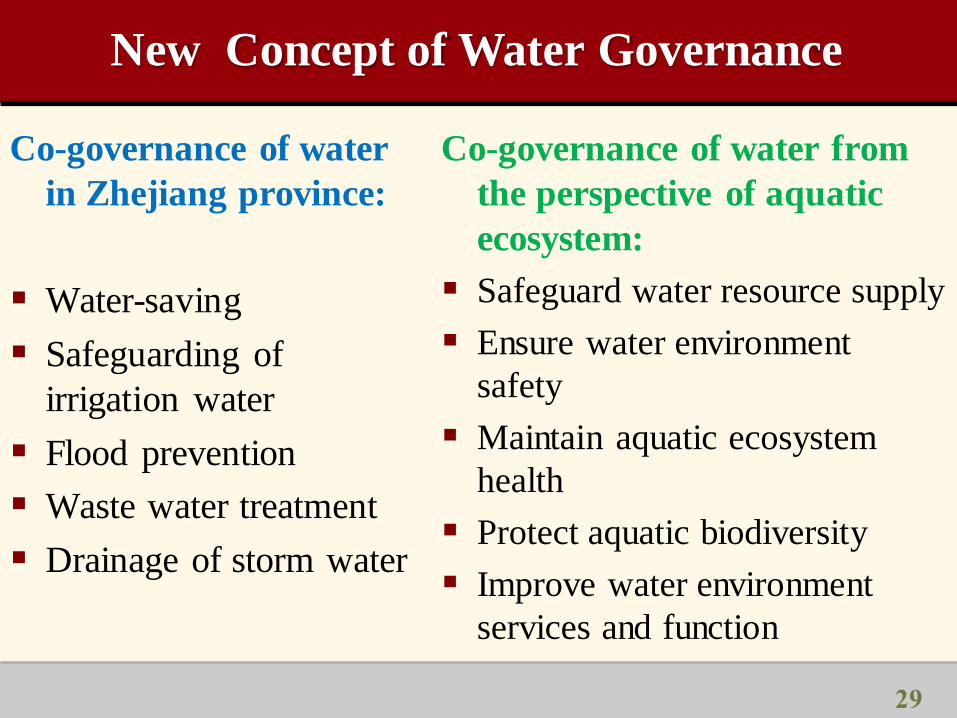
Co-governance of water
in Zhejiang province:
Water-saving
Safeguarding of
irrigation water
Flood prevention
Waste water treatment
Drainage of storm water
Co-governance of water from
the perspective of aquatic
ecosystem:
Safeguard water resource supply
Ensure water environment
safety
Maintain aquatic ecosystem
health
Protect aquatic biodiversity
Improve water environment
services and function
New Concept of Water Governance
Ph.D. Dissertation
Summary
The natural property of water environment should be
respected. The prerequisite for the utilization of water is
that the natural property of watersheds shouldn’t be
damaged. Socio-economic development shouldn’t be
obtained at the costs of environmental quality degradation,
the loss of watershed integrity and ecosystem health
deterioration.
Keep the harmony of human, nature and water
environment!
30