technology: then and now
DESCRIPTION
What Can We Do to Make Technology Work Michael Russell Damian Bebell, Laura O’Dwyer, David Reider, Helena Miranda, Jen Higins, Kathleen O’Connor, Tom Hoffmann, Jen Fontana and Lizzie O’Brien. Technology: Then and Now. 1907. 2002. Computers in K-5 Classrooms Today. - PowerPoint PPT PresentationTRANSCRIPT

What Can We Do to Make Technology Work
Michael RussellDamian Bebell, Laura O’Dwyer, David Reider, Helena
Miranda, Jen Higins, Kathleen O’Connor, Tom Hoffmann, Jen Fontana and Lizzie O’Brien

Technology: Then and Now

1907

2002

Computers in K-5 Classrooms Today

Typewriters in K-3 Classrooms in 1930

Use, Support and Effect of Instructional Technology (USEIT) Study
• What are students and teachers doing with technology?
• How do these uses vary across settings?
• What factors contribute to this variation?
• What effects do these uses have on teaching and learning?

USEIT Study
• 3+ Year Study
• 22 Massachusetts Districts
• Surveys– 112 District Leaders, 120 Principals,
4,000 teachers, 13,300 studentsLinked to each other
• Site Visits and 400+ Interviews
• Case Studies

Sample
4 Small Urban
5 Rural
13 Suburban
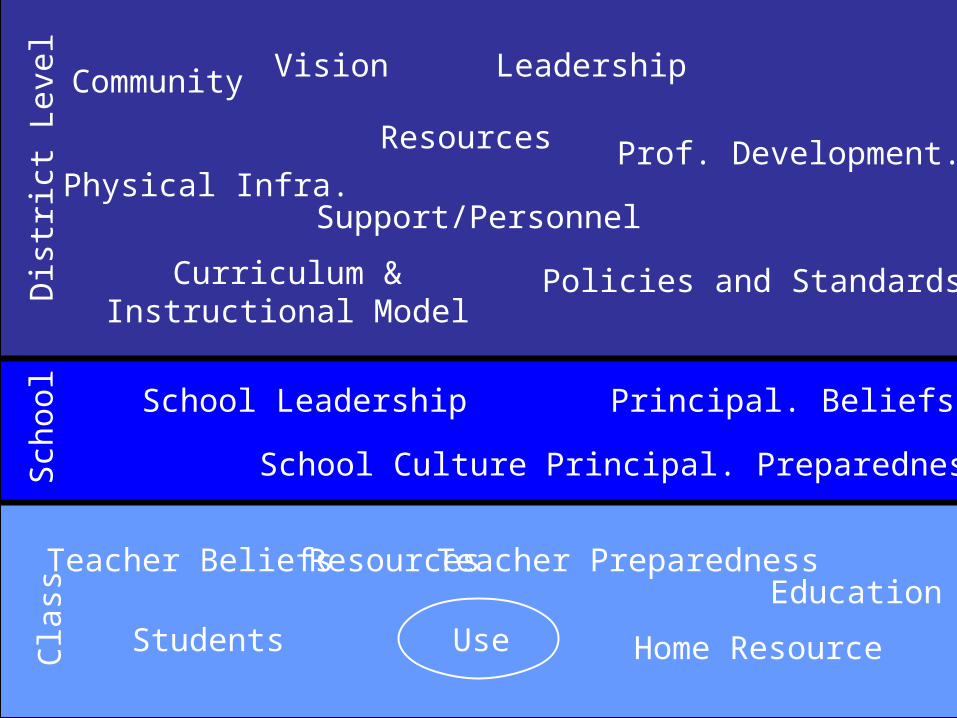
Vision
Resources
Curriculum &Instructional Model
Policies and Standards
Leadership
Physical Infra.Support/Personnel
Prof. Development.
CommunityD
istr
ict L
evel
Teacher Beliefs Teacher Preparedness
Home Resource
EducationResources
StudentsCla
ss
School Leadership Principal. Beliefs
Principal. PreparednessSchool CultureSch
ool
Use
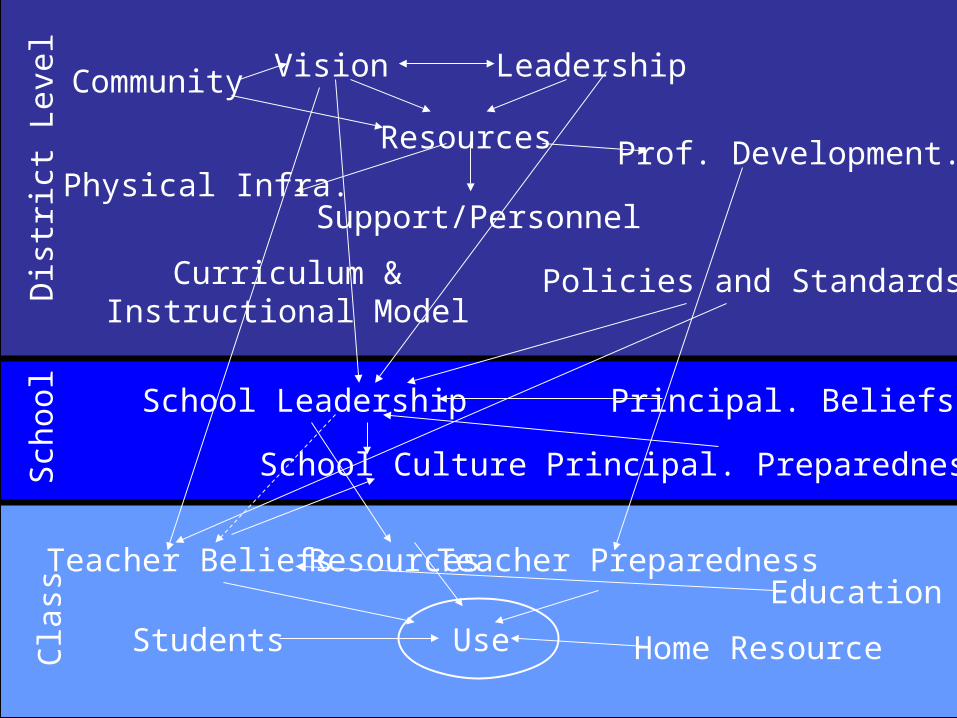
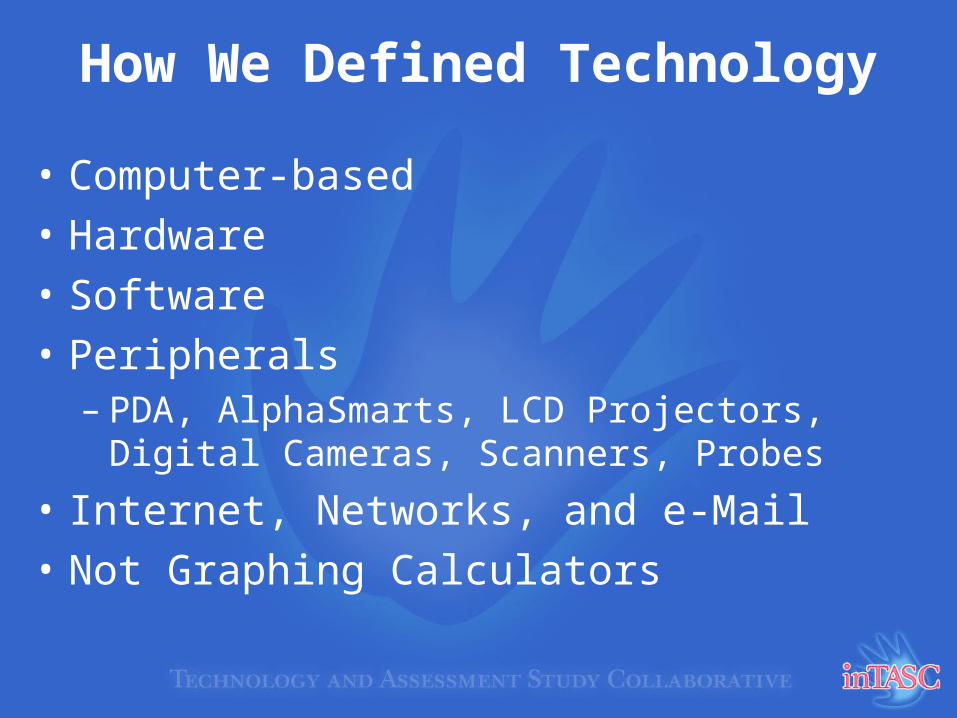
How We Defined Technology
• Computer-based
• Hardware
• Software
• Peripherals– PDA, AlphaSmarts, LCD Projectors, Digital
Cameras, Scanners, Probes
• Internet, Networks, and e-Mail
• Not Graphing Calculators

USEIT Study Implications for Leadership
• Students: Access and Use
• Teachers and Technology Use
• District Programs
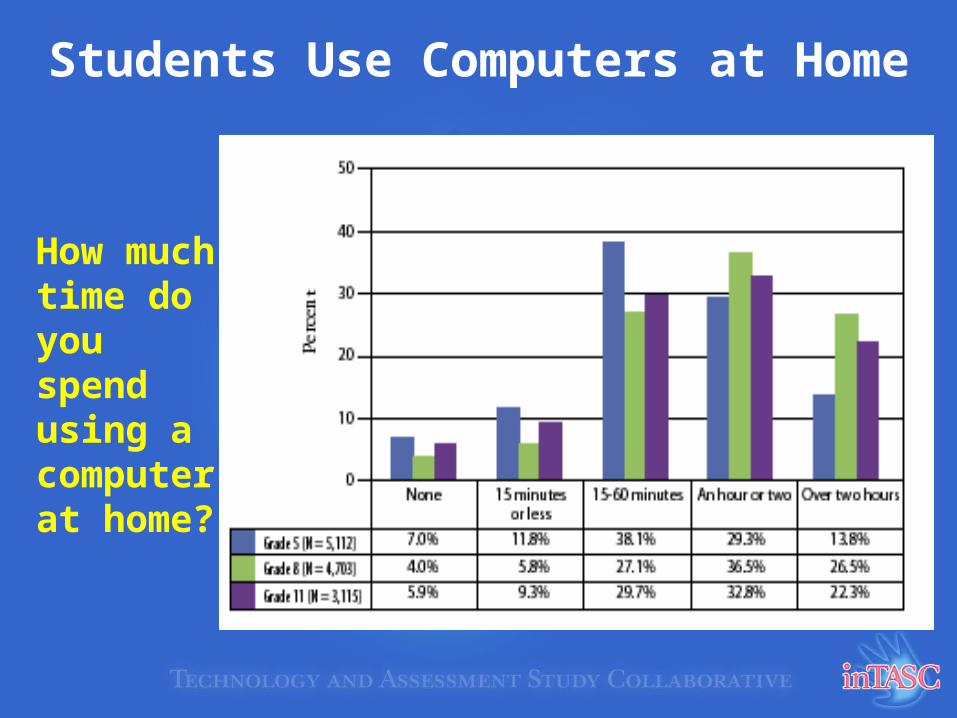
Students Use Computers at Home
How much time do you spend using a computer at home?

Students Use the Internet at HomeFor Fun and School
For Fun
For School

Students Write with Computers
How often do you use your home computer to write papers for school?

0% 10% 20% 30% 40%
Never
Couple oftimes a year
Once everycouple of
weeks
At least everyweek
Students Use Computers in School, But less than at Home
Grade 5

Students Use Computers Most Often in Science
0% 20% 40% 60% 80% 100%
Math
Social Studies
English
Science
Never
Couple of timesa year
Once everycouple of weeks
At least everyweek
Grade 8

0% 10% 20% 30% 40% 50% 60% 70% 80% 90% 100%
English
Social Studies
Science
Math
Never
Couple of timesa year
Once everycouple of weeks
At least everyweek
Students Use Computers Most Often in English
Grade 11

5th Graders Use Computers in School More than 8th and 11th Graders
0
10
20
30
40
50
Grade 5 (N = 5,111)
Grade 8 (N = 4,695)
Grade 11 (N = 3,205)
24.5% 39.6% 33.4% 2.2% 0.2%
43.6% 29.9% 24.4% 1.7% 0.4%
41.2% 30.8% 21.7% 5.4% 0.9%
None 15 minutesor less
15–60 minutes An hour or two Over two hours

Teachers Use Computers During Instruction Less than Students
0% 20% 40% 60% 80% 100%
Teachers UseWhen Teaching
Student Use inClass
Every Week
Once Every Couple Weeks
Couple Times/Year
Never
Every Week
Once Every Couple Weeks
Couple Times/Year
Never

What Explains the Differences?
AccessibilityOwnership
Commitment

The Special Case of Laptop Classrooms

Research Question:
• What happens when the student to computer ratio is increased to 1:1 in upper elementary classrooms?
• 4 classrooms given full student access to laptop computers
• “Status quo” is a rotating cart of laptop computers

Participants
3 classrooms
2 classrooms
Shared Laptops
2 classrooms
2 classrooms
1:1 Laptops
5th grade4th grade
9 Elementary classrooms

Data Collection
• Student Surveys (n=209)• Student Drawings(n=209)
– Think about the work you do in your classroom. In the space below, draw a picture of yourself writing in school.
• Teacher Surveys• Teacher Interviews• Next Fall: Look at relationship with student
achievement via 2003 MCAS
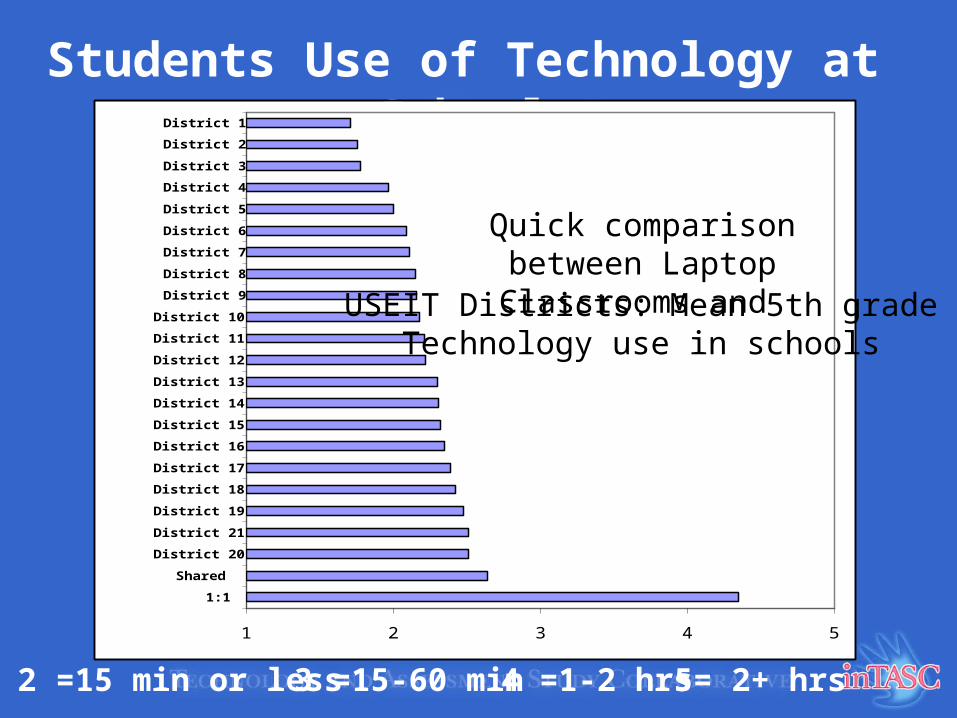
Students Use of Technology at School
1 2 3 4 5
Andover 1:1
Andover Shared
District 20
District 21
District 19
District 18
District 17
District 16
District 15
District 14
District 13
District 12
District 11
District 10
District 9
District 8
District 7
District 6
District 5
District 4
District 3
District 2
District 1
USEIT Districts: Mean 5th gradeTechnology use in schools
2 =15 min or less 3 =15-60 min 4 =1-2 hrs 5= 2+ hrs
Quick comparison between Laptop Classrooms and

Use of Technology in School - Students
1= Never 2=Once a month 3=Once a week 4=Every day
1 2 3 4
SocialStudies/History
Reading/LanguageArts
Science
MathSharedLaptop
1:1Laptop

Students Use of Technology in School
1 2 3 4
find information on the Internet
edit papers
write 1st drafts of papers
create a Powerpoint orHyperstudio presentation
work with spreadsheets
send and receive email SharedLaptop
1:1 Laptop
1= Never 2=Once a month 3=Once a week 4=Every day

Teacher’s Use of Technology
1 2 3 4
Reading/LanguageArts
SocialStudies/History
Math
Science
SharedLaptop
1:1 Laptop
1= Never 2=Once a month 3=Once a week 4=Every day

Students Home Use of Technology
• Robust access (connectivity) and use
• Difference in types of home use
2 3 4 5
play games
search the 'net for school
search the 'net for fun
write papers for school
chat/instant message
MP3s/music
SharedLaptop
1:1 Laptop
2=Almost Never 5=Every day

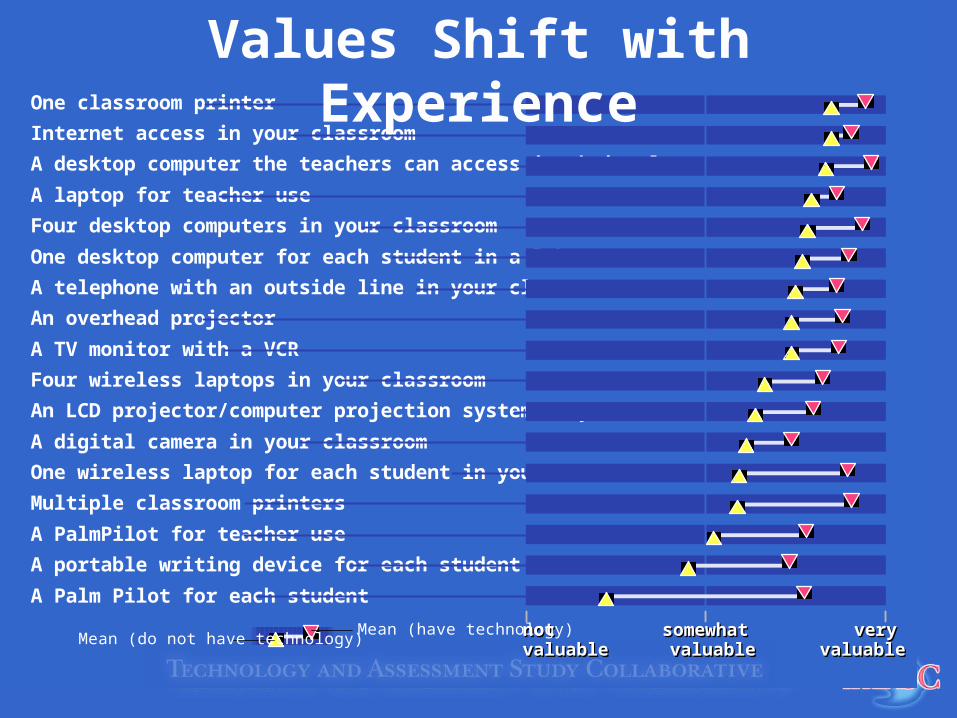
Teachers and Technology

Teacher’s VALUE Older Technologies
ValuableValuable
Desktop teachers can access in their classroomInternet access in classroom1 classroom printerTV monitor with VCR1 desktop for each student in a labOverhead projectorTelephone with outside line classroom4 desktops in your classroomLCD projector/computer projector in classroomLaptop for teacher useDigital camera in classroom4 wireless laptops in classroomMultiple classroom printers1 wireless laptop per student in classroomA PalmPilot for teacherA Portable writing device for each studentA Palm Pilot for each student
Not very valuableNot very valuable
aaaa
One classroom printer
Internet access in your classroom
A desktop computer the teachers can access in their classrooms
A laptop for teacher use
Four desktop computers in your classroom
One desktop computer for each student in a lab
A telephone with an outside line in your classroom
An overhead projector
A TV monitor with a VCR
Four wireless laptops in your classroom
An LCD projector/computer projection system in your classroom
A digital camera in your classroom
One wireless laptop for each student in your classroom
Multiple classroom printers
A PalmPilot for teacher use
A portable writing device for each student
A Palm Pilot for each student
notvaluablenotvaluable
veryvaluable
somewhatvaluable
veryvaluable
somewhatvaluable
Mean (have technology)Mean (do not have technology)
Values Shift with Experience

Access Is Major Obstacle
Major ObstacleMajor ObstacleNot an ObstacleNot an Obstacle
lack of computers in the classroomnot having enough computers for all of your studentslack of practiceamount of course materialdifficulty in accessing computers in labs and/or libraryunpredictable computersinsufficient softwareinsufficient supportoutdated computers/swhaving too many students in your classteachers' lack of inputlack of student's keyboarding skillsunavailability of softwaredifficulties connecting/school tech specialistlack of leadership related to techslow internetlack of students' skills/computernot sure/tech relevantnot knowing how the district/tech usewide variety of computer skills/studentsincreased speed/impr. techdifferences between the computers/home/schoolwide variety of academic skills/studentslack of flexibility in deciding how to you use computer

Teachers Have Students Use Computers in Variety of Ways
Work individually on school work using computers
Do project/paper using a computer outside of class
Research/work using the internet or CD-ROM
Work in groups/using computers
Use computer or portable writing device for writing
Use computer to play educational games
Use computer to play games for fun
Use computer to solve problems
Learn keyboarding skills
Present information to the class/ using a computer
Use spreadsheet/db to record, explore or analyze data
Use email to consult experts
Use computer to communicate with students in other schools
Use probes attached to computers
Severaltimes amonth
Severaltimes a
year
Once ortwice a
year
Never Severaltimes amonth
Severaltimes a
year
Once ortwice a
year
Never

Teachers Use Computers for a Variety of Purposes
Severaltimes amonth
Severaltimes aweek
Severaltimes aweek
Severaltimes a
year
Once ortwice a
year
Never Severaltimes amonth
Severaltimes a
year
Once ortwice a
year
Never
Make handouts for students using a computer
Create a test, quiz or assignment using a computer
Email teachers in your school
Perform research and lesson planning using the internet
Email communication with school and district administration
Email students' parents
Adapt activity to students' individual needs using a computer
Record student grades using a computer
Use a computer to deliver instruction to your class
Create web-quests or build the internet into a lesson
Prepare or maintain IEPs using a computer
Create and maintain web pages

1. Delivering Instruction
2. Teacher-directed Student Use
3. Teacher-directed Student Technology Product
4. Preparing for Instruction
5. Communicating via E-mail
6. Recording Grades
7. Accommodating Lessons
What Do We Mean by Technology Use?

Relative teacher technology use
aa
NeverNever Once ortwice a
year
Once ortwice a
year
Severaltimes amonth
Severaltimes amonth
Severaltimes a
year
Severaltimes a
year
Severaltimes aweek
Severaltimes aweek
Communicating via Email
Preparation for Instruction
Directed Student Use
Recording Grades
Delivering Instruction
Accommodating Lessons
Teacher-directed Student Technology Products

Correlation of Technology Uses
Accommodation Use
Email Use
Instructional Use
Preparation Use
Student Use
Student Product
Grading
1.001.00
1.00
0.44
1.00
1.00
0.46 1.00
1.00
Accom- Email Instruc- Prepa- Student Student Gradingmodation Use tional ration Use Product Use Use Use

Correlation of Technology Uses
Accommodation Use
Email Use
Instructional Use
Preparation Use
Student Use
Student Product
Grading
1.00
0.36
1.00
0.36
1.00
0.44
0.34
1.00
0.33
1.00
0.46 1.00
1.00
Accom- Email Instruc- Prepa- Student Student Gradingmodation Use tional ration Use Product Use Use Use

Correlation of Technology Uses
Accommodation Use
Email Use
Instructional Use
Preparation Use
Student Use
Student Product
Grading
1.00
0.25
0.22
0.29
0.23
0.09
1.00
0.23
0.21
0.17
0.16
1.00
0.25
0.22
1.00
0.29
0.24
1.00
0.04
1.00
0.24 1.00
Accom- Email Instruc- Prepa- Student Student Gradingmodation Use tional ration Use Product Use Use Use

Promoting Teacher Uses
• Be specific about type of use
• Design support and professional development targeted at a Specific Use
• Consider impacts of use separately

Factors Related to Teacher Technology Uses

Vision
Resources
Curriculum &Instructional Model
Policies and Standards
Leadership
Physical Infra.Support/Personnel
Prof. Development.
CommunityD
istr
ict L
evel
Teacher Beliefs Teacher Preparedness
Home Resource
EducationResources
StudentsCla
ss
School Leadership Principal. Beliefs
Principal. PreparednessSchool CultureSch
ool
Use

•29 Independent variable scales developed through exploratory analysis and the literature•These include measures of:
–School/District Vision–Teacher Pedagogy–Teacher Philosophy–Leadership–School culture–Technology support–Technology access and distribution–Professional Development
+ demographic variables
Factors Influencing Teacher Technology Use

Teacher Use of Technology for Delivery

aaaa
Coefficient p-value
Teacher Level Model
Line item funding for technology 0.046Teachers report on principals' emphasis on technology
(school mean) 0.042
Principals' discretion related to technology decisions 0.023
Teachers report pressure to use technology (school mean) 0.025
Teacher confidence using technology 0.000
Teacher believes that computers help students 0.000
Student ease of access to technology at home (school mean) 0.637
Teacher believes in student-centered instruction 0.002
Principals' professional use of email with teachers 0.005
Relative emphasis on technology-related professional development 0.885
Issues with students obstruct technology use 0.278
Issues with the quality of technology obstruct use 0.140
Variety of available technology-related professional development 0.430
Problems incorporating technology into the curriculum obstruct use 0.003
Teachers report that poor professional development is an obstacle (school mean)
0.116
Teachers report that access is an obstacle (school mean) 0.020
negativeeffect
positiveeffect
School/District Level Model
0.0 0.3 0.6-0.3
Teacher Use of Technology for Delivery

Teacher-directed Student Use of Technology During Class Time

aaaa
Coefficient p-value
Teacher Level Model
negativeeffect
positiveeffectSchool/District Level Model
Teacher believes in student-centered instruction 0.022
Issues with students obstruct technology use 0.597
Issues with the quality of technology obstruct use 0.697
Problems incorporating technology in the curriculum obstruct use 0.000
Teacher believes that computers help students 0.000
Teacher confidence using technology 0.010
Student ease of access to technology at home (school mean) 0.481
Teachers report that access is an obstacle (school mean) 0.059
Teachers report on principals' emphasis on technology (school mean) 0.000
District leaders discuss technology 0.069
Relative emphasis on technology-related professional development 0.832
Variety of available technology-related professional development 0.046
Amount of restrictive policies for using technology 0.048
0.0 0.3 0.6-0.3
Teacher-directed Student Use of Technology During Class Time

Teachers Direct Students toCreate Products Using
Technology

aaaa
Coefficient p-value
Teacher Level Model
negativeeffect
positiveeffectSchool/District Level Model
Student ease of access to technology at home (school mean) 0.005
Teachers report on principals' emphasis on technology (school mean) 0.068
Teachers report pressure to use technology (school mean) 0.014
Variety of available technology-related professional development 0.025
Evaluations consider technology 0.091
Amount of restrictive policies for using technology 0.519
Relative emphasis on technology-related professional development 0.785
Teacher believes that computers help students 0.000
Teacher believes in student-centered instruction 0.000
Teacher confidence using technology 0.011
Issues with students obstruct technology use 0.605
Issues with the quality of technology obstruct use 0.406
Problems incorporating technology into the curriculum obstruct use 0.002
0.0 0.3 0.6-0.3
Teachers Direct Students to Create Products Using Technology

Teachers Use Technology for Preparation

aaaa
Coefficient p-value
Teacher Level Model
negativeeffect
positiveeffectSchool/District Level Model
Teacher confidence using technology 0.000
Teacher believes that computers help students 0.000
Teacher believes in student-centered instruction 0.011
Issues with the quality of technology obstructs use 0.042
Teacher believes in teacher-centered instruction 0.001
Student ease of access to technology at home (school mean) 0.015
Teachers report on principals' emphasis on technology (school mean) 0.014
District leaders discuss technology 0.001
Teachers report that poor professional development is an obstacle(school mean) 0.445
Variety of available technology-related professional development 0.253
Relative emphasis on technology-related professional development 0.096
Teachers report that technology quality is an obstacle (school mean) 0.010
0.0 0.3 0.6-0.3
Teachers Use Technology for Preparation

Lessons
• There is no single set of factors that affects all four types of teacher use of technology
• This is particularly true at the school level – different school/district policies affect different uses

Newer versus Tenured Teachers
• New Teachers: – grew up with computers– are more comfortable with computers– will use computers more for instruction
• Sample divided into three groups:– 1-5 years– 6-15 years– more than 15 years
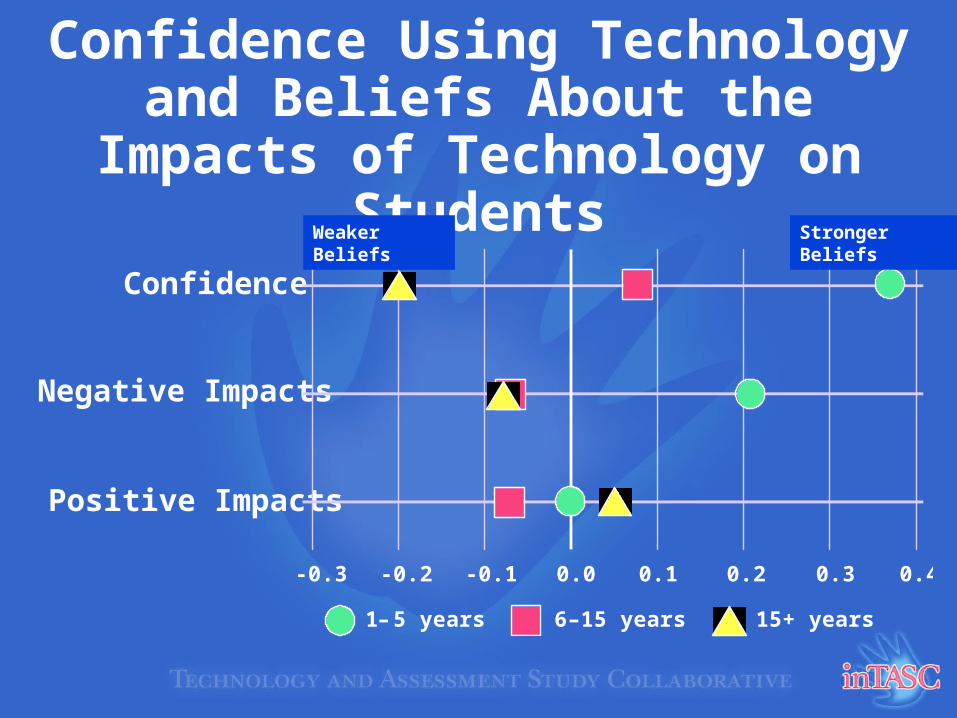
Confidence Using Technology and Beliefs About the Impacts of
Technology on Students
aa
Confidence
Positive Impacts
Negative Impacts
lower use
6–15 years 15+ years1– 5 years
higher use
0.0 0.1 0.2 0.3 0.4-0.1-0.2-0.3
Weaker Beliefs
Stronger Beliefs

Pedagogical Beliefs About Teacher-Directed and Student-
Centered Instructional Practices
aa
Teacher-directed
Student-centered
lower use
6–15 years 15+ years1– 5 years
higher use
0.0 0.1 0.2 0.3-0.1-0.2-0.3
Weaker Beliefs
Stronger Beliefs
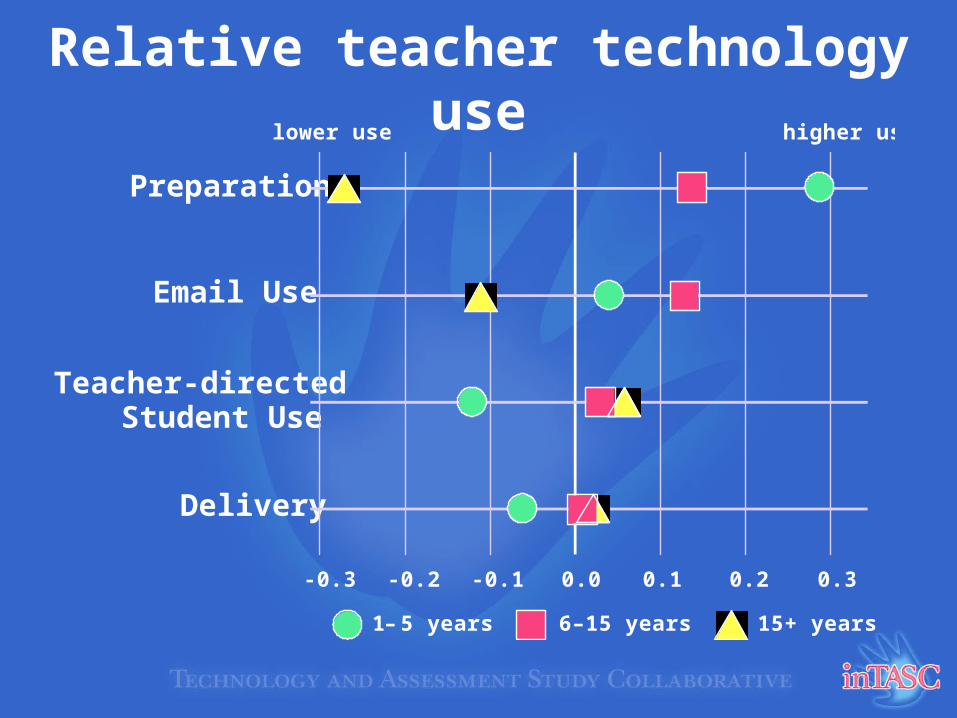
Relative teacher technology use
aa
Preparation
Email Use
Teacher-directedStudent Use
Delivery
lower use
6–15 years 15+ years1– 5 years
higher use
0.0 0.1 0.2 0.3-0.1-0.2-0.3

Teacher Preparation Programs Need to Focus on Integration
Direct Support for New Teachers

Site Visit Analyses

13 Factors Related to Success·Leadership·Vision·Goals·Technology Plan·Funding·Resources·Community·Professional Development·Teacher Support·External Programs·Collaboration·Obstacles (Fewer)·Technology Standards

Resources and Support
Districts with strong technology programs have:• line item funding • a technology plan that includes equipment and
support personnel• school integration specialists• focused and evolving PD • diversified and strategic technology support

Leadership and Vision
Districts with strong district-wide technology leadership have:
• higher levels of community involvement
• district leaders who emphasize technology and who have clear technology visions
• and educational goals that are supported by technology

Correlation between components of District Technology Programs and Student Use in School
Mean student use in 5th grade
Mean student use in 8th grade
Mean student use in 11th grade
Support .382 .458 .373
Leadership .233 .090 .437

Tale of Two Districts
• Early 80’s in Libraries • ‘65 Math Chair
High and Robust Use Low and Variable Use
• Word processing and science • Programming
• Slow acquisition/purchases • Borrowed and donated
• ‘90 focus on poor software • ‘90 business courses
• Initial PD on comfort and knowledge of machine
• K-5 Coordinator separate from MS and HS
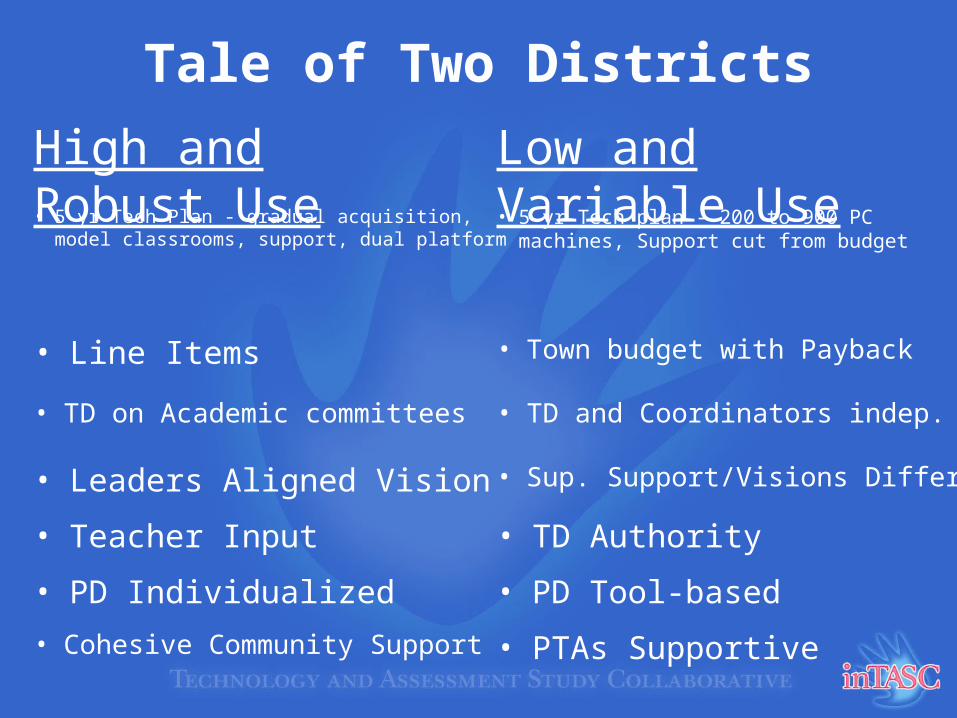
Tale of Two Districts
High and Robust Use Low and Variable Use• 5 yr Tech Plan - gradual acquisition, model
classrooms, support, dual platform• 5 yr Tech plan - 200 to 900 PC
machines, Support cut from budget
• Line Items • Town budget with Payback
• TD on Academic committees • TD and Coordinators indep.
• Leaders Aligned Vision • Sup. Support/Visions Differ
• Cohesive Community Support• PTAs Supportive
• Teacher Input • TD Authority
• PD Individualized • PD Tool-based

Initial Patterns and Observations
• Educational Technology is Complex– Many Types, Beliefs, and Uses– Presentation, Preparation, Record Keeping,
Communication, Tailoring, Student Use– Home versus School– Variation within and across schools– What explains variation --- School and District
Leadership and Programs

Key Factors Affecting Elementary Classroom Use
• Home Use, Skills, and Beliefs about tech
• Teacher’s Pedagogical beliefs and practices
• Mean Student Technology Skill Level
• Teacher’s Beliefs about Technology
• Principals beliefs about technology
• Principals Emphasis on technology and Pressure to use Technology

What Leaders Do
• Showcase to community and school board
• Vision and expectations
• Pockets of innovation
• Professional Development - teams and extended time

Resources
• www.intasc.org
• inTASC Library
• JTLA (jtla.org)