technical compendium: descriptive agricultural statistics...
TRANSCRIPT

Technical Compendium: Descriptive Agricultural Statistics and Analysis for Zambia
by
Solomon Tembo and Nicholas Sitko
Working Paper 76
August 2013 Indaba Agricultural Policy Research Institute (IAPRI) Lusaka, Zambia Downloadable at: http://www.iapri.org.zm/index.php?
and http://www.aec.msu.edu/fs2/zambia/index.htm

ii
Technical Compendium: Descriptive Agricultural Statistics and Analysis for Zambia
by
Solomon Tembo and Nicholas Sitko
August 2013
Tembo is senior research associate and Sitko is research fellow at the Indaba Agricultural Policy Research Institute (IAPRI), Lusaka.

iii
ACKNOWLEDGEMENTS
The Indaba Agricultural Policy Research Institute is a non-profit company limited by guarantee and collaboratively works with public and private stakeholders. IAPRI exists to carry out agricultural policy research and outreach, serving the agricultural sector in Zambia so as to contribute to sustainable pro-poor agricultural development. The authors are grateful to Auckland Kuteya and Mwamba Chishimba for helping to obtain data on variables used in the analysis. They also wish to thank Patricia Johannes for formatting and editorial assistance. The authors acknowledge financial support from the United States Agency for International Development (USAID) Zambia Mission and from the Bill and Melinda Gates Foundation under the Guiding Investments in Sustainable Agricultural Intensification in Africa Program. Any views expressed or remaining errors are solely the responsibility of the authors. Comments and questions should be directed to: The Executive Director Indaba Agricultural Policy Research Institute 26A Middleway, Kabulonga, Lusaka. Telephone: +260 211 261194; Telefax +260 211 261199; Email: [email protected], [email protected]

iv
EXECUTIVE SUMMARY
Background This technical compendium was developed to serve as a reference document for development organizations, researchers, government officials, and cooperating partners working in Zambia. It uses nationally representative survey data to provide descriptive trends and analysis relevant to the agricultural sector. It is also specifically targeted for organizations tasked with implementing programs associated with USAID’s Feed the Future (FtF) initiative. As such, a special section is dedicated to Eastern Province, with data disaggregation based on FtF requirements. Problem Statement Zambia, like much of the southern Africa region, remains vulnerable to unstable food prices and food insecurity, despite competitive advantages such as abundant agricultural land and a generally favorable climate for food production. The issues around food security and agriculture in southern Africa are dynamic, complex, uncertain and difficult to address. High population growth, rapid urbanization, and stagnant agricultural production are contributing to an emerging structural deficit of food crops in the region. Finding ways of effectively coping with this emerging food deficit is critical for fostering economic growth, reducing poverty, and enhancing food/nutrition security for the people of southern Africa. Addressing this challenge requires placing agriculture- and the associated processes of production, trade, processing, and consumption - at the forefront of any economic development strategy for the region. Zambia is in a unique position to not only leverage agriculture as an engine for poverty reduction and improved nutrition, but to become the breadbasket of southern Africa. The country is endowed with an abundance of fertile land, water, and a generally favorable climate for agricultural production. Zambia's small- and medium-scales farming households have in the past 5 years recorded surplus maize harvests, including consecutive record-breaking harvests, between 2009/10 and 2011/12 agricultural seasons. This has largely been due to favorable weather combined with generous subsidies for maize production and marketing. In addition, the country is experiencing high economic growth which can be largely attributed to high global copper prices and increased investment in construction. Despite these unique endowments, positive economic growth, and surplus maize production, poverty rates in the country remain high. While the poverty rates in urban areas have reduce to under 30%, poverty in rural Zambia have remained stubbornly high, at 80% of the population, and incidences of stunting, malnutrition, and wasting continue to disproportionately affect rural Zambians. Addressing these issues requires solid empirical evidence to guide investments and identify viable development strategies. The Technical Compendium aims to provide a common foundation of data and analysis to be used by the diverse stakeholders involved in Zambia’s agricultural sector. Data The data presented in this technical compendium is derived from a variety of sources. Data on household production come primarily from two nationally representative surveys: 1. the

v
Crop Forecast Survey (CFS) conducted annually by the Ministry of Agriculture and Livestock (MAL); and 2. the Supplemental Survey (SS) to the Post-Harvest Survey (PHS), conducted in 2001, 2004, and 2008 by MAL and the Central Statistics Office (CSO). In 2012 the SS was extended to become the Rural Agricultural Livelihoods Survey (RALS) conducted by the Indaba Agricultural Policy Research Institute (IAPRI) with CSO. The 2001, 2004, and 2008 SS are nationally representative household panel surveys. Nutritional and health data come from the Living Conditions Monitoring Survey (LCMS) carried out by CSO. Other important data sources include Food and Agricultural Organization Online Statistical Database (FAOSTAT), the CSO PHS, and the Food Security Research Project (FSRP) Urban Consumption Survey. Key Findings
• Zambia has a high population growth rate and is highly urbanized. About 40% of the country's population lives in urban areas. These, coupled with other factors contribute to increased pressure on Zambia’s food, health care, sanitation, and education systems, increasing threats to levels of food insecurity, malnutrition, and poverty, particularly for the poorest and most vulnerable segments of the population.
• The overall poverty rate in Zambia has declined over time. However, poverty rates in rural Zambia have remained very high, with 80% of the rural population living in poverty.
• The country has continued to experience chronic food and nutrition security problems. Stunting rates in Zambia stand at 46%. Stunting remains the most common nutritional disorder affecting under five years children in Zambia, above the Sub-Saharan Africa average of 42%.
• Zambia’s economy has grown steadily in real terms since 2001. The Gross Domestic Product (GDP) in Zambia grew by 7.3% in 2012 from the previous year. However the percent contribution of the agricultural sector to GDP has declined from 16% in 2001 to 12.6% in 2012.
• Cropping characteristics: Small-scale farming systems in Zambia are overwhelmingly dominated by a single crop: maize. In 2011/12, 86% of all smallholders grew maize. Cassava cultivation, the second most important staple food crop, is geographic confined to the north and northwestern parts of Zambia. Groundnuts, the second most widely cultivated crop in Zambia and important source of protein in Zambian diets, are frequently intercropped with maize. In Zambia, groundnuts are often considered a women’s crop due to their importance for home consumption.
• Yields: Yields for all crops in Zambia are well below global averages. National yields are generally low. The top 10% of smallholders achieve yields that are one to nearly four metric tons (mt) more than the average depending on the crop. This suggests the potential for yield improvements in Zambia.
• Input use: While input use has trended upward since 2001, 45% of Zambia farmers still do not use fertilizer on their fields, while more than 40% do not use hybrid maize seeds.
• Land: Despite a relatively low population density, growth in the number of rural households contributes to increasing land fragmentation and shrinking land size holding in Zambia. While the mean land size holding in Zambia is 3.27 hectares, three quarters of the rural population controls on average 2.5 hectares of land or less. This is indicative of significant differentiation within the smallholder sector.

vi
• Despite the high prevalence of maize cultivation in rural Zambia, a considerable proportion of the small- and medium-scale agricultural households are net buyers of maize. In a record maize production year, 28% of rural households remain net buyers of maize. These farmers tend to control smaller farm sizes and tend to be located in more marginal agro-ecological zones.
• Government spending on agriculture to the total government budget rose from 12.2% in 2007 to 13.6% in 2011 which is above the spending goal agreed upon under the 2003 Maputo declaration. However, procurement and distribution of maize through the Food Reserve Agency (FRA) and input subsidies through the Fertilizer Support Program/Farmer Input Support Program (FSP/FISP) account for over 80% of the total agricultural budget.

vii
CONTENTS ACKNOWLEDGEMENTS ..................................................................................................... iii EXECUTIVE SUMMARY ...................................................................................................... iv
LIST OF TABLES ................................................................................................................. viii LIST OF MAPS ..................................................................................................................... xiii LIST OF FIGURES ................................................................................................................ xiv
ACRONYMS ........................................................................................................................... xv
1. Macro-Economic Trends ....................................................................................................... 1 1.1. The Economic Indicators ................................................................................................ 1 1.2. Agriculture’s Place in Zambia’s Economy ..................................................................... 2
2. Demography and Employment .............................................................................................. 5 2.1. Population ....................................................................................................................... 5 2.2. Employment .................................................................................................................... 7
2.2.1. Labour Force Participation Rate .............................................................................. 8 2.2.2. Unemployment Rate ................................................................................................ 8 2.2.3. Youth Unemployment Rate ..................................................................................... 8
3. Poverty and Nutrition ........................................................................................................... 11
4. Public Spending and Allocation to Agriculture ................................................................... 14
5. Agricultural Trends and Indicators ...................................................................................... 17 5.1. Trends in Agricultural Production ................................................................................ 17 5.2. Input Use, Access and Farming Practices ..................................................................... 22 5.3. Value of Production, Sales and Trade Trends .............................................................. 24 5.4. Crop Diversity ............................................................................................................... 27 5.5. Gross Margins ............................................................................................................... 28
6. Eastern Province .................................................................................................................. 30 6.1. Population ..................................................................................................................... 30 6.2. Poverty and Nutrition Data ........................................................................................... 31 6.3. Cropping and Production Data...................................................................................... 34 6.4. Tillage Methods ............................................................................................................ 40 6.5. Input Use and Access .................................................................................................... 42 6.6. Crop Sales Data............................................................................................................. 46 6.7. Gross Margins ............................................................................................................... 48 6.8. Crop Diversification...................................................................................................... 49
Appendix I. Eastern Province .................................................................................................. 51
Appendix II. Zambia ................................................................................................................ 61
REFERENCES ........................................................................................................................ 82

viii
LIST OF TABLES
Table Page 1. Population by Province, Region, and Sex, Zambia, 2010 ..................................................... 5 2. Distribution of Per capita Income among Smallholder Households, 2011/12..................... 12 3. Prevalence of Poverty: Percent of Smallholder Households Living on Per capita Income
of Less than $1.25/day (2005 ppp Exchange Rate), Province, 2011 ................................ 12 4. FISP Fertilizer Received (2010/11 Crop Season) and Expected Maize Sales, 2011, by Farm
Size Category ................................................................................................................... 16 5. Percent Households Planting Crop, Zambia, 2007 to 2012 ................................................. 17 6. Area Cultivated (ha), Crop, Zambia 2000 to 2012 .............................................................. 17 7. Production in Tons, Crop, Zambia 2007 to 2012................................................................. 18 8. Total yield (kg/HH), Crop, Zambia 2007 to 2012 ............................................................... 18 9. Smallholder Agricultural Households and Maize Area Planted, Quantity Harvested, and
Yields, 2000/01-2011/12 .................................................................................................. 19 10. Holding Size (ha) per Household, Per capita, 2008/09-2011/12, Zambia ......................... 20 11. Percent Households by Crop Grown, Seed Type, Zambia, 2012 ...................................... 23 12. Percent Area under Maize by Seed Type and Year, 2002-2011, Zambia .......................... 23 13. The Simpsons Index by Province Zambia, 2004 -2012 ..................................................... 27 14. Simpson’s Crop Diversification Index by Province, Zambia, 2012 .................................. 28 15. Mean Gross Margins ($/ha) by Crop by Province, Zambia, 2012 ..................................... 29 16. Population by Province, District and Sex, Rural/Urban, Eastern Province, 2010 ............. 30 17 Percent Households, by Gendered Household Type, and Sex of Head Eastern
Province, 2012 .................................................................................................................. 31 18. Percent Contribution to Total Gross Income, Eastern Province, 2012 .............................. 32 19. Percent Contribution to Total Gross Income by GHT, Poverty Sex of Head, FTF
Zone, 2011 ........................................................................................................................ 32 20. Average Per capita Income among Smallholder Households – overall and by GHT for
Zambia and the FTF ZI, 2011/12 ..................................................................................... 33 21. Prevalence of Poverty: Percent of Smallholder Households Living on Per capita
Income of Less than $1.25/day, Eastern Province, 2012 ................................................. 34 22. Land Use by Type, Zambia, Eastern Province, FTF Zone, 2011 ..................................... 35 23. Average Land Access and Use (ha) by Type, Gendered HH Type and Poverty, FTF
Zone, 2011 ........................................................................................................................ 35 24. Average Production (MT) per Household by Crop, GHT, Poverty, FTF Zone, 2012...... 35 25. Average Area Cultivated (ha) per Household by Crop, GHT, Poverty, FTF Zone,
2012 .................................................................................................................................. 36 26. Average Yield (MT/ha) by Crop, GHT, Poverty, FTF Zone, 2012 .................................. 36 27. Agricultural Households and Maize Area Planted, Quantity Harvested, and Yields,
Eastern Province, 2000/01-2011/12 ................................................................................. 37 28. Land Use by Sex of Decision Maker, GHT, FTF Zone, 2011 .......................................... 38 29. Intra-household Decision Making by Sex within Male and Female Gender Household
Type: Percent Distribution of Land Use by Gendered HH Type, Sex of Decision Maker, FtF Zone, 2011 ................................................................................................................. 38
30. Intra-household Decision Making by Sex within Male and Female Gender Household Type: Percent Distribution of Decision to Sell by Sex of Decision Maker for Male and Female GHT, FtF Zone, 2011 .......................................................................................... 39
31. Intra-household Decision Making by Sex within Male and Female Gender Household Type: Percent Distribution of Decision Maker by Livestock, FtF Zone, 2011 ................ 39
32. Intra-household Decision Making by Sex within Male and Female Gender Household Type: Average Number Sold by Decision Maker by Livestock, FtF Zone, 2011 ........... 40

ix
33. Intra-household Decision Making by Sex within Male and Female Gender Household Type: Average Income from Sales (ZMK) by Revenue Use Decision Maker by Livestock, FtF Zone, 2011 ............................................................................................... 40
34. Percent Households Using Tillage Method by Crop, FTF Zone (Minus Chadiza, Mambwe), Eastern Province, 2011 .................................................................................. 41
35. Percent Households Using Tillage Method by District, Eastern Province, 2012 ............. 41 36. Percent of Households by Gendered Type and Poverty by Tillage Method, FTF
Zone, 2012 ........................................................................................................................ 42 37. Percent of Households by Gendered Type and Poverty by Tillage Method, FTF
Zone, 2012 ........................................................................................................................ 42 38. Percent Households by Crop by Seed Type, Eastern Province, 2010/11 ......................... 43 39. Percent Households that Planted Maize by Seed Type, Year, Eastern Province 2002-
2011 .................................................................................................................................. 43 40. Percent Households by Maize Seed Type, Districts, Eastern Province, 2010/11 ............. 44 41. Seed Use by Type, Crop, Sex of Decision Maker, FtF Zone, 2011 .................................. 44 42. Number of Households Reporting Source of Seed by Crop, FTF Zone ........................... 44 43. Percent Households that Used Fertilizer for Maize, GHT, Poverty, FtF Zone, District,
2012 .................................................................................................................................. 45 44. Mean Total Fertilizer Use per Household (kg/HH), by Gendered hhd Status, Poverty
and Sex of Head, FTF Zone, Eastern Province, 2012 ...................................................... 45 45. Average Retention Rate of Maize Harvested by GHT, Sex of Head, Poverty Status,
FtF Zone, 2011 ................................................................................................................. 46 46. Percent Distribution of Buyers by Crop, Eastern Province, 2011 .................................... 47 47. Percent Households by Crop and Decision Maker (whether or not to sell), FTF Zone
Eastern Province, 2012 ..................................................................................................... 47 48. Gross Margins ($/ha) by Crop by District, Eastern Province, 2012 ................................. 48 49. Gross Margins by Crop by Gendered Household Type, Poverty Status, and Sex of
Head, FTF Zone, Eastern Province, 2012 (US$/ha) ......................................................... 48 50. Percent Distribution of Households by FTF Crops by District, Eastern Province, 2012 . 49 51. The Simpsons Index by District, Eastern Province, 2012 ................................................ 50 52. The Simpsons Index by Gendered Type, Poverty Status, Sex of Head, FTF Zone,
2012 .................................................................................................................................. 50
APPENDIX I. EASTERN PROVINCE LIST OF TABLES
TABLE PAGE 1. Mean Total Fertilizer Use per Household (Kg/HH), by Crop, District, Eastern Province,
2012 ......................................................................................................................................... 51 2. Mean Total Fertilizer Use per Household (Kg/HH), by Gendered Hhd Status, Poverty and Sex
of Head, Eastern Province, 2012 ............................................................................................. 51 3. Average Yield (MT/Ha) by Crop, District Eastern Province, 2012 ........................................... 51 4. Area Cultivated (ha), Percentage by Crop, District Eastern Province, 2012 ............................. 52 5. Average Area Cultivated (Ha) by Crop, District Eastern Province, 2012 ................................. 52 6. Quantity Harvested (MT) by Crop, District Eastern Province, 2012 ......................................... 52 7. Average Quantity Harvested (MT) By A Household by Crop, Eastern Province, 2012 ........... 53 8. Percent of Households by District by Tillage Method, 2012 ..................................................... 53 9. Percent Households That Sold By Crop, Zambia, Eastern Province and Ftf Zone, 2011 ......... 53

x
10. Percent Households that Sold Maize, by Gendered Type, Poverty Status, and Sex of Head, Ftf Zone, 2011 ......................................................................................................................... 53
11. Average HH Value of Sales (ZMK), Actual Price, of Various Crops by District, Eastern Province, 2010/11 .................................................................................................................... 54
12. Average Value of Sales (ZMK), Actual Price, of Various Crops by Gendered HH Type and Poverty Status, Eastern Province, 2012 ............................................................................ 54
13. Percent Distribution of Land Use by Gendered HH Type, Sex of Decision Maker, Eastern Province, 2011 ......................................................................................................................... 54
14. Percent Distribution of Land Use by Gendered HH Type, Sex of Decision Maker, FtF Zone, 2011 ......................................................................................................................................... 55
15. Percent Distribution of Seed Type by Crop, Sex of Decision Maker, Gendered HH Type, Eastern Province, 2011 ............................................................................................................ 55
16. Percent Distribution of Decision to Sell by Sex of Decision Maker, Gendered HH Type, Eastern Province, 2011 ............................................................................................................ 55
17. Percent Distribution of Decision to Sell by Sex of Decision Maker, Gendered HH Type, FtF Zone, 2011......................................................................................................................... 56
18. Average Values of Actual Sales by Crop, Gender Of Decision Maker, FtF Zone, 2011 ........ 56 19. Average Number of Livestock Owned by Female Members, Ftf Zone, 2011 ......................... 56 20. Percent Distribution of Decision Maker by livestock, Eastern Province, 2011 ....................... 57 21. Percent Distribution of Decision Maker by Livestock, FtF Zone, 2011 .................................. 57 22. Average Number Sold by Decision Maker by Livestock, Eastern Province, 2011 ................. 57 23. Average Number Sold by Decision Maker by livestock, FtF Zone, 2011 ............................... 57 24. Average Income from Sales (ZMK) by Revenue Use Decision Maker, Eastern Province,
2011 ......................................................................................................................................... 58 25. Primary Source of Labor for Key Agricultural Activities for Maize by GHT, FTF Zone,
2011 ......................................................................................................................................... 58 26. Primary Source of Labor for Key Agricultural Activities for Largest Groundnut Field by
GHT, FTF Zone, 2011 ............................................................................................................. 58 27. Primary Source of Labor for Key Agricultural Activities for Largest Sunflower Field by
GHT, FTF Zone, 2011 ............................................................................................................. 58 28. Primary Source of Labor for Key Agricultural Activities for Largest Cassava Field by GHT, FTF Zone, 2011 ............................................................................................................. 59 29. Percent of Source of Most Labour for Groundnuts by Activity, and GHT, FtF Zone,
2011 ......................................................................................................................................... 59 30. Percent of Source of Most Labour for Sunflower by Activity, and GHT, FtF Zone, 2011 ..... 59

xi
APPENDIX II. ZAMBIA LIST OF TABLES
TABLE PAGE Percent of Small and Medium Scale Farmers Growing Maize by Province.................................. 61 Percent of Small and Medium Scale Farmers Growing Sorghum by Province ............................. 61 Percent of Small and Medium Scale Farmers Growing Rice by Province .................................... 61 Percent of Small and Medium Scale Farmers Growing Millet by Province .................................. 61 Percent of Small and Medium Scale Farmers Growing Sunflower by Province ........................... 62 Percent of Small and Medium Scale Farmers Growing Groundnuts by Province ......................... 62 Percent of Small and Medium Scale Farmers Growing Soyabean by Province ............................ 62 Percent of Small and Medium Scale Farmers Growing Cotton by Province ................................. 62 Percent of Small and Medium Scale Farmers Growing Irish Potatoes by Province ...................... 63 Percent of Small and Medium Scale Farmers Growing Tobacco by Province .............................. 63 Percent of Small and Medium Scale Farmers Growing Beans by Province .................................. 63 Percent of Small and Medium Scale Farmers Growing Cowpeas by Province ............................. 63 Percent of Small and Medium Scale Farmers Growing Velvet Beans by Province ...................... 64 Percent of Small and Medium Scale Farmers Growing Coffee by Province ................................. 64 Percent of Small and Medium Scale Farmers Growing Sweet Potatoes by Province ................... 64 Percent of Small and Medium Scale Farmers Growing Cassava by Province .............................. 64 Number of Small and Medium Scale Farmers Growing Maize by Province ................................ 65 Number of Small and Medium Scale Farmers Growing Sorghum by Province ............................ 65 Number of Small and Medium Scale Farmers Growing Rice by Province ................................... 65 Number of Small and Medium Scale Farmers Growing Millet by Province ................................. 65 Number of Small and Medium Scale Farmers Growing Sunflower by Province .......................... 66 Number of Small and Medium Scale Farmers Growing Groundnuts by Province........................ 66 Number of Small and Medium Scale Farmers Growing Soyabean by Province ........................... 66 Number of Small and Medium Scale Farmers Growing Cotton by Province ............................... 66 Number of Small and Medium Scale Farmers Growing Irish Potatoes by Province..................... 67 Number of Small and Medium Scale Farmers Growing Tobacco by Province ............................. 67 Number of Small and Medium Scale Farmers Growing Beans by Province ................................. 67 Number of Small and Medium Scale Farmers Growing Cowpeas by Province ............................ 67 Number of Small and Medium Scale Farmers Growing Velvet Beans by Province ..................... 68 Number of Small and Medium Scale Farmers Growing Coffee by Province ............................... 68 Number of Small and Medium Scale Farmers Growing Sweet Potatoes by Province .................. 68 Number of Small and Medium Scale Farmers Growing Cassava by Province ............................. 68 Number of Small and Medium Scale Farmers Growing Paprika by Province .............................. 69 Maize. Area Cultivated by Small and Medium Scale Farmers by Province .................................. 69 Sorghum. Area Cultivated by Small and Medium Scale Farmers by Province ............................. 69 Rice. Area Cultivated by Small and Medium Scale Farmers by Province .................................... 69 Millet. Area Cultivated by Small and Medium Scale Farmers by Province .................................. 70 Sunflower. Area Cultivated by Small and Medium Scale Farmers by Province ........................... 70 Groundnuts. Area Cultivated by Small and Medium Scale Farmers by Province ......................... 70 Soyabean. Area Cultivated by Small and Medium Scale Farmers by Province ............................ 70 Cotton. Area Cultivated by Small and Medium Scale Farmers by Province ................................. 71

xii
Irish Potatoes. Area Cultivated by Small and Medium Scale Farmers by Province ...................... 71 Tobacco. Area Cultivated by Small and Medium Scale Farmers by Province .............................. 71 Beans. Area Cultivated by Small and Medium Scale Farmers by Province .................................. 71 Cowpeas. Area Cultivated by Small and Medium Scale Farmers by Province ............................. 72 Velvet Beans. Area Cultivated by Small and Medium Scale Farmers by Province ...................... 72 Coffee. Area Cultivated by Small and Medium Scale Farmers by Province ................................. 72 Sweet Potatoes. Area Cultivated by Small and Medium Scale Farmers by Province ................... 72 Cassava. Area Cultivated by Small and Medium Scale Farmers by Province............................... 73 Paprika. Area Cultivated by Small and Medium Scale Farmers by Province ............................... 73 Maize. Production in Metric Tons by Small and Medium Scale Farmers by Province ................. 73 Sorghum. Production in Metric Tons by Small and Medium Scale Farmers by Province ............ 73 Rice. Production in Metric Tons by Small and Medium Scale Farmers by Province ................... 74 Millet. Production in Metric Tons by Small and Medium Scale Farmers by Province ................. 74 Sunflower. Production in Metric Tons by Small and Medium Scale Farmers by Province .......... 74 Groundnuts. Production in Metric Tons by Small and Medium Scale Farmers by Province ........ 74 Soyabean. Production in Metric Tons by Small and Medium Scale Farmers by Province ........... 75 Cotton. Production in Metric Tons by Small and Medium Scale Farmers by Province ................ 75 Irish Potatoes. Production in Metric Tons by Small and Medium Scale Farmers by Province ..... 75 Tobacco. Production in Metric Tons by Small and Medium Scale Farmers by Province ............. 75 Beans. Production in Metric Tons by Small and Medium Scale Farmers by Province ................. 76 Cowpeas. Production in Metric Tons by Small and Medium Scale Farmers by Province ............ 76 Coffee. Production in Metric Tons by Small and Medium Scale Farmers by Province ................ 76 Sweet Potatoes. Production in Metric Tons by Small and Medium Scale Farmers by Province .. 76 Cassava. Estimated Production in Metric Tons by Small and Medium Scale Farmers by
Province ................................................................................................................................... 77 Paprika. Production in Metric Tons by Small and Medium Scale Farmers by Province ............... 77 Maize. Average Yields (kg) per Hectare Planted for Small and Medium Scale Farmers by
Province ................................................................................................................................... 77 Sorghum. Average Yields (kg) per Hectare Planted for Small and Medium Scale Farmers by
Province ................................................................................................................................... 77 Rice. Average Yields (kg) per Hectare Planted for Small and Medium Scale Farmers by
Province ................................................................................................................................... 78 Millet. Average Yields (kg) per Hectare Planted for Small and Medium Scale Farmers by
Province ................................................................................................................................... 78 Sunflower. Average Yields (kg) per Hectare Planted for Small and Medium Scale Farmers by
Province ................................................................................................................................... 78 Groundnuts. Average Yields (kg) per Hectare Planted for Small and Medium Scale Farmers by
Province ................................................................................................................................... 79 Soyabean. Average Yields (kg) per Hectare Planted for Small and Medium Scale Farmers by
Province ................................................................................................................................... 79 Cotton. Average Yields (kg) per Hectare Planted for Small and Medium Scale Farmers by
Province ................................................................................................................................... 79 Irish Potatoes. Average Yields (kg) per Hectare Planted for Small and Medium Scale Farmers by
Province ................................................................................................................................... 79

xiii
Tobacco. Average Yields (kg) per Hectare Planted for Small and Medium Scale Farmers by Province ................................................................................................................................... 80
Beans. Average Yields (kg) per Hectare Planted for Small and Medium Scale Farmers by Province ................................................................................................................................... 80
Cowpeas. Average Yields (kg) per Hectare Planted for Small and Medium Scale Farmers by Province ................................................................................................................................... 80
Coffee. Average Yields (kg) per Hectare Planted for Small and Medium Scale Farmers by Province ................................................................................................................................... 80
Sweet Potatoes. Average Yields (kg) per Hectare Planted for Small and Medium Scale Farmers by Province .............................................................................................................................. 81
Cassava. Average Yields (kg) per Hectare Planted for Small and Medium Scale Farmers by Province .............................................................................................................................81
Paprika. Average Yields (kg) per Hectare Planted for Small and Medium Scale Farmers by Province .............................................................................................................................81
LIST OF MAPS
Map 1. Total Population by Province, Zambia, 2010 ................................................................7

xiv
LIST OF FIGURES
FIGURE PAGE 1. Zambia GDP at Constant 1994 Prices (K'Billion) ....................................................................... 1 2. Annual Inflation Rate, Zambia, 1998-2011 ................................................................................. 1 3. Commercial Bank Lending Rates (Weighted Lending Base Rate), 1995-2013, Zambia. ........... 2 4. Percentage Distribution of Usually Working Population (12 Years and Older) by Industry,
Zambia ...................................................................................................................................... 3 5. Contribution of Selected Sectors to GDP (%), 2012 ................................................................... 3 6. Contribution of Agricultural Sector to GDP, 2012 ...................................................................... 4 7. Population Composition by Sex, Zambia, 2010 .......................................................................... 5 8. Percentage of Population by Rural/Urban, Zambia 1990-2010 ................................................... 6 9. Percent Annual Average Rate of Population Growth by Rural/Urban Zambia 1980-1990, 1990-
2000, 2000-2010 ........................................................................................................................ 6 10. Labour Force Participation Rate (12 Years and Older) by Sex and Rural/urban, Zambia,
2010 ........................................................................................................................................... 8 11. Percentage Distribution of Usually Working Population (12 years and Older) by Employment
Status, Zambia, 2010 ................................................................................................................. 9 12. Percentage Distribution of Usually Working Population (12 Years and Older) by Occupation,
Zambia, 2010 ............................................................................................................................. 9 13. Youth Unemployment Rate by Rural/Urban and Province, Zambia, 2010 ............................. 10 14. Poverty Levels in Zambia, 1991 to 2010 ................................................................................. 11 15. Poverty Levels, Extreme and Overall by Province, 2010 ........................................................ 11 16. Incidence of Stunting, Underweight, and Wasting of Children (3-59 Months) by Rural/urban
and Province, 2010, Zambia .................................................................................................... 13 17. Real Budget Size of the Agriculture Sector from 2007 to 2013 .............................................. 14 18. Share of Agriculture to GRZ Budget 2007-2013 ..................................................................... 15 19. Percentage Share of FISP/FSP and FRA of the Total MAL Budget, 2003-2011 .................... 15 20. National Production Trends Small and Medium Scale Farming Households for Selected
Crops ........................................................................................................................................ 19 21. National Production Trends for Maize..................................................................................... 20 22. Number of Cattle, 1992-2010, Zambia .................................................................................... 21 23. Number of Goats, 1992-2010, Zambia .................................................................................... 21 24. Trends in % of Smallholders Using Fertilizer Nationwide ...................................................... 22 25. Maize Yield and Fertilizer Used on Maize .............................................................................. 22 26. Trends in First Generation Hybrid Maize Seed Use, % of Smallholder Households .............. 24 27. Total Gross Value (Constant 2011 ZMK) of Crops and Share of Maize to Total Gross Value
of Crops per Agricultural HH, 2000/01-2011/12..................................................................... 24 28. Mean Gross Value (Constant 2011 ZMK) of Expected Production per Small/medium-scale
Agricultural Household, 2000/01-2011/12 ............................................................................. 25 29. Market Participation, Smallholder Households, 2007, 2012 ................................................... 25 30. Maize Import and Export, in Tons, Zambia, 1990-2010 ......................................................... 26 31. Wheat Import and Export in Tons, Zambia, 1990-2010 .......................................................... 26 32. Percent Households by Number of Crops Grown Zambia, 2011 ............................................ 27 33. Incidence of Poverty (Head Count) by District, Eastern Province, 2010 ................................ 33 34. Incidence of Stunting, Underweight and Wasting of Children (3-59 Months) by District,
Eastern Province, 2010 ............................................................................................................ 34 35. Production Trends of Selected Major Crops, Eastern Province, 2000/01 - 2011/12 ............... 37 36. Production in Eastern Province as a Percentage of the Total Production in Zambia, 2011 ..... 40 37. Household Marketing Position of Maize, Zambia FTF Zone, 2011 ........................................ 46 38. Percent Households by Number of Crops Grown Zambia and FTF Zone, 2012 ..................... 49

xv
ACRONYMS
AU African Union CAADP Comprehensive Africa Agriculture Development Programme CFS Crop Forecast Survey CSO Central Statistics Office FAOSTAT Food and Agricultural Organization Online Statistical Database FRA Food Reserve Agency FSP/FISP Fertilizer Support Program/Farmer Input Support Program FSRP Food Security Research Project FtF Feed the Future GDP Gross Domestic Product GHT Gendered Household Type GRZ Government of the Republic of Zambia HH House Hold IAPRI Indaba Agricultural Policy Research Institute LCMS Living Conditions Monitoring Survey MAL Ministry of Agriculture and Livestock MT Metric Ton NGO Non-Governmental Organization OPV Open Pollinated Variety PHS Post-harvest Survey PPP Purchasing Power Parity PS Priority Survey RALS Rural Agricultural Livelihoods Survey SID Simpson Index of Diversity SS Supplemental Survey UN United Nations USAID United States Agency for International Development US$ U.S. dollars ZMK Zambian Kwacha ZOI zone of influence


1
1. MACRO-ECONOMIC TRENDS
1.1. The Economic Indicators
Zambia’s economy has grown rapidly over the last decade, due in large measure to an expansion of copper mining industry and foreign investment in retail, construction, and manufacturing sectors. This section presents data on macro-economic trends in Zambia. The aim of this section is to provide an analysis of the broader economic context within which Zambia’s agricultural sector is situated.
• Figure 1 is a chart with historical data GDP Annual Growth Rate in Zambia. Zambia’s economy has grown steadily in real terms since 2001. In 2012 Zambia’s GDP grew by 7.30% compared to the previous year, and has remained above 5% for much of the last decade. This tremendous growth makes Zambia one of the fastest growing economies in the world.
• The annual inflation rate in Zambia dropped to 6.4% in 2011, down 8.5% the previous year. Inflation Rate in Zambia is computed and reported by the CSO. The inflation rate reached an all time high of 26.8% in 1999 and a record low of 6.4% in 2011. Figure 2, below, shows the historical trends for annual Inflation Rate in Zambia.
Figure 1. Zambia GDP at Constant 1994 Prices (K'Billion)
Source: Ministry of Finance and National Planning 2012. Figure 2. Annual Inflation Rate, Zambia, 1998-2011
Source: World Bank Accessed on March 12, 2013 at http://data.worldbank.org/country/zambia
0.0
1.0
2.0
3.0
4.0
5.0
6.0
7.0
8.0
9.0
0.0
1000.0
2000.0
3000.0
4000.0
5000.0
6000.0
2000 2001 2002 2003 2004 2005 2006 2007 2008 2009 2010 2011 2012 2013
Cons
tant
199
4 Pr
ices
(K
'Bill
ion)
Year GDP GDP growth
Perc
ent
24.5 26.8 26 21.4 22.2 21.4 18 18.3
9 10.7 12.4 13.4 8.5 6.4
1998 1999 2000 2001 2002 2003 2004 2005 2006 2007 2008 2009 2010 2011
inflation rate

2
Figure 3. Commercial Bank Lending Rates (Weighted Lending Base Rate), 1995-2013, Zambia
Source: Bank of Zambia 2013.
• Figure 3 shows data on commercial bank lending rates from 1995 to 2013. With inflation rates declining from their highs earlier in the decade, commercial lending rates have also gradually declined. However, in January, 2013, the government, through the Bank of Zambia, introduced caps on the maximum effective annual lending rates that licensed commercial banks and non-bank financial institutions can charge their customers. The commercial bank maximum effective annual lending rate stand at 18.25%, while that for micro-finance service providers is 42%. The maximum effective annual lending rate that will be charged by all other non-bank financial institutions shall not exceed 30%. This may have the adverse effect of cutting off potential credit sources for many potential borrowers, including in the agricultural sector.
1.2. Agriculture’s Place in Zambia’s Economy
While Zambia has experienced positive GDP growth over the last decade, the growth of the agricultural sector has been stagnant to moderate. This has led to a declining share of agriculture to Zambia’s overall GDP. Despite this, agriculture remains the primary livelihoods source of Zambians, particularly the poor. Thus, improving the growth conditions for agriculture in Zambia is critical for both improving overall GDP growth and improving the livelihoods conditions of the majority of Zambians.
• Agriculture in Zambia supports the livelihoods of over 66% of the population, making it by far the most important source of livelihood and employment in Zambia (Figure 4).
• Yet, despite its importance in terms of employment, the agricultural sector contributes relatively little to the overall GDP. In 2012, agriculture’s contribution to GDP was about 13% (Figure 5).
47.7
57.4
37.9 37.4 42.6
37.5
46.7 43.1
36.8
29.8 26.7
21.6 18.3
20.8 22.7 19.4
16.6
9.1 9.3
1995 1996 1997 1998 1999 2000 2001 2002 2003 2004 2005 2006 2007 2008 2009 2010 2011 2012 2013

3
Figure 4. Percentage Distribution of Usually Working Population (12 Years and Older) by Industry, Zambia
Source: 2010 Census of Population National Analytical Report 2013. Figure 5. Contribution of Selected Sectors to GDP (%), 2012
Source: Central Statistical Office data 2012.
• Zambia’s economy has grown steadily in real terms since 2001. However, the percent contribution of the agricultural sector to GDP has declined from 16% in 2001 to 12.6% in 2012 (Figure 6). This suggests that agricultural growth has not kept pace with growth in other sectors of the economy. This is worrying given the percent of Zambians who depend on agricultural for their livelihoods. Overall GDP growth combined with a declining contribution from agriculture in a primarily agrarian country like Zambia indicates a widening income gap between urban wage earners and the rural poor.
66.5 10.0 9.9
4.2 3.6 3.0
1.9 0.5
0.0 10.0 20.0 30.0 40.0 50.0 60.0 70.0
Agriculture ,Forest & FishingCommunity Social and Personal Services
Wholesale & Retail Trade Restaurants and HotelTransport Storage and Communication
ManufacturingConstruction and Allied Repairs
Mining and QuarryingFinance Insuranceand Real Estates
percent
Agriculture, Forestry and Fishing
13% Mining and Quarrying
7%
Manufacturing 10%
Electricity, Gas and Water
2%
Construction 13%
Wholesale and Retail trade
16%
Restaurants, Bars and Hotels
2%
Transport, Storage and
Communications 11%
Financial Institutions and Insurance
7%
Real Estate and Business services
7%
Community, Social and Personal
Services 9%
other (taxes) 3%

4
Figure 6. Contribution of Agricultural Sector to GDP, 2012
Source: Central Statistical Office data 2012.
0.0%
2.0%
4.0%
6.0%
8.0%
10.0%
12.0%
14.0%
16.0%
18.0%
2001 2002 2003 2004 2005 2006 2007 2008 2009 2010 2011 2012
Agriculture Forestry Fishing

5
2. DEMOGRAPHY AND EMPLOYMENT
2.1. Population
Zambia, like much of Africa, is experiencing rapid population growth, coupled with massive urbanization. Moreover, like other countries in the region the population is largely young. Thus, a major challenge facing Zambia and the region is identifying strategies to feed a rapidly growing, urban population, while creating employment opportunities for millions of young people entering the job market.
• According to the 2010 Census of Population Zambia’s total population was 13 million, the majority of which live in rural areas. Of the total population, 49.3% (6,454,647) were males and 50.7% (6,638,019) were females. (Table 1 and Figure 7).
Table 1. Population by Province, Region, and Sex, Zambia, 2010
Region and Province
Population % Total Male Female Male Female
Zambia 13,092,666 6,454,647 6,638,019 49.3 50.7 Rural 7,919,216 3,906,636 4,012,580 49.3 50.7 Urban 5,173,450 2,548,011 2,625,439 49.3 50.7 Central 1,307,111 648,465 658,646 49.6 50.4 Copperbelt 1,972,317 981,887 990,430 49.8 50.2 Eastern 1,592,661 784,680 807,981 49.3 50.7 Luapula 991,927 488,589 503,338 49.3 50.7 Lusaka 2,191,225 1,082,998 1,108,227 49.4 50.6 Muchinga 711,657 349,872 361,785 49.2 50.8 Northern 1,105,824 546,851 558,973 49.5 50.5 North- Western 727,044 358,141 368,903 49.3 50.7
Southern 1,589,926 779,659 810,267 49.0 51.0 Western 902,974 433,505 469,469 48.0 52.0
Source: 2010 Census of Population National Analytical Report, Central Statistical Office 2012. Figure 7. Population Composition by Sex, Zambia, 2010
Source: 2010 Census of Population and Housing, Population Summary Report, CSO 2010
49% 51% male
female

6
Figure 8. Percentage of Population by Rural/Urban, Zambia 1990-2010
Source: 2010 Census of Population National Analytical Report, Central Statistical Office 2012.
• In Zambia, 60.5% of the population resides in rural areas and 39.5% in urban. Zambia is therefore highly urbanized by regional standards. As shown in Figure 8, Zambia underwent a unique demographic shift in the 1990s, from which it is now recovering. Due to the collapse of the economy in the early 1990s, many urban dwellers returned to rural areas in search of a livelihood. This urban to rural migration caused the percent of rural dwellers to grow between the 1990 to 2000 census. The 2010 census suggests that the trend has reversed, due in part to economic opportunities in urban regions since 2000, coupled with stagnant growth in much of the rural economy.
• Zambia’s population grew at a rate of 2.8% per annum during the 2000-2010 period. This was an increase from the annual rate of 2.7% and 2.4% recorded during the 1980-1990 and 1990-2000 periods, respectively (Figure 9). The population growth rate of 2.8% per annum during the 2000-2010 period makes Zambia one of the fastest growing populations in the world (ranked 13th in 2013). As shown in Figure 9, urban Zambia is experiencing a dramatic increase in populations. While this may be partially explained by income opportunities in urban areas, there is a real fear the much of this growth is being driven by push factors in rural Zambia, where income opportunities may be declining.
Figure 9. Percent Annual Average Rate of Population Growth by Rural/Urban Zambia 1980-1990, 1990-2000, 2000-2010
Source: 2010 Census of Population and Housing, Population Summary Report, CSO 2010.
60.6%
39.4%
65.3%
34.7%
60.5%
39.5%
rural urban
1990 2000 2010
2.7 2.8 2.6 2.4
3.0
1.5
2.8
2.1
4.2
0.00.51.01.52.02.53.03.54.04.5
Total Rural urban
1980-1990 1990-2000 2000-2010

7
Map 1. Total Population by Province, Zambia, 2010
Source: 2010 Census of Population and Housing, Population Summary Report, CSO 2012.
• In Zambia, populations are concentrated along the line of rail and the Copperbelt Province, where most of Zambia’s industrial activities take place and where the majority of urban centers are located (Map 1). At provincial level, Lusaka Province had the largest percent share of the population at 16.7% (2,191,225) of the total population. Copperbelt Province was second with 15.1% (1,972,317), while Eastern Province was third with 12.2% (1,592,661) of the total population. Muchinga Province had the least percent share of the total population at 5.4% (711,657). Muchinga Province is Zambia’s tenth province, created in November 2011. Before then, it was part of the old Northern Province.
2.2. Employment
The 2010 census provides the latest figures on employment and related indicators. For the census, the working-age population was defined as all persons 12 years and older. This is the population from which measurement of the economic characteristics of the population were based. Following are other related definitions and concepts.

8
2.2.1. Labour Force Participation Rate
This is defined as the ratio of the economically active population to the working age population expressed as a percent. The economically active population is one that engages actively in the labour market, either by working or looking for work. The labour force participation rate provides an indication of the relative size of the supply of labour available. 2.2.2. Unemployment Rate
This is the proportion of the labour force who have no jobs, are available for work and are seeking work in a given reference period in the total labour force expressed as a percent. The unemployment rate tells us the proportion of the labour force that does not have a job and is actively looking for work. The employed population includes all persons who had a job and would normally have worked for pay, profit, or return in kind. 2.2.3. Youth Unemployment Rate
This was defined as a proportion of the labour force aged 15-35 years who had no jobs, were available for work and were seeking work in a given reference period in the total youthful labour force expressed as a percent. According to the 2010 census results, the population aged 12 years and older was 7,715,022. Out of these, 56.8% were in rural areas while 43.2% were in urban areas, 48.3% were male and 51.7% female.
• The overall labour force participation rate was recorded at 55.2%. The labour force participation rate was higher (60.3%) in rural areas, where most of the population is engaged in agriculture, than the urban rate of 48.5%. In the male population, participation rate was 65.0% compared to 46.0% in the female population (Figure 10).
• The majority of the employed population was in self employment (44.1%) followed by unpaid family workers (32.9%) (Figure 11). This suggests that the formal labor market remains under-developed.
Figure 10. Labour Force Participation Rate (12 Years and Older) by Sex and Rural/urban, Zambia, 2010
Source: 2010 Census of Population and Housing, Population Summary Report, CSO 2010.
55.2 60.3 48.5
65.0 67.3 62.2 46.0
53.9
35.5
Total Zambia Rural Urban
Both sexes Male Female

9
Figure 11. Percentage Distribution of Usually Working Population (12 years and Older) by Employment Status, Zambia, 2010
Source: 2010 Census of Population and Housing, Population Summary Report, CSO 2010.
• The main occupation among the usually working population was in agricultural, forestry and fishing at 53.8%, followed by the elementary occupations at 12.8%. Managers accounted for 0.9% of the total working age population (Figure 12).
Figure 12. Percentage Distribution of Usually Working Population (12 Years and Older) by Occupation, Zambia, 2010
Source: 2010 Census of Population and Housing, Population Summary Report, CSO 2010.
44.1
32.9
22.3
0.7
Self-employed Unpaid familyworkers
Paid-employees Employers
53.8
12.8
10.0
6.9
4.7
4.6
3.2
2.2
1.0
0.9
Skilled agriculture, forestry and fisheries workers
Elementary occupations
Craft and related trade workers
Service and sales workers
Professionals
Plant and machine operators and assemblers
Technicians and associate professionals
Managers
Clerical support workers
Not stated

10
• The youth unemployment rate was 16.7%, with urban youth unemployment rate being higher (22.0%) than the rural unemployment rate (7.5%). In general, provinces with high urban populations had higher youth unemployment rates. Copperbelt, home to many mines, had the highest youth unemployment of 29.6 while the lowest rate was from Muchinga Province 7.7 (Figure 13). A key contributing factor to youth unemployment, in regions with an established mining industry such as the Copperbelt may be the growing mismatch between the skills that youngsters have and the vacancies that employers want to fill. The government would do well to address the mismatch between skills and jobs by placing a lot of emphasis on high-quality vocational courses, apprenticeships, and links with industry.
Figure 13. Youth Unemployment Rate by Rural/Urban and Province, Zambia, 2010
Source: 2010 Census of Population and Housing, Population Summary Report, CSO, 2010.
16.7
7.5
22.0
7.7 7.9 9.3 10.1 10.4 13.3 14.8 16.2
25.1
29.6

11
3. POVERTY AND NUTRITION
Despite strong economic growth in the last decade, Zambia has made little progress in reducing poverty, particularly in rural areas. While the overall poverty rate in Zambia has declined over time, poverty rates particularly in rural Zambia remain stubbornly high, with 78% of the rural population living in poverty, in 2010. This section presents incidence of poverty in Zambia using two measures: the first one is that is used by the CSO that determines poverty by comparing the household’s measure of income (consumption expenditure) to an absolute poverty line; the second is an international poverty line of per capita U.S. dollars (US$)1.25/day measured at 2005 purchasing power parity (PPP), used by the World Bank.
• According to the CSO figures, rural poverty rates remain stubbornly high at 78% whilst urban poverty rates are reported to have declined from 49% in 1991 to 28% in 2010 (Figure 14). Redressing such high poverty rates in the rural Zambia has always been the government priority as outlined in the National Development Programs though the solutions have been elusive.
• Provinces located far from the line of rail, have the highest proportions of people living in extreme poverty. These provinces are Luapula Province (64.9%), Western Province (64.0%), and Eastern Province with 58.7% of its population living in extreme poverty (Figure 15).
Figure 14. Poverty Levels in Zambia, 1991 to 2010
Source: PSI Surveys 1991, 1993: LCMS Surveys 1996, 1998, 2004, 2006, 2010, Central Statistical Office. Figure 15. Poverty Levels, Extreme and Overall by Province, 2010
Source: Living Conditions Monitoring Survey 2010, CSO.
1991 1993 1996 1998 2004 2006 2010Total 70% 74% 69% 73% 68% 63% 61%
rural 88% 92% 82% 83% 78% 80% 78%
urban 49% 45% 46% 56% 53% 30% 28%
0%20%40%60%80%
100%
42.3% 36.7%
18.3%
58.7% 64.9%
11.5%
55.8% 46.1% 47.3%
64.0% 60.5% 60.9%
34.3%
77.9% 80.5%
24.4%
75.0% 67.0% 67.9%
80.4%
Extreme Poverty Overall Poverty

12
Table 2. Distribution of Per capita Income among Smallholder Households, 2011/12
Per capita gross household income from sources observed
(US$) Mean Median Percentile 25 Percentile 75
Province Central 455.02 223.72 111.48 451.49 Copperbelt 567.50 223.69 118.44 460.37 Eastern 389.68 216.72 119.28 388.01 Luapula 664.01 285.75 159.06 514.26 Lusaka 1,351.59 319.95 122.40 815.81 Muchinga 446.62 212.03 110.51 474.00 Northern 469.45 314.70 184.99 547.98 NorthWestern 442.45 202.77 115.05 420.61 Southern 693.99 202.51 109.22 424.06 Western 301.92 163.34 77.19 319.67 Zambia 514.49 230.87 120.04 448.81
Source: 2012 CSO/MAL/IAPRI Rural Agricultural Livelihoods Survey.
• Table 2 presents the average per capita income, in US$, among smallholder farming households. Incomes are generally low. Lusaka, with an average per capita gross income of US$1,351.59 being the highest. The province with the lowest per capita income is Western, with an average of US$301.92. It is also important to note from Table 2 that in most cases mean income is far larger than the median, suggesting a skewed distribution of incomes, with a small group of relatively high earners pulling the mean income up. This is consistent with a highly differentiated smallholder sector.
• In Table 3 shows the incidence of poverty using the 1.25 US$/day poverty line measured at 2005 PPP. At national level, 75.5% of all rural smallholder households were poor. Lusaka Province had the lowest poverty rate with 59.6% while Western Province had the highest rate of 84.8%.
Table 3. Prevalence of Poverty: Percent of Smallholder Households Living on Per capita Income of Less than $1.25/day (2005 ppp Exchange Rate), Province, 2011 Province Poverty rate
Central 75.5 Copperbelt 74.8 Eastern 80.0 Luapula 70.6 Lusaka 59.6 Muchinga 74.7 Northern 68.0 NorthWestern 76.8 Southern 76.3 Western 84.8 Zambia 75.5
Source: 2012 CSO/MAL/IAPRI Rural Agricultural Livelihoods Survey.

13
Figure 16. Incidence of Stunting, Underweight, and Wasting of Children (3-59 Months) by Rural/urban and Province, 2010, Zambia
Source: Living Conditions Monitoring Survey 2010, CSO, 2012.
• Incidences of stunting, underweight, and wasted children are higher in rural Zambia than in urban: 48.3% of children exhibiting sign of stunting in rural Zambia compared to 42.3% in urban. Yet, with a national average of 46.7% of fewer than five children exhibiting signs of growth stunting, under-nutrition must be considered a serious problem throughout Zambia (Figure 16).
Rural Urban Central Copperbelt
Eastern Luapula Lusaka Northern North-
Western Southern Western AllZambia
Stunting 48.3% 42.3% 41.3% 51.0% 51.7% 49.2% 39.9% 52.5% 47.1% 39.5% 45.0% 46.7%
Underweight 14.2% 10.8% 12.6% 14.9% 12.3% 18.0% 7.9% 15.9% 13.2% 13.0% 9.4% 13.3%
Wasting 6.4% 4.9% 10.6% 2.2% 2.6% 5.8% 6.9% 7.6% 8.8% 6.2% 5.9% 6.0%
0.0%
10.0%
20.0%
30.0%
40.0%
50.0%
60.0%

14
4. PUBLIC SPENDING AND ALLOCATION TO AGRICULTURE
Agriculture is crucial for economic and social development, as the majority of the Zambian population resides in rural areas, and over half the workforce is engaged in agriculture. Growth in agriculture is seen as the most effective strategy for reducing poverty and promoting overall economic growth. In recognition of the importance of agricultural growth on the continent, the African Union (AU) Heads of State adopted the Comprehensive Africa Agriculture Development Programme (CAADP) in June 2003 at the African Union Summit in Maputo, Mozambique. Through CAADP, African states committed to the achievement of 6% annual agricultural growth as its main goal. To achieve this goal, African governments pledged to increase agricultural spending to at least 10% of total government budgetary resources by 2008. These commitments explicitly place agriculture at the center of national growth and poverty reduction strategies and aim put countries on track towards achieving the first Millennium Development Goal of halving poverty and hunger by 2015. While CAADP draws significant attention to public spending levels on agriculture, this alone does little to help understand the extent to which spending can be translated into poverty reduction and growth. This section, therefore, examines the trends and composition of Zambia’s public spending on agriculture in the context of stagnant rural poverty levels.
• Figure 17 shows the size of the government budget for agriculture in real terms. It shows that from 2007 to 2013 the Zambian treasury allocated in the national budget between Zambian Kwacha (ZMK)1.1 trillion to ZMK2.2 trillion to the sector. However, the actual amount spent on the sector has been consistently higher than what was allocated through the years. In 2011, actual expenditure was at its highest with about ZMK 3 trillion spent against the allocated ZMK1.4 trillion. This difference has been driven primarily by unbudgeted expenditures on the FRA, which were mandated by the government to purchase the entirety of the bumper maize harvests from 2010 to 2012.
Figure 17. Real Budget Size of the Agriculture Sector from 2007 to 2013
Source: Government of the Republic of Zambia Budgets.
-
500
1,000
1,500
2,000
2,500
3,000
2007 2008 2009 2010 2011 2012 2013
ZK'B
illio
n
Years
Actual (As at end of July for 2012) Allocated

15
• At the time of signing the Maputo Declaration in 2003, Zambia was committing 6.1% of its national resources towards agriculture. From 2008 onward, budget allocation for the agricultural sector by the treasury have been significantly below the 10% budget target laid out in the Maputo Declaration. However, due to unanticipated spending on FRA, which procured millions of tons of maize from 2010-2012, actual spending on the sector exceeded the 10% threshold (Figure 18). Due to the limited participation of poor smallholders in maize output markets; this spending is unlikely to have had a measurable effect on rural poverty (See section 5.3).
• Figure 19 shows the trend for actual expenditure on agriculture, from 2003 to 2011. The share of actual expenditure on the two components has been growing since 2003. As of 2010, spending on FRA and FISP comprised 91% of the government’s actual spending on the agricultural sector. This leaves virtually no other funds for basic research, extension, or other agricultural programs.
Figure 18. Share of Agriculture to GRZ Budget 2007-2013
Source: Government of the Republic of Zambia (GRZ) Budgets.
Figure 19. Percentage Share of FISP/FSP and FRA of the Total MAL Budget, 2003-2011
Source: Government of the Republic of Zambia Budgets.
0.0
2.0
4.0
6.0
8.0
10.0
12.0
14.0
16.0
2007 2008 2009 2010 2011 2012 2013
Shar
e of
Agr
icul
ture
(%)
Years
Actual (As at end of July for 2012) Allocated
Maputo Declaration Target
2003 2004 2005 2006 2007 2008 2009 2010 2011Other 65 60 62 55 64 36 43 9 14FRA 18 13 11 19 18 26 15 61 56FSP/FISP 17 27 27 25 18 38 43 30 30
0102030405060708090
100
16
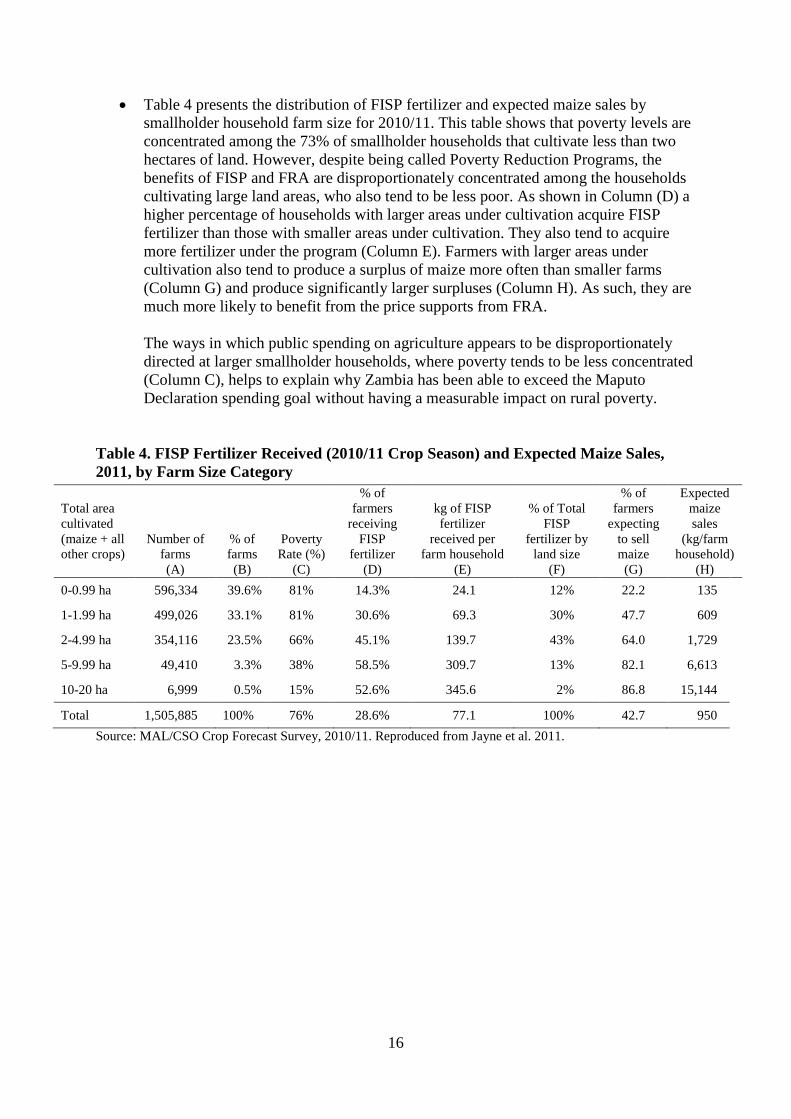
• Table 4 presents the distribution of FISP fertilizer and expected maize sales by smallholder household farm size for 2010/11. This table shows that poverty levels are concentrated among the 73% of smallholder households that cultivate less than two hectares of land. However, despite being called Poverty Reduction Programs, the benefits of FISP and FRA are disproportionately concentrated among the households cultivating large land areas, who also tend to be less poor. As shown in Column (D) a higher percentage of households with larger areas under cultivation acquire FISP fertilizer than those with smaller areas under cultivation. They also tend to acquire more fertilizer under the program (Column E). Farmers with larger areas under cultivation also tend to produce a surplus of maize more often than smaller farms (Column G) and produce significantly larger surpluses (Column H). As such, they are much more likely to benefit from the price supports from FRA. The ways in which public spending on agriculture appears to be disproportionately directed at larger smallholder households, where poverty tends to be less concentrated (Column C), helps to explain why Zambia has been able to exceed the Maputo Declaration spending goal without having a measurable impact on rural poverty.
Table 4. FISP Fertilizer Received (2010/11 Crop Season) and Expected Maize Sales, 2011, by Farm Size Category
Total area cultivated (maize + all other crops)
Number of farms
% of farms (B)
Poverty Rate (%)
% of farmers
receiving FISP
fertilizer
kg of FISP fertilizer
received per farm household
% of Total
FISP fertilizer by
land size
% of farmers
expecting to sell maize
Expected maize sales
(kg/farm household)
(A) (C) (D) (E) (F) (G) (H) 0-0.99 ha 596,334 39.6% 81% 14.3% 24.1 12% 22.2 135
1-1.99 ha 499,026 33.1% 81% 30.6% 69.3 30% 47.7 609
2-4.99 ha 354,116 23.5% 66% 45.1% 139.7 43% 64.0 1,729
5-9.99 ha 49,410 3.3% 38% 58.5% 309.7 13% 82.1 6,613
10-20 ha 6,999 0.5% 15% 52.6% 345.6 2% 86.8 15,144
Total 1,505,885 100% 76% 28.6% 77.1 100% 42.7 950 Source: MAL/CSO Crop Forecast Survey, 2010/11. Reproduced from Jayne et al. 2011.

17
5. AGRICULTURAL TRENDS AND INDICATORS
5.1. Trends in Agricultural Production
Productivity growth is critical to meeting the food needs of the Zambian population. Statistics for most crops show an upward trend over the last six years. These include production, area, and yield. Statistics for the six most widely grown crops in Zambia (maize, rice, groundnuts, seed cotton, mixed beans, cassava, and sweet potato) are presented in Tables 5, 6, 7, and 8.
• Table 5 shows that, in general and for all crops, there has been a slight increase in the proportion of the small and medium-scale farmers are cultivating the various crops. The percent of farmers cultivating cassava has remained about the same.
• The area cultivated under each crop also shows a slight upward trend (Table 6). • National production figures for most crops have trended upward over the last six
years, but remain erratic and highly susceptible to rain-fall variations (Table 7). • Yields per hectare have improved slightly for most crops since 2006. However, much
of this improvement is due to favorable weather conditions. Moreover, yields remain well below global averages (Table 8).
Table 5. Percent Households Planting Crop, Zambia, 2007 to 2012
Agricultural year
2006/07 2007/08 2008/09 2009/10 2010/11 2011/12 Maize 80.6 82.3 83.3 81.7 84.7 86.0 Rice 3.6 3.4 4.6 4.5 4.3 4.5 Groundnuts 38.2 37.2 43.8 48.6 43.4 39.2 Seed cotton 8.6 9.9 8.5 6.4 10.1 20.0 Mixed beans 11.9 12.7 15.6 15.3 12.6 15.7 Cassava 38.2 37.2 38.1 37.9 36.1 37.5 Sweet potatoes 10.9 12.1 17.8 17.6 11.5 12.7
Source: Crop Forecast Survey, MAL, and CSO 2000-2011.
Table 6. Area Cultivated (ha), Crop, Zambia 2000 to 2012
Agricultural year
2006/07 2007/08 2008/09 2009/10 2010/11 2011/12 Maize 1,039,045 1,176,221 1,077,950 1,182,217 1,311,295 1,253,664 Rice 23,743 29,671 31,032 35,841 33,988 30,304 Groundnuts 183,967 189,399 215,324 267,578 223,298 181,410 Seed cotton 106,528 148,244 102,784 84,724 131,691 316,175 Mixed beans 71,593 80,577 82,659 83,735 69,923 96,232 Cassava 364,271 389,953 392,933 403,217 386,608 389,250 Sweet potatoes 40,504 42,120 63,970 69,794 45,059 41,526
Source: Crop Forecast Survey, MAL and CSO 2000-2011.

18
Table 7. Production in Tons, Crop, Zambia 2007 to 2012
Agricultural year
2006/07 2007/08 2008/09 2009/10 2010/11 2011/12 Maize 1,419,545 1,392,180 1,657,117 2,463,523 2,786,896 2,731,843 Rice 23,582 30,243 41,929 51,656 49,404 43,326 Groundnuts 68,005 98,176 119,872 163,738 138,889 108,784 Seed cotton 64,110 91,588 86,277 72,068 121,392 268,902 Mixed beans 31,740 59,783 46,001 63,909 45,557 59,835 Cassava 1,706,894 986,848 1,244,298 1,248,561 1,097,697 1,227,352 Sweet potatoes 104,911 134,544 199,490 250,347 146,218 158,830
Source: Crop Forecast Survey, MAL and CSO 2000-2011.
Table 8. Total yield (kg/HH), Crop, Zambia 2007 to 2012
Agricultural year
2006/07 2007/08 2008/09 2009/10 2010/11 2011/12 Maize 1,326 1,292 1,556 2,070 2,133 2,163 Rice 900 1,163 1,474 1,676 1,614 1,604 Groundnuts 401 588 651 727 744 685 Seed cotton 631 784 931 976 1,071 961 Mixed beans 469 1,010 632 963 741 697 Cassava 4,428 2,268 2,800 2,776 2,391 2,792 Sweet potatoes 2,827 4,008 3,772 4,069 4,534 5,024
Source: Crop Forecast Survey, MAL and CSO, 2000-2011. Zambia's small- and medium-scales farming households have in the past 5 years been recording surplus maize harvests, including consecutive record-breaking harvests, between 2009/10 and 2011/12 agricultural seasons. The aggregate maize production levels in 2011 were more than double the average level from 2006 to 2008. The expansion in maize production over the period corresponds with the scaling up of the Government's maize subsidy programs, combined with good rains during these seasons.
• Table 9 gives a national summary of the estimated number of smallholder agricultural households in Zambia, total and mean per household maize area planted, quantity harvested, and yield between 2000/01 and 2011/12 agricultural seasons. By the 2011/12 season, smallholder maize production levels were about double what the annual production during the 2005/06-2007/08 period. When expressed on a per farm household basis, mean maize production rose from 964 kg to 1,931 kg per farm, a 92% increase. Yet this has coincided with a significant expansion of area under maize cultivation. Moreover, yields remain extremely low, with national yields of only 2.1 tons per hectare in 2011/12. Maize yields in South Africa are about twice the Zambian rate.

19
Table 9. Smallholder Agricultural Households and Maize Area Planted, Quantity Harvested, and Yields, 2000/01-2011/12
Agricultural year
Total # of agricultural
Households (HH)
Maize area planted (ha) Maize quantity harvested
National maize yield
(kg/ha planted) Total Mean HH Total (MT) Mean
HH (kg) 2000/01 1,127,109 748,314 0.66 957,437 849 1,279 2001/02 1,169,525 785,183 0.67 673,673 576 858 2002/03 1,212,079 745,670 0.62 970,317 801 1,301 2003/04 1,275,428 780,768 0.61 1,364,841 1,070 1,748 2004/05 1,326,631 801,976 0.60 652,414 492 814 2005/06 1,373,537 864,970 0.63 1,339,479 975 1,549 2006/07 1,439,086 1,039,350 0.72 1,419,545 986 1,367 2007/08 1,497,045 1,176,221 0.79 1,392,180 930 1,184 2008/09 1,459,694 1,078,192 0.74 1,657,674 1,136 1,537 2009/10 1,483,439 1,182,217 0.80 2,463,523 1,661 2,084 2010/11 1,505,885 1,311,295 0.87 2,786,896 1,851 2,125 2011/12 1,414,536 1,253,664 0.89 2,731,843 1,931 2,163 Source: Crop Forecast Survey, MAL and CSO, 2000-2011.
• Production trends for other crops increased from 2002/03 season to 2009/10, after which most crops, except cotton, show a decline (Figure 20). This indicates that some of the maize expansion was coming at the expense of other crops. Figure 21 is showing the increasing production trends for maize.
Figure 20. National Production Trends Small and Medium Scale Farming Households for Selected Crops
Source: Crop Forecast Survey, MAL and CSO 2000-2011.
-
50,000
100,000
150,000
200,000
250,000
300,000
met
ric to
ns sunflower
groundnuts
soyabeans
cotton
mixed beans
sweet potatoes

20
Figure 21. National Production Trends for Maize
Source: Crop Forecast Survey, MAL and CSO 2000-2011.
• Table 10 presents the average per household and per capita holding size. This excludes land rented-in or borrowed in. At national level, land holding size per capita and per household show only marginal increase from 2010 and 2011. This is also generally true in all provinces except Central where the land holding size has been decreasing.
Table 10. Holding Size (ha) per Household, Per capita, 2008/09-2011/12, Zambia 20098/09 2009/10 2010/2011 2011/12
Province size / hhd
size /capita
size per hhd
size per capita
size per hhd
size per capita
size per hhd
size per capita
Central 3.9 .7 3.2 .6 3.5 .6 3.3 .6 Copperbelt 2.4 .4 2.1 .4 2.2 .4 3.5 .6 Eastern 2.2 .4 2.1 .4 2.4 .4 2.9 .6 Luapula 2.1 .4 2.4 .5 2.8 .5 3.2 .6 Lusaka 2.0 .3 1.4 .2 1.8 .3 1.6 .3
Northern 3.1 .6 3.9 .7 3.6 .7 4.3 .8 Northwestern 2.5 .4 1.9 .3 2.8 .5 2.8 .5 Southern 2.3 .4 2.6 .4 2.5 .5 3.8 .6 Western 2.1 .4 1.9 .3 2.3 .4 3.0 .5 Zambia 2.5 .4 2.4 .4 2.7 .5 3.2 .6
Source: Crop Forecast Survey, MAL and CSO 2008-2011.
-
500,000
1,000,000
1,500,000
2,000,000
2,500,000
3,000,000
met
ric to
ns

21
Figure 22. Number of Cattle, 1992-2010, Zambia
Source: FAOSTAT, FAO of the United Nations (UN), Accessed on March 12, 2013. http://faostat3.fao.org/home/index.html#VISUALIZE
• Figure 22 shows the estimated number of cattle in Zambia between 1992 and 2010. The number of cattle 2010 is about the same as it was in 1992, with numbers going down significantly in 1996, 2004 and 2008 due to major disease outbreaks in those years. Significant cattle loses represent a serious economic lose to rural households. Mitigating the effects of disease outbreaks of livestock mortality is therefore an important strategy for stabilizing rural assets.
• The number of goats has been increasing over the years. Zambia is estimated to have had just over 500,000 goats in 1992. The number has increased to 2,200,000 in 2010 (Figure 23).
Figure 23. Number of Goats, 1992-2010, Zambia
Source: FAOSTAT, FAO of the UN, Accessed on March 12, 2013. http://faostat3.fao.org/home/index.html#VISUALIZE
0
500,000
1,000,000
1,500,000
2,000,000
2,500,000
3,000,000
3,500,000
1992 1993 1994 1995 1996 1997 1998 1999 2000 2001 2002 2003 2004 2005 2006 2007 2008 2009 2010
Num
ber
Year

22
5.2. Input Use, Access and Farming Practices
One of the primary constraints to yield improvement is limited access to inputs among Zambian smallholders.
• While input use has trended upward since 2001, only about 55% of Zambia farmers use fertilizer on their fields, with the majority of fertilizer being applied to maize fields (Figure 24).
• Of the farmers using fertilizer, the yield response to fertilizer use is extremely low. In 2012, fertilizer users produced about 2.2 MT of maize per hectare (Figure 25). On average, farmers used just over 170 kg of fertilizer on a hectare of maize, below the recommended 200kg. High level of soil acidity, low soil organic matter, and late or improper fertilizer application methods likely all contribute to low returns to fertilizer. At current average return rates, the use of fertilizer at commercial prices is uneconomical for most smallholders.
Figure 24. Trends in % of Smallholders Using Fertilizer Nationwide
Source: Crop Forecast Survey, MAL and CSO 2000-2011.
Figure 25. Maize Yield and Fertilizer Used on Maize
Source: Crop Forecast Survey, MAL and CSO 2000-2011.
0.0%
10.0%
20.0%
30.0%
40.0%
50.0%
60.0%
2000 2001 2002 2003 2004 2005 2006 2007 2008 2009 2010 2011
perc
ent
fert use
020406080100120140160180
0250500750
100012501500175020002250
Fert
ilize
r use
d on
mai
ze (k
g/ha
)
Mai
ze Y
ield
(kg/
ha)
Crop year (Oct-Sep)
Maize yield (kg/ha) Fertilizer used on maize (kg/ha)

23
Table 11. Percent Households by Crop Grown, Seed Type, Zambia, 2012
Source: 2012 CSO/MAL/IAPRI Rural Agricultural Livelihoods Survey.
• Table 11 shows that in 2012, about 55% of the small and medium-scale farming households planted first generation hybrid maize seed while 45% planted local varieties or recycled seeds. Households growing tobacco and cotton, which are commercial cash crops grown under outgrower conditions, almost entirely grew first generation hybrid seed. Households growing the rest of the crops almost completely use local seed.
• There is an increasing trend among households growing maize to use first generation hybrid seed (Table 12 and Figure 26). According to Crop Forecast Surveys, the percentage of households using first generation maize seed has increased from 42% in 2001 to 65% in 2011. This is the result of both public investment in FISP, but more importantly the development of a competitive local seed industry in Zambia.
Table 12. Percent Area under Maize by Seed Type and Year, 2002-2011, Zambia
year local seed
recycled hybrid seed
first generation hybrid seed
open pollinated seed
2002 49.0 9.2 41.8 .0 2003 55.1 8.7 36.3 .0 2004 56.0 3.1 40.7 .2 2005 49.9 4.7 44.7 .7 2006 44.7 5.8 49.1 .4 2007 42.7 3.1 53.6 .6 2008 44.4 5.6 49.5 .5 2009 36.6 5.7 57.3 .4 2010 33.9 3.6 62.3 .2 2011 30.2 4.3 65.1 .3
Source: Crop Forecast Survey, MAL and CSO 2002-2011.
Local seed
Recycled hybrid
First generation (F1) hybrid
Open pollinated varieties (OPV)
Improved seed Not stated
households growing
Maize 45.0 3.5 54.8 0.1 0.0 0.0 1,188,504 Sunflower 59.6 9.7 28.9 1.3 0.0 0.5 101,181 Groundnuts 78.4 3.5 17.9 0.2 0.0 0.0 660,962 Soyabeans 76.9 9.7 12.9 0.3 0.0 0.3 58,540 Seed cotton 0.0 0.0 97.1 0.0 0.0 2.9 184,286 Virginia tobacco 0.0 0.0 80.5 0.0 0.0 19.5 4,211 Burley tobacco 0.0 0.0 90.3 0.0 0.0 9.7 11,906 Sweet potato-white/yellow 99.1 0.0 0.0 0.0 0.0 0.9 249,995
Sweet potato-orange 100.0 0.0 0.0 0.0 0.0 0.0 4,959 Other crop 95.3 1.5 1.9 0.0 1.9 1.3 454,662 Cassava 70.6 0.0 0.0 0.0 30.5 0.2 514,470

24
Figure 26. Trends in First Generation Hybrid Maize Seed Use, % of Smallholder Households
Source: Crop Forecast Survey, MAL and CSO, 2002-2011.
5.3. Value of Production, Sales and Trade Trends
Raising agricultural production and productivity remains crucial for economic growth. In countries such as Zambia where the poor are concentrated in rural areas, it will also contribute significantly to poverty reduction. However, in Zambia the value of agricultural production remains very low.
• As shown in Figure 27, the gross value of smallholder crop production has trended upward since 2007/08. There are a number of factors underpinning this growth, the most important of which has been the favorable weather pattern that has predominated over that time. The growth in crop revenue has coincided with an increase in the percent of maize’s contribution to the gross value of crop production. Since 2004/05, the percent of maize to the total gross value of crop production has increased from 25% to 56% in 2011/12. This is a result of increased government support for maize production and output markets. The worrying implication of this trend is the loss of household level and national level crop diversification that it implies.
Figure 27. Total Gross Value (Constant 2011 ZMK) of Crops and Share of Maize to Total Gross Value of Crops per Agricultural HH, 2000/01-2011/12
Source: Crop Forecast Survey, MAL and CSO 2000-2011.
0
20
40
60
80
2002 2003 2004 2005 2006 2007 2008 2009 2010 2011
% h
ouse
hold
s
010203040506070
00.20.40.60.8
11.21.41.61.8
% of m
aize to total crop production
Gro
ss V
alue
of
Crop
Pro
duct
ion
per H
H (K
'mill
ion,
con
stan
t pric
es)
Crop Year (Oct-Sep
Total gross value of crops % of maize to gross value of crops

25
Figure 28. Mean Gross Value (Constant 2011 ZMK) of Expected Production per Small/medium-scale Agricultural Household, 2000/01-2011/12
Source: Crop Forecast Survey, MAL and CSO 2000-2011.
• Figure 28 presents the mean gross value (constant 2011 ZMK) of expected production per small/medium-scale agricultural household at constant 2011 prices. The mean value for all crops is less than 2 Million Kwacha. The value for maize is higher than that for all the other crops, due in part to output subsides and the large share of total farm area dedicated to maize. There has been an increasing trend in the value since 2007/08.
• In terms of market participation, a considerable proportion of the small- and medium-scale agricultural households are net buyers, another proportion are neither sell nor buy. As a result, most small- and medium-scale farmers have not able to take advantage of the FRA high maize prices. In a typical good farming season such as 2007/08, 49% of the small and medium scale households were net buyers, 28% were net sellers and 23% were neither sellers nor buyers. In a record harvest year, 2011/12, 28% were net buyers (Figure 29). Within the net seller category, surplus production is highly concentrated, with 50% of the surplus being produced by 3-5% of the smallholder population, depending on the year.
Figure 29. Market Participation, Smallholder Households, 2007, 2012
Source: 2008 CSO/MAL/FSRP Supplemental Survey. Source: 2012 CSO/MAL/IAPRI RALS12.
00.20.40.60.8
11.21.41.61.8
Gro
ss V
alue
of
Crop
Pro
duct
ion
per H
H
(K'm
illio
n, c
onst
ant 2
011
pric
es)
Crop Year (Oct-Sep)
Total gross value of crops 12 crops excluding maize Maize
Net sellers 28%
Neither buys nor sells 23%
Net buyers
49%
0% 0% 0% 0% 0%
2007/08 (good year)
Net sellers 42%
Neither buys nor sells 30%
Net buyers
28%
0% 0% 0% 0% 0%
2011/12 (bumper harvest)

26
• Zambia’s policy on export of grain has at best been unpredictable, characterized by implicit and explicit bans on exports. Data show that the country has only ever exported significant amounts of maize in 2007 and 2008, when quantities of nearly 200,000 MT are reported (Figure 30). Imports of maize have been very low since 2000. Zambia is self sufficient in wheat requirements. Since 2005, imports have been decreasing to nearly zero in 2010 (Figure 31).
Figure 30. Maize Import and Export, in Tons, Zambia, 1990-2010
Source: FAOSTAT, FAO of the UN, Accessed on March 12, 2013. http://faostat3.fao.org/home/index.html#VISUALIZE Figure 31. Wheat Import and Export in Tons, Zambia, 1990-2010
Source: FAOSTAT, FAO of the UN, Accessed on March 12, 2013. http://faostat3.fao.org/home/index.html#VISUALIZE
0
100,000
200,000
300,000
400,000
500,000
600,000
700,000
800,000
1990
1991
1992
1993
1994
1995
1996
1997
1998
1999
2000
2001
2002
2003
2004
2005
2006
2007
2008
2009
2010
Tons
Year
export
import
0
20000
40000
60000
80000
100000
120000
1990
1991
1992
1993
1994
1995
1996
1997
1998
1999
2000
2001
2002
2003
2004
2005
2006
2007
2008
2009
2010
Tons
Year
export
import

27
5.4. Crop Diversity
The importance of crop diversification cannot be emphasized enough. Dependence on rain fed agriculture is the main cause of the variation in food production. This is amplified by the reliance on maize as the main staple food in a drought prone southern part of the country. Crop diversification comes with it diversified income and nutritional sources as wells reduced risk in the case of crop failure and poor market conditions.
• The Simpson Diversity Index provides a means for measuring household-level crop diversification. It takes into account the proportionate of a household’s total area that is dedicated to each crop ranging. It can therefore range from between zero and one. As a household becomes more diversified the index moves towards one. Table 13 shows trends in Simpson Index figures over time by province. It shows that over all crop diversifications remains low throughout the country, with limited variability from 2004 to 2012.
• Most of small- and medium-scale households cultivate one to four crops. The highest proportion cultivates two crops. About 27% of households cultivated two crops only 4% cultivated over seven crops (Figure 32).
Table 13. The Simpsons Index by Province Zambia, 2004 -2012
Year
2004 2008 2012 Central .44 .33 .38
Copperbelt .38 .26 .27 Eastern .46 .44 .45 Luapula .31 .30 .39 Lusaka .21 .14 .21 Muchinga - - .52 Northern .55 .46 .52 NorthWestern .43 .30 .38 Southern .30 .27 .30 Western .40 .30 .38 Zambia .42 .35 .40
Source: 2012 CSO/MAL/IAPRI RALS12 and 2008 CSO/MAL/FSRP Supplemental Survey Figure 32. Percent Households by Number of Crops Grown Zambia, 2011
Source: 2012 CSO/MAL/IAPRI Rural Agricultural Livelihoods Survey.
20.1
26.9 24.4
15
6.3 2.3 0.8
4.2
0
5
10
15
20
25
30
1 2 3 4 5 6 7 >7
% H
H
Number of Crops

28
Table 14. Simpson’s Crop Diversification Index by Province, Zambia, 2012 Specialized Diversified
Mean Percentile 25 Median Percentile 75
Central 0.41 0.2 0.48 0.61 Copperbelt 0.3 0 0.32 0.5 Eastern 0.47 0.38 0.5 0.63 Luapula 0.43 0.29 0.5 0.62 Lusaka 0.21 0 0.09 0.44 Muchinga 0.54 0.44 0.62 0.7 Northern 0.54 0.46 0.62 0.7 NorthWestern 0.4 0.23 0.46 0.58 Southern 0.31 0.09 0.33 0.5 Western 0.42 0.32 0.49 0.59 Total 0.42 0.24 0.49 0.63 Source: 2012 CSO/MAL/IAPRI Rural Agricultural Livelihoods Survey.
• The least diversified provinces are Lusaka and Copperbelt provinces. The most diversified are Muchinga and Northern provinces. Both have an index of 0.54 (Table 14).
5.5. Gross Margins
Gross margins are a simple tool used to describe the returns to different crops, and are calculated as the difference between sales revenue and variable production costs. For these calculations, variable costs included fertilizer and seed costs, for which data were available. Gross margins are expressed as returns to a unit of land. In this case the gross margins are returns in US$ per hectare ($/ha). The exchange rate of 5020.32 ZMK to 1 US$ was used to convert the values into US$. They provide a useful way of assessing the relative attractiveness of different crops to farmers.
• Table 15 presents estimates of the mean gross margins for the major crops grown in Zambia. Gross margins are low in general with maize averaging $457/ha at national level. The tobacco crops give the highest returns on a hectare of land planted, followed by cotton, mixed beans and maize. Sunflower provides the lowest returns. Farmers in Muchinga Province had the highest return on maize ($538/ha) and burley tobacco ($1,887/ha), on average. Farmers in Western Province, had on average the lowest returns on maize ($276/ha). These low margins are due primarily to low yields, but are also the result of high input costs, transport costs, and market prices.

29
Table 15. Mean Gross Margins ($/ha) by Crop by Province, Zambia, 2012
Source: 2012 CSO/MAL/IAPRI Rural Agricultural Livelihoods Survey.
Crop
Maize Sunflower Groundnuts Soyabeans Seed Cotton
Virginia Tobacco
Burley Tobacco
Mixed Beans
Sweet Potato - white or yellow-fleshed
Sweet Potato - orange fleshed
Central 442.4 103.9 259.5 393.2 306.7 1354.4 1234.4 620.9 375.4 219.1
Copperbelt 405.0 159.3 514.0 479.51 84.6 . . 481.75 577.5 .
Eastern 509.2 243.4 299.3 371.3 640.2 1,307.4 674.6 1,123 194.9 78.28
Luapula 439.0 822.6 436.4 464.9 . . . 113.2 322.1 190.1
Lusaka 485.1 182.9 494.5 561.5 814.9 . . 2,073 361.0 806.9
Muchinga 538.1 196.3 419.7 421.8 . . 1,887 626.4 222.3 165.7
Northern 446.9 117.9 460.0 311.0 . . . 370.5 194.6 27.6
NorthWestern 503.5 125.2 434.8 493.2 . . 204.1 . 376.3 .
Southern 414.8 214.9 228.7 191.3 1,443 980.8 120.8 . 329.9 80.9
Western 276.5 . 329.2 185.2 . 1,159.2 . . 401.7 .
Zambia 457.6 226.5 371.4 384.6 687.7 1,229.0 749.6 465.8 356.6 231.24
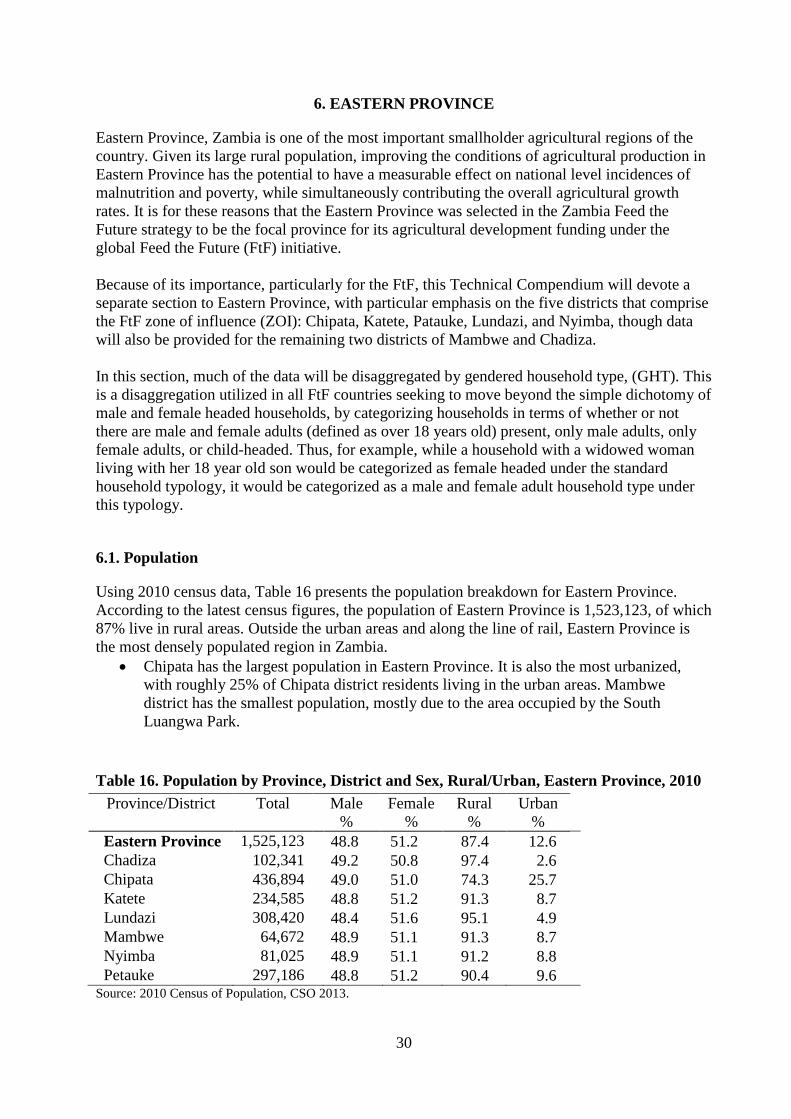
30
6. EASTERN PROVINCE
Eastern Province, Zambia is one of the most important smallholder agricultural regions of the country. Given its large rural population, improving the conditions of agricultural production in Eastern Province has the potential to have a measurable effect on national level incidences of malnutrition and poverty, while simultaneously contributing the overall agricultural growth rates. It is for these reasons that the Eastern Province was selected in the Zambia Feed the Future strategy to be the focal province for its agricultural development funding under the global Feed the Future (FtF) initiative. Because of its importance, particularly for the FtF, this Technical Compendium will devote a separate section to Eastern Province, with particular emphasis on the five districts that comprise the FtF zone of influence (ZOI): Chipata, Katete, Patauke, Lundazi, and Nyimba, though data will also be provided for the remaining two districts of Mambwe and Chadiza. In this section, much of the data will be disaggregated by gendered household type, (GHT). This is a disaggregation utilized in all FtF countries seeking to move beyond the simple dichotomy of male and female headed households, by categorizing households in terms of whether or not there are male and female adults (defined as over 18 years old) present, only male adults, only female adults, or child-headed. Thus, for example, while a household with a widowed woman living with her 18 year old son would be categorized as female headed under the standard household typology, it would be categorized as a male and female adult household type under this typology.
6.1. Population
Using 2010 census data, Table 16 presents the population breakdown for Eastern Province. According to the latest census figures, the population of Eastern Province is 1,523,123, of which 87% live in rural areas. Outside the urban areas and along the line of rail, Eastern Province is the most densely populated region in Zambia.
• Chipata has the largest population in Eastern Province. It is also the most urbanized, with roughly 25% of Chipata district residents living in the urban areas. Mambwe district has the smallest population, mostly due to the area occupied by the South Luangwa Park.
Table 16. Population by Province, District and Sex, Rural/Urban, Eastern Province, 2010
Province/District Total Male %
Female %
Rural %
Urban %
Eastern Province 1,525,123 48.8 51.2 87.4 12.6 Chadiza 102,341 49.2 50.8 97.4 2.6 Chipata 436,894 49.0 51.0 74.3 25.7 Katete 234,585 48.8 51.2 91.3 8.7 Lundazi 308,420 48.4 51.6 95.1 4.9 Mambwe 64,672 48.9 51.1 91.3 8.7 Nyimba 81,025 48.9 51.1 91.2 8.8 Petauke 297,186 48.8 51.2 90.4 9.6 Source: 2010 Census of Population, CSO 2013.
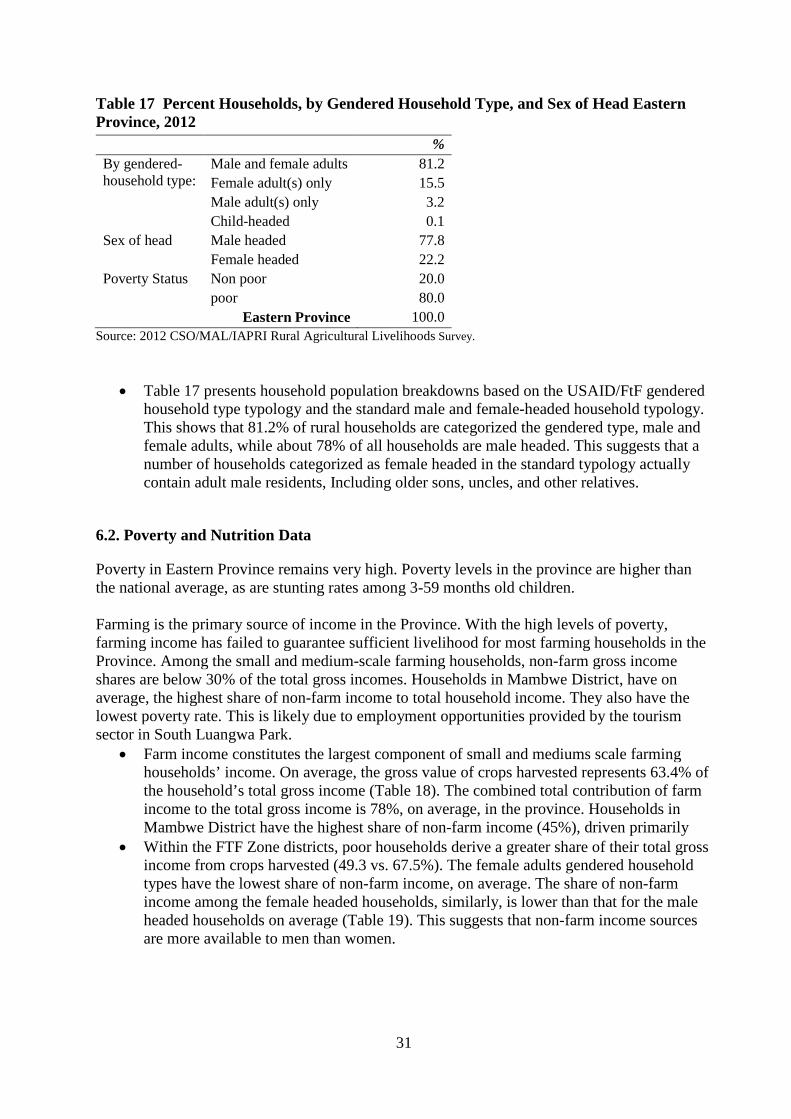
31
Table 17 Percent Households, by Gendered Household Type, and Sex of Head Eastern Province, 2012 % By gendered-household type:
Male and female adults 81.2 Female adult(s) only 15.5 Male adult(s) only 3.2 Child-headed 0.1
Sex of head Male headed 77.8 Female headed 22.2 Poverty Status Non poor 20.0 poor 80.0
Eastern Province 100.0 Source: 2012 CSO/MAL/IAPRI Rural Agricultural Livelihoods Survey.
• Table 17 presents household population breakdowns based on the USAID/FtF gendered household type typology and the standard male and female-headed household typology. This shows that 81.2% of rural households are categorized the gendered type, male and female adults, while about 78% of all households are male headed. This suggests that a number of households categorized as female headed in the standard typology actually contain adult male residents, Including older sons, uncles, and other relatives.
6.2. Poverty and Nutrition Data
Poverty in Eastern Province remains very high. Poverty levels in the province are higher than the national average, as are stunting rates among 3-59 months old children. Farming is the primary source of income in the Province. With the high levels of poverty, farming income has failed to guarantee sufficient livelihood for most farming households in the Province. Among the small and medium-scale farming households, non-farm gross income shares are below 30% of the total gross incomes. Households in Mambwe District, have on average, the highest share of non-farm income to total household income. They also have the lowest poverty rate. This is likely due to employment opportunities provided by the tourism sector in South Luangwa Park.
• Farm income constitutes the largest component of small and mediums scale farming households’ income. On average, the gross value of crops harvested represents 63.4% of the household’s total gross income (Table 18). The combined total contribution of farm income to the total gross income is 78%, on average, in the province. Households in Mambwe District have the highest share of non-farm income (45%), driven primarily
• Within the FTF Zone districts, poor households derive a greater share of their total gross income from crops harvested (49.3 vs. 67.5%). The female adults gendered household types have the lowest share of non-farm income, on average. The share of non-farm income among the female headed households, similarly, is lower than that for the male headed households on average (Table 19). This suggests that non-farm income sources are more available to men than women.

32
Table 18. Percent Contribution to Total Gross Income, Eastern Province, 2012
crops harvested
vegetable-fruit
production Livestock
sale (ZMK))
Livestock home
consumption (ZMK)
livestock products (ZMK)
Off-farm income (ZMK)
Chadiza 69.7 10.8 3.4 1.3 1.1 13.7 Chipata 54.5 10.4 2.5 1.0 1.9 29.7 Katete 65.5 5.9 4.2 1.3 .8 22.3 Lundazi 63.2 15.2 1.9 .3 .8 18.5 Mambwe 44.8 6.7 2.0 .9 .6 45.1 Nyimba 81.2 3.1 1.0 1.6 .8 12.3 Petauke 69.7 8.8 2.7 1.1 .5 17.1 Total 63.4 9.9 2.6 1.0 1.1 22.1
Source: 2012 CSO/MAL/IAPRI Rural Agricultural Livelihoods Survey. Table 19. Percent Contribution to Total Gross Income by GHT, Poverty Sex of Head, FTF Zone, 2011
crops harvested
vegetable-fruit
production Livestock
sale (ZMK)
Livestock home
consumption (ZMK)
livestock products (ZMK)
Off-farm income (ZMK)
Gendered household type
Male and female adults
63.2 10.5 2.5 .8 1.1 21.9
Female adult(s) only
67.5 8.0 3.2 1.4 1.2 18.7
Male adult(s) only 61.4 8.0 1.7 .7 .3 27.8 Child-headed 49.3 1.4 .0 12.4 .2 36.6
Poverty Not Poor 49.3 8.3 1.8 .6 1.6 38.6 Poor 67.5 10.4 2.8 1.0 1.0 17.3
sex of head Male headed 62.8 10.6 2.4 .7 1.1 22.5 Female headed 67.5 7.7 3.4 1.9 1.1 18.3
Source: 2012 CSO/MAL/IAPRI Rural Agricultural Livelihoods Survey
• By disaggregating per capita income into percentile groups and means several important observations emerge. First, per capita income among smallholder households in the FtF zone of influence, at the mean and median, are substantially lower than the national average across all household types (aside from child headed for which few observations are available). Second, at the mean and median, female only households are poorer than those comprised of male and female adults and male adults only households. Finally, the mean per capita income for most household types is similar to, or higher, than income at the 75th percentile. This suggests that means are being substantially skewed by a small number of relatively wealthy households (Table 20).
• The statistics from the Central Statistical Office indicate that 78% of all persons in the province are poor (Figure 33). This is higher than the national rate of 60.5%. Among the districts, Katete has the highest rate where over 85% are poor.
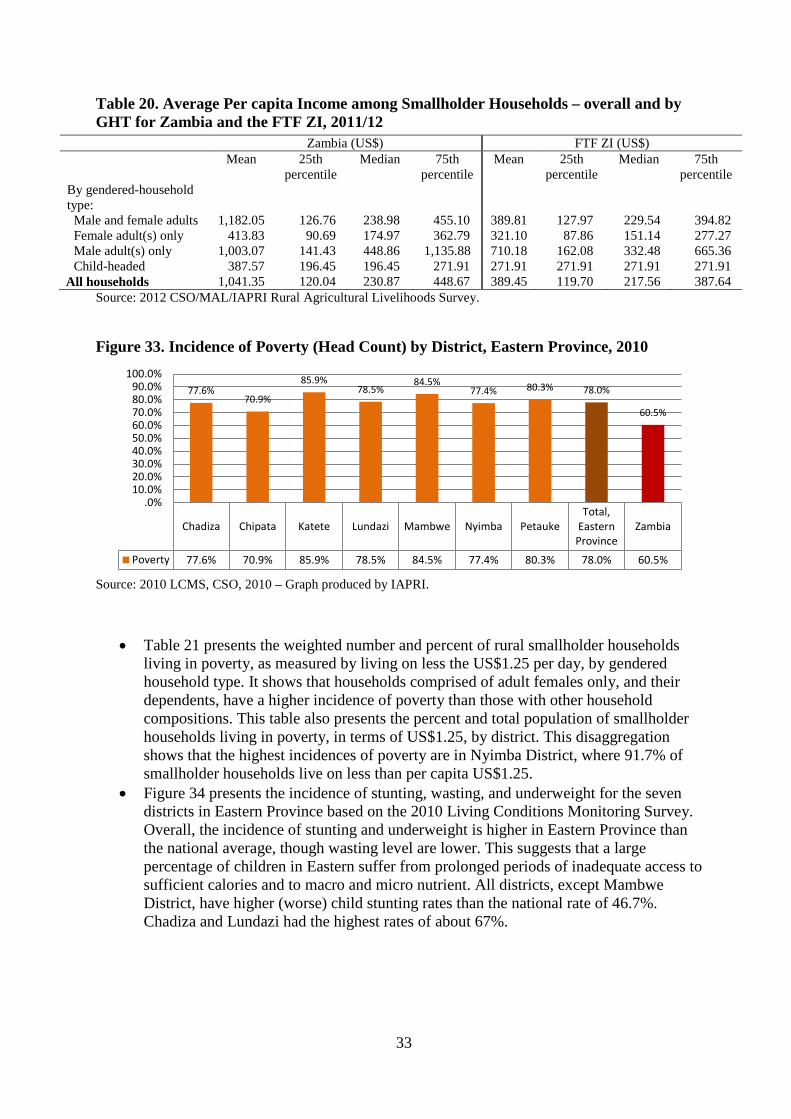
33
Table 20. Average Per capita Income among Smallholder Households – overall and by GHT for Zambia and the FTF ZI, 2011/12
Zambia (US$) FTF ZI (US$) Mean 25th
percentile Median 75th
percentile Mean 25th
percentile Median 75th
percentile By gendered-household type:
Male and female adults 1,182.05 126.76 238.98 455.10 389.81 127.97 229.54 394.82 Female adult(s) only 413.83 90.69 174.97 362.79 321.10 87.86 151.14 277.27 Male adult(s) only 1,003.07 141.43 448.86 1,135.88 710.18 162.08 332.48 665.36 Child-headed 387.57 196.45 196.45 271.91 271.91 271.91 271.91 271.91 All households 1,041.35 120.04 230.87 448.67 389.45 119.70 217.56 387.64
Source: 2012 CSO/MAL/IAPRI Rural Agricultural Livelihoods Survey. Figure 33. Incidence of Poverty (Head Count) by District, Eastern Province, 2010
Source: 2010 LCMS, CSO, 2010 – Graph produced by IAPRI.
• Table 21 presents the weighted number and percent of rural smallholder households living in poverty, as measured by living on less the US$1.25 per day, by gendered household type. It shows that households comprised of adult females only, and their dependents, have a higher incidence of poverty than those with other household compositions. This table also presents the percent and total population of smallholder households living in poverty, in terms of US$1.25, by district. This disaggregation shows that the highest incidences of poverty are in Nyimba District, where 91.7% of smallholder households live on less than per capita US$1.25.
• Figure 34 presents the incidence of stunting, wasting, and underweight for the seven districts in Eastern Province based on the 2010 Living Conditions Monitoring Survey. Overall, the incidence of stunting and underweight is higher in Eastern Province than the national average, though wasting level are lower. This suggests that a large percentage of children in Eastern suffer from prolonged periods of inadequate access to sufficient calories and to macro and micro nutrient. All districts, except Mambwe District, have higher (worse) child stunting rates than the national rate of 46.7%. Chadiza and Lundazi had the highest rates of about 67%.
Chadiza Chipata Katete Lundazi Mambwe Nyimba PetaukeTotal,
EasternProvince
Zambia
Poverty 77.6% 70.9% 85.9% 78.5% 84.5% 77.4% 80.3% 78.0% 60.5%
77.6% 70.9%
85.9% 78.5%
84.5% 77.4% 80.3% 78.0%
60.5%
.0%10.0%20.0%30.0%40.0%50.0%60.0%70.0%80.0%90.0%
100.0%

34
Table 21. Prevalence of Poverty: Percent of Smallholder Households Living on Per capita Income of Less than $1.25/day, Eastern Province, 2012
Percent poor
By gendered-household type:
Male & female adults 79.8 Female adult(s) only 85.4 Male adult(s) only 60.5 Child-headed 100.0
District Chadiza 87.8 Chipata 75.6 Katete 79.4 Lundazi 76.9 Mambwe 73.1 Nyimba 91.7 Petauke 85.1
Eastern Province 80.0 Source: 2012 CSO/MAL/IAPRI Rural Agricultural Livelihoods Survey. Note: * Poverty rate defined as the proportion of households living below US$1.25/day/capita (using 2005 PPP exchange rate). Figure 34. Incidence of Stunting, Underweight and Wasting of Children (3-59 Months) by District, Eastern Province, 2010
Source: 2010 LCMS, CSO 2010 – Graph produced by IAPRI. 6.3. Cropping and Production Data
With nearly 90% of the population living in the rural areas, the role of agriculture for poverty reduction is critical. Eastern Province has above national average poverty levels and above national average stunting rates. This is despite the fact that nearly 23% of the maize produced in the country during the 2010/11 season was produced by small and medium scale households from the province.
• Most of reported agricultural land is cultivated followed by land left fallow. The trend is the same at national, provincial, and FTF Zone (Table 22).
chadiza Chipata Katete Lundazi Mambwe Nyimba Petauke EasternProvince Zambia
stunted 66.9% 48.1% 54.0% 67.5% 39.7% 62.6% 56.5% 56.3% 46.7%
wasting .1% 3.2% 3.3% 3.0% 9.0% .4% 4.7% 3.3% 13.3%
underweight 18.5% 14.3% 12.3% 12.9% 12.3% 14.4% 15.1% 14.1% 6.0%
66.9%
48.1% 54.0%
67.5%
39.7%
62.6% 56.5% 56.3%
46.7%
.0%
10.0%
20.0%
30.0%
40.0%
50.0%
60.0%
70.0%
80.0%

35
Table 22. Land Use by Type, Zambia, Eastern Province, FTF Zone, 2011
Zambia Eastern Province
FtF Zone
own cultivated field 73.7 74.6 75.4 garden 5.5 7.2 6.4 fallow natural/improved 10.4 6.0 5.8 virgin land 6.1 7.4 7.4 other specified 4.3 4.7 4.9 Total fields 100.0 100.0 100.0
Source: 2012 CSO/MAL/IAPRI Rural Agricultural Livelihoods Survey.
• Table 23 shows that female only adults have the lowest access to land, on average. Looking at the FtF zone, households have access to 2.56 ha.
• Production levels, at household level of the different crops are generally low. A household in the FtF Zone harvested, on average, 2.42 tons of maize, and less than one ton of each of the other crops listed in Table 24.
Table 23. Average Land Access and Use (ha) by Type, Gendered HH Type and Poverty, FTF Zone, 2011
Land holding size
(all land accessed)
Total land holding size
(less rented in, borrowed in)
Landholding size (all
cultivated land plus fallow)
own cultivated field (ha)
Land cultivated
Male and female adults 2.71 2.62 2.17 1.99 1.99 Female adult(s) only 1.79 1.71 1.44 1.34 1.36 Male adult(s) only 2.54 2.41 2.04 1.76 1.76 Child-headed 2.19 2.06 1.19 1.06 1.19 Non Poor 3.95 3.74 3.20 2.97 2.96 Poor 2.21 2.15 1.76 1.62 1.61 Total 2.56 2.47 2.05 1.89 1.89
Source: 2012 CSO/MAL/IAPRI Rural Agricultural Livelihoods Survey
Table 24. Average Production (MT) per Household by Crop, GHT, Poverty, FTF Zone, 2012
Maize Sunflower Groundnuts Soya beans
Seed Cotton
Sweet potato; white/yellow
Sweet Potato - orange
Male and female adults 2.6 0.21 0.18 0.34 0.83 0.39 0.29
Female adult(s) only 1.45 0.16 0.14 0.32 0.6 0.45 .
Male adult(s) only 2.54 0.3 0.16 0.35 0.77 0.31 0.78 Child-headed 1.03 . 0.05 . . . . Non poor 5.54 .30 .28 .57 1.27 .47 .54 Poor 1.62 .17 .15 .23 .67 .37 .22 All households 2.42 0.2 0.18 0.34 0.81 0.39 0.3
Source: 2012 CSO/MAL/IAPRI Rural Agricultural Livelihoods Survey.

36
• The low production is partly due to small area cultivated. On average, a household in the FtF Zone cultivated 1.06 ha of maize in 2010/2011 agricultural season. The Female only adults cultivated less land than the other GHT households, for all crops (Table 25).
• As shown in Table 26 households, in the FTF Zone with female adults produce on average a lower yield of all crops, aside from a minor difference in groundnuts, than male and female households.
• Table 27 shows smallholder maize production trends in Eastern Province between 2000/01 and 2011/12. During that time period total area cropped with maize grew by over 100,000 hectares. At the same time maize yields have increased, from 1.3 MT/ha to 2.0 MT/ha. In total maize production has grown from roughly 200,000 MT to over 550,000 MT.
Table 25. Average Area Cultivated (ha) per Household by Crop, GHT, Poverty, FTF Zone, 2012
Maize Sunflower Groundnuts Soya beans
Seed cotton
Sweet potato;
white/yellow
Sweet potato - Orange
Male & female adults 1.11 0.38 0.41 0.44 0.90 0.22 0.17
Female adult(s) only 0.81 0.35 0.35 0.38 0.72 0.29 .
Male adult(s) only 1.15 0.61 0.36 0.60 1.08 0.23 0.20 Child-headed 1.00 . 0.13 . . . . Non poor 1.73 0.50 0.45 0.67 1.18 0.23 0.21 Poor 0.89 0.34 0.38 0.33 0.80 0.22 0.16 All households 1.06 0.38 0.40 0.44 0.89 0.23 0.17
Source: 2012 CSO/MAL/IAPRI Rural Agricultural Livelihoods Survey. Table 26. Average Yield (MT/ha) by Crop, GHT, Poverty, FTF Zone, 2012 Maize Rice Sun-
flower Ground-
nuts Soy-beans
Seed cotton
Sweet potato - white or yellow
Sweet potato
- orange
Gendered household type
Male & female adults
2.40 2.06 .64 .49 .90 1.08 2.07 1.88
Female adult(s) only 1.93 .99 .41 .45 .79 .94 3.93 . Male adult(s) only 1.99 3.03 .56 .44 .74 .90 1.43 3.87 Child-headed 1.04 . . .38 . . . .
Poverty Status*
Not poor 3.18 2.49 .73 .64 1.08 1.37 3.23 2.91 Poor 2.09 1.92 .57 .44 .80 .98 1.82 1.57
2.31 2.04 .61 .48 .89 1.06 2.18 1.91 Source: 2012 CSO/MAL/IAPRI Rural Agricultural Livelihoods Survey. * Per capita income below the $1.25/day poverty line (=1; 2005 PPP exchange rate).

37
Table 27. Agricultural Households and Maize Area Planted, Quantity Harvested, and Yields, Eastern Province, 2000/01-2011/12
Agricultural year
Total # of agricultural
HHs
Maize area planted (ha) Maize quantity harvested
Provincial maize yield
(kg/ha planted) Total Mean HH Total (MT) Mean HH
(MT) 2000/01 179,862 162,392 0.90 197,578 1.10 1,316 2001/02 185,924 153,757 0.83 174,720 0.94 1,122 2002/03 190,162 158,001 0.83 201,101 1.06 1,261 2003/04 198,738 147,107 0.74 215,579 1.08 1,506 2004/05 206,719 153,997 0.74 131,966 0.64 929 2005/06 214,137 164,542 0.77 234,432 1.09 1,403 2006/07 227,460 179,355 0.79 195,327 0.86 1,082 2007/08 235,267 192,953 0.82 270,777 1.15 1,327 2008/09 230,681 219,083 0.95 312,019 1.35 1,385 2009/10 225,512 216,975 0.96 413,225 1.83 1,921 2010/11 226,113 229,547 1.02 433,547 1.92 1,846 2011/12 265,755 276,444 1.04 569,407 2.14 2,002 Source: Crop Forecast Survey, MAL and CSO 2000-2011.
• Figure 35 presents production trends for other key crops in the province. Production growth has been particularly pronounced for commercial cash crops grown under out-grower systems, such as cotton and tobacco. Sweet potatoes have also shown steady growth over the same time period. Between 2009/10 and 2011/12 production of mixed beans, groundnuts, soybeans and sunflower show decline. This decline coincides with a ramping up of government spending on maize subsidies. This suggests that some of the maize expansion was coming at the expense of other crops.
• Looking at the FTF Zone, we see that 15% of the fields in households with both male and female adults are controlled by women. This figure is slightly different from the standard definition of headedness, where roughly 8% of fields in male headed households are controlled by women. Overall all, over 70% of the fields are controlled by men (Table 28).
Figure 35. Production Trends of Selected Major Crops, Eastern Province, 2000/01 - 2011/12
Source: Crop Forecast Survey, MAL and CSO, 2000-2011.
0100000200000300000400000500000600000700000
tons
Sweet potato
Tobacco
Seed cotton
Mixed beans
soyabeans
groundnut
sunflower

38
Table 28. Land Use by Sex of Decision Maker, GHT, FTF Zone, 2011
sex of who decided use of field
Male Female Male and Female
Gendered household type Male and female adults 81.9 14.9 3.2 Female adult(s) only 1.5 98.5 0.0 Male adult(s) only 91.5 0.5 8.1
sex of head Male 88.0 8.3 3.6 Female 3.2 96.8 0.0
Poverty status Non poor 75.8 19.4 4.8 Poor 69.4 28.2 2.4
FtF Zone 70.8 26.4 2.9 Source: 2012 CSO/MAL/IAPRI Rural Agricultural Livelihoods Survey.
Tables 29 to 33 present results from the RALS regarding intra-household decision making by sex within Male and Female Gender Household Type.
• Table 29 shows an important finding that the women in the FtF zone appear to exercise less decision making autonomy over field use in different types of fields in male/female adult HHs.
• A similar pattern emerges when looking at sale of crops. However, within a HH with both male and female adults, women exercise relatively more decision making control over the sale of groundnuts, and soyabeans. In 26% of the cases, women decided whether or not to sell soyabeans as well as groundnuts in the FtF Zone. The women have greater control than the men over the sale of orange fleshed sweet potatoes (Table 30).
Table 29. Intra-household Decision Making by Sex within Male and Female Gender Household Type: Percent Distribution of Land Use by Gendered HH Type, Sex of Decision Maker, FtF Zone, 2011
sex of who decided use of field
Male Female Male and Female own cultivated field 85.4 12.1 2.5 garden 91.6 4.5 4.0 fallow natural/improved 89.3 7.5 3.2 virgin land 90.0 7.2 2.8 Other specified 80.7 11.4 7.8 All fields, FtF Zone 86.2 10.9 2.9
Source: 2012 CSO/MAL/IAPRI Rural Agricultural Livelihoods Survey.

39
Table 30. Intra-household Decision Making by Sex within Male and Female Gender Household Type: Percent Distribution of Decision to Sell by Sex of Decision Maker for Male and Female GHT, FtF Zone, 2011
sex of who decided sale of crop
Male Female Male and Female
Maize 80.6 14.2 5.3 Sunflower 74.4 20.3 5.3 Groundnuts 69.8 26.5 3.7 Soyabeans 67.2 26.2 6.6 Sweet Potato - white or yellow-fleshed
74.2 13.6 12.2
Sweet Potato - orange fleshed 42.1 57.9 .0 FtF Zone, FtF Crops 75.6 19.4 5.0
Source: 2012 CSO/MAL/IAPRI Rural Agricultural Livelihoods Survey.
• Table 31 shows that within the male and female adult households, men have more control over the sale of livestock, making more than 80% of the decision for all livestock. However, for chickens, women fair much better, making 32% of all decisions.
• Table 32 shows that in cases where women decide to sell cattle, they are likely to sell more than men. With the other livestock, men are likely to sell slightly more than women.
• Women have decision over larger incomes realized from the sale of livestock (Table 33). • Figure 36 shows the contribution of Eastern Province production to national production
of key crops. In total, Eastern accounted for 22.9% of total maize produced during the 2010/11 agricultural season. Eighty-seven percent of all Burley Tobacco was produced by households in Eastern Province, 75% of sunflower, 27% of groundnuts, and 23% of sweet potatoes.
Table 31. Intra-household Decision Making by Sex within Male and Female Gender Household Type: Percent Distribution of Decision Maker by Livestock, FtF Zone, 2011
sex of who decided sale of livestock
Male Female Male and Female Cattle 88.9 7.3 3.7 Goats 82.9 13.4 3.7 Pigs 84.6 12.0 3.3 Sheep 88.2 5.9 5.9 Village chickens 64.0 32.3 3.6
Source: 2012 CSO/MAL/IAPRI Rural Agricultural Livelihoods Survey.

40
Table 32. Intra-household Decision Making by Sex within Male and Female Gender Household Type: Average Number Sold by Decision Maker by Livestock, FtF Zone, 2011
sex of who decided sale of livestock
Male Female Male and Female Cattle 1.9 4.3 1.3 Goats 2.7 2.6 1.6 Pigs 3.1 2.5 2.6 Sheep 2.3 . . Village chickens 6.2 5.8 4.9
Source: 2012 CSO/MAL/IAPRI Rural Agricultural Livelihoods Survey. Table 33. Intra-household Decision Making by Sex within Male and Female Gender Household Type: Average Income from Sales (ZMK) by Revenue Use Decision Maker by Livestock, FtF Zone, 2011
sex of who decided use of revenue from sale of livestock
Male Female Male and Female Cattle 2,452,542 2,693,846 2,675,000 Goats 276,149 341,091 233,333 Pigs 459,282 433,462 323,500 Sheep 140,000 400,000 . Village chickens 85,469 84,549 78,938
Source: 2012 CSO/MAL/IAPRI Rural Agricultural Livelihoods Survey. Figure 36. Production in Eastern Province as a Percentage of the Total Production in Zambia, 2011
Source: 2012 CSO/MAL/IAPRI Rural Agricultural Livelihoods Survey. 6.4. Tillage Methods
Smallholder farmers practice a variety of land preparation practices, which differ by income status, gendered household type, and crop.
• Table 34 shows that the majority of households in the FtF Zone use conventional hand hoeing as a method of tillage. About 35% of households growing maize use hand hoeing as the main tillage method. The row percentages may add to more than 100% because of
22.9%
74.3%
27.0% 34.4%
57.8%
31.5%
84.7%
4.7% 2.5% 23.0%
0.0%10.0%20.0%30.0%40.0%50.0%60.0%70.0%80.0%90.0%
100.0%

41
possible use of more than one tillage method for a crop by a household. Yet ox drawn ploughing is also widespread in the Province.
• Ripping, a key conservation farming practice is not widely adopted in the province. Katete District shows the level of ripping adoption (Table 35)
• Table 36 presents tillage method by gendered household type and poverty status. It shows that poor households are more likely to use hand hoeing than non-poor households. Female only households are more reliant on hand hoeing than households with male and female adults.
Table 34. Percent Households Using Tillage Method by Crop, FTF Zone (Minus Chadiza, Mambwe), Eastern Province, 2011
conventional hand hoeing
zero tillage
ploughing ripping ridging before
planting
bunding mounding
Maize 34.9 3.2 31.4 0.7 29.9 0.0 0.4 Sunflower 26.5 1.0 37.4 0.8 33.8 0.0 0.5 Groundnuts 30.4 0.8 36.4 0.5 31.2 0.0 0.7 Soyabeans 20.1 0.2 11.5 1.8 66.1 0.0 0.3 Seed cotton 31.6 1.8 30.0 0.8 35.6 0.0 0.3 Sweet potato – white/yellow
36.0 0.0 14.2 1.3 19.0 18.0 11.5
Sweet potato – orange
56.1 0.0 0.0 0.0 43.9 0.0 0.0
other 38.2 2.4 14.9 0.0 32.9 7.4 3.9 Source: 2012 CSO/MAL/IAPRI Rural Agricultural Livelihoods Survey. Table 35. Percent Households Using Tillage Method by District, Eastern Province, 2012
conventional hand hoeing
zero tillage
ploughing ripping ridging before
planting
bunding mounding
Chadiza 2.1 0.1 27.3 0.1 73.1 2.7 0.0 Chipata 54.1 0.4 17.9 0.5 36.8 0.4 0.3 Katete 36.2 4.8 51.6 1.3 20.1 1.2 0.6 Lundazi 29.2 3.1 12.4 1.2 70.3 2.4 2.7 Mambwe 82.7 8.3 15.5 0.0 5.6 0.0 0.0 Nyimba 54.6 2.5 46.0 0.1 3.7 0.1 1.6 Petauke 30.1 7.2 56.7 0.8 13.1 0.1 0.5 Eastern 38.3 3.5 32.0 0.8 36.4 1.1 1.0 Source: 2012 CSO/MAL/IAPRI Rural Agricultural Livelihoods Survey.
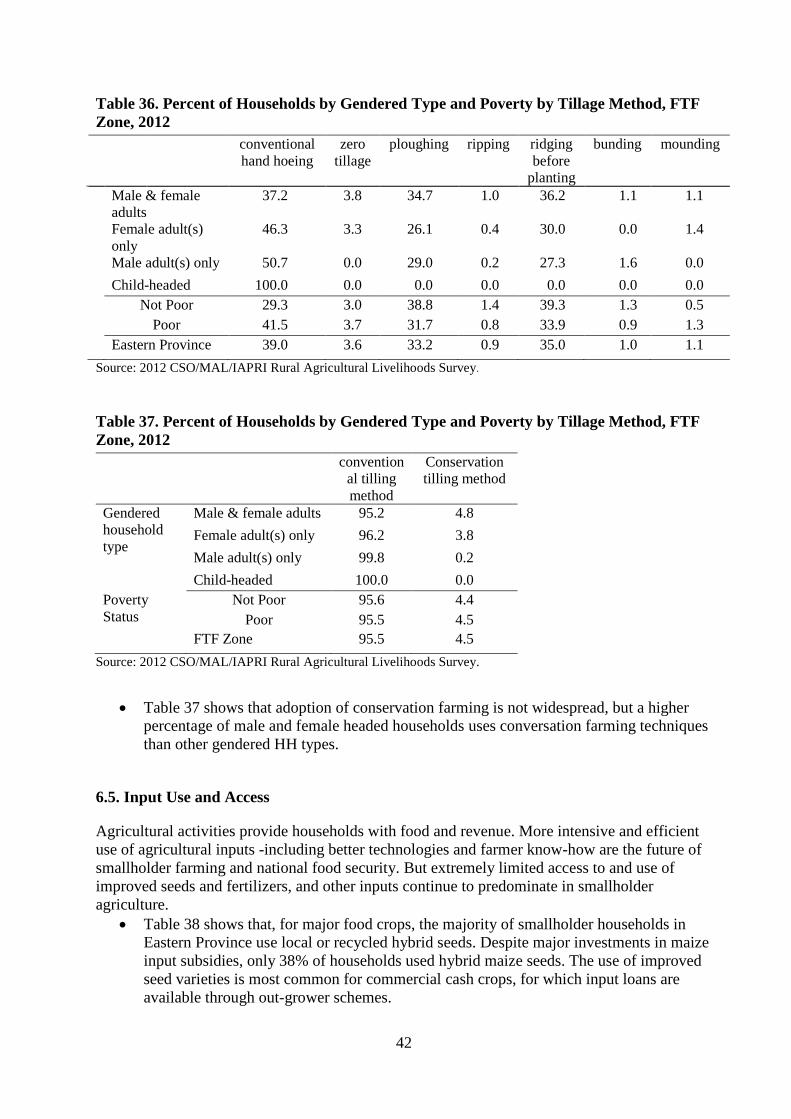
42
Table 36. Percent of Households by Gendered Type and Poverty by Tillage Method, FTF Zone, 2012
conventional hand hoeing
zero tillage
ploughing ripping ridging before
planting
bunding mounding
Male & female adults
37.2 3.8 34.7 1.0 36.2 1.1 1.1
Female adult(s) only
46.3 3.3 26.1 0.4 30.0 0.0 1.4
Male adult(s) only 50.7 0.0 29.0 0.2 27.3 1.6 0.0 Child-headed 100.0 0.0 0.0 0.0 0.0 0.0 0.0
Not Poor 29.3 3.0 38.8 1.4 39.3 1.3 0.5 Poor 41.5 3.7 31.7 0.8 33.9 0.9 1.3
Eastern Province 39.0 3.6 33.2 0.9 35.0 1.0 1.1 Source: 2012 CSO/MAL/IAPRI Rural Agricultural Livelihoods Survey. Table 37. Percent of Households by Gendered Type and Poverty by Tillage Method, FTF Zone, 2012
conventional tilling method
Conservation tilling method
Gendered household type
Male & female adults 95.2 4.8 Female adult(s) only 96.2 3.8 Male adult(s) only 99.8 0.2 Child-headed 100.0 0.0
Poverty Status
Not Poor 95.6 4.4 Poor 95.5 4.5
FTF Zone 95.5 4.5 Source: 2012 CSO/MAL/IAPRI Rural Agricultural Livelihoods Survey.
• Table 37 shows that adoption of conservation farming is not widespread, but a higher percentage of male and female headed households uses conversation farming techniques than other gendered HH types.
6.5. Input Use and Access
Agricultural activities provide households with food and revenue. More intensive and efficient use of agricultural inputs -including better technologies and farmer know-how are the future of smallholder farming and national food security. But extremely limited access to and use of improved seeds and fertilizers, and other inputs continue to predominate in smallholder agriculture.
• Table 38 shows that, for major food crops, the majority of smallholder households in Eastern Province use local or recycled hybrid seeds. Despite major investments in maize input subsidies, only 38% of households used hybrid maize seeds. The use of improved seed varieties is most common for commercial cash crops, for which input loans are available through out-grower schemes.

43
Table 38. Percent Households by Crop by Seed Type, Eastern Province, 2010/11
local seed
recycled hybrid seed
first generation hybrid seed
open pollinated
seed improved
seed Not
stated Maize 65.9 3.6 38.0 .0 .0 .0
Sunflower 63.4 4.9 30.0 .8 .0 .8 Groundnuts 49.6 2.7 47.5 .2 .0 .0 Soyabeans 64.9 18.8 16.3 .0 .0 .0 Seed cotton .0 .0 95.3 .0 .0 4.7 Virginia tobacco .0 .0 92.3 .0 .0 7.7 Burley tobacco .0 .0 84.4 .0 .0 15.6 Sweet potato-white/yellow
96.7 .0 .0 .0 .0 3.3
Sweet potato-orange 100.0 .0 .0 .0 .0 .0 Other crop 80.7 .0 .8 .0 6.5 13.8 Cassava 34.8 .0 .0 .0 65.2 .0
Source: 2012 CSO/MAL/IAPRI Rural Agricultural Livelihoods Survey. Table 39. Percent Households that Planted Maize by Seed Type, Year, Eastern Province 2002-2011
Year
Seed type
local Recycled
hybrid hybrid OPV 2006 75.8% 6.5% 17.2% .5%
2007 78.3% 3.7% 17.6% .5% 2008 75.5% 6.1% 17.7% .7% 2009 69.9% 3.2% 26.4% .5% 2010 63.9% 3.3% 32.6% .2% 2011 58.0% 3.7% 37.2% 1.0%
Source: Crop Forecast Survey, MAL and CSO, 2000-2011.
• Table 39 presents the trends in seed type for maize between 2006 and 2011. It shows that although hybrid seed use at a household level is still low, it has increased substantially over time, from 14% to 37%.
• At the district-level hybrid maize seed use is highest in Chipata District, at 51%, and lowest in Mambwe (Table 40).
• Table 41 shows that female only households are less likely to use hybrid maize seed than those with male and female adults. Within household with male and female adults, males are more likely to use hybrid or improved seeds on their fields than females.
• Table 42 shows the source of seed by seed type. It shows that for maize seed, which is heavily subsidized by the government, private retailers are still a more important source of seed than the government.

44
Table 40. Percent Households by Maize Seed Type, Districts, Eastern Province, 2010/11 Local
seed Recycled
hybrid First
generation (F1) hybrid
Open poll. varieties (OPV)
Improved seed
Not stated
Chadiza 76.9 .0 46.4 .0 .0 .0 Chipata 54.0 3.5 51.4 .1 .0 .0 Katete 74.7 3.3 34.0 .0 .0 .0 Lundazi 58.4 5.1 37.7 .0 .0 .0 Mambwe 70.6 1.7 28.8 .0 .0 .0 Nyimba 57.9 7.6 36.3 .0 .0 .0 Petauke 68.9 3.8 31.8 .0 .0 .0 Total Province 65.9 3.6 38.0 .0 .0 .0
Source: 2012 CSO/MAL/IAPRI Rural Agricultural Livelihoods Survey. Table 41. Seed Use by Type, Crop, Sex of Decision Maker, FtF Zone, 2011
local/recycled Hybrid/OPV/Improved
Male Female
Male and
Female Male Female Male and Female
Maize Male and female adults
81.6 14.9 3.5 86.5 10.1 3.4
Female adult(s) only .8 99.2 .0 4.6 95.4 .0 Sunflower Male and female
adults 80.2 17.0 2.8 85.4 11.5 3.1
Female adult(s) only .0 100.0 .0 .0 100.0 .0 Groundnuts Male and female
adults 78.1 19.6 2.3 79.1 18.2 2.7
Female adult(s) only .0 100.0 .0 2.6 97.4 .0 Source: 2012 CSO/MAL/IAPRI Rural Agricultural Livelihoods Survey. Table 42. Number of Households Reporting Source of Seed by Crop, FTF Zone Private
retailer Own
harvest Gov’t
FSP/Food Pack
Friends/ Relatives
NGO*
Research organizations
Other
Maize 21.4 36.7 15.0 14.0 0.4 0.2 16.5 Sunflower 10.3 56.2 0.3 27.7 0.2 0.5 4.8 Groundnut 7.1 65.0 0.2 24.7 0.4 0.3 2.3 Soyabean 7.1 56.1 0.3 27.1 1.0 0.7 7.7 Sweet potato – w/y 0.8 55.2 0.1 40.3 0.3 0.3 3.2 Sweet potato - orange
3.0 35.9 0.0 56.7 0.0 4.4 0.0
Source: 2012 CSO/MAL/IAPRI Rural Agricultural Livelihoods Survey. *Non-governmental Organization.

45
Table 43. Percent Households that Used Fertilizer for Maize, GHT, Poverty, FtF Zone, District, 2012 District
GHT Poverty Status
All households
Male and female adults
Female adult(s) only
Male adult(s) only
Child-headed
Non poor Poor
Chadiza 85.3 57.8 54 0 86 79.9 80.6 Chipata 82.1 87.5 53.1 0 93.7 78 81.9 Katete 56.8 49.8 21.1 0 84.4 46.3 54.2 Lundazi 55.5 33.1 41.1 0 76.1 45 52.2 Mambwe 29.8 8.5 0 0 42.2 19.3 25.4 Nyimba 39.3 24.6 12.9 100 76.8 33.7 37.3 Petauke 31.2 29.1 7.3 0 69.4 23.1 30.0 FtF Zone 56.5 50.4 29.6 100 82.4 47.6 54.8 Eastern 57.6 48.9 30.1 100 80.4 49.2 55.4
Source: 2012 CSO/MAL/IAPRI Rural Agricultural Livelihoods Survey.
• Looking at Eastern Province and the FtF Zone, fertilizer application on maize is low. Only 55.4% of all households that planted maize applied some fertilizer. The Male adults only gendered HH type show the lowest use of fertilizer (Table 43).
• Table 44 shows that throughout the FTF Zone, households with only female adults apply considerably less fertilizer than male and female adult households for maize. These figures are below the national average.
Table 44. Mean Total Fertilizer Use per Household (kg/HH), by Gendered hhd Status, Poverty and Sex of Head, FTF Zone, Eastern Province, 2012
Main crop or use of this field in the 2010/11 season
Maize Soyabeans Seed cotton Virginia tobacco
Burley tobacco Mixed beans
Gendered household type
Male & female adults 443.71 28.33 130.56 175.00 323.51 100.00 Female adult(s) only 277.77 50.00 . . 300.00 . Male adult(s) only 576.09 . . 200.00 400.00 . Child-headed 100.00 . . . . .
Poverty Non-poor 681.31 25.00 153.57 150.00 522.22 116.67 Poor 255.81 36.67 50.00 225.00 215.30 50.00
sex of head Male headed 455.87 28.33 130.56 180.00 324.57 100.00 Female headed 285.59 50.00 . . 312.50 . Total 427.75 33.75 130.56 180.00 323.63 100.00
Source: 2012 CSO/MAL/IAPRI Rural Agricultural Livelihoods Survey. Note: Fertilizer was not applied to groundnuts, sunflower, or sweet potato.

46
6.6. Crop Sales Data
This section examines sales patterns in Eastern Province by crop type. Nearly 60% of all households that planted maize in Zambia in 2010/11 agricultural season sold some of their harvest. Over half (51.1%) in Eastern Province and 53% in the FtF ZOI reported selling some of the maize they produced. A high proportion of small and medium-scale farmers are net buyers of the staple food, maize. Net buyers are a category of households that spend more on purchases than they earned on the sale of maize.
• Figure 37 shows that in 2011, 28.1% of all small and medium scale farming households were net buyers of maize. In the FtF Zone in Eastern Zambia, 22.3% of the farming households were net buyers.
• Table 45 shows that percent of all maize grain harvested by small and medium-scale farming HH is retained for own purposes in the FtF Zone. The highest percentage of retention (76.2%) is among the female adults only household type. Female headed households retain a higher percentage of the grain than male-headed ones and so are poor households against non-poor households.
Figure 37. Household Marketing Position of Maize, Zambia FTF Zone, 2011
Source: 2012 CSO/MAL/IAPRI Rural Agricultural Livelihoods Survey. Table 45. Average Retention Rate of Maize Harvested by GHT, Sex of Head, Poverty Status, FtF Zone, 2011
Gendered household type Sex of head Poverty status Male & female adults
Female adult(s)
only
Male adult(s)
only Child-headed
Male headed
Female headed Non Poor Poor
Chipata 66.4 80.1 73.0 . 66.2 79.0 60.5 71.4 Katete 58.1 72.1 66.7 . 57.4 71.2 39.4 66.6 Lundazi 62.8 74.2 59.8 . 62.3 72.9 45.8 69.8 Nyimba 64.8 75.4 68.1 60.5 62.8 77.8 38.8 68.8 Petauke 65.2 78.1 62.2 . 64.6 75.0 39.1 71.9 FtF Zone 63.6 76.2 66.1 60.5 63.1 74.9 48.2 70.1
Source: 2012 CSO/MAL/IAPRI Rural Agricultural Livelihoods Survey.
Net seller (value ofsales>value of purchases)
Autarkic (zero purchases,zero sales)
Net buyer (value ofsales<value of purchases)
Zambia 41.8% 30.1% 28.1%
FTF Zone 48.6% 29.2% 22.3%
0.0%
10.0%
20.0%
30.0%
40.0%
50.0%
60.0%
%
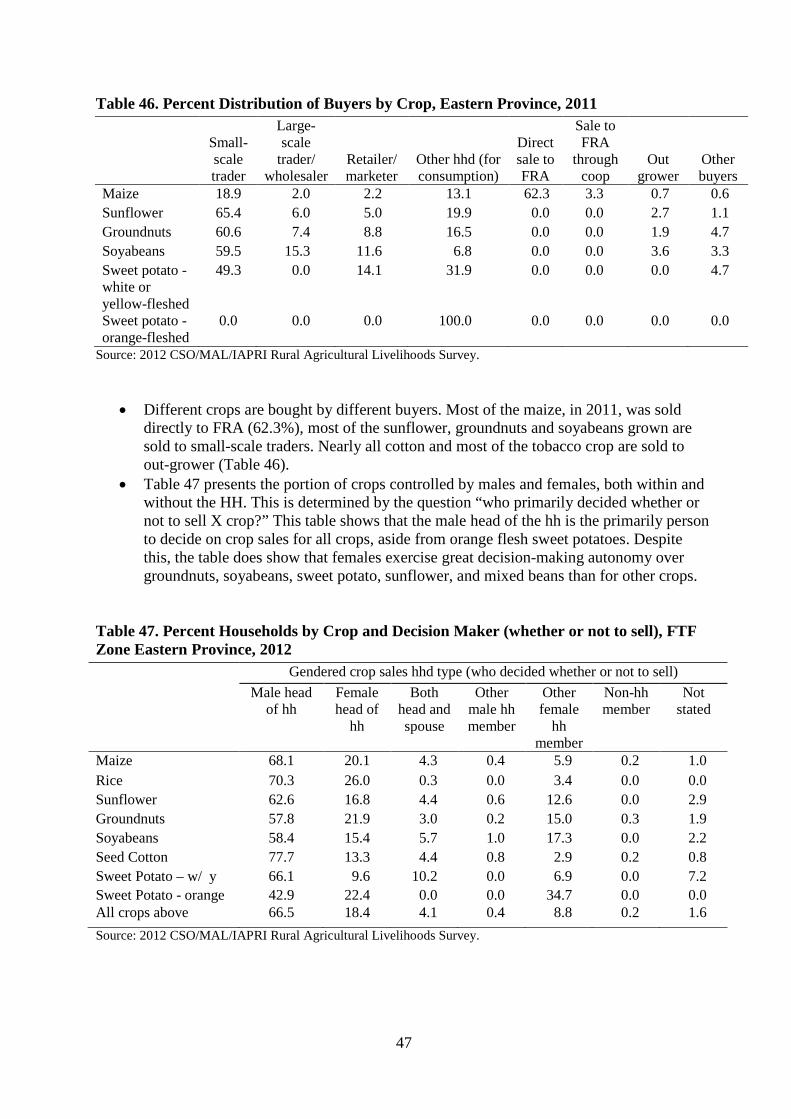
47
Table 46. Percent Distribution of Buyers by Crop, Eastern Province, 2011
Small-scale trader
Large-scale
trader/ wholesaler
Retailer/marketer
Other hhd (for consumption)
Direct sale to FRA
Sale to FRA
through coop
Out grower
Other buyers
Maize 18.9 2.0 2.2 13.1 62.3 3.3 0.7 0.6 Sunflower 65.4 6.0 5.0 19.9 0.0 0.0 2.7 1.1 Groundnuts 60.6 7.4 8.8 16.5 0.0 0.0 1.9 4.7 Soyabeans 59.5 15.3 11.6 6.8 0.0 0.0 3.6 3.3 Sweet potato - white or yellow-fleshed
49.3 0.0 14.1 31.9 0.0 0.0 0.0 4.7
Sweet potato - orange-fleshed
0.0 0.0 0.0 100.0 0.0 0.0 0.0 0.0
Source: 2012 CSO/MAL/IAPRI Rural Agricultural Livelihoods Survey.
• Different crops are bought by different buyers. Most of the maize, in 2011, was sold directly to FRA (62.3%), most of the sunflower, groundnuts and soyabeans grown are sold to small-scale traders. Nearly all cotton and most of the tobacco crop are sold to out-grower (Table 46).
• Table 47 presents the portion of crops controlled by males and females, both within and without the HH. This is determined by the question “who primarily decided whether or not to sell X crop?” This table shows that the male head of the hh is the primarily person to decide on crop sales for all crops, aside from orange flesh sweet potatoes. Despite this, the table does show that females exercise great decision-making autonomy over groundnuts, soyabeans, sweet potato, sunflower, and mixed beans than for other crops.
Table 47. Percent Households by Crop and Decision Maker (whether or not to sell), FTF Zone Eastern Province, 2012
Gendered crop sales hhd type (who decided whether or not to sell) Male head
of hh Female head of
hh
Both head and spouse
Other male hh member
Other female
hh member
Non-hh member
Not stated
Maize 68.1 20.1 4.3 0.4 5.9 0.2 1.0 Rice 70.3 26.0 0.3 0.0 3.4 0.0 0.0 Sunflower 62.6 16.8 4.4 0.6 12.6 0.0 2.9 Groundnuts 57.8 21.9 3.0 0.2 15.0 0.3 1.9 Soyabeans 58.4 15.4 5.7 1.0 17.3 0.0 2.2 Seed Cotton 77.7 13.3 4.4 0.8 2.9 0.2 0.8 Sweet Potato – w/ y 66.1 9.6 10.2 0.0 6.9 0.0 7.2 Sweet Potato - orange 42.9 22.4 0.0 0.0 34.7 0.0 0.0 All crops above 66.5 18.4 4.1 0.4 8.8 0.2 1.6 Source: 2012 CSO/MAL/IAPRI Rural Agricultural Livelihoods Survey.

48
6.7. Gross Margins
Gross margins are used to describe the returns to different crops, and are calculated as the difference between sales revenue and variable production costs. Variable costs included only fertilizer and seed costs, for which data were available. Even without other variable costs, the margin levels are very low. Gross margins are expressed as returns to a unit of land. In this case the gross margins are returns in US$ per hectare ($/ha). They provide a useful way of assessing the relative attractiveness of different crops to farmers.
• Table 48 presents estimates of the mean gross margins for the major crops grown in Eastern Province. Gross margins are low in general with maize averaging $509/ha at Provincial level and 510.1 in the FTF Zone. The tobacco crops give the highest returns on a hectare of land planted, followed by cotton, mixed beans and maize. Sunflower provides the lowest returns. Farmers in Mambwe District had the highest return on maize ($786.6/ha) and burley tobacco ($1,887/ha), on average. Farmers in Chadiza, had on average the lowest returns on maize ($417/ha) (Table 48).
• Male headed households had higher returns than female headed ones. The poor households had poorer returns for all crops. Among the gendered household type, the male and female adults household had the highest gross margins on all crops and maize in particular (Table 49).
Table 48. Gross Margins ($/ha) by Crop by District, Eastern Province, 2012 Maize Sunflower Ground-
nuts Soybeans Mixed
Beans Sweet Potato –w/y
Sweet Potato - orange
Chadiza 417.8 116.2 236.3 302.5 211.49 220.3 . Chipata 457.5 352.3 312.6 429.5 798.54 197.7 259.4 Katete 498.2 248.3 346.3 183.0 1,593 328.9 . Lundazi 577.0 199.8 291.9 389.2 1,519 139.7 . Mambwe 786.6 337.8 417.1 . . -.44 . Nyimba 510.3 685.3 247.4 . . 323.7 . Petauke 514.6 264.9 278.4 186.4 . 52.5 219.1 Total 509.1 243.3 299.2 371.3 1,123 194.9 78.2
Source: 2012 CSO/MAL/IAPRI Rural Agricultural Livelihoods Survey. Table 49. Gross Margins by Crop by Gendered Household Type, Poverty Status, and Sex of Head, FTF Zone, Eastern Province, 2012 (US$/ha)
Maize Sunflower
Ground-nuts Soybeans
Mixed Beans
Sweet Potato –
w/y
Sweet Potato orange
Gendered household type
Male and female adults 524.3 278.5 305.4 378.6 1,218.1 208.05 78.28 Female adult(s) only 403.7 178.5 280.6 382.5 . 183.26 . Male adult(s) only 489.4 213.7 276.8 1160.5 . 122.04 . Child-headed 153.4 . . . . . .
sex of head
Male headed 518.6 269.9 311.6 398.5 1,218.1 196.95 20.31 Female headed 467.6 239.2 266.4 291.5 . 183.26 560.68
Poverty Status
Not Poor 662.8 354.3 396.7 508.2 920.0 202.42 370.48 Poor 437.4 226.1 273.7 319.8 1,593.5 191.70 3.22 FTF Zone 510.1 265.1 301.2 382.7 1,218.1 195.29 78.28
Source: 2012 CSO/MAL/IAPRI Rural Agricultural Livelihoods Survey

49
6.8. Crop Diversification
Crop diversification is important in ensuring food security, income diversification, and enhanced nutritional sources for producers. Diversification also reduces risk in the case of crop failure and poor market.
• Most of small- and medium-scale households in the FTF Zone, cultivate one to four crops. The highest proportion cultivates two crops. About 30% of households cultivated two crops only five cultivated over seven crops (Figure 38).
• Table 50 shows the common combination of the FTF crops in Eastern Province. Overall, 35% of all households grow a combination of maize and groundnuts. Maize is grown by 29.1% of all households as the only crop; about 18% grow a combination of maize, sunflower, and groundnuts.
Figure 38. Percent Households by Number of Crops Grown Zambia and FTF Zone, 2012
Source: 2012 CSO/MAL/IAPRI Rural Agricultural Livelihoods Survey. Table 50. Percent Distribution of Households by FTF Crops by District, Eastern Province, 2012
District
crop combination
Maize only
Maize and groundnuts
Maize, sunflower & groundnuts
Maize and sunflower
Maize, groundnuts, soyabeans
Maize, sunflower,
groundnuts, soyabeans
Other combinations
Chadiza 19.6 28.5 22.5 10.4 1.1 8.0 9.9 Chipata 24.8 41.4 22.9 3.0 1.0 2.3 4.6 Katete 32.1 36.2 18.0 7.4 1.3 1.0 3.9 Lundazi 27.4 25.5 12.5 3.4 6.4 6.1 18.9 Mambwe 37.0 46.9 4.3 2.2 .0 .2 9.5 Nyimba 30.5 39.3 16.5 3.6 .0 .0 10.1 Petauke 35.0 37.0 18.8 6.7 .1 .3 2.2 Eastern 29.1 35.3 17.7 5.1 2.0 2.8 8.1
Source: 2012 CSO/MAL/IAPRI Rural Agricultural Livelihoods Survey.
1 2 3 4 5 6 7 >7Zambia 20.1 26.9 24.4 15 6.3 2.3 0.8 4.2FTF Zone 25 29.7 22.4 11.8 4.2 1.4 0.4 5.1
0
5
10
15
20
25
30
35
% h
hds
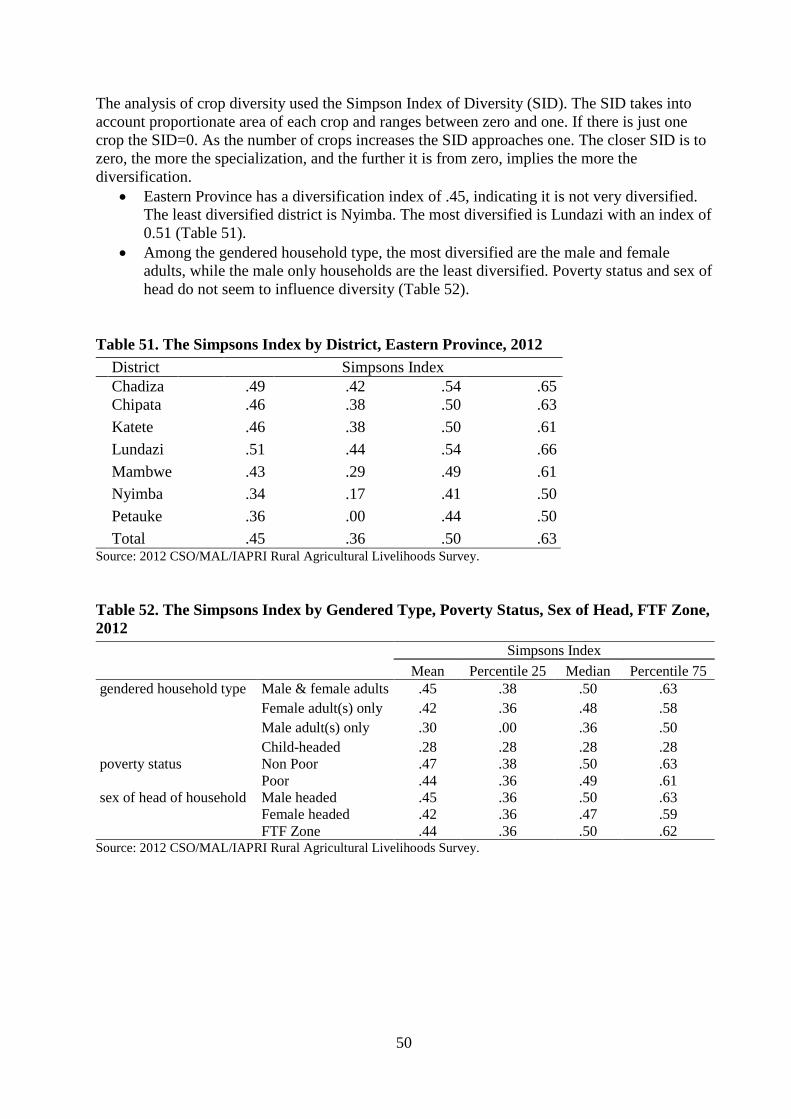
50
The analysis of crop diversity used the Simpson Index of Diversity (SID). The SID takes into account proportionate area of each crop and ranges between zero and one. If there is just one crop the SID=0. As the number of crops increases the SID approaches one. The closer SID is to zero, the more the specialization, and the further it is from zero, implies the more the diversification.
• Eastern Province has a diversification index of .45, indicating it is not very diversified. The least diversified district is Nyimba. The most diversified is Lundazi with an index of 0.51 (Table 51).
• Among the gendered household type, the most diversified are the male and female adults, while the male only households are the least diversified. Poverty status and sex of head do not seem to influence diversity (Table 52).
Table 51. The Simpsons Index by District, Eastern Province, 2012 District Simpsons Index Chadiza .49 .42 .54 .65
Chipata .46 .38 .50 .63 Katete .46 .38 .50 .61 Lundazi .51 .44 .54 .66 Mambwe .43 .29 .49 .61 Nyimba .34 .17 .41 .50 Petauke .36 .00 .44 .50 Total .45 .36 .50 .63
Source: 2012 CSO/MAL/IAPRI Rural Agricultural Livelihoods Survey. Table 52. The Simpsons Index by Gendered Type, Poverty Status, Sex of Head, FTF Zone, 2012
Simpsons Index
Mean Percentile 25 Median Percentile 75 gendered household type Male & female adults .45 .38 .50 .63
Female adult(s) only .42 .36 .48 .58 Male adult(s) only .30 .00 .36 .50 Child-headed .28 .28 .28 .28
poverty status Non Poor .47 .38 .50 .63 Poor .44 .36 .49 .61
sex of head of household Male headed .45 .36 .50 .63 Female headed .42 .36 .47 .59 FTF Zone .44 .36 .50 .62
Source: 2012 CSO/MAL/IAPRI Rural Agricultural Livelihoods Survey.

51
APPENDICES

52
APPENDIX I. EASTERN PROVINCE
Table 1. Mean Total Fertilizer Use per Household (Kg/HH), by Crop, District, Eastern Province, 2012 Maize Soyabeans Seed
cotton Virginia tobacco Burley tobacco Mixed beans
Chadiza 400.33 0. 250.00 311.75 260.00 50.00 Chipata 319.33 37.50 50.00 100.00 342.80 100.00 Katete 431.60 30.00 81.25 183.33 0. 50.00 Lundazi 429.13 0 250.00 0 216.67 150.00 Mambwe 358.75 0 0 0 400.00 0 Nyimba 510.00 0 0 0 0. 0 Petauke 627.04 0 0 250.00 500.00 0 Total 421.53 33.75 152.27 285.40 304.54 90.00
Source: 2012 CSO/MAL/IAPRI Rural Agricultural Livelihoods Survey. Note: Fertilizer was not applied to groundnuts, sunflower, or sweet potato. Table 2. Mean Total Fertilizer Use per Household (Kg/HH), by Gendered HHd Status, Poverty and Sex of Head, Eastern Province, 2012
Main crop or use of this field in the 2010/11 ag season
Maize Soyabeans Seed cotton Virginia tobacco Burley tobacco Mixed beans Gendered household type Male & female adults 435.08 28.33 152.27 297.05 306.36 90.00
Female adult(s) only 285.24 50.00 . 200.00 287.50 .
Male adult(s) only 550.00 . . 200.00 275.00 .
Child-headed 100.00 . . . . . Poverty Non-poor 684.77 25.00 153.57 460.00 482.14 100.00
Poor 257.59 36.67 150.00 169.00 200.94 50.00 Headed Male headed 446.39 28.33 152.27 237.95 307.79 90.00
Female headed 296.30 50.00 . 633.33 266.67 .
Total 421.53 33.75 152.27 285.40 304.54 90.00 Source: 2012 CSO/MAL/IAPRI Rural Agricultural Livelihoods Survey. Note: Fertilizer was not applied to groundnuts, sunflower, or sweet potato. Table 3. Average Yield (MT/Ha) by Crop, District Eastern Province, 2012 Maize Rice Sunflower Groundnuts Soyabean Seed
cotton Sweet
potato - white or yellow fleshed
Sweet potato - orange fleshed
Chadiza 1.64 .71 .41 .40 .85 1.02 1.58 .85 Chipata 2.15 .76 .54 .54 .93 1.02 2.80 2.94 Katete 1.84 .45 .56 .48 .63 1.18 2.36 1.25 Lundazi 2.61 2.59 .62 .44 .91 .92 2.03 1.66 Mambwe 1.71 1.43 .66 .62 1.21 1.43 2.15 . Nyimba 2.30 .65 .57 .48 .39 1.22 2.51 1.46 Petauke 2.57 .52 .73 .45 .39 1.18 1.04 1.05 Total 2.24 1.76 .59 .48 .88 1.08 2.12 1.81
Source: 2012 CSO/MAL/IAPRI Rural Agricultural Livelihoods Survey.

53
Table 4. Area Cultivated (ha), Percentage by Crop, District Eastern Province, 2012
Total Land cultivated
(ha)
Maize
Sunflower
Groundnuts
Soyabean
Sweet
potato – y/w
Sweet
potato -orange
Seed cotton
Tobacco
Mixed beans
Other crops
Chadiza 41,658 57.8 9.9 10.4 3.0 0.6 0.1 12.9 3.6 0.7 1.0 Chipata 116,149 53.2 5.2 15.2 0.5 0.3 0.1 20.3 3.5 0.9 0.9 Katete 87,128 58.8 6.0 9.3 0.4 0.4 0.0 23.9 0.3 0.5 0.4
Lundazi 122,572 45.6 6.2 12.2 5.5 0.8 0.1 25.0 0.7 1.3 2.5 Mambwe 15,190 50.8 1.5 10.0 0.0 0.3 28.4 0.2 0.3 8.5 Nyimba 24,027 71.1 5.5 14.5 0.0 0.7 0.2 7.1 0.0 0.8 Petauke 86,742 66.1 6.2 14.0 0.0 0.2 0.0 12.5 0.0 0.4 0.4 Eastern 493,466 55.8 6.0 12.6 1.8 0.5 0.1 19.8 1.4 0.8 1.3
Source: 2012 CSO/MAL/IAPRI Rural Agricultural Livelihoods Survey.
Table 5. Average Area Cultivated (Ha) by Crop, District Eastern Province, 2012
Total Land
holding size
Total Land cultivated
(ha)
Maize Sun flower
Ground nuts
Soybean Sweet potato - white or yellow
Sweet potato - orange
Seed cotton
Tobacco (Virginia &
Burley)
Mixed beans
Chadiza 3.50 2.19 1.27 .47 .37 .43 .25 .20 .72 .48 .25 Chipata 2.34 1.84 .98 .31 .39 .24 .20 .15 .96 .63 .23 Katete 2.73 2.05 1.20 .43 .32 .31 .24 .25 .78 .46 .28 Lundazi 2.90 2.07 .97 .41 .46 .49 .25 .18 1.01 .59 .36 Mambwe 2.18 1.31 .72 .29 .24 .20 .16 . .79 .61 .41 Nyimba 2.47 1.73 1.24 .41 .41 .13 .18 .15 .48 . .19 Petauke 1.95 1.66 1.10 .39 .41 .16 .19 .25 .81 .81 .22 Eastern 2.54 1.88 1.06 .39 .39 .44 .23 .18 .87 .57 .28
Source: 2012 CSO/MAL/IAPRI Rural Agricultural Livelihoods Survey. Table 6. Quantity Harvested (MT) by Crop, District Eastern Province, 2012 Maize Sunflower Groundnuts Soyabeans Seed
Cotton Virginia Tobacco
Burley Tobacco
Mixed Beans
Sweet Potato - white or yellow-fleshed
Sweet Potato - orange fleshed
Chadiza 42,608.48 1,425.33 1,624.7 1,078.4 4,977.7 574.8 1,478.2 189.8 421.4 28.5 Chipata 135,434.5 3,113.10 9,115.6 438.3 19,790.8 260.7 4,474.1 643.8 557.7 203.3 Katete 102,711.3 2,439.07 3,910.0 237.4 22,949.0 293.5 132.1 760.8 31.5 Lundazi 139,779.6 4,066.21 5,483.6 5,319.7 23,471.6 949.11 875.5 1,665.0 146.7 Mambwe 14,703.3 113.78 933.8 4.3 5,493.4 32.46 22.9 91.2 Nyimba 34,375.8 664.94 1,457.0 0.7 1,802.8 8.9 301.1 68.0 Petauke 142,987.8 3,191.25 4,854.7 7.1 11,723.6 16.9 60.38 55.6 179.7 38.6 Eastern 612,600.7 15,013.70 27,379.4 7,085.9 90,209.2 1,146.0 6,994.3 1,929 3,977.0 516.5
Source: Rural Agriculture and Livelihoods Survey, IAPRI 2012.

54
Table 7. Average Quantity Harvested (MT) By A Household by Crop, Eastern Province, 2012 Maize Sunflower Groundnuts Soyabeans Seed
Cotton Virginia Tobacco
Burley Tobacco
Mixed Beans
Sweet Potato -
white yellow
Sweet Potato - orange
Chadiza 2.24 .16 .14 .37 .67 .41 .83 .17 .43 .17 Chipata 2.16 .16 .20 .18 .81 .93 .72 .15 .34 .43 Katete 2.41 .20 .16 .21 .86 .59 . .09 .51 .31 Lundazi 2.43 .22 .17 .38 .77 . .62 .19 .43 .26 Mambwe 1.37 .14 .15 .25 1.00 . .64 .22 .34 . Nyimba 2.49 .21 .17 .05 .50 . . .18 .33 .19 Petauke 2.74 .23 .16 .04 .88 .89 3.16 .04 .20 .26 Eastern 2.37 .20 .17 .34 .81 .52 .73 .15 .40 .29
Source: 2012 CSO/MAL/IAPRI Rural Agricultural Livelihoods Survey. Table 8. Percent of Households by District by Tillage Method, 2012
conventional tilling method
Conservation tilling method
Chadiza 99.7 0.3 Chipata 99.0 1.0 Katete 93.9 6.1 Lundazi 95.7 4.3 Mambwe 91.7 8.3 Nyimba 97.4 2.6 Petauke 91.9 8.1 Total 95.7 4.3
Source: 2012 CSO/MAL/IAPRI Rural Agricultural Livelihoods Survey. Table 9. Percent Households That Sold by Crop, Zambia, Eastern Province and Ftf Zone, 2011
Zambia Eastern Province FtF Zone Maize 59.6 51.1 53.0 Sunflower 38.3 36.2 35.4 Groundnuts 51.3 46.9 48.4 Sweet potato - white or yellow-fleshed
49.4 30.9 28.8
Sweet potato - orange-fleshed
50.0 31.3 38.5
Source: 2012 CSO/MAL/IAPRI Rural Agricultural Livelihoods Survey. Table 10. Percent Households that Sold Maize, by Gendered Type, Poverty Status, and Sex of Head, Ftf Zone, 2011 Zambia Eastern Province FtF Zone Gendered household type Male & female adults 61.9 53.5 55.5
Female adult(s) only 45.9 35.6 36.5 Male adult(s) only 53.8 51.6 52.0 Child-headed 100.0 100.0 100.0
Poverty status Not Poor 77.3 74.4 77.9 Poor 50.8 42.0 43.0
sex of head Male headed 62.4 53.7 55.6
Female headed 47.3 40.3 42.2
Total 59.6 51.1 53.0 Source: 2012 CSO/MAL/IAPRI Rural Agricultural Livelihoods Survey.

55
Table 11. Average HH Value of Sales (ZMK), Actual Price, of Various Crops by District, Eastern Province, 2010/11
Value of maize sales actual
price
Value of sunfl sales actual
price
Value of gnuts sales actual
price
Value of soyab sales actual
price
Value of cotton sales actual
price
Value of tobacco sales actual
price
Value of mbeans sales actual price
Chadiza 1,045,199 58,239 68,419 77,415 829,753 337,232 9,743
Chipata 908,246 25,988 160,862 9,203 975,235 324,222 23,032 Katete 1,352,400 38,174 82,543 4,777 1,665,014 49,628 8,601
Lundazi 1,200,896 56,648 92,715 145,098 1,247,455 58,639 32,247 Mambwe 454,639 9,049 58,775 - 1,440,557 6,825 10,800 Nyimba 1,276,189 28,132 109,026 - 405,481 - - Petauke 1,486,324 34,411 91,893 58 698,820 6,284 42
Eastern Province 1,171,564 38,220 105,037 41,101 1,071,624 125,855 15,389
Source: 2012 CSO/MAL/IAPRI Rural Agricultural Livelihoods Survey. Table 12. Average Value of Sales (ZMK), Actual Price, of Various Crops by Gendered HH Type and Poverty Status, Eastern Province, 2012
Value of maize sales actual price
Value of sunfl sales actual price
Value of gnuts sales actual price
Value of soyab sales actual price
Value of cotton sales actual price
Value of tobacco
sales actual price
Value of mbeans
sales actual price
Value of sweet pot yel sales
actual price
Value of sweet pot
orange sales
actual price Gendered household type
Male & female adults
1,348,433 40,354 119,863 44,613 1,195,080 129,024 18,061 2,655 542
Female adult(s) only
433,186 30,734 74,745 21,314 515,404 26,556 5,316 1,359 -
Male adult(s) only
1,720,784 16,088 43,301 20,492 704,724 173,240 18,434 5,978 -
Child-headed
455,000 - 92,000 - - - - - -
Poverty Status
Not Poor 4,061,099 83,370 181,342 121,404 1,926,527 222,462 38,098 5,268 1,297
Poor 496,238 26,535 92,357 19,566 856,215 87,067 10,496 1,872 223 Eastern Province
1,218,030 38,043 110,374 40,186 1,072,925 114,481 16,084 2,559 440
Source: 2012 CSO/MAL/IAPRI Rural Agricultural Livelihoods Survey. Table 13. Percent Distribution of Land Use by Gendered HH Type, Sex of Decision Maker, Eastern Province, 2011
sex of who decided use of field
Male Female Male and Female own cultivated field Male & female adults 85.0 12.4 2.6
Female adult(s) only 1.0 99.0 .0 Male adult(s) only 90.8 .2 8.9
garden Male & female adults 90.1 6.4 3.4 Female adult(s) only .0 100.0 .0 Male adult(s) only 76.5 .0 23.5
fallow natural/improved Male & female adults 88.7 7.9 3.5 Female adult(s) only .0 100.0 .0 Male adult(s) only 94.8 .0 5.2
virgin land Male & female adults 88.8 8.3 2.9 Female adult(s) only .2 99.8 .0 Male adult(s) only 87.1 1.5 11.4
Other specified Male & female adults 80.7 12.1 7.2 Female adult(s) only 3.6 96.4 .0 Male adult(s) only 100.0 .0 .0
All fields, Eastern Province Male & female adults 85.7 11.4 2.9
Female adult(s) only 1.0 99.0 .0
Male adult(s) only 90.7 .3 9.0 Source: 2012 CSO/MAL/IAPRI Rural Agricultural Livelihoods Survey.

56
Table 14. Percent Distribution of Land Use by Gendered HH Type, Sex of Decision Maker, FtF Zone, 2011
sex of who decided use of field
Male Female Male and Female own cultivated field Male & female adults 85.4 12.1 2.5
Female adult(s) only 1.1 98.9 .0
Male adult(s) only 89.2 .2 10.6 garden Male & female adults 91.6 4.5 4.0
Female adult(s) only .0 100.0 .0 Male adult(s) only 70.1 .0 29.9
fallow natural/improved Male & female adults 89.3 7.5 3.2 Female adult(s) only .0 100.0 .0 Male adult(s) only 93.4 .0 6.6
virgin land Male & female adults 90.0 7.2 2.8 Female adult(s) only .3 99.7 .0 Male adult(s) only 85.7 1.6 12.7
Other specified Male & female adults 80.7 11.4 7.8 Female adult(s) only 4.0 96.0 .0 Male adult(s) only 100.0 .0 .0
All fields, FtF Zone Male & female adults 86.2 10.9 2.9
Female adult(s) only 1.1 98.9 .0
Male adult(s) only 89.1 .3 10.6
Source: 2012 CSO/MAL/IAPRI Rural Agricultural Livelihoods Survey. Table 15. Percent Distribution of Seed Type by Crop, Sex of Decision Maker, Gendered HH Type, Eastern Province, 2011
local/recycled Hybrid/OPV/Improved
Male Female Male and Female Male Female Male and Female Maize Male & female adults 80.9% 15.7% 3.4% 86.6% 10.1% 3.3%
Female adult(s) only .7% 99.3% .0% 4.6% 95.4% .0% Sunflower Male & female adults 80.4% 17.0% 2.5% 86.0% 11.4% 2.6%
Female adult(s) only .0% 100.0% .0% .0% 100.0% .0% Groundnuts Male & female adults 78.4% 19.4% 2.2% 77.4% 19.1% 3.5%
Female adult(s) only .0% 100.0% .0% 2.1% 97.9% .0%
Source: 2012 CSO/MAL/IAPRI Rural Agricultural Livelihoods Survey. Table 16. Percent Distribution of Decision to Sell by Sex of Decision Maker, Gendered HH Type, Eastern Province, 2011
sex of who decided sale of crop
Male Female Male and Female Maize Male & female adults 80.4 14.4 5.2
Female adult(s) only 2.1 97.9 .0 Sunflower Male & female adults 75.8 19.5 4.7
Female adult(s) only .2 99.8 .0 Groundnuts Male & female adults 69.9 26.2 3.9
Female adult(s) only 1.6 98.4 .0 Soyabeans Male & female adults 69.2 24.8 5.9
Female adult(s) only 1.0 99.0 .0 Sweet Potato - white or yellow-fleshed Male & female adults 72.7 16.8 10.4
Female adult(s) only .0 100.0 .0 Sweet Potato - orange fleshed Male & female adults 46.9 53.1 .0
Female adult(s) only .0 .0 .0 Eastern Province, FtF crops Male & female adults 75.8 19.3 4.8
Female adult(s) only 1.7 98.3 .0 Source: 2012 CSO/MAL/IAPRI Rural Agricultural Livelihoods Survey.

57
Table 17. Percent Distribution of Decision to Sell by Sex of Decision Maker, Gendered HH Type, FtF Zone, 2011
sex of who decided sale of crop
Male Female Male and Female Maize Male & female adults 80.6 14.2 5.3
Female adult(s) only 2.3 97.7 .0 Sunflower Male & female adults 74.4 20.3 5.3
Female adult(s) only .3 99.7 .0 Groundnuts Male & female adults 69.8 26.5 3.7
Female adult(s) only 1.8 98.2 .0 Soyabeans Male & female adults 67.2 26.2 6.6
Female adult(s) only 1.2 98.8 .0 Sweet Potato - white or yellow-fleshed Male & female adults 74.2 13.6 12.2
Female adult(s) only .0 100.0 .0 Sweet Potato - orange fleshed Male & female adults 42.1 57.9 .0
Female adult(s) only .0 .0 .0 FtF Zone, FtF Crops Male & female adults 75.6 19.4 5.0
Female adult(s) only 1.8 98.2 .0 Source: 2012 CSO/MAL/IAPRI Rural Agricultural Livelihoods Survey. Table 18. Average Values of Actual Sales by Crop, Gender Of Decision Maker, FtF Zone, 2011
sex of who decided sale of crop
Male Female Male and Female Maize Male & female adults 1,543,310.1 608,451.7 1,085,194.6 Female adult(s) only .0 487,893.2 . Sunflower Male & female adults 137,110.9 48,684.3 122,785.2 Female adult(s) only . 106,735.5 . Groundnuts Male & female adults 229,133.4 149,648.2 209,110.7 Female adult(s) only .0 122,116.2 . Soyabeans Male & female adults 233,388.3 248,395.7 100,832.7 Female adult(s) only . 142,519.7 . Seed Cotton Male & female adults 2,710,750.9 2,621,286.9 2,976,082.6 Female adult(s) only 4,549,494.9 1,800,841.3 . Tobacco Male & female adults 3,091,037.3 668,500.0 15,800,000.0 Female adult(s) only . 1,396,855.8 . Mixed Beans Male & female adults 269,828.7 188,026.3 1,350,000.0 Female adult(s) only . 237,650.1 . Sweet Potato - white or yellow-fleshed Male & female adults 189,974.7 174,575.6 42,852.4 Female adult(s) only . 206,294.8 . Sweet Potato - orange fleshed Male & female adults 118,919.7 55,814.7 . Female adult(s) only . . .
Source: 2012 CSO/MAL/IAPRI Rural Agricultural Livelihoods Survey. Table 19. Average Number of Livestock Owned by Female Members, Ftf Zone, 2011
Owned by household owned by female
members of this hh? Cattle Male & female adults 5 0
Female adult(s) only 5 3 Goats Male & female adults 5 1
Female adult(s) only 3 3 Pigs Male & female adults 5 1
Female adult(s) only 5 4 Sheep Male & female adults 4 1
Female adult(s) only 1 3 Donkeys Male & female adults 2 0
Female adult(s) only . . Village chickens Male & female adults 10 4
Female adult(s) only 8 7 Guinea fowls Male & female adults 4 1
Female adult(s) only 20 0 Ducks & geese Male & female adults 5 1
Female adult(s) only 3 3 Rabbits Male & female adults 13 12
Female adult(s) only 4 4 Source: 2012 CSO/MAL/IAPRI Rural Agricultural Livelihoods Survey.
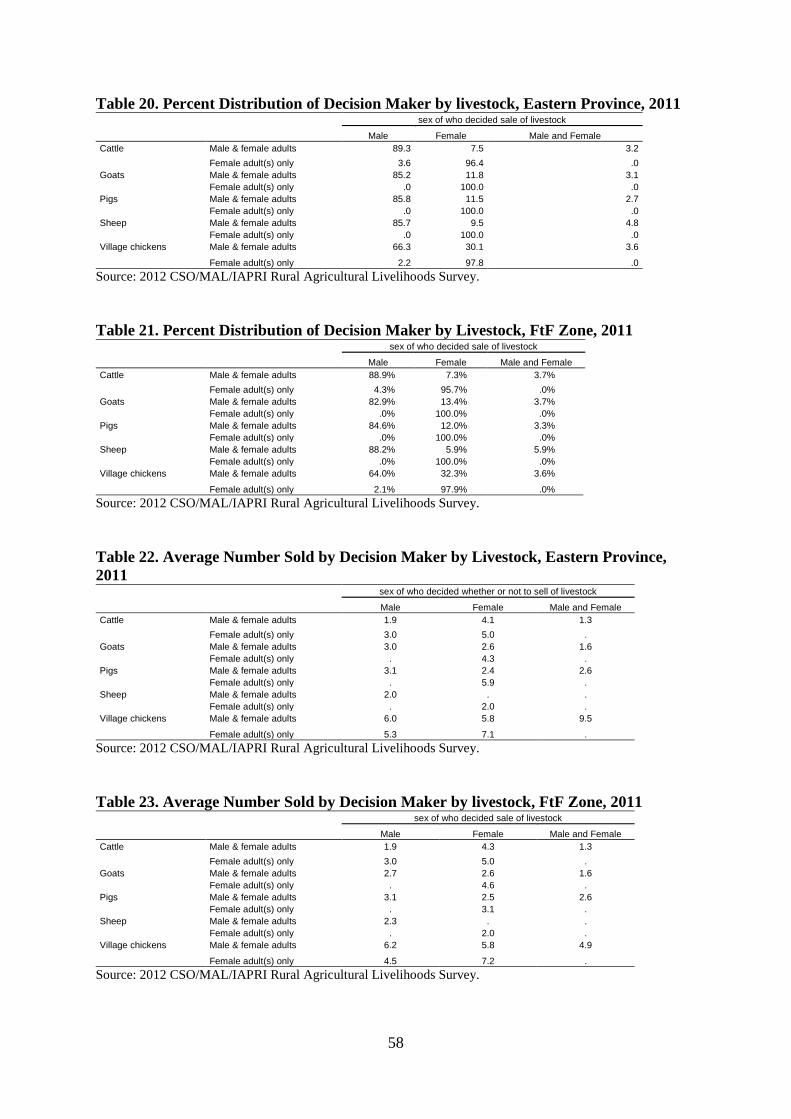
58
Table 20. Percent Distribution of Decision Maker by livestock, Eastern Province, 2011
sex of who decided sale of livestock
Male Female Male and Female Cattle Male & female adults 89.3 7.5 3.2
Female adult(s) only 3.6 96.4 .0 Goats Male & female adults 85.2 11.8 3.1
Female adult(s) only .0 100.0 .0 Pigs Male & female adults 85.8 11.5 2.7
Female adult(s) only .0 100.0 .0 Sheep Male & female adults 85.7 9.5 4.8
Female adult(s) only .0 100.0 .0 Village chickens Male & female adults 66.3 30.1 3.6
Female adult(s) only 2.2 97.8 .0 Source: 2012 CSO/MAL/IAPRI Rural Agricultural Livelihoods Survey. Table 21. Percent Distribution of Decision Maker by Livestock, FtF Zone, 2011
sex of who decided sale of livestock
Male Female Male and Female Cattle Male & female adults 88.9% 7.3% 3.7%
Female adult(s) only 4.3% 95.7% .0% Goats Male & female adults 82.9% 13.4% 3.7%
Female adult(s) only .0% 100.0% .0% Pigs Male & female adults 84.6% 12.0% 3.3%
Female adult(s) only .0% 100.0% .0% Sheep Male & female adults 88.2% 5.9% 5.9%
Female adult(s) only .0% 100.0% .0% Village chickens Male & female adults 64.0% 32.3% 3.6%
Female adult(s) only 2.1% 97.9% .0% Source: 2012 CSO/MAL/IAPRI Rural Agricultural Livelihoods Survey. Table 22. Average Number Sold by Decision Maker by Livestock, Eastern Province, 2011
sex of who decided whether or not to sell of livestock
Male Female Male and Female Cattle Male & female adults 1.9 4.1 1.3
Female adult(s) only 3.0 5.0 . Goats Male & female adults 3.0 2.6 1.6
Female adult(s) only . 4.3 . Pigs Male & female adults 3.1 2.4 2.6
Female adult(s) only . 5.9 . Sheep Male & female adults 2.0 . .
Female adult(s) only . 2.0 . Village chickens Male & female adults 6.0 5.8 9.5
Female adult(s) only 5.3 7.1 . Source: 2012 CSO/MAL/IAPRI Rural Agricultural Livelihoods Survey. Table 23. Average Number Sold by Decision Maker by livestock, FtF Zone, 2011
sex of who decided sale of livestock
Male Female Male and Female Cattle Male & female adults 1.9 4.3 1.3
Female adult(s) only 3.0 5.0 . Goats Male & female adults 2.7 2.6 1.6
Female adult(s) only . 4.6 . Pigs Male & female adults 3.1 2.5 2.6
Female adult(s) only . 3.1 . Sheep Male & female adults 2.3 . .
Female adult(s) only . 2.0 . Village chickens Male & female adults 6.2 5.8 4.9
Female adult(s) only 4.5 7.2 . Source: 2012 CSO/MAL/IAPRI Rural Agricultural Livelihoods Survey.

59
Table 24. Average Income from Sales (ZMK) by Revenue Use Decision Maker, Eastern Province, 2011
sex of who decided use of revenue from sale of livestock
Male Female Male and Female Cattle Male & female adults 2,455,000 2,693,846 2,675,000
Female adult(s) only . 5,100,000 . Goats Male & female adults 292,411 333,652 233,333
Female adult(s) only . 417,000 . Pigs Male & female adults 458,518 445,758 350,455
Female adult(s) only 625,000 1,159,091 . Sheep Male & female adults 247,500 400,000 .
Female adult(s) only . 240,000 . Village chickens Male & female adults 96,571 85,625 94,150
Female adult(s) only 36,667 199,458 . Source: 2012 CSO/MAL/IAPRI Rural Agricultural Livelihoods Survey.
Table 25. Primary Source of Labor for Key Agricultural Activities for Maize by GHT, FTF Zone, 2011
Primary source of labour for largest maize field
Female adults Male adults Male and female
adults Children Mechanical
Power Animal draught
power Land preparation / planting Male & female adults 11.8% 14.1% 39.0% .0% .0% 35.1%
Female adult(s) only 54.6% 5.5% 17.8% .1% .2% 21.8% Weeding Male & female adults 12.9% 19.3% 63.6% .0% .0% 4.1%
Female adult(s) only 59.5% 9.8% 28.1% .0% .0% 2.6% Harvesting Male & female adults 15.6% 13.7% 70.4% .0% .0% .3%
Female adult(s) only 63.8% 6.6% 29.6% .0% .0% .0% Source: 2012 CSO/MAL/IAPRI Rural Agricultural Livelihoods Survey. Table 26. Primary Source of Labor for Key Agricultural Activities for Largest Groundnut Field by GHT, FTF Zone, 2011
source of most of labour groundnuts
Female adults Male adults Male and
female adults Children Mechanical
Power Animal draught
power Land preparation / planting Male & female adults 15.5% 9.2% 38.2% .1% .0% 37.1%
Female adult(s) only 54.5% 3.5% 16.4% .0% .0% 25.7% Weeding Male & female adults 19.5% 14.5% 62.2% .0% .0% 3.8%
Female adult(s) only 66.3% 3.3% 27.7% .0% .0% 2.8% Harvesting Male & female adults 19.3% 13.7% 66.8% .0% .0% .3%
Female adult(s) only 64.4% 5.3% 30.3% .0% .0% .0% Source: 2012 CSO/MAL/IAPRI Rural Agricultural Livelihoods Survey. Table 27. Primary Source of Labor for Key Agricultural Activities for Largest Sunflower Field by GHT, FTF Zone, 2011
source of most of labour for largest sun flower field
Female adults Male adults Male and female
adults Children Mechanical
Power Animal draught
power Land preparation / planting Male & female adults 9.1% 10.2% 41.1% .0% .0% 39.6%
Female adult(s) only 45.3% 3.7% 29.3% .0% .0% 21.7% Weeding Male & female adults 12.3% 14.3% 67.7% .0% .0% 5.8%
Female adult(s) only 47.5% 3.0% 48.9% .0% .0% .6% Harvesting Male & female adults 16.2% 13.4% 69.8% .0% .0% .7%
Female adult(s) only 46.3% 5.2% 48.5% .0% .0% .0% Source: 2012 CSO/MAL/IAPRI Rural Agricultural Livelihoods Survey.

60
Table 28. Primary Source of Labor for Key Agricultural Activities for Largest Cassava Field by GHT, FTF Zone, 2011
Primary source of labour for largest cassava field
Female adults Male adults Male and
female adults Children Mechanical
Power Animal draught
power Land preparation / planting Male & female adults 2.3% 49.3% 41.6% .0% .0% 6.8%
Female adult(s) only .0% .0% .0% .0% .0% .0% Weeding Male & female adults 24.8% 30.1% 43.2% .0% .0% 1.9%
Female adult(s) only .0% .0% .0% .0% .0% .0% Harvesting Male & female adults 16.4% 33.7% 49.9% .0% .0% .0%
Female adult(s) only .0% .0% .0% .0% .0% .0% Source: 2012 CSO/MAL/IAPRI Rural Agricultural Livelihoods Survey. Table 29. Percent of Source of Most Labour for Groundnuts by Activity, and GHT, FtF Zone, 2011
source of most of labour – largest groundnut field
Female adults Male adults
Male and female adults Children
Mechanical Power
Animal draught power
Land preparation / planting
Gendered household type
Male & female adults 15.5 9.2 38.2 .1 .0 37.1 Female adult(s) only 54.5 3.5 16.4 .0 .0 25.7 Male adult(s) only 5.4 20.5 24.7 .0 .0 49.5
sex of head Male 14.6 10.1 37.5 .1 .0 37.6 Female 44.9 3.1 24.0 .0 .0 28.0
Weeding Gendered household
type Male & female adults 19.5 14.5 62.2 .0 .0 3.8 Female adult(s) only 66.3 3.3 27.7 .0 .0 2.8 Male adult(s) only 1.4 21.6 57.7 .0 .0 19.4
sex of head Male 18.3 15.1 63.1 .0 .0 3.6 Female 55.0 5.1 34.7 .0 .0 5.1
Harvesting Gendered household
type Male & female adults 19.3 13.7 66.8 .0 .0 .3
Female adult(s) only 64.4 5.3 30.3 .0 .0 .0
Male adult(s) only 11.1 24.2 64.7 .0 .0 .0
sex of head Male 17.9 14.2 67.6 .0 .0 .3
Female 54.9 6.8 38.2 .0 .0 .0 Source: 2012 CSO/MAL/IAPRI Rural Agricultural Livelihoods Survey. Table 30. Percent of Source of Most Labour for Sunflower by Activity, and GHT, FtF Zone, 2011
source of most of labour – largest sunflower field
Female adults Male adults
Male and female adults Children
Mechanical Power
Animal draught power
Land preparation / planting
Gendered household type
Male & female adults 9.1 10.2 41.1 .0 .0 39.6 Female adult(s) only 45.3 3.7 29.3 .0 .0 21.7 Male adult(s) only .0 .0 21.1 .0 .0 78.9
sex of head Male 8.8 10.8 40.0 .0 .0 40.4 Female 35.2 2.5 37.0 .0 .0 25.3
Weeding Gendered household
type Male & female adults 12.3 14.3 67.7 .0 .0 5.8 Female adult(s) only 47.5 3.0 48.9 .0 .0 .6 Male adult(s) only .0 5.8 94.2 .0 .0 .0
sex of head Male 11.5 15.1 68.5 .0 .0 4.9 Female 39.3 2.5 52.1 .0 .0 6.1
Harvesting Gendered household
type Male & female adults 16.2 13.4 69.8 .0 .0 .7
Female adult(s) only 46.3 5.2 48.5 .0 .0 .0
Male adult(s) only .0 35.3 64.7 .0 .0 .0
sex of head Male 15.9 14.5 68.9 .0 .0 .7
Female 37.6 3.6 58.9 .0 .0 .0 Source: 2012 CSO/MAL/IAPRI Rural Agricultural Livelihoods Survey.

61
APPENDIX II. ZAMBIA
Percent of Small and Medium Scale Farmers Growing Maize by Province Province 2002/03 2003/04 2004/05 2005/06 2006/07 2007/08 2008/09 2009/10 2010/11 2011/12
Central 93.79 92.56 96.16 95.70 94.81 96.05 93.70 95.11 96.61 95.12
Copperbelt 96.93 94.74 96.41 98.64 92.41 92.47 93.15 94.59 95.72 96.60
Eastern 98.81 97.93 98.40 96.95 97.96 97.76 98.20 98.49 98.96 96.85
Luapula 40.72 43.02 34.23 36.65 42.09 43.62 53.80 46.75 54.70 62.59
Lusaka 100.00 96.20 99.11 99.47 94.30 96.03 94.99 98.72 95.27 93.76
Muchinga 84.17
Northern 55.91 58.01 57.47 57.70 60.45 63.27 66.86 64.46 74.13 69.77
NorthWestern 72.47 83.62 83.96 81.22 78.31 77.20 81.68 81.60 84.08 78.30
Southern 97.14 90.01 93.55 91.83 89.09 94.77 89.33 87.58 87.89 95.93
Western 86.35 87.80 86.66 79.19 89.66 91.77 87.88 84.07 83.21 86.63
National 80.29 80.54 80.49 79.42 80.66 82.34 83.32 81.72 85.62 85.97 Percent of Small and Medium Scale Farmers Growing Sorghum by Province
Province 2002/03 2003/04 2004/05 2005/06 2006/07 2007/08 2008/09 2009/10 2010/11 2011/12
Central 11.83 9.84 10.66 6.52 5.84 4.28 5.54 3.36 2.99 1.30
Copperbelt 9.60 9.40 9.98 4.08 5.32 2.78 5.26 2.57 3.45 2.36
Eastern 2.90 3.70 2.74 3.27 4.13 2.91 2.76 2.84 1.98 .02
Luapula 2.76 3.38 2.43 2.00 1.71 1.20 2.48 2.05 1.95 .68
Lusaka 2.66 3.47 6.28 2.84 2.40 2.77 1.83 .81 1.24 3.05
Muchinga 8.41
Northern 7.01 6.78 2.52 2.75 .63 1.27 .94 2.92 1.30 .60
NorthWestern 14.33 13.45 14.33 11.18 7.34 7.81 5.72 6.25 4.13 2.75
Southern 16.10 14.99 12.97 12.98 7.75 7.48 10.71 9.29 7.11 5.76
Western 13.12 21.84 26.20 20.82 11.65 7.10 9.78 8.51 4.74 5.94
National 8.65 9.39 8.85 7.20 4.98 4.01 4.87 4.41 3.19 2.74 Percent of Small and Medium Scale Farmers Growing Rice by Province Province 2002/03 2003/04 2004/05 2005/06 2006/07 2007/08 2008/09 2009/10 2010/11 2011/12
Central .26 1.23 1.43 .00 .73 .10 .87 .42 0.39 .02
Copperbelt .04 .02 .03 .08 .03 .06 .11 .07 0.10 .09
Eastern .76 5.85 5.49 5.48 4.62 3.67 3.35 4.77 3.14 2.21
Luapula 2.21 1.92 2.01 2.21 2.98 2.97 3.30 2.14 2.88 3.79
Lusaka .00 .00 .11 .10 1.86 .47 .73 .65 0.75 .39
Muchinga 11.32
Northern 5.64 7.09 6.05 4.29 6.55 6.53 10.82 10.03 9.87 6.95
NorthWestern .00 .66 .28 .27 .31 1.19 2.04 .53 2.31 .53
Southern .00 .00 .00 .02 .00 .00 .03 .00 0.00 .07
Western 5.67 4.33 9.77 3.48 9.59 9.97 14.17 15.14 13.95 18.16
National 2.06 3.31 3.64 2.49 3.59 3.41 4.61 4.49 4.27 4.45 Percent of Small and Medium Scale Farmers Growing Millet by Province Province 2002/03 2003/04 2004/05 2005/06 2006/07 2007/08 2008/09 2009/10 2010/11 2011/12
Central 10.48 6.55 5.42 7.67 5.02 6.16 8.07 5.00 4.21 2.99
Copperbelt 1.10 .34 .84 1.64 .79 .61 1.72 1.48 1.08 .54
Eastern 2.35 2.41 2.55 2.93 4.29 1.82 1.85 1.94 1.48 .28
Luapula 7.59 6.13 6.63 4.20 5.86 3.64 3.04 3.94 1.26 4.35
Lusaka .50 1.19 .00 .41 .03 .11 .85 .16 0.30 .92
Muchinga 22.57
Northern 48.24 42.36 38.94 38.04 34.64 32.42 40.94 35.04 28.68 19.63
NorthWestern 4.15 5.10 2.58 2.69 2.12 1.72 2.40 2.01 2.31 1.56
Southern 4.44 7.37 8.99 10.30 4.99 3.71 3.64 3.60 1.33 3.42
Western 19.09 22.98 19.75 23.15 19.30 13.41 12.31 16.17 10.96 10.67
National 14.07 13.43 12.41 12.88 11.23 9.42 10.74 9.92 7.58 6.80

62
Percent of Small and Medium Scale Farmers Growing Sunflower by Province Province 2002/03 2003/04 2004/05 2005/06 2006/07 2007/08 2008/09 2009/10 2010/11 2011/12
Central 3.27 6.85 4.28 5.06 3.07 2.03 3.39 2.65 1.42 1.95
Copperbelt .02 .60 .78 .20 .09 .14 .47 .21 0.43 .50
Eastern 12.07 19.07 19.90 27.06 17.92 22.16 35.50 27.74 21.52 25.53
Luapula .24 .52 .24 .22 .08 .07 .21 .11 0.05 .17
Lusaka .00 1.19 .31 1.39 .67 .42 .68 1.21 0.38 1.06
Muchinga 2.52
Northern 3.67 4.90 5.79 4.94 3.76 3.03 3.61 6.27 4.02 3.94
NorthWestern .06 .29 1.06 .55 .24 .13 .32 .21 0.14 .16
Southern 4.59 5.69 4.67 4.37 2.76 1.90 5.24 4.34 4.43 5.33
Western .00 .00 .04 .00 .01 .08 .04 .08 0.07 .18
National 4.02 6.22 6.14 7.37 4.83 5.25 8.85 7.30 5.63 6.60
Percent of Small and Medium Scale Farmers Growing Groundnuts by Province Province 2002/03 2003/04 2004/05 2005/06 2006/07 2007/08 2008/09 2009/10 2010/11 2011/12
Central 32.53 14.41 24.09 20.41 34.76 32.71 44.75 44.56 38.43 30.31
Copperbelt 32.72 19.87 35.12 28.63 27.05 28.19 42.64 48.53 32.05 36.53
Eastern 62.17 53.83 69.81 46.62 52.29 56.05 63.95 69.40 62.70 53.50
Luapula 53.95 40.78 48.68 46.78 47.45 45.45 50.77 53.51 46.55 46.83
Lusaka 25.54 20.25 31.72 23.66 23.63 26.49 24.52 27.54 23.46 20.87
Muchinga 52.40
Northern 66.42 59.58 61.74 63.09 51.88 46.32 56.42 59.61 57.98 59.23
NorthWestern 17.94 17.58 21.02 19.66 17.53 18.73 18.40 18.85 20.61 21.19
Southern 17.72 24.93 31.74 42.78 38.65 32.43 33.37 45.91 38.14 27.60
Western 12.46 12.76 10.18 7.51 11.13 13.36 12.31 19.54 18.98 12.00
National 41.46 35.06 42.54 37.90 38.25 37.19 43.75 48.58 43.43 39.17
Percent of Small and Medium Scale Farmers Growing Soyabean by Province Province 2002/03 2003/04 2004/05 2005/06 2006/07 2007/08 2008/09 2009/10 2010/11 2011/12
Central 4.43 11.66 14.72 7.60 7.62 2.31 4.81 6.30 6.04 3.72
Copperbelt 2.06 2.70 3.30 1.68 2.12 1.04 2.36 4.34 1.63 2.45
Eastern 4.15 6.35 10.25 9.10 7.56 4.69 7.50 7.13 5.63 6.15
Luapula .42 1.12 .68 1.06 1.62 .97 1.65 1.02 0.57 .89
Lusaka 1.25 2.25 9.49 1.94 .87 .49 1.09 .60 0.59 1.11
Muchinga 5.51
Northern 5.63 5.86 9.72 9.90 5.76 4.18 4.98 8.20 5.02 3.69
NorthWestern .49 .57 1.20 1.03 1.15 1.36 2.03 2.24 1.60 1.43
Southern .99 1.08 .39 .21 .23 .54 .60 .39 0.63 .34
Western .00 .04 .00 .18 .06 .07 .04 .18 0.21 .39
National 2.68 4.14 6.11 4.83 3.83 2.28 3.50 4.21 3.05 2.89
Percent of Small and Medium Scale Farmers Growing Cotton by Province
Province 2002/03 2003/04 2004/05 2005/06 2006/07 2007/08 2008/09 2009/10 2010/11 2011/12
Central 17.52 20.69 25.42 26.85 8.94 11.97 8.76 8.00 15.28 32.71
Copperbelt .00 .05 .11 .03 .09 .06 .02 .03 0.05 .70
Eastern 35.23 41.49 52.31 45.41 35.77 40.12 33.10 26.96 39.58 63.99
Luapula .00 .00 .00 .00 .00 .00 .00 .00 0.00 .00
Lusaka 1.30 3.40 7.72 5.00 3.54 1.72 1.03 .83 1.74 5.00
Muchinga 16.19
Northern .00 .00 .06 .00 .12 .12 .12 .01 0.00 .00
NorthWestern .00 .27 .00 .13 .01 .00 .00 .00 0.03 .00
Southern 5.45 15.45 19.49 17.08 4.58 6.93 6.41 2.26 6.46 19.50
Western .13 .61 .71 1.01 .20 .18 .08 .07 0.15 .67
National 9.73 12.47 15.70 14.25 8.55 9.93 8.49 6.36 10.11 13.87

63
Percent of Small and Medium Scale Farmers Growing Irish Potatoes by Province Province 2002/03 2003/04 2004/05 2005/06 2006/07 2007/08 2008/09 2009/10 2010/11 2011/12
Central .00 .00 .02 .04 .03 .22 .30 .28 0.04 .22
Copperbelt .00 .00 .69 .80 .29 .31 .19 .64 0.73 .27
Eastern .00 .00 .67 .43 .01 .40 .14 .25 0.30 .22
Luapula .00 .00 .00 .00 .00 .04 .01 .02 0.05 .06
Lusaka .00 .00 .74 .00 .06 .79 .17 .03 0.27 .03
Muchinga .15
Northern .00 .00 .10 .10 .14 .07 .15 .14 0.11 .13
NorthWestern .00 .00 .06 .95 1.35 .70 .65 .92 1.68 2.45
Southern .00 .00 .00 .02 .01 .17 .25 .09 0.09 .04
Western .00 .00 .00 .04 .00 .00 .00 .03 0.01 .00
National .00 .00 .22 .24 .16 .24 .19 .24 0.28 .36
Percent of Small and Medium Scale Farmers Growing Tobacco by Province Province 2002/03 2003/04 2004/05 2005/06 2006/07 2007/08 2008/09 2009/10 2010/11 2011/12
Central .14 .73 2.43 .87 .60 1.35 2.18 2.22 3.42 1.08
Copperbelt .00 .00 .00 .00 .00 .03 .02 .32 0.03 .00
Eastern 3.90 7.97 9.63 4.12 .94 2.26 4.66 4.33 5.93 2.03
Luapula .00 .00 .00 .00 .00 .00 .02 .06 0.00 .00
Lusaka .00 .00 .10 .00 .00 .00 .58 .00 0.04 .00
Muchinga .16
Northern .00 .30 .13 .08 .00 .48 .51 .91 0.56 .00
NorthWestern .00 .00 .47 .00 .00 .00 .00 .00 0.25 .04
Southern .73 .32 .75 .62 .13 .00 .60 .85 1.22 1.00
Western .00 .48 1.04 1.38 .61 1.33 1.81 1.08 1.47 .40
National .89 1.78 2.41 1.14 .33 .82 1.54 1.49 1.92 .47
Percent of Small and Medium Scale Farmers Growing Beans by Province Province 2002/03 2003/04 2004/05 2005/06 2006/07 2007/08 2008/09 2009/10 2010/11 2011/12
Central 14.59 7.45 9.60 13.78 10.78 8.54 14.50 12.37 6.93 10.23
Copperbelt 12.45 8.42 12.49 11.89 7.30 7.73 17.76 14.28 10.48 13.86
Eastern 3.26 3.15 3.78 3.66 1.79 2.23 4.97 3.20 2.90 5.60
Luapula 6.67 13.09 13.03 8.68 11.21 11.21 15.12 13.51 11.18 14.01
Lusaka 6.20 6.16 7.49 6.38 5.17 5.65 3.79 7.97 5.80 6.97
Muchinga 36.32
Northern 39.28 35.87 36.90 38.77 40.61 42.66 46.61 47.96 43.33 53.79
NorthWestern 14.22 28.31 18.47 28.73 9.52 17.70 21.98 19.92 14.54 15.24
Southern 8.90 6.86 2.55 2.03 2.30 1.01 1.70 2.38 0.55 2.51
Western .70 6.07 2.35 .04 .91 .94 1.12 2.26 1.88 1.14
National 13.16 13.89 13.00 13.76 11.92 12.69 15.57 15.34 12.63 15.97
Percent of Small and Medium Scale Farmers Growing Cowpeas by Province Province 2002/03 2003/04 2004/05 2005/06 2006/07 2007/08 2008/09 2009/10 2010/11 2011/12
Central 3.00 .54 1.25 2.93 1.47 1.77 2.47 1.79 0.40 1.08
Copperbelt 2.73 .04 .56 .35 .08 .09 1.50 .50 0.39 .27
Eastern .03 .65 .03 .44 .58 .61 .48 .65 0.15 .20
Luapula .14 .35 .00 .10 .08 .04 .54 .43 0.09 .28
Lusaka .09 2.45 2.39 5.19 2.14 .80 3.14 .19 0.91 .71
Muchinga .90
Northern .65 5.81 .48 .26 1.17 .51 1.13 .57 0.69 .17
NorthWestern .48 .89 1.76 .30 .05 .69 .33 .09 0.02 .00
Southern 8.82 12.12 10.28 13.10 3.42 4.33 12.97 6.16 1.37 3.26
Western 1.63 2.34 1.60 1.60 1.52 .89 1.57 2.47 0.89 5.42
National 1.91 3.14 1.90 2.44 1.15 1.13 2.77 1.59 0.55 1.23

64
Percent of Small and Medium Scale Farmers Growing Velvet Beans by Province Province 2002/03 2003/04 2004/05 2005/06 2006/07 2007/08 2008/09 2009/10 2010/11 2011/12
Central .00 .00 .19 .00 .00 .00 .02 .02 0.03 .00
Copperbelt .00 .00 .14 .00 .00 .00 .00 .00 0.00 .00
Eastern .00 .00 .00 .00 .01 .00 .01 .00 0.02 .00
Luapula .00 .00 .00 .00 .00 .09 .01 .00 0.01 .00
Lusaka .00 .00 .04 .15 .00 .00 .00 1.11 0.00 .04
Muchinga .00
Northern .00 .00 .00 .50 .00 .00 .00 .06 0.01 .00
NorthWestern .00 .00 .00 .00 .04 .00 .00 .00 0.00 .02
Southern .00 .00 .02 .00 .00 .00 .34 .20 0.00 .34
Western .00 .00 .00 .02 .00 .00 .00 .00 0.00 .00
National .00 .00 .03 .10 .01 .01 .05 .07 0.01 .04
Percent of Small and Medium Scale Farmers Growing Coffee by Province
Province 2002/03 2003/04 2004/05 2005/06 2006/07 2007/08 2008/09 2009/10 2010/11 2011/12
Central .00 .00 .33 .00 .03 .00 .00 .00 0.00 .00
Copperbelt .00 .00 .00 .00 .00 .00 .00 .02 0.00 .00
Eastern .00 .00 .00 .00 .00 .00 .00 .00 0.00 .07
Luapula .00 .00 .00 .00 .00 .00 .00 .00 0.00 .00
Lusaka .00 .00 .00 .00 .00 .00 .00 .00 0.00 .00
Muchinga .00
Northern .00 .00 .00 .14 .00 .00 .00 .00 0.02 .00
NorthWestern .00 .00 .00 .00 .00 .00 .00 .00 0.00 .00
Southern .00 .00 .00 .00 .00 .00 .00 .00 0.04 .00
Western .00 .00 .00 .00 .00 .00 .00 .00 0.00 .00
National .00 .00 .04 .02 .00 .00 .00 .00 0.01 .01
Percent of Small and Medium Scale Farmers Growing Sweet Potatoes by Province Province 2002/03 2003/04 2004/05 2005/06 2006/07 2007/08 2008/09 2009/10 2010/11 2011/12
Central 32.91 16.33 18.84 30.65 25.85 21.38 28.35 28.52 19.71 18.39
Copperbelt 53.96 25.43 36.54 33.41 23.41 23.48 39.49 39.56 20.00 31.33
Eastern 6.33 2.04 2.20 4.34 4.16 4.29 4.51 2.89 1.77 3.06
Luapula 18.33 9.78 11.82 4.85 13.17 18.67 22.84 18.77 10.30 14.62
Lusaka 11.65 10.35 5.20 12.46 7.48 5.42 22.38 13.02 6.40 11.25
Muchinga 27.45
Northern 20.64 22.55 17.25 14.00 13.78 16.00 18.10 22.07 18.83 16.76
NorthWestern 21.42 21.97 18.82 6.33 11.71 15.82 18.38 12.10 13.37 11.29
Southern 6.88 6.88 4.13 16.49 3.06 5.79 21.94 22.46 11.97 9.52
Western 6.48 6.76 1.50 3.48 2.02 2.69 5.20 6.47 2.81 2.24
National 17.33 12.60 11.55 12.67 10.95 12.15 17.78 17.60 11.54 14.59
Percent of Small and Medium Scale Farmers Growing Cassava by Province Province 2002/03 2003/04 2004/05 2005/06 2006/07 2007/08 2008/09 2009/10 2010/11 2011/12
Central 22.61 14.14 12.89 14.27 15.07 14.76 14.73 12.93 14.47 14.16
Copperbelt 25.29 18.73 17.32 19.15 12.54 12.25 15.64 11.14 6.41 12.80
Eastern 9.58 4.03 4.67 4.39 3.91 3.98 3.40 2.27 1.19 2.44
Luapula 96.85 95.22 97.62 97.74 95.27 95.16 93.63 92.19 90.24 90.61
Lusaka 11.44 8.74 5.75 5.63 6.83 5.63 4.92 4.23 3.09 2.95
Muchinga 50.86
Northern 89.85 87.83 88.42 89.80 77.66 75.58 78.27 80.13 76.95 84.95
NorthWestern 76.42 66.33 71.78 66.10 65.94 67.31 72.32 67.95 61.84 66.72
Southern 8.07 1.17 .29 1.01 .33 .78 .86 1.62 0.70 0.56
Western 63.35 49.15 43.28 45.93 44.13 37.67 49.02 51.43 52.72 57.29
National 47.29 41.16 41.03 41.32 38.21 37.22 38.11 37.90 36.05 38.33

65
Number of Small and Medium Scale Farmers Growing Maize by Province Province 2002/03 2003/04 2004/05 2005/06 2006/07 2007/08 2008/09 2009/10 2010/11 2011/12
Central 125,880 131,845 142,771 150,757 159,004 170,347 158,001 167,999 158,724 149,126
Copperbelt 65,571 73,617 76,642 79,054 81,453 82,694 80,662 95,607 93,717 68,725
Eastern 238,467 243,996 251,154 255,482 268,042 276,015 283,638 274,572 279,800 257,391
Luapula 55,358 60,792 49,659 54,684 66,016 70,875 89,811 80,063 93,539 98,926
Lusaka 33,951 35,012 37,218 38,042 38,477 40,941 39,649 41,316 46,924 35,857
Muchinga 89,536
Northern 118,546 134,084 136,947 141,408 157,108 171,049 168,132 169,500 203,645 126,869
NorthWestern 72,079 87,286 90,543 91,534 93,963 97,077 89,587 89,603 89,740 68,080
Southern 140,834 138,256 148,669 151,498 156,349 173,943 178,044 173,294 191,157 200,111
Western 115,508 122,285 124,552 117,520 140,365 149,731 128,763 120,374 117,979 121,976
National 966,194 1,027,172 1,058,155 1,079,979 1,160,778 1,232,673 1,216,287 1,212,327 1,275,225 1,216,599
Number of Small and Medium Scale Farmers Growing Sorghum by Province
Province 2002/03 2003/04 2004/05 2005/06 2006/07 2007/08 2008/09 2009/10 2010/11 2011/12
Central 15,880 14,021 15,823 10,267 9,788 7,586 9,336 5,927 4,911 2,035
Copperbelt 6,493 7,303 7,937 3,270 4,691 2,489 4,559 2,598 3,377 1,679
Eastern 6,987 9,211 6,987 8,627 11,308 8,221 7,976 7,909 5,608 52
Luapula 3,752 4,782 3,523 2,988 2,685 1,952 4,138 3,508 3,342 1,078
Lusaka 903 1,264 2,360 1,087 979 1,181 763 340 611 1,166
Muchinga 8,950
Northern 14,871 15,677 6,006 6,751 1,625 3,431 2,373 7,688 3,559 1,096
NorthWestern 14,256 14,041 15,456 12,593 8,813 9,827 6,275 6,864 4,410 2,393
Southern 23,338 23,029 20,613 21,420 13,601 13,723 21,337 18,382 15,465 12,013
Western 17,554 30,423 37,654 30,892 18,234 11,585 14,327 12,182 6,726 8,357
National 104,034 119,750 116,359 97,896 71,724 59,994 71,083 65,399 48,009 38,820
Number of Small and Medium Scale Farmers Growing Rice by Province Province 2002/03 2003/04 2004/05 2005/06 2006/07 2007/08 2008/09 2009/10 2010/11 2011/12
Central 355 1,758 2,119 0 1,230 183 1,475 743 640 25
Copperbelt 29 19 28 65 28 53 92 75 99 62
Eastern 1,842 14,569 14,023 14,435 12,629 10,361 9,669 13,293 8881 5,868
Luapula 2,999 2,708 2,917 3,300 4,675 4,822 5,516 3,661 4930 5,991
Lusaka 0 0 39 38 760 202 305 274 368 151
Muchinga 12,043
Northern 11,965 16,389 14,425 10,509 17,019 17,666 27,212 26,368 27117 12,632
NorthWestern 0 691 301 299 373 1,496 2,234 579 2464 462
Southern 0 0 0 40 0 0 50 0 0 144
Western 7,586 6,037 14,044 5,166 15,018 16,263 20,759 21,678 19774 25,575
National 24,777 42,172 47,896 33,852 51,733 51,046 67,314 66,672 64,272 62,951
Number of Small and Medium Scale Farmers Growing Millet by Province
Province 2002/03 2003/04 2004/05 2005/06 2006/07 2007/08 2008/09 2009/10 2010/11 2011/12
Central 14,065 9,330 8,043 12,087 8,417 10,931 13,613 8,838 6,923 4,682
Copperbelt 741 264 669 1,310 695 550 1,492 1,498 1,057 384
Eastern 5,681 6,016 6,498 7,720 11,733 5,127 5,333 5,418 4,184 738
Luapula 10,313 8,666 9,618 6,270 9,193 5,910 5,081 6,750 2,162 6,869
Lusaka 168 434 0 158 13 48 354 67 150 353
Muchinga 24,008
Northern 102,280 97,915 92,799 93,231 90,034 87,664 102,960 92,136 78,794 35,691
NorthWestern 4,123 5,326 2,780 3,027 2,543 2,169 2,637 2,211 2,465 1,354
Southern 6,440 11,325 14,294 16,995 8,756 6,811 7,249 7,129 2,885 7,127
Western 25,540 32,001 28,384 34,353 30,214 21,872 18,045 23,148 15,542 15,026
National 169,351 171,278 163,086 175,151 161,598 141,082 156,764 147,195 114,162 96,231

66
Number of Small and Medium Scale Farmers Growing Sunflower by Province Province 2002/03 2003/04 2004/05 2005/06 2006/07 2007/08 2008/09 2009/10 2010/11 2011/12
Central 4,393 9,756 6,350 7,978 5,146 3,596 5,717 4,682 2,331 3,056
Copperbelt 16 470 623 164 78 125 404 214 417 355
Eastern 29,122 47,514 50,800 71,310 49,038 62,573 102,532 77,322 60,849 67,842
Luapula 331 738 354 333 128 115 350 187 93 276
Lusaka 0 434 118 533 272 177 283 504 186 407
Muchinga 2,677
Northern 7,777 11,327 13,797 12,109 9,766 8,189 9,089 16,491 11,049 7,170
NorthWestern 61 302 1,144 620 294 158 355 233 145 135
Southern 6,656 8,740 7,415 7,215 4,841 3,479 10,435 8,582 9,639 11,117
Western 0 0 62 0 8 124 53 111 101 257
National 48,357 79,281 80,664 100,263 69,571 78,535 129,218 108,326 84,810 93,291
Number of Small and Medium Scale Farmers Growing Groundnuts by Province Province 2002/03 2003/04 2004/05 2005/06 2006/07 2007/08 2008/09 2009/10 2010/11 2011/12
Central 43,660 20,530 35,758 32,144 58,304 58,013 75,450 78,715 63,136 47,525
Copperbelt 22,131 15,443 27,919 22,943 23,842 25,211 36,921 49,049 31,377 25,991
Eastern 150,039 134,127 178,178 122,860 143,067 158,255 184,714 193,474 177,277 142,183
Luapula 73,355 57,631 70,616 69,798 74,428 73,844 84,751 91,629 79,597 74,011
Lusaka 8,670 7,368 11,910 9,048 9,640 11,293 10,235 11,526 11,555 7,981
Muchinga 55,736
Northern 140,818 137,714 147,121 154,618 134,852 125,232 141,886 156,756 159,272 107,710
NorthWestern 17,847 18,354 22,665 22,153 21,031 23,557 20,182 20,704 21,999 18,428
Southern 25,688 38,286 50,442 70,579 67,824 59,526 66,503 90,855 82,950 57,571
Western 16,668 17,771 14,627 11,149 17,430 21,798 18,032 27,980 26,909 16,900
National 498,876 447,224 559,236 515,294 550,418 556,730 638,673 720,688 654,072 554,035
Number of Small and Medium Scale Farmers Growing Soyabean by Province Province 2002/03 2003/04 2004/05 2005/06 2006/07 2007/08 2008/09 2009/10 2010/11 2011/12
Central 5,952 16,601 21,856 11,968 12,780 4,100 8,113 11,135 9,921 5,830
Copperbelt 1,395 2,099 2,620 1,345 1,871 926 2,044 4,386 1,598 1,744
Eastern 10,021 15,833 26,160 23,982 20,680 13,237 21,664 19,891 15,925 16,354
Luapula 574 1,590 993 1,588 2,543 1,571 2,762 1,745 983 1,406
Lusaka 425 817 3,563 742 356 208 456 251 289 426
Muchinga 5,858
Northern 11,941 13,543 23,154 24,273 14,967 11,305 12,525 21,571 13,798 6,712
NorthWestern 490 591 1,297 1,156 1,381 1,705 2,226 2,462 1,712 1,240
Southern 1,434 1,654 616 350 410 997 1,191 766 1,373 716
Western 0 56 0 261 92 106 58 258 293 544
National 32,232 52,785 80,258 65,665 55,079 34,156 51,037 62,463 45,891 40,830
Number of Small and Medium Scale Farmers Growing Cotton by Province Province 2002/03 2003/04 2004/05 2005/06 2006/07 2007/08 2008/09 2009/10 2010/11 2011/12
Central 23,521 29,470 37,739 42,300 14,998 21,231 14,770 14,127 25,107 51,275
Copperbelt 0 41 87 28 79 54 21 32 45 496
Eastern 85,027 103,378 133,528 119,670 97,862 113,271 95,603 75,173 111,909 170,059
Luapula 0 0 0 0 0 0 0 0 0 0
Lusaka 442 1,239 2,900 1,911 1,446 731 428 345 859 1,911
Muchinga 17,219
Northern 0 0 140 0 313 320 292 31 0 0
NorthWestern 0 286 0 147 17 0 0 0 33 0
Southern 7,902 23,723 30,973 28,184 8,043 12,721 12,768 4,466 14,042 40,681
Western 177 845 1,026 1,493 309 295 117 103 213 938
National 117,069 158,982 206,392 193,731 123,066 148,623 123,998 94,278 152,208 282,580

67
Number of Small and Medium Scale Farmers Growing Irish Potatoes by Province Province 2002/03 2003/04 2004/05 2005/06 2006/07 2007/08 2008/09 2009/10 2010/11 2011/12
Central 0 0 25 58 51 396 504 497 58 337
Copperbelt 0 0 549 639 259 280 161 642 712 191
Eastern 0 0 1,723 1,132 30 1,122 415 690 848 597
Luapula 0 0 0 0 0 63 16 29 80 98
Lusaka 0 0 279 0 23 338 71 14 133 10
Muchinga 159
Northern 0 0 244 249 362 179 376 380 305 234
NorthWestern 0 0 68 1,072 1,616 885 715 1,016 1,797 2,130
Southern 0 0 0 32 13 313 500 184 193 93
Western 0 0 0 57 0 0 0 38 18 0
National 0 0 2,888 3,239 2,354 3,575 2,757 3,489 4,143 3,850
Number of Small and Medium Scale Farmers Growing Tobacco by Province Province 2002/03 2003/04 2004/05 2005/06 2006/07 2007/08 2008/09 2009/10 2010/11 2011/12
Central 192 1,033 3,610 1,370 1,012 2,394 3,668 3,917 5,617 1,687
Copperbelt 0 0 0 0 0 31 20 325 28 0
Eastern 9,406 19,864 24,582 10,868 2,582 6,380 13,448 12,077 16,774 5,387
Luapula 0 0 0 0 0 0 33 102 0 0
Lusaka 0 0 37 0 0 0 241 0 18 0
Muchinga 172
Northern 0 693 315 207 0 1,300 1,275 2,397 1,548 0
NorthWestern 0 0 507 0 0 0 0 0 267 32
Southern 1,061 495 1,200 1,024 236 8 1,201 1,673 2,654 2,081
Western 0 668 1,496 2,041 962 2,171 2,645 1,553 2,082 564
National 10,659 22,753 31,748 15,511 4,792 12,285 22,531 22,044 28,988 9,923
Number of Small and Medium Scale Farmers Growing Beans by Province
Province 2002/03 2003/04 2004/05 2005/06 2006/07 2007/08 2008/09 2009/10 2010/11 2011/12
Central 19,578 10,612 14,253 21,710 18,072 15,153 24,442 21,850 11,387 16,043
Copperbelt 8,426 6,539 9,931 9,532 6,439 6,911 15,377 14,429 10,260 9,862
Eastern 7,879 7,838 9,656 9,649 4,904 6,284 14,350 8,925 8,198 14,893
Luapula 9,075 18,497 18,904 12,958 17,581 18,207 25,238 23,142 19,111 22,139
Lusaka 2,106 2,243 2,813 2,440 2,108 2,411 1,582 3,337 2,854 2,665
Muchinga 38,632
Northern 83,289 82,904 87,940 95,004 105,541 115,342 117,207 126,114 119,029 97,821
NorthWestern 14,138 29,554 19,922 32,375 11,425 22,260 24,105 21,869 15,515 13,250
Southern 12,904 10,537 4,055 3,354 4,032 1,848 3,398 4,706 1,192 5,237
Western 930 8,456 3,375 61 1,431 1,537 1,636 3,237 2,669 1,602
National 158,323 177,181 170,848 187,082 171,533 189,952 227,334 227,610 190,215 222,147
Number of Small and Medium Scale Farmers Growing Cowpeas by Province
Province 2002/03 2003/04 2004/05 2005/06 2006/07 2007/08 2008/09 2009/10 2010/11 2011/12
Central 4,023 768 1,852 4,608 2,459 3,137 4,157 3,167 660 1,699
Copperbelt 1,850 33 447 284 67 82 1,296 503 386 191
Eastern 65 1,627 84 1,150 1,595 1,733 1,399 1,822 426 536
Luapula 197 498 0 155 123 64 903 734 147 444
Lusaka 30 891 897 1,984 874 340 1,312 78 447 270
Muchinga 953
Northern 1,381 13,441 1,145 626 3,029 1,368 2,850 1,488 1,886 318
NorthWestern 474 932 1,902 338 65 874 367 103 18 0
Southern 12,781 18,622 16,329 21,604 6,006 7,939 25,855 12,190 2,989 6,797
Western 2,187 3,258 2,296 2,371 2,382 1,447 2,307 3,542 1,255 7,626
National 22,986 40,069 24,952 33,121 16,602 16,985 40,445 23,627 8,214 18,832

68
Number of Small and Medium Scale Farmers Growing Velvet Beans by Province Province 2002/03 2003/04 2004/05 2005/06 2006/07 2007/08 2008/09 2009/10 2010/11 2011/12
Central 0 0 282 0 0 0 41 38 57 0
Copperbelt 0 0 111 0 0 0 0 0 0 0
Eastern 0 0 0 0 22 0 24 0 59 0
Luapula 0 0 0 0 0 146 16 0 25 0
Lusaka 0 0 16 59 0 0 0 463 0 16
Muchinga 0
Northern 0 0 0 1,214 7 0 0 168 24 0
NorthWestern 0 0 0 0 50 0 0 0 0 16
Southern 0 0 30 0 0 5 679 391 0 718
Western 0 0 0 27 0 0 0 0 0 0
National 0 0 439 1,301 79 152 760 1,061 164 750
Number of Small and Medium Scale Farmers Growing Coffee by Province Province 2002/03 2003/04 2004/05 2005/06 2006/07 2007/08 2008/09 2009/10 2010/11 2011/12
Central 0 0 496 0 45 0 0 0 0 0
Copperbelt 0 0 0 0 0 0 0 19 0 0
Eastern 0 0 0 0 0 0 0 0 0 195
Luapula 0 0 0 0 0 0 0 0 0 0
Lusaka 0 0 0 0 0 0 0 0 0 0
Muchinga 0
Northern 0 0 0 334 0 0 0 0 59 0
NorthWestern 0 0 0 0 0 0 0 0 0 0
Southern 0 0 0 0 0 0 0 0 94 0
Western 0 0 0 0 0 0 0 0 0 0
National 0 0 496 334 45 0 0 19 154 195
Number of Small and Medium Scale Farmers Growing Sweet Potatoes by Province
Province 2002/03 2003/04 2004/05 2005/06 2006/07 2007/08 2008/09 2009/10 2010/11 2011/12
Central 44,171 23,254 27,970 48,278 43,358 37,910 47,800 50,370 32,374 28,836
Copperbelt 36,505 19,762 29,049 26,778 20,639 21,002 34,192 39,986 19,580 22,291
Eastern 15,268 5,092 5,626 11,427 11,389 12,115 13,014 8,066 4,990 8,126
Luapula 24,922 13,815 17,146 7,237 20,664 30,336 38,128 32,144 17,617 23,105
Lusaka 3,955 3,768 1,951 4,766 3,053 2,313 9,340 5,451 3,152 4,303
Muchinga 29,199
Northern 43,754 52,116 41,099 34,303 35,815 43,266 45,515 58,037 51,741 30,483
NorthWestern 21,304 22,934 20,295 7,129 14,047 19,889 20,159 13,292 14,268 9,816
Southern 9,968 10,575 6,569 27,213 5,376 10,629 43,732 44,446 26,026 19,852
Western 8,672 9,412 2,162 5,169 3,168 4,393 7,614 9,264 3,981 3,151
National 208,521 160,727 151,866 172,299 157,508 181,852 259,494 261,055 173,727 179,162
Number of Small and Medium Scale Farmers Growing Cassava by Province Province 2002/03 2003/04 2004/05 2005/06 2006/07 2007/08 2008/09 2009/10 2010/11 2011/12
Central 30,349 20,144 19,137 22,485 25,274 26,178 24,838 22,832 23,778 22,193
Copperbelt 17,106 14,552 13,773 15,351 11,054 10,953 13,546 11,257 6,271 9,108
Eastern 23,109 10,035 11,920 11,569 10,708 11,234 9,829 6,333 3,354 6,492
Luapula 131,675 134,558 141,617 145,834 149,431 154,613 156,293 157,885 154,296 143,204
Lusaka 3,885 3,179 2,160 2,155 2,787 2,401 2,052 1,771 1,524 1,128
Muchinga 54,097
Northern 190,507 203,015 210,702 220,075 201,860 204,327 196,812 210,706 211,399 154,481
NorthWestern 76,006 69,242 77,405 74,488 79,126 84,641 79,323 74,618 65,999 58,012
Southern 11,707 1,800 456 1,662 573 1,435 1,715 3,208 1,512 1,169
Western 84,745 68,448 62,207 68,163 69,090 61,468 71,822 73,640 74,745 80,663
National 569,089 524,973 539,376 561,782 549,903 557,249 556,231 562,249 542,879 530,547

69
Number of Small and Medium Scale Farmers Growing Paprika by Province Province 2002/03 2003/04 2004/05 2005/06 2006/07 2007/08 2008/09 2009/10 2010/11 2011/12
Central 1,459 2,108 1,474 516 1,425 867 199 460 83 638
Copperbelt 118 38 144 246 56 0 82 60 66 24
Eastern 1,640 85 0 353 0 0 0 0 20 19
Luapula 0 215 196 108 153 90 107 74 . 51
Lusaka 0 248 90 0 0 0 0 0 28 .
Muchinga .
Northern 124 411 197 65 9 109 0 406 35 .
NorthWestern 0 160 173 131 26 43 35 28 . 172
Southern 0 57 69 50 215 61 54 0 41 .
Western 177 232 452 675 63 0 0 0 41 34
National 3,518 3,554 2,795 2,143 1,947 1,170 477 1,027 313 937
Maize. Area Cultivated by Small and Medium Scale Farmers by Province Province 2002/03 2003/04 2004/05 2005/06 2006/07 2007/08 2008/09 2009/10 2010/11 2011/12
Central 124,516 134,456 126,977 154,500 192,315 226,567 167,132 204,174 186,882 173,664
Copperbelt 62,081 60,151 58,441 66,965 74,891 72,176 73,746 89,592 97,283 77,089
Eastern 208,621 194,930 200,506 219,000 232,658 249,730 288,934 286,811 307,823 276,444
Luapula 11,586 18,879 14,189 19,849 19,812 23,352 27,844 30,022 43,879 49,963
Lusaka 31,926 28,502 31,563 35,284 34,275 39,399 30,523 38,068 45,514 30,110
Muchinga 63,962
Northern 59,823 64,401 66,547 82,095 101,667 108,474 102,750 114,129 151,488 117,514
NorthWestern 41,565 46,148 47,986 59,403 70,980 66,569 59,868 66,200 72,876 53,412
Southern 137,914 156,702 175,492 165,003 210,944 251,310 237,293 265,275 309,194 324,800
Western 67,638 76,599 79,366 61,372 101,809 138,643 89,860 87,948 96,356 86,706
National 745,670 780,768 801,067 863,472 1,039,350 1,176,221 1,077,950 1,182,217 1,311,295 1,253,664
Sorghum. Area Cultivated by Small and Medium Scale Farmers by Province
Province 2002/03 2003/04 2004/05 2005/06 2006/07 2007/08 2008/09 2009/10 2010/11 2011/12
Central 6,729 5,349 5,536 4,613 3,896 4,077 3,611 3,035 1,6719 762
Copperbelt 2,782 3,175 3,552 1,056 1,442 1,113 1,681 1,037 1,553 785
Eastern 3,108 2,865 2,201 2,429 3,918 2,273 2,585 2,307 1,890 13
Luapula 3,945 1,791 1,467 986 1,710 1,349 1,987 1,895 1,188 367
Lusaka 177 395 543 269 229 562 159 195 179 444
Muchinga 2,748
Northern 3,788 4,372 1,244 2,117 415 836 697 3,019 1,210 217
NorthWestern 8,813 7,497 8,851 6,965 4,278 4,912 2,928 3,204 1,668 1,248
Southern 12,112 12,834 17,462 12,124 9,946 9,990 20,125 14,278 13,849 9,269
Western 7,049 21,914 19,093 14,268 9,348 6,438 6,592 4,576 2,660 3,866
National 48,502 60,193 59,947 44,826 35,183 31,551 40,365 33,546 25,867 19,718
Rice. Area Cultivated by Small and Medium Scale Farmers by Province Province 2002/03 2003/04 2004/05 2005/06 2006/07 2007/08 2008/09 2009/10 2010/11 2011/12
Central 109 291 463 0 253 89 262 152 305 3
Copperbelt 4 14 5 11 7 7 30 27 18 31
Eastern 644 3,980 3,827 3,867 3,699 3,175 3,021 4,249 2,650 1,977
Luapula 432 593 696 1,007 1,247 1,320 1,353 1,043 1,192 1,816
Lusaka 0 0 10 8 154 53 99 76 125 65
Muchinga 4,405
Northern 5,884 6,101 6,478 5,938 10,469 12,017 14,110 15,308 14,995 7,860
NorthWestern 0 373 210 54 163 746 863 484 649 240
Southern 0 0 0 3 0 0 13 0 .00 68
Western 4,053 3,025 7,260 1,911 7,751 12,264 11,282 14,503 14,054 13,838
National 11,127 14,377 18,949 12,799 23,743 29,671 31,032 35,841 33,988 39,705

70
Millet. Area Cultivated by Small and Medium Scale Farmers by Province Province 2002/03 2003/04 2004/05 2005/06 2006/07 2007/08 2008/09 2009/10 2010/11 2011/12
Central 5,063 3,699 2,645 3,664 3,020 4,624 5,373 4,142 2,319 1,482
Copperbelt 177 75 207 285 178 275 402 507 281 110
Eastern 1,512 1,687 1,803 1,999 4,130 1,385 1,753 1,668 1,784 365
Luapula 2,815 1,873 2,752 1,978 2,287 1,479 1,147 1,746 590 1,625
Lusaka 105 99 0 44 4 12 25 12 53 161
Muchinga 7,071
Northern 42,143 35,770 36,020 33,353 36,175 32,193 38,762 31,513 25,957 11,290
NorthWestern 796 1,696 964 845 787 532 770 343 578 274
Southern 4,140 5,710 8,917 9,731 5,019 3,720 4,792 3,980 1,195 4,701
Western 11,296 22,173 14,780 17,819 17,368 12,904 8,532 12,868 9,808 8,038
National 68,048 72,782 68,088 69,717 68,968 57,124 61,556 56,780 42,566 35,118
Sunflower. Area Cultivated by Small and Medium Scale Farmers by Province Province 2002/03 2003/04 2004/05 2005/06 2006/07 2007/08 2008/09 2009/10 2010/11 2011/12
Central 3,892 9,513 3,531 5,924 4,991 2,694 4,953 4,641 1,692 1,654
Copperbelt 6 192 130 96 13 65 60 118 106 131
Eastern 12,794 19,972 18,651 27,663 19,957 30,715 51,135 37,433 26,200 27,402
Luapula 21 107 55 51 17 8 38 42 13.00 40
Lusaka 0 146 99 249 252 92 130 411 7,0.87 127
Muchinga 624
Northern 2,274 2,282 3,557 2,889 3,703 2,241 2,471 5,194 3,015 2,838
NorthWestern 30 50 301 113 56 22 54 36 24 18
Southern 3,908 5,675 5,323 6,170 5,284 4,034 11,704 5,731 8,495 7,386
Western 0 0 25 0 3 47 18 86 22 83
National 22,926 37,937 31,671 43,156 34,276 39,917 70,564 53,691 39,638 40,304
Groundnuts. Area Cultivated by Small and Medium Scale Farmers by Province
Province 2002/03 2003/04 2004/05 2005/06 2006/07 2007/08 2008/09 2009/10 2010/11 2011/12
Central 19,024 8,009 10,862 10,586 29,263 24,687 29,465 34,130 30,521 18,353
Copperbelt 5,950 4,087 7,098 5,755 8,431 7,353 10,385 14,746 8,227 7,592
Eastern 65,767 49,289 62,233 38,893 46,476 60,146 74,602 89,036 67,009 55,891
Luapula 18,695 13,248 14,469 18,568 16,228 17,542 20,193 21,196 18,396 18,433
Lusaka 2,589 2,059 3,392 2,608 2,249 3,343 2,300 3,462 3,013 2,296
Muchinga 12,902
Northern 46,234 38,038 38,485 40,478 39,759 38,294 46,461 49,603 42,216 31,524
NorthWestern 6,993 6,946 8,098 8,606 6,436 6,528 6,440 6,459 5,576 5,429
Southern 8,680 14,989 22,415 29,257 30,015 23,847 19,940 37,924 38,216 23,997
Western 4,593 5,297 4,140 2,978 5,175 7,661 5,538 11,021 10,123 4,994
National 178,525 141,962 171,193 157,729 184,034 189,399 215,324 267,578 223,298 181,410
Soyabean. Area Cultivated by Small and Medium Scale Farmers by Province Province 2002/03 2003/04 2004/05 2005/06 2006/07 2007/08 2008/09 2009/10 2010/11 2011/12
Central 3,137 7,547 13,239 9,113 15,515 2,705 6,971 10,312 8,191 4,777
Copperbelt 262 538 1,056 414 686 242 362 1,117 249 843
Eastern 4,767 8,432 13,997 13,675 9,790 6,656 9,792 10,228 7,351 8,615
Luapula 75 192 125 279 323 160 335 210 127 157
Lusaka 141 626 1,739 576 262 81 218 175 211 248
Muchinga 1,415
Northern 4,459 3,255 7,941 7,090 4,274 3,006 3,648 5,712 2,779 1,467
NorthWestern 234 84 301 307 471 348 632 601 317 331
Southern 689 1,332 256 129 161 323 640 455 769 273
Western 0 14 0 87 44 65 20 62 67 218
National 13,765 22,020 38,655 31,669 31,527 13,585 22,618 28,871 20,060 18,343

71
Cotton. Area Cultivated by Small and Medium Scale Farmers by Province Province 2002/03 2003/04 2004/05 2005/06 2006/07 2007/08 2008/09 2009/10 2010/11 2011/12
Central 28,835 32,804 39,966 54,193 20,212 21,137 15,048 20,342 31,953 67,105
Copperbelt 0 14 32 44 77 25 11 8 36 555
Eastern 62,337 83,621 117,105 90,816 75,150 110,489 73,246 59,282 85,041 190,896
Luapula 0 0 0 0 0 0 0 0 0 0
Lusaka 345 1,393 2,435 2,173 1,305 924 430 174 626 2,043
Muchinga 10,431
Northern 0 0 64 0 287 90 159 12 0 0
NorthWestern 0 84 0 37 17 0 0 0 8 0
Southern 7,689 23,241 33,020 29,508 9,123 15,305 13,803 4,864 13,811 44,382
Western 177 722 962 842 356 273 87 42 214 763
National 99,383 141,878 193,585 177,613 106,528 148,244 102,784 84,724 131,691 316,175 Irish Potatoes. Area Cultivated by Small and Medium Scale Farmers by Province Province 2002/03 2003/04 2004/05 2005/06 2006/07 2007/08 2008/09 2009/10 2010/11 2011/12
Central 0 0 12 7 47 111 90 55 29 143
Copperbelt 0 0 58 148 79 65 40 104 125 30
Eastern 0 0 232 368 8 305 88 287 195 215
Luapula 0 0 0 0 0 8 1 2 10 12
Lusaka 0 0 69 0 5 70 26 12 32 3
Muchinga 37
Northern 0 0 184 54 108 61 111 59 33 25
NorthWestern 0 0 9 236 471 407 70 124 367 455
Southern 0 0 0 8 2 39 142 28 143 12
Western 0 0 0 14 0 0 0 5 4 0
National 0 0 564 835 718 1,065 568 674 938 931
Tobacco. Area Cultivated by Small and Medium Scale Farmers by Province Province 2002/03 2003/04 2004/05 2005/06 2006/07 2007/08 2008/09 2009/10 2010/11 2011/12
Central 56 702 1,881 714 584 1,318 2,742 2,756 4,059 861
Copperbelt 0 0 0 0 0 6 1 64 18 0
Eastern 4,127 9,133 11,545 5,687 1,259 3,205 7,192 6,932 7,899 3,575
Luapula 0 0 0 0 0 0 2 7 0 0
Lusaka 0 0 186 0 0 0 60 0 7 0
Muchinga 46
Northern 0 386 174 56 0 424 444 1,016 403 0
NorthWestern 0 0 37 0 0 0 0 0 56 14
Southern 1,194 567 1,141 580 213 12 1,227 1,205 2,038 2,286
Western 0 336 1,082 2,329 706 1,279 2,124 2,310 3,063 408
National 5,377 11,123 16,046 9,366 2,761 6,244 13,792 14,290 17,542 7,190
Beans. Area Cultivated by Small and Medium Scale Farmers by Province Province 2002/03 2003/04 2004/05 2005/06 2006/07 2007/08 2008/09 2009/10 2010/11 2011/12
Central 6,597 3,558 4,650 6,393 6,200 4,869 8,535 8,117 3,853 5,072
Copperbelt 1,918 1,332 2,648 1,928 1,957 1,736 3,239 3,430 2,436 2,316
Eastern 2,704 2,505 2,515 2,260 1,799 2,314 4,067 3,634 2,571 3,930
Luapula 1,859 3,733 4,331 3,014 3,411 4,089 5,204 5,057 4,131 6,278
Lusaka 677 751 814 585 762 695 362 1,900 811 717
Muchinga 10,147
Northern 29,882 32,161 36,237 40,136 50,784 59,338 54,497 53,423 49,906 60,566
NorthWestern 4,193 9,208 6,997 13,092 4,627 5,968 5,664 5,678 4,703 5,183
Southern 4,491 4,039 1,452 830 1,428 596 824 1,631 275 1,716
Western 188 3,086 835 25 649 973 267 865 1,237 308
National 52,509 60,372 60,480 68,263 71,616 80,577 82,659 83,735 69,923 96,232

72
Cowpeas. Area Cultivated by Small and Medium Scale Farmers by Province Province 2002/03 2003/04 2004/05 2005/06 2006/07 2007/08 2008/09 2009/10 2010/11 2011/12
Central 1,561 200 628 943 1,042 854 920 1,068 115 402
Copperbelt 298 39 101 59 12 10 177 70 72 30
Eastern 32 353 21 172 236 649 259 274 37 158
Luapula 12 52 0 48 15 6 107 69 18 45
Lusaka 30 175 204 566 162 71 221 8 56 53
Muchinga 189
Northern 137 4,601 167 178 769 174 450 264 239 93
NorthWestern 105 124 182 126 26 169 58 12 5 0
Southern 4,506 4,601 4,329 5,253 1,998 2,354 10,054 3,199 1,008 1,875
Western 577 1,299 624 658 917 396 510 1,341 392 2,297
Velvet Beans. Area Cultivated by Small and Medium Scale Farmers by Province Province 2002/03 2003/04 2004/05 2005/06 2006/07 2007/08 2008/09 2009/10 2010/11 2011/12
Central 0 0 67 0 0 0 34 47 23 0
Copperbelt 0 0 28 0 0 0 0 0 0 0
Eastern 0 0 0 0 44 0 2 0 35 0
Luapula 0 0 0 0 0 9 3 0 3 0
Lusaka 0 0 2 9 0 0 0 375 0 4
Muchinga 0
Northern 0 0 0 762 1 0 0 32 2 0
NorthWestern 0 0 0 0 12 0 0 0 0 4
Southern 0 0 12 0 0 1 315 161 0 158
Western 0 0 0 21 0 0 0 0 0 0
National 0 0 109 792 58 11 355 615 63 166
Coffee. Area Cultivated by Small and Medium Scale Farmers by Province Province 2002/03 2003/04 2004/05 2005/06 2006/07 2007/08 2008/09 2009/10 2010/11 2011/12
Central 0 0 30 0 45 0 0 0 0 0
Copperbelt 0 0 0 0 0 0 0 9 0 0
Eastern 0 0 0 0 0 0 0 0 0 79
Luapula 0 0 0 0 0 0 0 0 0 0
Lusaka 0 0 0 0 0 0 0 0 0 0
Muchinga 0
Northern 0 0 0 21 0 0 0 0 12 0
NorthWestern 0 0 0 0 0 0 0 0 0 0
Southern 0 0 0 0 0 0 0 0 17 0
Western 0 0 0 0 0 0 0 0 0 0
National 0 0 30 21 45 0 0 9 29 79
Sweet Potatoes. Area Cultivated by Small and Medium Scale Farmers by Province Province 2002/03 2003/04 2004/05 2005/06 2006/07 2007/08 2008/09 2009/10 2010/11 2011/12
Central 12,372 7,681 6,962 12,397 14,519 11,726 14,598 19,097 9,848 8,825
Copperbelt 11,429 4,750 7,314 6,155 6,038 4,948 8,280 11,110 4,520 5,137
Eastern 4,316 1,090 863 2,420 2,588 2,590 3,220 2,091 1,682 1,873
Luapula 3,449 2,648 2,303 1,078 2,876 4,844 5,631 4,624 2,638 3,937
Lusaka 654 753 483 1,137 557 645 1,553 1,470 626 1,167
Muchinga 5,680
Northern 8,282 10,181 6,665 6,061 8,538 9,293 11,622 13,365 11,509 7,159
NorthWestern 4,613 4,715 3,227 1,355 2,886 3,179 3,280 2,303 2,462 1,567
Southern 2,688 3,219 1,581 6,242 1,614 3,678 14,007 13,350 10,849 5,580
Western 1,808 1,941 626 1,180 887 1,219 1,778 2,384 926 601
National 49,611 36,977 30,024 38,025 40,504 42,120 63,970 69,794 45,059 41,526

73
Cassava. Area Cultivated by Small and Medium Scale Farmers by Province Province 2002/03 2003/04 2004/05 2005/06 2006/07 2007/08 2008/09 2009/10 2010/11 2011/12
Central 14,032 10,640 11,019 10,048 11,786 17,226 13,211 14,667 10,041 13,807
Copperbelt 5,118 5,197 4,551 4,662 3,806 3,952 3,669 3,076 1,867 2,771
Eastern 6,750 2,588 2,650 3,242 2,367 2,151 2,477 1,499 759 1,463
Luapula 103,310 117,316 121,185 121,039 110,496 133,586 109,756 125,633 131,193 123,086
Lusaka 1,440 1,589 757 859 795 1,021 602 343 508 273
Muchinga 36,621
Northern 130,163 155,442 173,766 177,971 143,508 139,810 160,724 151,029 138,126 119,745
NorthWestern 49,737 42,247 46,259 41,264 47,032 52,482 54,501 54,105 47,203 41,991
Southern 2,964 598 227 392 193 447 574 682 329 343
Western 51,878 36,515 39,169 39,190 44,335 39,278 47,418 52,183 56,582 49,151
National 365,393 372,132 399,582 398,667 364,317 389,953 392,933 403,217 386,608 389,250
Paprika. Area Cultivated by Small and Medium Scale Farmers by Province Province 2002/03 2003/04 2004/05 2005/06 2006/07 2007/08 2008/09 2009/10 2010/11 2011/12
Central 438 732 435 134 882 256 94 145 21 480
Copperbelt 15 4 31 75 25 0 13 6 18 3
Eastern 433 21 0 57 0 0 0 0 2 5
Luapula 0 38 37 21 19 15 7 6 . 3
Lusaka 0 35 29 0 0 0 0 0 22 .
Muchinga .
Northern 15 67 30 4 1 17 0 59 4 .
NorthWestern 0 16 11 8 4 11 2 2 . 11
Southern 0 23 26 10 63 23 14 0 5 .
Western 44 170 128 159 24 0 0 0 8 11
National 945 1,107 728 469 1,017 322 130 218 81 513
Maize. Production in Metric Tons by Small and Medium Scale Farmers by Province Province 2002/03 2003/04 2004/05 2005/06 2006/07 2007/08 2008/09 2009/10 2010/11 2011/12
Central 226,991 375,242 96,855 281,153 382,366 355,426 289,283 526,315 426,629 441,444
Copperbelt 88,827 109,804 66,493 122,391 121,890 129,358 124,095 182,016 213,913 176,225
Eastern 263,190 285,726 163,380 306,319 247,226 336,785 392,068 531,810 575,850 569,407
Luapula 19,520 27,849 23,026 42,635 30,944 45,427 56,270 67,919 123,678 137,459
Lusaka 43,197 53,215 16,025 54,703 57,436 32,951 45,377 89,586 87,031 72,526
Muchinga 209,458
Northern 101,632 120,246 105,540 141,442 187,263 230,609 257,199 306,330 504,915 329,652
NorthWestern 62,964 73,072 54,350 98,057 88,456 99,832 98,447 129,237 150,350 125,452
Southern 121,179 258,069 93,807 249,428 259,222 115,568 339,641 541,507 611,912 599,173
Western 42,816 61,618 28,434 38,167 45,993 46,223 54,738 88,804 92,617 71,047
National 970,317 1,364,841 647,909 1,334,296 1,420,798 1,392,180 1,657,117 2,463,523 2,786,896 2,731,843
Sorghum. Production in Metric Tons by Small and Medium Scale Farmers by Province
Province 2002/03 2003/04 2004/05 2005/06 2006/07 2007/08 2008/09 2009/10 2010/11 2011/12
Central 4,109 5,979 2,593 2,199 1,575 1,366 2,728 2,406 1,306 666
Copperbelt 1,719 2,362 2,460 592 629 486 806 829 1,388 580
Eastern 1,982 1,460 556 1,390 1,695 1,271 1,986 2,409 2,392 7
Luapula 2,029 1,519 809 912 1,282 1,214 1,866 1,421 1,061 359
Lusaka 130 161 56 116 22 120 38 354 87 253
Muchinga 2,833
Northern 2,081 2,909 947 1,482 206 670 576 2,416 876 166
NorthWestern 6,768 8,088 7,253 4,390 2,549 3,051 2,586 2,237 1,282 854
Southern 3,276 4,032 1,519 2,917 3,087 3,028 8,352 10,340 8,016 10,658
Western 2,564 5,999 4,849 3,741 2,626 2,089 2,690 3,043 1,467 1,391
National 24,658 32,509 21,042 17,739 13,671 13,295 21,629 25,455 17,874 17,767

74
Rice. Production in Metric Tons by Small and Medium Scale Farmers by Province Province 2002/03 2003/04 2004/05 2005/06 2006/07 2007/08 2008/09 2009/10 2010/11 2011/12
Central 80 359 79 0 314 7 259 57 610 10
Copperbelt 2 8 0 13 4 6 34 37 43 55
Eastern 586 2,377 2,576 4,121 2,940 2,935 5,120 5,779 4,418 2,206
Luapula 450 570 1,027 1,488 1,236 2,295 3,311 1,885 2,652 4,234
Lusaka 0 0 3 3 15 17 156 115 204 47
Muchinga 7,752
Northern 7,208 5,769 5,867 6,980 13,606 18,157 20,992 28,653 25,906 12,388
NorthWestern 0 362 182 100 119 704 945 723 814 526
Southern 0 0 0 1 0 0 25 . 0 44
Western 1,307 1,844 2,272 1,665 5,348 6,121 11,088 14,407 14,756 16,064
National 9,632 11,290 12,005 14,370 23,582 30,243 41,929 51,656 49,404 43,326
Millet. Production in Metric Tons by Small and Medium Scale Farmers by Province Province 2002/03 2003/04 2004/05 2005/06 2006/07 2007/08 2008/09 2009/10 2010/11 2011/12
Central 2,914 1,972 781 2,306 1,704 2,135 3,399 2,255 2,150 1,448
Copperbelt 130 38 63 294 117 284 430 389 118 182
Eastern 923 725 669 1,420 1,738 722 641 1,321 1,611 122
Luapula 2,104 2,034 2,082 1,432 1,320 2,035 753 1,702 544 1,995
Lusaka 52 28 0 19 1 0 9 0 24 208
Muchinga 6,990
Northern 31,758 36,422 28,870 28,542 14,529 34,479 38,082 34,495 27,979 13,022
NorthWestern 525 1,154 390 642 546 405 917 418 547 383
Southern 915 1,927 1,324 1,809 1,415 874 2,259 1,936 722 2,834
Western 3,103 6,117 1,748 4,415 4,486 3,317 2,445 5,476 3,955 2,182
National 42,424 50,417 35,927 40,879 25,857 44,253 48,936 47,992 37,650 29,366
Sunflower. Production in Metric Tons by Small and Medium Scale Farmers by Province
Province 2002/03 2003/04 2004/05 2005/06 2006/07 2007/08 2008/09 2009/10 2010/11 2011/12 Central 1,616 5,322 762 2,109 1,657 757 1,540 1,879 1,281 901 Copperbelt 4 89 123 16 6 6 22 119 77 48 Eastern 5,423 7,826 5,330 11,590 6,869 12,271 24,597 18,315 13,552 12,807 Luapula 9 31 36 19 8 4 18 15 5 34 Lusaka 0 61 17 69 51 57 100 175 32 76 Muchinga 466 Northern 1,010 722 1,680 1,283 1,073 1,033 1,262 2,100 2,095 1,569 NorthWestern 12 28 113 65 23 33 34 14 10 15 Southern 1,253 2,249 575 1,444 1,011 541 4,884 2,458 2,968 3,686 Western 0 0 3 0 1 21 10 51 6 25 National 9,327 16,329 8,639 16,596 10,699 14,724 32,466 25,126 20,026 19,626
Groundnuts. Production in Metric Tons by Small and Medium Scale Farmers by Province
Province 2002/03 2003/04 2004/05 2005/06 2006/07 2007/08 2008/09 2009/10 2010/11 2011/12 Central 11,851 3,127 3,666 4,622 12,171 13,846 15,785 19,687 16,684 11,713 Copperbelt 3,407 2,594 3,785 3,048 3,264 4,430 6,420 9,471 6,068 4,545 Eastern 38,077 29,770 20,676 15,395 16,058 25,222 35,939 49,854 29,535 30,014 Luapula 9,935 8,903 10,624 9,493 7,326 11,321 12,535 13,776 11,445 14,514 Lusaka 1,191 996 449 1,113 719 792 1,581 1,719 1,407 1,112 Muchinga 9,935 Northern 28,172 22,504 28,004 21,686 16,222 33,027 30,055 34,858 30,994 18,179 NorthWestern 4,825 5,639 6,770 4,914 2,892 4,155 4,476 5,229 4,605 6,668 Southern 1,966 6,396 5,535 7,630 7,810 3,768 10,369 23,024 32,652 9,959 Western 1,575 1,816 1,690 1,361 1,549 1,615 2,713 6,120 5,499 2,145 National 100,998 81,745 81,198 69,262 68,012 98,176 119,872 163,738 138,889 108,784

75
Soyabean. Production in Metric Tons by Small and Medium Scale Farmers by Province
Province 2002/03 2003/04 2004/05 2005/06 2006/07 2007/08 2008/09 2009/10 2010/11 2011/12 Central 2,151 4,574 5,315 5,871 8,785 1,431 4,809 10,629 6,929 3,953 Copperbelt 183 357 1,204 277 391 174 388 1,195 183 914 Eastern 2,615 5,112 13,446 10,844 5,996 5,138 6,695 7,847 7,260 5,427 Luapula 47 85 112 152 196 159 252 166 90 175 Lusaka 52 319 676 455 163 27 149 107 182 511 Muchinga 1,195 Northern 2,491 1,338 5,602 5,118 2,497 1,898 2,640 5,095 2,144 969 NorthWestern 145 37 250 146 293 263 549 613 549 342 Southern 78 646 66 53 67 41 392 474 1,081 161 Western 0 1 0 37 29 17 11 39 92 85 National 7,762 12,469 26,671 22,953 18,416 9,149 15,884 26,165 18,510 13,732
Cotton. Production in Metric Tons by Small and Medium Scale Farmers by Province
Province 2002/03 2003/04 2004/05 2005/06 2006/07 2007/08 2008/09 2009/10 2010/11 2011/12
Central 28,936 26,030 25,678 69,548 10,921 9,760 9,295 17,218 27,554 52,151
Copperbelt 0 9 53 23 9 27 7 6 40 709
Eastern 57,672 90,244 77,232 76,759 47,739 76,368 65,707 49,568 83,836 159,712
Luapula 0 0 0 0 0 0 0 . 0 0
Lusaka 219 997 2,333 2,131 777 325 293 241 419 1,812
Muchinga 16,790
Northern 0 0 29 0 277 81 148 4 0 0
NorthWestern 0 16 0 32 5 0 0 . 1 0
Southern 6,982 29,780 15,491 21,814 4,245 4,692 10,734 5,004 90,671 36,818
Western 255 235 528 418 139 334 94 29 474 909
National 94,063 147,310 121,344 170,724 64,110 91,588 86,277 72,068 121,392 268,902 Irish Potatoes. Production in Metric Tons by Small and Medium Scale Farmers by Province Province 2002/03 2003/04 2004/05 2005/06 2006/07 2007/08 2008/09 2009/10 2010/11 2011/12
Central 0 0 8 1 30 134 103 70 9 91
Copperbelt 0 0 49 328 71 166 69 389 383 77
Eastern 0 0 460 448 3 639 231 881 273 274
Luapula 0 0 0 0 0 11 3 3 17 36
Lusaka 0 0 33 0 15 248 63 9 62 6
Muchinga 85
Northern 0 0 71 84 106 114 437 86 42 22
NorthWestern 0 0 32 893 699 1,268 247 609 963 1,687
Southern 0 0 0 56 6 15 158 16 262 60
Western 0 0 0 35 0 0 0 7 9 0
National 0 0 652 1,844 930 2,595 1,311 2,071 2,020 2,337 Tobacco. Production in Metric Tons by Small and Medium Scale Farmers by Province Province 2002/03 2003/04 2004/05 2005/06 2006/07 2007/08 2008/09 2009/10 2010/11 2011/12 Central 53 553 1,563 567 378 1,084 2,780 3,664 4,700 919 Copperbelt 0 0 0 0 0 4 0 29 2 0 Eastern 3,945 8,523 8,437 5,621 1,108 4,291 8,396 7,469 10,122 4,832 Luapula 0 0 0 0 0 0 1 9 0 0 Lusaka 0 0 172 0 0 0 48 0 2 0 Muchinga 71 Northern 0 260 161 58 0 188 324 698 141 0 NorthWestern 0 0 7 0 0 0 0 0 130 7 Southern 1,036 920 1,008 571 104 16 679 1,133 1,976 6,919 Western 0 777 1,932 2,615 736 3,975 2,990 1,762 3,427 430 National 5,034 11,033 13,280 9,431 2,325 9,558 15,219 14,763 20,500 13,178
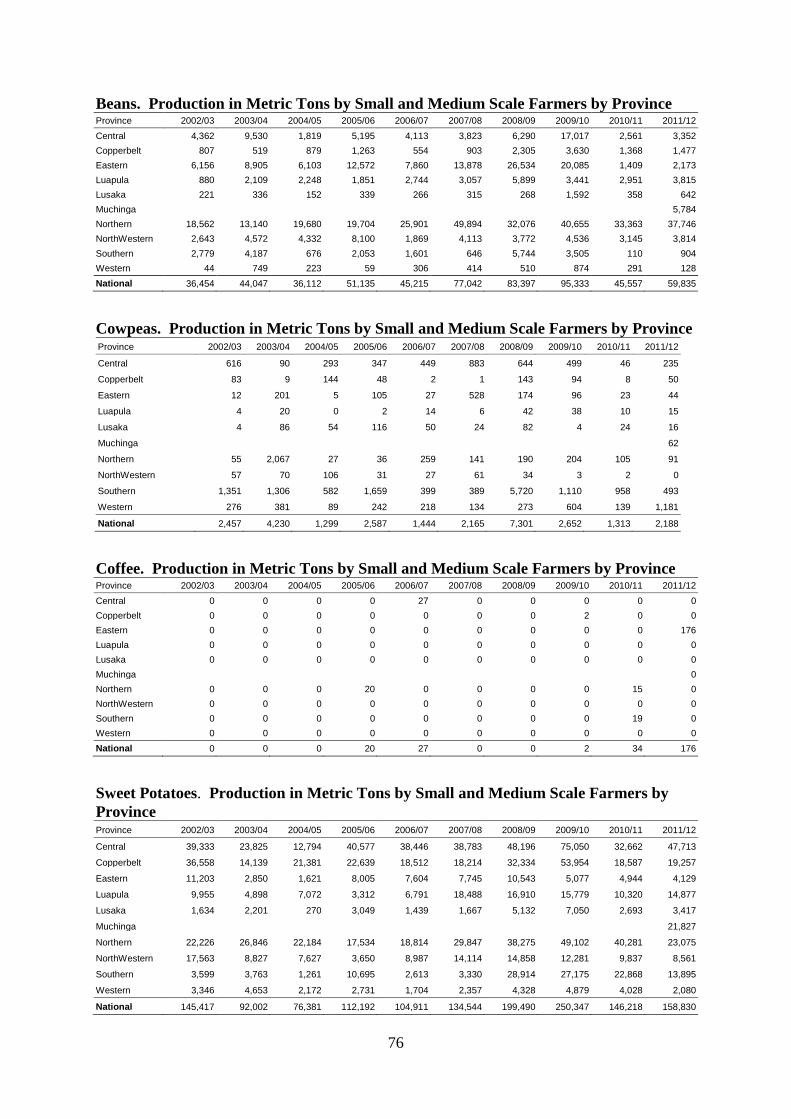
76
Beans. Production in Metric Tons by Small and Medium Scale Farmers by Province Province 2002/03 2003/04 2004/05 2005/06 2006/07 2007/08 2008/09 2009/10 2010/11 2011/12 Central 4,362 9,530 1,819 5,195 4,113 3,823 6,290 17,017 2,561 3,352 Copperbelt 807 519 879 1,263 554 903 2,305 3,630 1,368 1,477 Eastern 6,156 8,905 6,103 12,572 7,860 13,878 26,534 20,085 1,409 2,173 Luapula 880 2,109 2,248 1,851 2,744 3,057 5,899 3,441 2,951 3,815 Lusaka 221 336 152 339 266 315 268 1,592 358 642 Muchinga 5,784 Northern 18,562 13,140 19,680 19,704 25,901 49,894 32,076 40,655 33,363 37,746 NorthWestern 2,643 4,572 4,332 8,100 1,869 4,113 3,772 4,536 3,145 3,814 Southern 2,779 4,187 676 2,053 1,601 646 5,744 3,505 110 904 Western 44 749 223 59 306 414 510 874 291 128 National 36,454 44,047 36,112 51,135 45,215 77,042 83,397 95,333 45,557 59,835
Cowpeas. Production in Metric Tons by Small and Medium Scale Farmers by Province Province 2002/03 2003/04 2004/05 2005/06 2006/07 2007/08 2008/09 2009/10 2010/11 2011/12
Central 616 90 293 347 449 883 644 499 46 235
Copperbelt 83 9 144 48 2 1 143 94 8 50
Eastern 12 201 5 105 27 528 174 96 23 44
Luapula 4 20 0 2 14 6 42 38 10 15
Lusaka 4 86 54 116 50 24 82 4 24 16
Muchinga 62
Northern 55 2,067 27 36 259 141 190 204 105 91
NorthWestern 57 70 106 31 27 61 34 3 2 0
Southern 1,351 1,306 582 1,659 399 389 5,720 1,110 958 493
Western 276 381 89 242 218 134 273 604 139 1,181
National 2,457 4,230 1,299 2,587 1,444 2,165 7,301 2,652 1,313 2,188
Coffee. Production in Metric Tons by Small and Medium Scale Farmers by Province Province 2002/03 2003/04 2004/05 2005/06 2006/07 2007/08 2008/09 2009/10 2010/11 2011/12 Central 0 0 0 0 27 0 0 0 0 0 Copperbelt 0 0 0 0 0 0 0 2 0 0 Eastern 0 0 0 0 0 0 0 0 0 176 Luapula 0 0 0 0 0 0 0 0 0 0 Lusaka 0 0 0 0 0 0 0 0 0 0 Muchinga 0 Northern 0 0 0 20 0 0 0 0 15 0 NorthWestern 0 0 0 0 0 0 0 0 0 0 Southern 0 0 0 0 0 0 0 0 19 0 Western 0 0 0 0 0 0 0 0 0 0 National 0 0 0 20 27 0 0 2 34 176
Sweet Potatoes. Production in Metric Tons by Small and Medium Scale Farmers by Province Province 2002/03 2003/04 2004/05 2005/06 2006/07 2007/08 2008/09 2009/10 2010/11 2011/12
Central 39,333 23,825 12,794 40,577 38,446 38,783 48,196 75,050 32,662 47,713
Copperbelt 36,558 14,139 21,381 22,639 18,512 18,214 32,334 53,954 18,587 19,257
Eastern 11,203 2,850 1,621 8,005 7,604 7,745 10,543 5,077 4,944 4,129
Luapula 9,955 4,898 7,072 3,312 6,791 18,488 16,910 15,779 10,320 14,877
Lusaka 1,634 2,201 270 3,049 1,439 1,667 5,132 7,050 2,693 3,417
Muchinga 21,827
Northern 22,226 26,846 22,184 17,534 18,814 29,847 38,275 49,102 40,281 23,075
NorthWestern 17,563 8,827 7,627 3,650 8,987 14,114 14,858 12,281 9,837 8,561
Southern 3,599 3,763 1,261 10,695 2,613 3,330 28,914 27,175 22,868 13,895
Western 3,346 4,653 2,172 2,731 1,704 2,357 4,328 4,879 4,028 2,080
National 145,417 92,002 76,381 112,192 104,911 134,544 199,490 250,347 146,218 158,830

77
Cassava. Estimated Production in Metric Tons by Small and Medium Scale Farmers by Province
Province 2002/03 2003/04 2004/05 2005/06 2006/07 2007/08 2008/09 2009/10 2010/11 2011/12 Central 21,467 56,727 59,895 36,891 31,091 32,160 59,033 60,430 16,608 48,014 Copperbelt 10,083 26,460 18,820 20,899 18,891 13,019 9,488 10,568 4,873 9,783 Eastern 11,942 13,132 12,355 9,340 11,694 4,294 7,989 5,322 2,644 5,439 Luapula 302,942 526,422 633,917 549,943 556,140 386,175 356,781 423,793 425,899 363,228 Lusaka 544 9,283 3,888 3,845 3,093 1,187 1,812 1,135 999 261 Muchinga 106,649 Northern 336,612 671,395 707,836 736,859 610,428 297,455 466,469 468,842 307,659 363,639 NorthWestern 174,994 177,766 203,287 183,281 222,970 121,173 145,776 143,571 111,987 113,747 Southern 6,702 2,955 590 1,118 1,166 1,219 2,924 1,262 1,754 1,124 Western 219,327 200,496 196,974 215,915 251,420 130,164 194,026 133,638 225,275 215,467 National 1,084,613 1,684,635 1,837,561 1,758,092 1,706,894 986,848 1,244,298 1,248,561 1,097,697 1,227,352
Paprika. Production in Metric Tons by Small and Medium Scale Farmers by Province Province 2002/03 2003/04 2004/05 2005/06 2006/07 2007/08 2008/09 2009/10 2010/11 2011/12 Central 203 913 278 54 290 335 18 22 3 65 Copperbelt 6 1 7 36 10 0 6 9 31 1 Eastern 127 11 0 10 0 0 0 0 1 2 Luapula 0 9 20 12 7 10 2 2 . 0 Lusaka 0 18 5 0 0 0 0 0 4 . Muchinga . Northern 3 2 3 1 1 4 0 15 6 . NorthWestern 0 3 0 4 1 4 2 1 . 38 Southern 0 9 0 1 14 0 1 0 0 . Western 13 51 60 42 18 0 0 0 3 . National 352 1,017 374 161 341 353 28 49 49 105
Maize. Average Yields (kg) per Hectare Planted for Small and Medium Scale Farmers by Province Province 2002/03 2003/04 2004/05 2005/06 2006/07 2007/08 2008/09 2009/10 2010/11 2011/12 Central 1,889 2,923 736 1,657 1,826 1,588 1,683 2,496 2,285 2,514 Copperbelt 1,424 1,828 1,257 1,940 1,741 1,881 1,768 2,289 2,237 2,257 Eastern 1,259 1,498 900 1,394 1,075 1,291 1,333 1,878 1,841 2,002 Luapula 1,409 1,491 1,651 1,738 1,374 1,796 1,807 2,118 2,444 2,509 Lusaka 1,332 1,828 541 1,439 1,501 784 1,459 2,255 1,881 2,248 Muchinga 3,149 Northern 1,708 1,969 1,717 1,771 1,859 2,167 2,570 2,798 3,195 2,853 NorthWestern 1,549 1,589 1,171 1,413 1,133 1,357 1,473 1,869 1,985 2,292 Southern 846 1,625 587 1,455 1,283 533 1,385 1,915 1,853 1,736 Western 739 1,009 422 662 527 388 661 1,111 1,126 901 National 1,318 1,744 951 1,469 1,328 1,294 1,564 2,082 2,133 2,163
Sorghum. Average Yields (kg) per Hectare Planted for Small and Medium Scale Farmers by Province Province 2002/03 2003/04 2004/05 2005/06 2006/07 2007/08 2008/09 2009/10 2010/11 2011/12 Central 696 1,172 380 540 373 452 812 776 799 1,146 Copperbelt 618 928 729 660 509 666 538 942 749 843 Eastern 663 639 382 487 485 653 838 1,150 1,459 552 Luapula 608 1,042 554 911 737 1,182 941 813 1,024 1,072 Lusaka 851 459 119 504 77 291 315 759 517 539 Muchinga 1,095 Northern 575 919 811 698 542 808 979 1,128 947 1,012 NorthWestern 832 1,266 829 659 606 628 871 765 957 695 Southern 336 376 143 319 337 328 561 763 674 1,074 Western 396 448 342 346 315 300 485 697 617 486 National 557 744 429 467 420 501 669 851 844 904

78
Rice. Average Yields (kg) per Hectare Planted for Small and Medium Scale Farmers by Province Province 2002/03 2003/04 2004/05 2005/06 2006/07 2007/08 2008/09 2009/10 2010/11 2011/12
Central 1,251 940 340 . 1,345 258 988 434 1,760 3,397
Copperbelt 481 555 240 1,873 548 786 1,422 2,241 3,127 1,936
Eastern 727 760 702 1,271 883 1,001 1,838 1,572 1,953 1,149
Luapula 1,056 984 1,480 1,351 1,182 1,854 2,445 1,974 2,346 1,951
Lusaka . . 433 536 109 465 1,682 1,650 1,486 983
Muchinga 2,126
Northern 1,045 1,389 1,106 1,541 1,050 1,624 1,589 2,027 1,688 1,717
NorthWestern . 960 858 1,390 1,221 1,193 1,269 1,355 1,364 1,842
Southern . . . 480 . . 1,965 . . 607
Western 410 710 454 905 652 577 951 1,348 1,198 1,328
National 830 1,022 783 1,307 900 1,163 1,475 1,690 1,614 1,604
Millet. Average Yields (kg) per Hectare Planted for Small and Medium Scale Farmers by Province Province 2002/03 2003/04 2004/05 2005/06 2006/07 2007/08 2008/09 2009/10 2010/11 2011/12
Central 629 519 347 653 599 619 686 602 999 1,019
Copperbelt 804 639 452 981 703 1,059 859 1,549 541 1,721
Eastern 742 462 426 653 441 581 450 966 997 313
Luapula 837 1,128 758 714 596 1,449 741 1,060 1,139 1,442
Lusaka 638 257 . 365 383 27 319 17 507 1,087
Muchinga 1,202
Northern 780 1,305 933 942 453 1,307 1,200 1,271 1,274 1,334
NorthWestern 597 765 431 844 710 1,016 1,505 1,513 981 1,432
Southern 285 474 198 204 317 292 621 786 872 645
Western 304 302 165 303 330 350 379 518 464 382
National 675 961 665 702 443 1,030 993 1,075 1,110 1,088
Sunflower. Average Yields (kg) per Hectare Planted for Small and Medium Scale Farmers by Province Province 2002/03 2003/04 2004/05 2005/06 2006/07 2007/08 2008/09 2009/10 2010/11 2011/12
Central 518 743 265 369 351 397 405 515 782 765
Copperbelt 741 605 1,201 213 439 150 500 597 677 541
Eastern 431 408 350 437 376 484 542 582 613 524
Luapula 444 318 608 447 380 428 510 283 394 903
Lusaka . 478 266 317 273 945 872 497 510 947
Muchinga 801
Northern 564 426 516 462 333 568 677 502 1,062 625
NorthWestern 389 759 484 634 342 1,847 545 411 423 809
Southern 362 477 89 260 208 122 544 479 466 614
Western . . 185 . 412 286 508 665 486 330
National 451 462 358 422 356 475 546 557 659 561
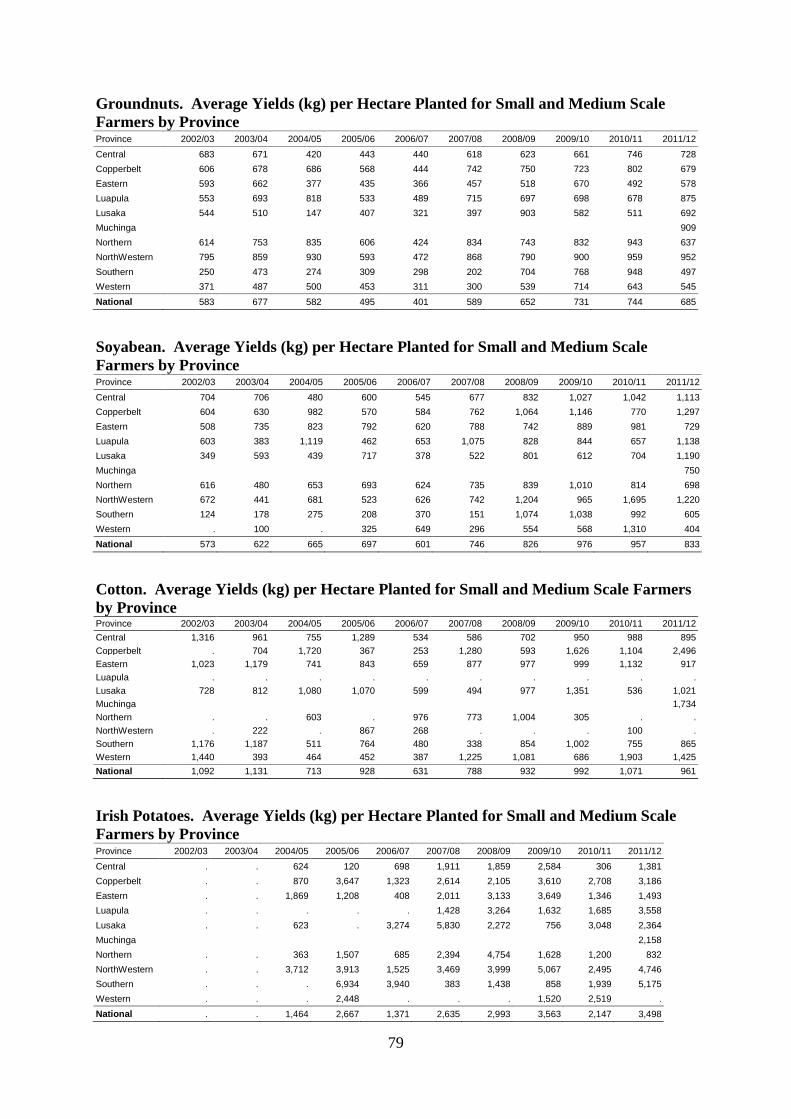
79
Groundnuts. Average Yields (kg) per Hectare Planted for Small and Medium Scale Farmers by Province Province 2002/03 2003/04 2004/05 2005/06 2006/07 2007/08 2008/09 2009/10 2010/11 2011/12 Central 683 671 420 443 440 618 623 661 746 728 Copperbelt 606 678 686 568 444 742 750 723 802 679 Eastern 593 662 377 435 366 457 518 670 492 578 Luapula 553 693 818 533 489 715 697 698 678 875 Lusaka 544 510 147 407 321 397 903 582 511 692 Muchinga 909 Northern 614 753 835 606 424 834 743 832 943 637 NorthWestern 795 859 930 593 472 868 790 900 959 952 Southern 250 473 274 309 298 202 704 768 948 497 Western 371 487 500 453 311 300 539 714 643 545 National 583 677 582 495 401 589 652 731 744 685
Soyabean. Average Yields (kg) per Hectare Planted for Small and Medium Scale Farmers by Province Province 2002/03 2003/04 2004/05 2005/06 2006/07 2007/08 2008/09 2009/10 2010/11 2011/12 Central 704 706 480 600 545 677 832 1,027 1,042 1,113 Copperbelt 604 630 982 570 584 762 1,064 1,146 770 1,297 Eastern 508 735 823 792 620 788 742 889 981 729 Luapula 603 383 1,119 462 653 1,075 828 844 657 1,138 Lusaka 349 593 439 717 378 522 801 612 704 1,190 Muchinga 750 Northern 616 480 653 693 624 735 839 1,010 814 698 NorthWestern 672 441 681 523 626 742 1,204 965 1,695 1,220 Southern 124 178 275 208 370 151 1,074 1,038 992 605 Western . 100 . 325 649 296 554 568 1,310 404 National 573 622 665 697 601 746 826 976 957 833
Cotton. Average Yields (kg) per Hectare Planted for Small and Medium Scale Farmers by Province Province 2002/03 2003/04 2004/05 2005/06 2006/07 2007/08 2008/09 2009/10 2010/11 2011/12 Central 1,316 961 755 1,289 534 586 702 950 988 895 Copperbelt . 704 1,720 367 253 1,280 593 1,626 1,104 2,496 Eastern 1,023 1,179 741 843 659 877 977 999 1,132 917 Luapula . . . . . . . . . . Lusaka 728 812 1,080 1,070 599 494 977 1,351 536 1,021 Muchinga 1,734 Northern . . 603 . 976 773 1,004 305 . . NorthWestern . 222 . 867 268 . . . 100 . Southern 1,176 1,187 511 764 480 338 854 1,002 755 865 Western 1,440 393 464 452 387 1,225 1,081 686 1,903 1,425 National 1,092 1,131 713 928 631 788 932 992 1,071 961 Irish Potatoes. Average Yields (kg) per Hectare Planted for Small and Medium Scale Farmers by Province Province 2002/03 2003/04 2004/05 2005/06 2006/07 2007/08 2008/09 2009/10 2010/11 2011/12 Central . . 624 120 698 1,911 1,859 2,584 306 1,381 Copperbelt . . 870 3,647 1,323 2,614 2,105 3,610 2,708 3,186 Eastern . . 1,869 1,208 408 2,011 3,133 3,649 1,346 1,493 Luapula . . . . . 1,428 3,264 1,632 1,685 3,558 Lusaka . . 623 . 3,274 5,830 2,272 756 3,048 2,364 Muchinga 2,158 Northern . . 363 1,507 685 2,394 4,754 1,628 1,200 832 NorthWestern . . 3,712 3,913 1,525 3,469 3,999 5,067 2,495 4,746 Southern . . . 6,934 3,940 383 1,438 858 1,939 5,175 Western . . . 2,448 . . . 1,520 2,519 . National . . 1,464 2,667 1,371 2,635 2,993 3,563 2,147 3,498

80
Tobacco. Average Yields (kg) per Hectare Planted for Small and Medium Scale Farmers by Province Province 2002/03 2003/04 2004/05 2005/06 2006/07 2007/08 2008/09 2009/10 2010/11 2011/12 Central 954 1,093 904 889 644 847 1,439 1,581 1,288 1,006 Copperbelt . . . . . 564 775 1,683 1,436 . Eastern 1,014 1,040 757 1,031 970 1,818 1,222 1,238 1,404 1,274 Luapula . . . . . . 400 1,330 . . Lusaka . . 922 . . . 800 . 328 . Muchinga 2,224 Northern . 727 1,159 794 . 663 864 682 455 . NorthWestern . . 800 . . . . . 2,303 517 Southern 983 1,510 1,266 1,039 634 1,333 604 861 907 864 Western . 2,382 1,883 1,393 1,112 3,793 1,726 1,109 1,418 1,109 National 1,010 1,082 852 1,063 913 1,852 1,257 1,207 1,294 1,166
Beans. Average Yields (kg) per Hectare Planted for Small and Medium Scale Farmers by Province Province 2002/03 2003/04 2004/05 2005/06 2006/07 2007/08 2008/09 2009/10 2010/11 2011/12 Central 661 2,678 391 813 663 785 737 2,096 800 815 Copperbelt 421 390 332 655 283 520 712 1,058 622 680 Eastern 2,277 3,555 2,427 5,563 4,369 5,997 6,524 5,527 666 617 Luapula 473 565 519 614 804 748 1,134 680 698 601 Lusaka 326 447 187 579 349 453 740 838 525 1,883 Muchinga 648 Northern 621 409 543 491 510 841 589 761 734 700 NorthWestern 630 497 619 619 404 689 666 799 1,017 817 Southern 619 1,037 466 2,473 1,121 1,084 6,971 2,149 586 504 Western 234 243 267 2,360 471 425 1,910 1,010 483 396 National 694 730 597 749 631 956 1,009 1,139 741 697 Cowpeas. Average Yields (kg) per Hectare Planted for Small and Medium Scale Farmers by Province Province 2002/03 2003/04 2004/05 2005/06 2006/07 2007/08 2008/09 2009/10 2010/11 2011/12 Central 435 439 716 591 445 1,093 840 651 518 607 Copperbelt 322 193 1,328 782 340 72 766 1,939 156 1,926 Eastern 360 643 216 561 117 498 728 387 644 322 Luapula 288 402 . 40 880 1,168 393 537 534 377 Lusaka 120 500 252 236 273 346 654 218 422 306 Muchinga 430 Northern 409 556 493 532 371 972 430 1,036 485 958 NorthWestern 440 590 590 266 1,397 472 608 270 356 . Southern 308 339 250 343 192 195 795 453 825 347 Western 414 398 189 370 300 370 664 608 510 627 National 350 441 342 386 285 489 748 567 605 514 Coffee. Average Yields (kg) per Hectare Planted for Small and Medium Scale Farmers by Province Province 2002/03 2003/04 2004/05 2005/06 2006/07 2007/08 2008/09 2009/10 2010/11 2011/12
Central . . . . 600 . . . . .
Copperbelt . . . . . . . 200 . .
Eastern . . . . . . . . . 2,222
Luapula . . . . . . . . . .
Lusaka . . . . . . . . . .
Muchinga
Northern . . . 960 . . . . 1,473 .
NorthWestern . . . . . . . . . .
Southern . . . . . . . . 1,111 .
Western . . . . . . . . . .
National . . . 960 600 . . 200 1,251 2,222
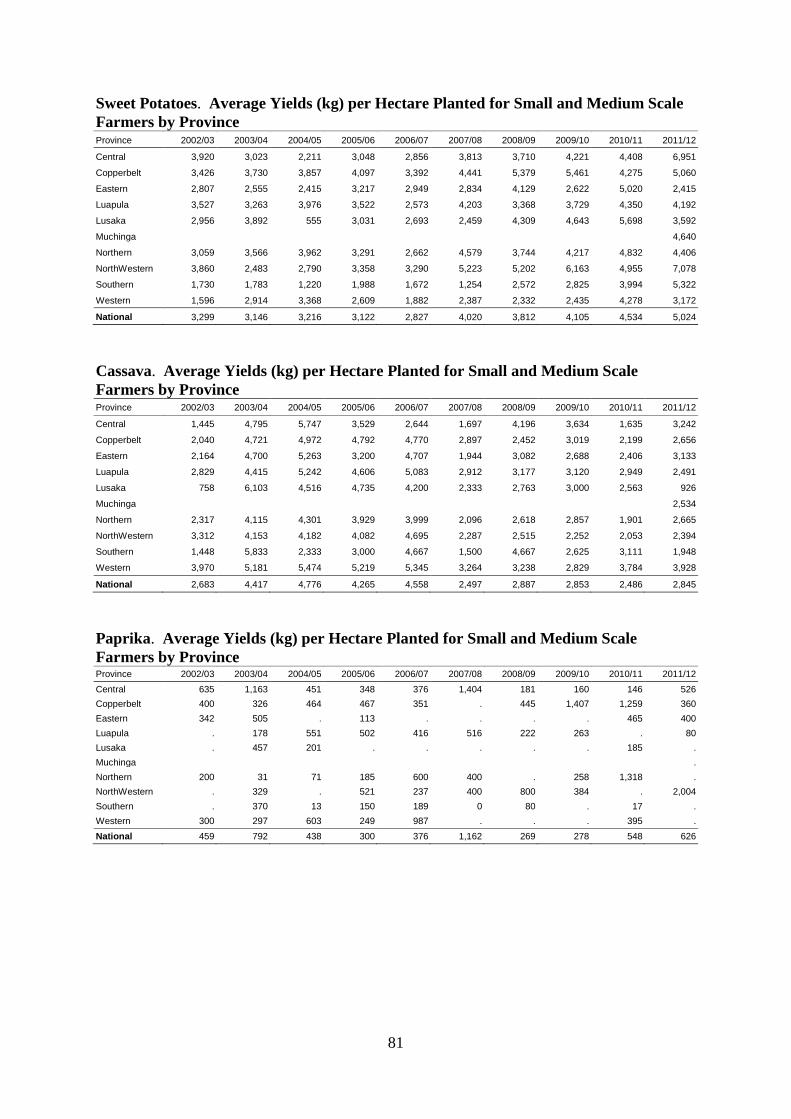
81
Sweet Potatoes. Average Yields (kg) per Hectare Planted for Small and Medium Scale Farmers by Province Province 2002/03 2003/04 2004/05 2005/06 2006/07 2007/08 2008/09 2009/10 2010/11 2011/12
Central 3,920 3,023 2,211 3,048 2,856 3,813 3,710 4,221 4,408 6,951
Copperbelt 3,426 3,730 3,857 4,097 3,392 4,441 5,379 5,461 4,275 5,060
Eastern 2,807 2,555 2,415 3,217 2,949 2,834 4,129 2,622 5,020 2,415
Luapula 3,527 3,263 3,976 3,522 2,573 4,203 3,368 3,729 4,350 4,192
Lusaka 2,956 3,892 555 3,031 2,693 2,459 4,309 4,643 5,698 3,592
Muchinga 4,640
Northern 3,059 3,566 3,962 3,291 2,662 4,579 3,744 4,217 4,832 4,406
NorthWestern 3,860 2,483 2,790 3,358 3,290 5,223 5,202 6,163 4,955 7,078
Southern 1,730 1,783 1,220 1,988 1,672 1,254 2,572 2,825 3,994 5,322
Western 1,596 2,914 3,368 2,609 1,882 2,387 2,332 2,435 4,278 3,172
National 3,299 3,146 3,216 3,122 2,827 4,020 3,812 4,105 4,534 5,024
Cassava. Average Yields (kg) per Hectare Planted for Small and Medium Scale Farmers by Province Province 2002/03 2003/04 2004/05 2005/06 2006/07 2007/08 2008/09 2009/10 2010/11 2011/12
Central 1,445 4,795 5,747 3,529 2,644 1,697 4,196 3,634 1,635 3,242
Copperbelt 2,040 4,721 4,972 4,792 4,770 2,897 2,452 3,019 2,199 2,656
Eastern 2,164 4,700 5,263 3,200 4,707 1,944 3,082 2,688 2,406 3,133
Luapula 2,829 4,415 5,242 4,606 5,083 2,912 3,177 3,120 2,949 2,491
Lusaka 758 6,103 4,516 4,735 4,200 2,333 2,763 3,000 2,563 926
Muchinga 2,534
Northern 2,317 4,115 4,301 3,929 3,999 2,096 2,618 2,857 1,901 2,665
NorthWestern 3,312 4,153 4,182 4,082 4,695 2,287 2,515 2,252 2,053 2,394
Southern 1,448 5,833 2,333 3,000 4,667 1,500 4,667 2,625 3,111 1,948
Western 3,970 5,181 5,474 5,219 5,345 3,264 3,238 2,829 3,784 3,928
National 2,683 4,417 4,776 4,265 4,558 2,497 2,887 2,853 2,486 2,845
Paprika. Average Yields (kg) per Hectare Planted for Small and Medium Scale Farmers by Province Province 2002/03 2003/04 2004/05 2005/06 2006/07 2007/08 2008/09 2009/10 2010/11 2011/12 Central 635 1,163 451 348 376 1,404 181 160 146 526 Copperbelt 400 326 464 467 351 . 445 1,407 1,259 360 Eastern 342 505 . 113 . . . . 465 400 Luapula . 178 551 502 416 516 222 263 . 80 Lusaka . 457 201 . . . . . 185 . Muchinga . Northern 200 31 71 185 600 400 . 258 1,318 . NorthWestern . 329 . 521 237 400 800 384 . 2,004 Southern . 370 13 150 189 0 80 . 17 . Western 300 297 603 249 987 . . . 395 . National 459 792 438 300 376 1,162 269 278 548 626

82
REFERENCES
Bank of Zambia. 2013. Lusaka. http://www.boz.zm/
Central Statistics Office. 1991, 1993. Priority Survey Results. Lusaka: GRZ.
Central Statistics Office. 1996, 1998, 2004, 2006, 2010. CSO Living Conditions Monitoring Survey Results. Lusaka: GRZ.
Central Statistics Office. 2007. Zambia District Health Survey. Lusaka: GRZ.
Central Statistics Office. 2010. 2010 Census of Population and Housing, Population Summary Report. Lusaka: GRZ.
Central Statistics Office. 2011. Living Conditions Monitoring Survey Report, 2006 and 2010. Lusaka, Zambia: GRZ.
Central Statistics Office. 2012. 2012 Preliminary GDP Report. Lusaka: GRZ.
Central Statistics Office. 2013. 2010 Census of Population National Analytical Report. Lusaka: GRZ.
CSO/MAL/FSRP. 2008. Supplemental Survey to the 2006/2007 Post-Harvest Survey. Lusaka: FSRP.
CSO/MAL/IAPRI. 2012. Rural Agricultural Livelihoods Survey Dataset. Lusaka: IAPRI.
CSO/MAL/IAPRI. Various years. Crop Forecast Surveys Dataset. Lusaka: GRZ. Dataset. Lusaka: FSRP.
FAOSTAT. Rome: FAO. www.FAOSTAT.org
GRZ. Various years. National Budget. Lusaka: Ministry of Finance.
Jayne, T.S., Nicole Mason, William Burke, Arthur Shipekesa, Antony Chapoto, and Chance Kabaghe. 2011. Mountains of Maize, Persistent Poverty. FSRP Policy Synthesis No. 48. Lusaka, Zambia: FSRP.
World Bank. Washington, D.C. http://data.worldbank.org/country/zambia