technical brochure - akips - network monitoring software · technical brochure . network monitoring...
TRANSCRIPT

Network Monitoring Software | Page 1
Technical Brochure www.akips.com

Network Monitoring Software | Page 2
AnalyseSort, rank and �lter
in real-time
AlertProactive Noti�cations
MonitorSeamlessly collect billions of metrics
ReportComprehensive tables and graphs
Network Visibility

Network Monitoring Software | Page 3
Where AKIPS Fits
Typical Use Cases
Mid-Tier/Large Enterprise
Small to Medium Enterprise
Fortune 1000
ISPMSPCloud
AKIP
SBest suited
for mid - large enterprises
• Quickly identify which devices and applications are flooding your network
• Save time locating devices instead of looking though switch & ARP tables
• Identify unused switch interfaces without painstakingly tracing network cables or configs
• Track router & switch config changes without logging into every device
• Utilise event & alert notifications to handle network disruptions before user complaints
• Identify hidden faults that bubble under the surface causing performance issues
• Use complete visibility to prove it’s not the “!@#$%” network
Network Monitoring Software | Page 3

Network Monitoring Software | Page 4
Vendor Coverage

Network Monitoring Software | Page 5
• One flat low-cost annual subscription for any size network
• Training, support & updates included
• Licensing cost is per server
• No hidden costs
Pricing
VM Requirements
Small • 2+ CPU Core
• 50,000 Interfaces • 8 GB RAM• 200 GB Disk Space
Medium • 4+ CPU Core
• 100,000 Interfaces • 16 GB RAM• 500 GB Disk Space
Large • 8+ CPU Core• 250,000 Interfaces • 32 GB RAM
• 1 TB Disk Space
On-PremiseSoftware Appliance

Network Monitoring Software | Page 6
Complete visibility across your network infrastructure
Head Office
Branch Offices
WiFi
Router
NetFlow
AKIPS
Firewall
Storage
Switch
PingSNMPSyslogTraps
NetFlowConfig Crawler
Network Monitoring Software | Page 7
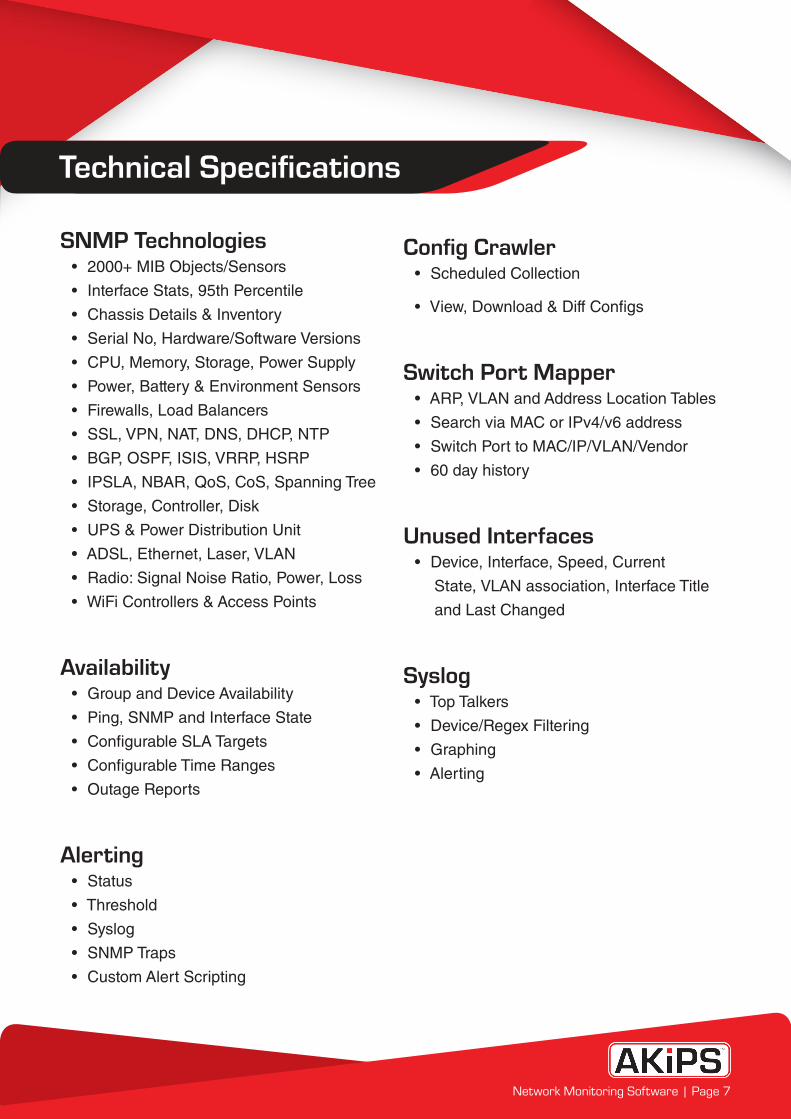
SNMP Technologies• 2000+ MIB Objects/Sensors
• Interface Stats, 95th Percentile
• Chassis Details & Inventory
• Serial No, Hardware/Software Versions
• CPU, Memory, Storage, Power Supply
• Power, Battery & Environment Sensors
• Firewalls, Load Balancers
• SSL, VPN, NAT, DNS, DHCP, NTP
• BGP, OSPF, ISIS, VRRP, HSRP
• IPSLA, NBAR, QoS, CoS, Spanning Tree
• Storage, Controller, Disk
• UPS & Power Distribution Unit
• ADSL, Ethernet, Laser, VLAN
• Radio: Signal Noise Ratio, Power, Loss
• WiFi Controllers & Access Points
Availability• Group and Device Availability
• Ping, SNMP and Interface State
• Configurable SLA Targets
• Configurable Time Ranges
• Outage Reports
Alerting• Status
• Threshold
• Syslog
• SNMP Traps
• Custom Alert Scripting
Config Crawler• Scheduled Collection
• View, Download & Diff Configs
Switch Port Mapper• ARP, VLAN and Address Location Tables
• Search via MAC or IPv4/v6 address
• Switch Port to MAC/IP/VLAN/Vendor
• 60 day history
Unused Interfaces• Device, Interface, Speed, Current
State, VLAN association, Interface Title
and Last Changed
Syslog• Top Talkers
• Device/Regex Filtering
• Graphing
• Alerting
Technical Specifications

Network Monitoring Software | Page 8
NetFlow• Top Talkers/Listeners/Protocols
• v5, v9, IPFIX • Address & Protocol Filters
• User Defined UDP/TCP Ports
• Fanout / Forwarding
• Dashboards
• Unknown Protocols
• Graphing
• Geolocation
• BGP AS Name & Number
• DNS Resolution
• Interface Direction
• Type of Service
Site Scripting• Scheduled Scripting
• Custom Alert Scripting
• Post Discovery & Auto Grouping
• RESTful API
• HTTP/HTTPS client
• API access to internal databases
Fanout/Forwarding• Up to 10 destinations
• Syslog, Traps, NetFlow
Network Discovery• User Defined Scan Ranges
• SNMP v1/v2/v3 & IPv4/v6
• Scheduled Discovery Rewalk
• Vendor Specific MIB Config
• Auto Grouping of Technologies
• Post Discover Site Scripting
Events Dashboard• Impact Assessment
• Status Exceptions
• Availability
• Unreachable Devices
Device Dashboard• Device Summary
• Status Exceptions
• Availability
• Vital Stats
• Interface Summary
Interface Dashboard• Interface Vitals
• Utilisation Graphs
• Switch Port Location
Technical Specifications