technical and economic feasibility of sustainable heating ... · technical and economic feasibility...
TRANSCRIPT

lable at ScienceDirect
Energy 153 (2018) 311e323
Contents lists avai
Energy
journal homepage: www.elsevier .com/locate/energy
Technical and economic feasibility of sustainable heating and coolingsupply options in southern European municipalities-A case study forMatosinhos, Portugal
Eftim Popovski a, *, Tobias Fleiter a, Hugo Santos b, Vitor Leal b,Eduardo Oliveira Fernandes b
a Fraunhofer Institute for Systems and Innovation Research, Breslauer Str. 48, 76139, Karlsruhe, Germanyb Institute of Science and Innovation in Mechanical and Industrial Engineering, Rua Dr. Roberto Frias, 400, 4200-465, Porto, Portugal
a r t i c l e i n f o
Article history:Available online 9 April 2018
Keywords:District heating and coolingExcess heat utilizationIndividual heating and coolingCO2 emission reductionHeat pumpsSustainable citiesenergyPROEnergy planningHeat supply
* Corresponding author.E-mail address: [email protected] (
https://doi.org/10.1016/j.energy.2018.04.0360360-5442/© 2018 Elsevier Ltd. All rights reserved.
a b s t r a c t
Energy demand for heating and cooling constitutes almost 50% of the total energy demand in Europe andstrongly depends on fossil fuels. Decarbonising this sector and providing a sustainable supply should be amain goal of climate policy. The technical and economic feasibility of supply options depends strongly onlocal conditions. The focus of this research is to assess the cost-effectiveness of sustainable heat and coldsupply solutions under southern European conditions. We use the city of Matosinhos (Portugal) as anexample. The methodology includes estimation of thermal demands and hourly simulation of alternativesupply scenarios.
The results show that, from a socio-economic perspective, the use of excess heat from a refinery via aDHC network might be the economically most competitive option. In addition, the heat pump systemcombined with photovoltaics is cost-effective from a socio-economic perspective compared to the statusquo if the capital costs of the status quo are also accounted for. This justifies support policies to also makeit cost-competitive from a private economic perspective, which it currently is not. Sensitivity analyseswere conducted for the most influential factors like capital investment costs, interest rate, and fuelprices.
© 2018 Elsevier Ltd. All rights reserved.
1. Introduction
Accounting for about 50% of final energy consumption, heatingand cooling represents the biggest energy use sector in the EU [1],which is still dominated by fossil fuel use and responsible for amajor share of EU GHG emissions. For these reasons, the EuropeanCommission drafted the EU Heating and Cooling Strategy [2] inFebruary 2016. This strategy represents the first EU initiativeaddressing the demand and supply for heating and cooling inbuildings and industry in an integrated framework.
The decisions about heating and cooling investments andinfrastructure are, however, mostly local in nature because they aretaken by municipalities, utilities and private investors. The poten-tials and costs of using RES vary heavily across regions in Europeand are determined by local conditions. EU strategies need to take
E. Popovski).
these diverse local particularities into account. While there havebeen many city-level assessments of heating and cooling supplyoptions in northern European countries and Scandinavian coun-tries in particular [3e5], so far, there has been less focus onsouthern European countries. Many municipalities and regions insouthern Europe have important characteristics in common: Theyoften do not have a district heating/cooling infrastructure, andspace cooling is much more important than in northern Europeancountries [1]. At the same time, solar irradiation in the South ishigher, making solar-based solutions more cost-effective. In thispaper, we assess heating and cooling supply options for the city ofMatosinhos in Portugal. We focus on replacing the existing naturalgas boilers with heat pumps, a solution with and without PV, andthe construction of a new district heating and cooling network.
DHC is widely recognised as an important element in any futuresmart and sustainable energy system [6e9] able to balance fluc-tuating RES electricity generationwith power-to-heat solutions andexploit the large volumes of industrial excess heat for heating and

Abbreviations
CAPEX Capital expenditureCC Compression chillerDHC District heating and coolingFED Final energy demandGHG Greenhouse gasH&C Heating and coolingHP Heat pumpLCOC Levelized cost of coolingLCOH Levelized cost of heatLCOE Levelized costs of electricityO&M Operation and maintenancePV PhotovoltaicsRES Renewable energy sourceRES-H&C Renewable energy source for heating and coolingRFO Residual fuel oil4GDH 4th Generation district heating
1 The tool developed by EMD International is a commercial software for techno-economic analyses of energy projects. The tool only optimizes operation, not in-vestments (www.emd.dk/energypro/).
E. Popovski et al. / Energy 153 (2018) 311e323312
cooling purposes [10,11] which have often been overlooked in en-ergy planning models. Feasibility studies about the potential ofutilizing excess heat in district heating networks indicate that 46%of the total excess heat in EU27 corresponds to 31% of the totalbuilding heat demand [12], with the chemical industry and re-fineries having one of the highest excess heat/fuel use proportion ofup to 24% [13]. The construction of an efficient 4GDHC can, inprinciple, provide multiple benefits for municipalities. Several DHCnetworks are already in operation in cities like Barcelona, Paris,Stockholm, etc. [14,15]. However, in Portugal, there is only onenetwork currently in operation in Lisbon [16]. A similar DHCnetwork could be built in Matosinhos to supply the heating, hotwater and cooling demand of nearby residential and commercialbuildings.
Furthermore, the DHC network could also be supplied by abroad range of renewable and recycled energies, thus extending thebenefits of such a solution. In the case of Matosinhos, the inter-esting opportunity explored in this research is to use the excessheat from the local refinery. Refineries are well suited to supplyingdistrict heating networks, because they provide a relativelycontinuous stream of excess heat. The high shares of refineries'excess heat in even large district heating grids show the huge ca-pacity available [17e20]. This solution has the potential to not onlyincrease the efficiency of the refinery, but also to provide a sus-tainable heating and cooling supply for the local community byusing heat that would otherwise be wasted.
The aim of this paper is to assess the technical and economicfeasibility of sustainable heat supply technologies in order toreduce the CO2 emissions from heating and cooling. To capture thelocal circumstances, we conduct a case study for the city of Mato-sinhos in Portugal. Sustainable heat supply options are assessedincluding a DHC network supplied by industrial excess heat, andheat pumps in combination with PV. These supply options arecompared to the system in operation today (natural gas boilers andcompression chillers).
The methodology is based on hourly simulation of heat supplyand includes estimations of heat demands, resource potentials andtechno-economic technology data. Finally, a sensitivity analysis isconducted to assess the impact of changes in interest rates, in-vestment costs, and fuel costs.
This paper is structured into seven parts: the introduction (1),the description of the status quo of energy demand in the analysedarea (2), methodology and input data used for the analyses (3),
results from both a private and a socio-economic perspective (4),sensitivity analyses (5), discussion (6), and conclusion (7).
2. Matosinhos case study and modelled area
The city of Matosinhos, Portugal was analysed in detail in orderto explore the current challenges of deploying a higher share ofRES-H&C. Matosinhos is in the northern part of Portugal, situateddirectly on the Atlantic coast, north of Porto (Portugal's secondlargest city), and covers an area of approximately 62 km2. In 2009,primary energy use in Matosinhos was just over 5.2 TWh/y, ofwhich 4.6 TWhwere of fossil origin. Only 14% of the primary energyresources were used directly, mainly in the form of natural gas,while the remaining 86% of primary energy were converted intoelectricity (34%) and petrochemical fuels (52%). Primary energy useper inhabitant was 31MWh/y in Matosinhos, somewhat higherthan Portugal's average of about 24MWh/y. Approximately 34% ofthe electricity came from renewable sources. Fig. 1 presents theprimary energy use and final energy demand in 2009. From a de-mand perspective, buildings were responsible for 37% of final en-ergy use (20% residential, 17% commercial buildings), while thetransportation sector used 32% and industry 27% of the final energy.In total, 4.3 TWh final energy were used in the city.
Fig. 2 shows a map of the area analysed. It currently comprisesabout 69 buildings but has the potential for gradual expansion. 63of the 69 buildings are part of a large new development area (calledNorte Center). Building types range from office to commercial andresidential spaces, including a hotel and a conference center. Whilethe Norte Center represents a large majority of the number ofbuildings, it corresponds to only about 58% of the total built area(about 240 000m2). The other 6 are large commercial buildingsconstructed nearby over the last 9 years. Four of these are largestores (Decathlon e sports goods, Conforama e household furni-ture and appliances, Leroy Merlin e DIY and gardening supplies;and IKEA efurniture). In addition, Mar Shopping is a fairly largemall (physically connected to the IKEA store), and the Exponor, oneof the largest exhibition centres in Portugal. Altogether, these 6buildings encompass about 175 000m2 of the built area. There isalso a recently built logistics center nearby which might presentsignificant cooling demand in the future and be relevant from theperspective of grid expansion, but was not included in this exercise.
3. Methodology and data
The methodology used in this research contains five main steps.1. The thermal demand is estimated in order to establish an hourly
demand profile for heating, cooling, and hot water for eachbuilding type for the year 2015.
2. Resource potentials are estimated like the available excess heatand rooftop area for PV.
3. Definition of techno-economic parameters including perfor-mance and costs of technologies as well as energy and CO2 priceassumptions.
4. Definition of technology scenarios for the simulation analysis.5. Simulation using the energy system model energyPRO,1 which
performs an hourly simulation of heat supply technologydispatch under the condition that demand is met at all times.Heat pump performance depends on temperature ranges. Re-sults also include key economic indicators. The software is usedfor techno-economic analyses of energy projects and can

1788
640
1017
399
469
858
54
6
51
Electricity
Natural Gas
Diesel
Petrol
LPG
Other OilProd.
Biomass
Solar Rad.
Others
Primary energy use [GWh/year] in 2009
1131
964
1473
1517
197
ResidentialBldgs.
Services Bldgs.
Transportation
Industry Sector
Other Sectors
Final energy demand [GWh/year] bysector in 2009
Fig. 1. Primary energy use and final energy demand in 2009 [21e24].
Fig. 2. Map of Matosinhos (left), surrounded by Porto to the south and Maia to the northeast, and a detailed view of the analysed area and buildings (right). (source: Google Maps).
E. Popovski et al. / Energy 153 (2018) 311e323 313
conduct system optimization of supply dispatch based ondifferent technical properties of units, investment costs, fuelcosts, taxes and levies, fuel prices etc.
The individual steps and data used are described in thefollowing sections.
3.1. Estimation of heating and cooling demands
The aim of estimating the thermal demand is to establish anhourly profile for a whole reference year for heating, cooling andhot water demand based on useful energy for each building, takinginto account the floor area assigned to each use typology (com-mercial, office, residential or hotel). As it was not possible to collectdata from the individual buildings, the H&C demand is estimatedbased on specific values from similar buildings in the Porto regionas assessed in a previous study conducted by the Porto EnergyAgency [25]. The process essentially went through the followingsteps:
1 Determine heating/cooling area for each of the 69 buildingsby use/typology (as some buildings may have more than onetype of use, e.g. a 10-story high-rise might have 10% of theheating/cooling area as stores/commercial uses e forinstance, in the ground floor e and 90% residential in theremaining floors);
2 Define hourly heating/cooling/hot water demand profile forthe coldest/hottest day in the year for each typology;
3 Determine the effective heat and cold demand for each ty-pology and for the whole year considering the average dailyexternal temperature and targeting known typical yearlyenergy demands;
4 Compile three complete demand profiles for heating, coolingand hot water demand per building for the whole year.
(1) For each of the 69 buildings considered in the case study, thefirst step was to find information about the floor area. Thereare detailed public documents available for the Norte Centercomplex, where all the areas including their typology aregiven (i.e. offices, residential, commercial, hotel). For the

E. Popovski et al. / Energy 153 (2018) 311e323314
remaining buildings, assuming that their total area isassigned to commercial use, Google Maps was used tomeasure the building's footprint (e.g. the Leroy Merlin storewas estimated to cover approximately 12,000m2, which areassumed to be representative of the commercial area).
(2) The typical heating, cooling and hot water profiles per ty-pology were adapted from a previous study [25] used to plana potential district heating and cooling network to be built inPorto's city center. Among other typologies, that studydetermined the average heating, cooling and hot water en-ergy densities (W/m2) and the total yearly thermal energydemand (kWh/m2.y) for each of the four building typologiesrelevant to this report (offices, commerce, residential andhotels). These results were obtained via an assortment ofbenchmarking exercises for a large number of buildings inPorto [25] including direct measurements, bill estimates,dynamic building modelling, etc. Furthermore, demandprofiles were also determined for hourly heating and coolingdemand as a percentage of the maximum power available forthe 24 h of the coldest and hottest days of the year,respectively.
(3) Average external daily temperatures were used to calculatethe effective heat and cold demand per hour and per topol-ogy for a whole year. While this procedure does not guar-antee complete accuracy, it enables an hourly breakdown ofthe data that would otherwise not be possible. However, thetotal yearly amounts do add up to those determined in step 2.
To accomplish this, two reference temperatures are particularlyrelevant: one establishes at which external temperature the sys-tems are turned on, and the other establishes the temperature atwhich the equipment starts to be used at full capacity. In-betweenthese two temperatures, the equipment power is modulated pro-portionally. The reference temperatures were then adjusted so thatthey offer realistic set points and yearly demands that are compa-rable to other similar buildings in the region.
As an example, heating systems in offices are turned offwhenever the average outside daily temperature is higher than15 �C. If the temperature dips below 10 �C (which corresponds tothe daily average in the coldest month [26]), then the system isoperated at full power regardless of the specific temperature. Thismeans that, for each hour of that day, the hourly heat demandprofile for offices for the coldest day is directly multiplied by theaverage power density (meaning that, at 9 a.m., the system isoperating at full power, i.e. at 50W/m2). If the average daily outsidetemperature is 11 �C, then the heating power is only 4/5 of themaximum power. For hot water, it was assumed that demand re-mains constant throughout the year with no correlation betweendemand and outside temperature.
Having calculated the above, it only remains to multiply thereference hourly demand values by the floor area in each buildingconsidering its typology or mix of typologies. Fig. 3 illustrates theyearly H&C demand profile for one of the evaluated sites in 2015. Itcan be observed that the demand for cooling (air conditioning)compensates the low heating demand during the summer period,resulting in a more even energy demand over the year. A small
Fig. 3. Estimated heating, hot water, and cooling demand profile for the Norte Center,2015.
amount of heating demand is still visible during the summer tomeet the demand for hot water.
3.2. Resource potentials: Estimation of available excess heat androoftop area for photovoltaics
3.2.1. Available excess heat from the refineryThe heat recovery potentials are evaluated from Ref. [27]
whereas the local refinery capacity is assessed based on the dataprovided from its website and the refinery's data book [28]. Thefuels most consumed in the refinery are gas (as a mixture of fuel gasproduced in the refinery enriched with natural gas), natural gasand, to a lesser extent, residual fuel oil (RFO), which is being pro-gressively replaced. The total fuel gas consumption is around179 000 tons and the RFO consumption is around 22 000 tons. Thisresults in a total heat consumption for the year 2013 of around2500 GWh. In this case, the economic potential (positive businesscase over 25 years at 10% discount rate) for heat recovery in therefinery is estimated to be about 8% [29] or 200 GWh/y. Utilizingexcess heat sources above 90 �C results in a lower potential of about77GWh. This is sufficient to supply the total demand of the DHCnetwork (~59 GWh) for the evaluated buildings, assuming supplytemperatures of 80 �C and return of around 40 �C. In order to definethe COP of the absorption chiller, the water temperature of 90 �C isused for the generator and 20 �C (sea water [30]) for the condensercooling. Table 1 provides an overview of the excess heat potential ofthe individual heat sources with a temperature above 90 �C.
3.2.2. Available rooftop area for photovoltaicsFor the scenario with the PV system (Scenario number 4), a
yearly net metering is assumed. The main goal when designing thePV field was to produce the same amount of electricity that isconsumed by the heat pump and the chiller unit on a yearly basis.Even though production and consumption do not match on anhourly or daily basis, it can be assumed that the rest of the elec-tricity produced is consumed internally or fed into the electricitygrid, where a net metering is applied. Although increasing numbersof PV installations using net metering will have substantial effectson electricity grids as argued in Chapter 6 and elaborated inRefs. [48,49], a more detailed analysis of this issue is not presentedin this research. Fig. 4 shows the hourly PV production and elec-tricity demand for H&C, whereas Fig. 5 illustrates the annual PVproduction and electricity consumption for heating and cooling atone site (Leroy Merlin Store). The high coincidence of heating andcooling demand with PV production is due to the above mentionedscaling of demand to outdoor temperature and is site and design-specific. It has to be noted that the daily energy peak of south-oriented PV designed to maximize energy production rarely co-incidences with the peak electricity demand. Based on the obser-vations and calculations presented in Table 2, it can be concludedthat the area required for the PV units is available in principle. Inaddition to the area included in the Table, the parking areas couldalso be used for PV installations.
3.3. Techno-economic data
Techno-economic data comprise the efficiencies and prices oftechnologies, but also assumptions on energy prices and CO2-in-tensities. In addition, the technical and economic parameters of thepotential DHC grid are estimated.
Since the linear heat densities of the district heating and coolinggrid are higher than 1.8 MWh/m*y, it can be assumed that the heatlosses from the DHC network are around 10% [31]. Based on theliterature research, the capital costs of the district heating networkwith an average diameter of 120mm are around 615 EUR/m [32],

Table 1Excess heat potential in refineries for heat sources above 90 �C based upon [29].
Process type Unit operation Heat source medium Excess heat flow [kWh/boe] Source temperature [�C]
Cracking Fluid catalytic cracking Gas 7.3 150Cracking Catalytic hydrocracking Gas 14.3 150Combination/rearrangement of hydrocarbons Catalytic reforming Gas 3.2 150Distillation Atmospheric distillation Gas 3.3 150Distillation Vacum distillation Gas 0.9 150Coking Delayed coking Gas 2.7 150Combination/rearrangement of hydrocarbons Catalytic reforming Water 12.6 90Combination/rearrangement of hydrocarbons Alkylation Water 27.6 90Total excess heat supply flow [kWh/boe] 71.9Total oil production in the year 2013 [boe] 1,071,429Total excess heat potential [GWh/a] 77 >90 �C
0
0,05
0,1
0,15
0,2
0,25
7 10 13 16 19 22 7 10 13 16 19 22 7 10 13 16 19 22 7 10 13 16 19 22 7 10 13 16 19 22 7 10 13 16 19 22 7 10 13 16 19 22
Capacity
[MW]
Daily hours for a week in August
PV production [MW] Elec. consum. for heating and cooling [MW]
Monday Tuesday Wednesday Thursday Friday Saturday Sunday
Fig. 4. Hourly (for a week in August) PV production and electricity consumption for heating and cooling (site: Leroy Merlin Store). Nominal power¼ 270 kW; Number ofmodules¼ 806; required area¼ 4700m2; roof area¼ 8350m2.
E. Popovski et al. / Energy 153 (2018) 311e323 315
and the costs of the district cooling network are 1500 EUR/m(average diameter 500mm) [33]. In order to provide a better esti-mation of the capital costs of the DHC network, a few locationswere considered with the maximum trench length of 5 km. Thetrench length is a provisional one connecting three points betweenthe refinery, Exponor exibition center, and Norte Center. Thefeasibility of the district heating and cooling network dependsmainly on the linear heat density. Typically, it is not economical toinstall a DHC for densities lower than 1.2 MWh/m*y [31]. Thedensity is calculated by dividing the total demand by the trenchlength. In this case, the density is 2.92 MWh/m*y for the heatingnetwork and 5.62 MWh/m*y for the cooling network. The totalcapital costs are calculated for an operating life of 30 years. Thecorresponding cost constant (average size-independent construc-tion costs by trench length) and cost coefficient (directly propor-tional to the pipe diameter) are C1¼214 EUR/m and C2¼1725 EUR/m2 for the outer city areas based upon a survey conducted inRef. [34]. Additionally, 10 EUR/MWh are assumed as operating andmaintenance costs for the DC network for heat supplied to the grid[35], whereas 20 EUR/MWh [36] are considered for the DHnetwork. In Table 3 an overview of the district heating and coolingdata is presented.
Table 4 shows the actual and forecasted energy prices for anaverage consumer in the commercial sector. Natural gas and elec-tricity prices are assumed to increase, whereas a constant price of15 EUR/MWh is expected as compensation to the refinery for theexcess heat, based on other cases where excess heat from a refineryis consumed [17]. For the decentral PV LCOE, price projection costsfromRef. [37] were used for Portugal. Table 5 shows the specific CO2
emission factor and the share of RES in electricity generation for2015 and 2030, whereas Table 6 lists the technology assumptionssuch as specific investment costs, efficiency, lifetime, variable andfixed operation and maintenance costs.
3.4. Scenario definition and model simulation
The scenarios are distinguished by the heat and cold supplyoptions. Techno-economic data are similar across all scenarios asdefined above. Further, for all scenarios, it is assumed that the heatdemand of buildings remains unchanged until 2030, i.e. buildingrenovation measures were not considered. Nevertheless, it is ex-pected that the renovation potential would be small anyway sinceall of the target buildings were built less than 10 years ago.Therefore, the focus of the analysis is on the supply side. Different

-
10
20
30
40
50
60
70
-
10
20
30
40
50
60
70
Jan Feb Mar Apr May Jun Jul Aug Sep Oct Nov Dec
Electricityproduction[MWh]
Elect ricityconsumptionforH&C[MWh]
Elec. heating
Elec. cooling
PV production
Fig. 5. Annual PV production and electricity consumption for heating and cooling (site: Leroy Merlin Store). Nominal power¼ 270 kW; Number of modules¼ 806; requiredarea¼ 4700m2; Roof area¼ 8350m2.
Table 2Photovoltaic and roof area allocation.
Location Roof sizea [m2] PV areab [m2] Useful areac[m2] Difference [m2]
Decathlon (with parking) 13 640 3650 9550 5900Exponor 29 200 17 290 20 440 3150IKEA 16 400 14 770 11 480 �3290Mar Mall 35 000 24 590 24 500 �90Parking of IKEA and Mar Mall 25 500 17 850 17 850Leroy 8350 4700 5845 1145Conforamad 8350 3860 5845 1985Norte Center 240 000 86 000 168 000 82 000
a Based on Google maps.b The PV area is 3 times larger than the PV unit area in order to avoid any shading effect.c Useful area of 70% assuming the rest of the roof is either used by other equipment or is not available for architectural reasons.d Conforama (same as Leroy-assumption).
Table 3District heating and cooling data.
Heat density [MWth/m] Heat losses [%] Average diameter [mm] Cost const. [EUR/m] Cost coeff. [EUR/m2] O&M [EUR/MWh]
District heating 2.92 10 120 214 1725 20District cooling 5.62 10 500 214 1725 10
E. Popovski et al. / Energy 153 (2018) 311e323316
supply options weremodelled and simulated using energyPRO. Thesoftware optimizes the operation of the simulated systems to thedefined preconditions such as weather data and technical proper-ties of the technologies involved. Seven individual sites (as
Table 4End-user average energy prices for 2016 and 2030 [EUR/MWh].
Energy carrier Price for 2016(incl. tax, no VAT)
Price for 2030(incl. tax, no VAT)
Natural gas 36 42Electricity 119 128Decentral PV LCOE 126 98Excess heat supplied to the DHC grid 15 15
presented in Fig. 2) were modelled. The scenarios defined aredescribed in the following. For the status quo scenario, we definetwo variants. One includes the capital costs of technologies, whilethe other does not. The actual gas boilers and compression chillersinstalled in the buildings are of different ages and, in some build-ings (Norte center), they were not installed at the time of the study.Thus, the two status-quo scenarios provide a range for the realstatus quo costs. In Table 7 an overview of the modelled scenarios ispresented.
1. Status quo (excl. capital costs) e Decentralized scenario (withoutdistrict heating network) where each site uses natural gasboilers as a heat source and a vapour-compression chiller as a

Table 5Gross electricity generation forecasts until 2030 [38].
Gross electricity generation 2016 2030
CO2 emission factor [kg/MWh] 369 80Share of RES [%] 52.1 86.7
*Natural gas CO2 emission factor of 205 kg/MWh.
E. Popovski et al. / Energy 153 (2018) 311e323 317
cooling source; this scenario only considers O&M as well as fuelcosts e capital costs are excluded, because the systems are(mainly) already in operation. This scenario serves as a basis tocompare costs with possible new installations.
2. Status quo (incl. capital costs) e Same as the first scenario butwith the addition of the full capital costs (CAPEX).
3. Heat pump plus compression chillers (HP þ CC) e Decentralizedscenario in which the natural gas boilers are replaced by airsource heat pumps; the cooling units (vapour-compressionchiller) remain the same as in the status quo scenario.
4. Heat pump plus compression chillers with photovoltaic(HP þ CC þ PV) e Decentralized scenario in which the naturalgas boilers are replaced by air source heat pumps and a PVsystem is sized to produce the total combined electricity con-sumption of the heat pump and the chiller unit.
5. Refinery excess heat e Centralized solution assuming the con-struction of a new district heating and cooling network (approx.5 km trench length) for which a heat recovery system (shell andtube heat exchanger and absorption chiller) is installed in thelocal refinery to use the available excess heat.
4. Results
The results are presented for a simple socio-economicperspective (1.5% discount rate, no taxes or profit margins, noexternal costs) and from a private economic perspective, whichincludes all the taxes (excl. VAT) and applies a 7% interest rate. Notethat some socio-economic assessments might also include externalcosts, which are excluded in our analysis, which is why we call thisa simple socio-economic perspective. Including external costswould make fossil-based H&C supply more expensive. The resultsare presented for the period 2015e2030 and are assessed in termsof CO2 emissions, energy supply mix and the LCOH&C. CO2 emis-sions are accounted according to a use balance, which allocates theemissions from electricity generation to electricity consumers.
Table 6Technology assumptions in 2015.
Investment (CAPEX) Efficiency/SEER
Natural gas boiler 250 EUR/kWth [39] 90%Compression chiller 650 EUR/kWth [40] 230e380% [41]Photovoltaic 1350-1550 EUR/kW [45] b17.32% [46]Shell & tube heat exchanger 2000 EUR/m2 [17] 85% [27]Absorption chiller 250 EUR/m2 [29] 65% [29]Air source heat pump 700 EUR/kWth [42] 200-500% [44]
a Assumptions based on [17,40].b Performance ratio¼ 0.84 [47].
Table 7Overview of modelled scenarios.
Scenario Heating source
1.Status quo (excl. CAPEX) Natural gas boiler2.Status quo (incl. CAPEX) Natural gas boiler3.Heat pump þ comp. chillers (HP þ CC) Heat pump (air-source)4.Heat pump þ comp. chillers & PV (HP þ CC þ PV) Heat pump (air-source)5.Refinery excess heat Excess heat
4.1. CO2 emissions
Fig. 6 shows the results of the different scenarios for the finalenergy demand for heating, cooling and hot water in the buildingsconsidered. The demand is the same as in the year 2015 (thebuildings were constructed recently and comply with currentbuilding codes). The presented CO2 reductions refer to the CO2emissions in 2015. The CO2 reduction in the status quo scenarios(Scenarios 1 and 2) results from the forecast increased share ofRES in the electricity generation mix for Portugal presented inTable 5. It can be observed that additional CO2 emission reductionsof 55% are achieved by replacing the natural gas boilers with heatpumps. This large decrease depends strongly on the increasedshare of RES in gross electricity generation and will probably in-crease further beyond 2030.100% reduction of CO2 emissions canbe accomplished by either utilizing the excess heat from the re-finery (assuming no additional CO2 emissions from the excessheat) or by installing PV units (assuming net metering). In hoursduring which the electricity produced by the PV units exceeds thecombined demand of the heat pumps and chillers, the excesselectricity will be consumed internally by other loads in the samebuildings [52].
4.2. Socio-economic perspective
We apply a simple socio-economic perspective to assess thecost. For the simple socio-economic results presented in Fig. 7, itcan be observed that the excess heat scenario (scenario 5) is by farthemost cost effective solution if capital investment costs are takeninto account, and is on a similar cost level with the status quoscenario that does not include CAPEX. The LCOH are higher for heatpumps compared to the status quo including CAPEX. However,adding PV can reduce the costs which are then comparablewith thestatus quo if CAPEX is included. With regard to the total systemcosts, it can be observed that the system costs for space cooling arealmost double those of space heating. Consequently, the total H&Ccosts are dominated by space cooling.
4.3. Private-economic perspective
In this section, all the results are based on private economicperspective calculations, which include all the taxes (excl. VAT) anda 7% interest rate.
Lifetime Variable O&M Fixed O&M
25 years [39] 7.2 EUR/MWh [39] 4 EUR/kW [39]20 years [40] 2 EUR/MWh [40] 4% of Inv [40].20 years [45,46] e 0.5e1% of Inv [47].15 years [27] 2% of CAPEX a1.5% of Inv.20 years [29] a2 EUR/MWh a4% of Inv.20 years [43] 1.5 EUR/MWh [43] 1% of Inv [43].
Cooling source Electricity source District H&C network?
Compression chiller Grid e
Compression chiller Grid e
Compression chiller Grid e
Compression chiller PV and grid e
Absorption chiller Grid yes

0%
10%
20%
30%
40%
50%
60%
70%
80%
90%
100%
-
5.000
10.000
15.000
20.000
25.000
30.000
35.000
40.000
45.000
1. Status-Quoexcl. CAPEX
2. Status-Quoincl. CAPEX
3. HP + CC 4. HP + CC +PV
5. Refineryexcess heat
CO2em
issio n
redu
ctionrefto2015
Heati n
ngandcoolingsupp
ly[MWh]
Achsentitel
DH absorption chillerrefinery
Individual chiller unit
DH excess heat refinery
Individual heat pump
Individual gas boiler
CO2 emission reductionref. to 2015
Fig. 6. H&C supply technology mix (left axis) and CO2 emission reduction (right axis) for different scenarios in 2030 Heat pumps include ambient heat and electricity; CO2 emissionreductions are compared to 2015.
E. Popovski et al. / Energy 153 (2018) 311e323318
Fig. 8 shows the annual net costs for heating and cooling and thelevelized costs (LCOHC) for end consumers for the different sce-narios. It can be seen that the least expensive scenario withincluded CAPEX is scenario 5, which utilizes the excess heat fromthe refinery, whereas the most expensive scenario is number 3,
-
18
62
78
10
-
51 51
13
13
12
12
5
37
37 37
46
46
32
17
32
32 32
0
20
40
60
80
100
120
140
1. Status-Quo excl.CAPEX
2. Status-Quo incl.CAPEX
3. HP +CC
4. HP +CC + PV
5. Refineryexcessheat
1. Status-Quo excl.CAPEX
2. Status-Quo incl.CAPEX
3. HPCC
Space heating and hot water Spa
Levelizedcosts[EUR/MWh]
Levelized equipment capital costs [EUR/MWh] Levelized equipme
Levelized network capital costs [EUR/MWh] Levelized network
Fig. 7. 2030 Annual net costs for heating and cooling [MEUR] (right axis) and levelized cointerest rate and excluding all taxes and levies.
which considers the replacement of the natural gas boilers with airsource heat pumps. The addition of PV has a positive influence onthe heating and cooling costs due to the lower electricity produc-tion costs of PV in comparison to the electricity price from the gridand the expected PV cost reductions in 2030 [37]. While the general
67
20
-
39
54
71
17
37
16
29
29
28
28
12
23 37
37
32 -
21
0
1
2
3
4
5
6
+ 4. HP +CC + PV
5. Refineryexcessheat
1. Status-Quo excl.CAPEX
2. Status-Quo incl.CAPEX
3. HP +CC
4. HP +CC + PV
5. Refineryexcessheat
ce cooling Space heating, hot water and cooling
Totalcosts[MEUR]
nt O&M costs [EUR/MWh] Levelized fuel costs [EUR/MWh]
O&M cost [EUR/MWh] Total costs of heating [EUR]
sts [EUR/MWh] (left) All costs are from a socio-economic perspective assuming 1.5%
-
32
100
126
15
-
82 82
108
32
-
65
88
114
2613
13
12
12
5 37
37 37
37
23
29
29
28
28
1746
46
34
-
17
33
33 33
-
16
38
38
33
-
16
-
-
-
-
11
-
- -
-
15
-
-
-
-
14-
-
-
-
20
-
- -
-
10
-
-
-
-
13
-
1,0
2,0
3,0
4,0
5,0
6,0
7,0
0
20
40
60
80
100
120
140
160
1. Status-Quo excl.CAPEX
2. Status-Quo incl.CAPEX
3. HP +CC
4. HP +CC + PV
5.Refineryexcessheat
1. Status-Quo excl.CAPEX
2. Status-Quo incl.CAPEX
3. HP +CC
4. HP +CC + PV
5.Refineryexcessheat
1. Status-Quo excl.CAPEX
2. Status-Quo incl.CAPEX
3. HP +CC
4. HP +CC + PV
5.Refineryexcessheat
Space heating and hot water Space cooling Space heating, hot water and cooling
Totalcos
ts[MEU
R]
L evelized
costs[EUR/MWh]
Levelized equipment capital costs [EUR/MWh] Levelized equipment O&M costs [EUR/MWh] Levelized fuel costs [EUR/MWh]Levelized network capital costs [EUR/MWh] Levelized network O&M cost [EUR/MWh] Total costs of heating [EUR]
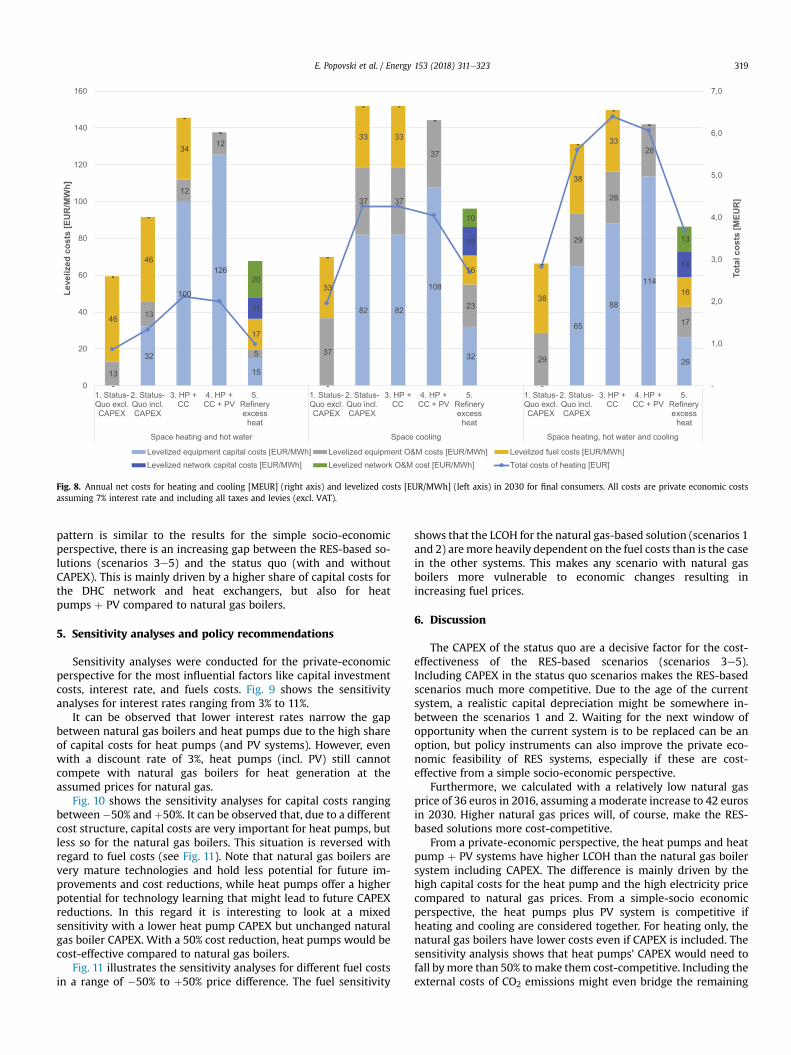
Fig. 8. Annual net costs for heating and cooling [MEUR] (right axis) and levelized costs [EUR/MWh] (left axis) in 2030 for final consumers. All costs are private economic costsassuming 7% interest rate and including all taxes and levies (excl. VAT).
E. Popovski et al. / Energy 153 (2018) 311e323 319
pattern is similar to the results for the simple socio-economicperspective, there is an increasing gap between the RES-based so-lutions (scenarios 3e5) and the status quo (with and withoutCAPEX). This is mainly driven by a higher share of capital costs forthe DHC network and heat exchangers, but also for heatpumps þ PV compared to natural gas boilers.
5. Sensitivity analyses and policy recommendations
Sensitivity analyses were conducted for the private-economicperspective for the most influential factors like capital investmentcosts, interest rate, and fuels costs. Fig. 9 shows the sensitivityanalyses for interest rates ranging from 3% to 11%.
It can be observed that lower interest rates narrow the gapbetween natural gas boilers and heat pumps due to the high shareof capital costs for heat pumps (and PV systems). However, evenwith a discount rate of 3%, heat pumps (incl. PV) still cannotcompete with natural gas boilers for heat generation at theassumed prices for natural gas.
Fig. 10 shows the sensitivity analyses for capital costs rangingbetween�50% andþ50%. It can be observed that, due to a differentcost structure, capital costs are very important for heat pumps, butless so for the natural gas boilers. This situation is reversed withregard to fuel costs (see Fig. 11). Note that natural gas boilers arevery mature technologies and hold less potential for future im-provements and cost reductions, while heat pumps offer a higherpotential for technology learning that might lead to future CAPEXreductions. In this regard it is interesting to look at a mixedsensitivity with a lower heat pump CAPEX but unchanged naturalgas boiler CAPEX. With a 50% cost reduction, heat pumps would becost-effective compared to natural gas boilers.
Fig. 11 illustrates the sensitivity analyses for different fuel costsin a range of �50% to þ50% price difference. The fuel sensitivity
shows that the LCOH for the natural gas-based solution (scenarios 1and 2) are more heavily dependent on the fuel costs than is the casein the other systems. This makes any scenario with natural gasboilers more vulnerable to economic changes resulting inincreasing fuel prices.
6. Discussion
The CAPEX of the status quo are a decisive factor for the cost-effectiveness of the RES-based scenarios (scenarios 3e5).Including CAPEX in the status quo scenarios makes the RES-basedscenarios much more competitive. Due to the age of the currentsystem, a realistic capital depreciation might be somewhere in-between the scenarios 1 and 2. Waiting for the next window ofopportunity when the current system is to be replaced can be anoption, but policy instruments can also improve the private eco-nomic feasibility of RES systems, especially if these are cost-effective from a simple socio-economic perspective.
Furthermore, we calculated with a relatively low natural gasprice of 36 euros in 2016, assuming a moderate increase to 42 eurosin 2030. Higher natural gas prices will, of course, make the RES-based solutions more cost-competitive.
From a private-economic perspective, the heat pumps and heatpump þ PV systems have higher LCOH than the natural gas boilersystem including CAPEX. The difference is mainly driven by thehigh capital costs for the heat pump and the high electricity pricecompared to natural gas prices. From a simple-socio economicperspective, the heat pumps plus PV system is competitive ifheating and cooling are considered together. For heating only, thenatural gas boilers have lower costs even if CAPEX is included. Thesensitivity analysis shows that heat pumps' CAPEX would need tofall bymore than 50% tomake them cost-competitive. Including theexternal costs of CO2 emissions might even bridge the remaining

-
20
40
60
80
100
120
140
160
180
200
1. Status-Quo excl.CAPEX
2. Status-Quo incl.CAPEX
3. HP + CC 4. HP + CC+ PV
5. Refineryexcess heat
1. Status-Quo excl.CAPEX
2. Status-Quo incl.CAPEX
3. HP + CC 4. HP + CC+ PV
5. Refineryexcess heat
Space heating and hot water Space cooling
Levelized
costs[EUR/MWh]
Fig. 9. Interest rate sensitivity for 2016 based on private-economic perspective (range between 3% and 11%).
-
50
100
150
200
250
1. Status-Quo excl.CAPEX
2. Status-Quo incl.CAPEX
3. HP + CC 4. HP + CC+ PV
5. Refineryexcess heat
1. Status-Quo excl.CAPEX
2. Status-Quo incl.CAPEX
3. HP + CC 4. HP + CC+ PV
5. Refineryexcess heat
Space heating and hot water Space cooling
Levelized
costs[EUR/MWh]
Fig. 10. CAPEX sensitivity for 2016 based on private-economic perspective (range between �50% and þ50%).
E. Popovski et al. / Energy 153 (2018) 311e323320
gap. In this case, policies to make RES-based systems more attrac-tive from a user perspective are well justified.
Various policy instruments to make RES-H&C more cost-effective are being discussed. A consistent policy mix is probablyneeded that integrates financial incentives as well as regulation-based instruments [50,51]. Over the past several years, the Portu-guese Energy Agency (ADENE www.adene.pt/) has supportedfunding programmes for energy efficiency (FEE) and innovationsupport for energy technologies (FAI). As an example, one of theseprogrammes provided financial support of up to 50% of the in-vestment and service costs for solar thermal collectors [55].Continuing and expanding these financial support schemes couldbe crucial to increase the deployment of renewable heating andcooling technologies.
As stated before, it has to be noted that there are further con-siderations to be taken into account for net-metering like theeconomic consequences for the network costs and the need forflexibility that is paid for by other market participants [48,49]. Onthe other hand, any excess electricity produced by the PV units canbe used internally by other non-H&C loads including lighting andelectric equipment. The demand for lighting in commercial build-ings alone can amount to between 30 and 35 kWh/m2.y as stated inRef. [52].
The supply optionwith the DHC network using excess heat fromthe refinery is the economically most competitive option under theassumptions taken. Implementing this option, however, requiresthe active involvement of multiple stakeholders including the re-finery, the building owners, the city and the utility. Barriers have to

0
20
40
60
80
100
120
140
160
180
1. Status-Quo excl.CAPEX
2. Status-Quo incl.CAPEX
3. HP + CC 4. HP + CC+ PV
5. Refineryexcess heat
1. Status-Quo excl.CAPEX
2. Status-Quo incl.CAPEX
3. HP + CC 4. HP + CC+ PV
5. Refineryexcess heat
Space heating and hot water Space cooling
Levelized
costs[EUR/MWh]
Fig. 11. Fuel costs sensitivity for 2016 based on a private-economic perspective (The price of excess heat is considered as a fuel price in scenario 1).
E. Popovski et al. / Energy 153 (2018) 311e323 321
be overcome like the perception of high mutual dependence,(perceived) risk and uncertainty. Advantages like the mitigateduncertainty about future gas or electricity prices have to beunderlined. Possible policy instruments on the local level includeactive municipal energy planning, zoning, and non-profit gridoperation [53]. Nationally, a risk hedging strategy might be helpful.Business models and financial advantages for the individual actorsneed to be analysed and clearly communicated. For instance,assuming that the refinery receives 15 euros/MWh heat supplied tothe DHC network, the financial revenue for the refinery would sumup to about 700,000 euros per year. In case the refinery regardsinvestments in heat exchangers and other equipment as too risky, acontracting model might help, in which the utility also pays for theequipment at the refinery. This can also overcome the barriersrelated to the very short payback time expectations of 2e3 yearsthat industrial companies often apply to energy projects. Suchpayback time expectations are obviously not applicable to the DHCtechnology with lifetimes of 30 years and longer. Beyond financialincentives, supplying excess heat to DH is a good way to improvethe refinery's public image as similar cases in Europe have shown,e.g. in Karlsruhe. On the other hand, as the IEA has forecast [54] thatthe share of petroleum products in the EU's primary energy de-mand will decrease from 33% in 2014 to 25% in 2040 (or a decreasefrom ca. 470 Mtoe in 2014 to around 410 Mtoe in 2030), the busi-ness outlook for the refinery sector is currently very uncertain. Therate of decline will largely depend on the effectiveness of broaderdecarbonisation, energy efficiency measures and the integration ofalternative fuels and technologies, in particular, for heating, coolingand transport. For these reasons, clustering this sector with othersectors by providing additional services and benefits can offereconomic opportunities for investments. Initially, the DHC networkdesigned for this case study can only supply the evaluated buildingswith the possibility of further expansion, especially in the com-mercial district that also has a demand for heating or coolingthroughout the year. Currently, about 70 TWh excess heat are used,which equals roughly 3% of the refinery's total final energy demand.Compared with other refineries in Europe, the refinery in Mato-sinhos probably has the potential to provide much more heat than
assumed in this scenario, making it possible to connect morebuildings to the DHC network in the future.
The costs of the DHC network could decrease even more if ab-sorption chillers were installed inside the buildings. It has to benoted that, in this case, the size of the DH network would increasein order to supply enough heat for both hot water demand andabsorption chillers. An additional piping network might berequired to provide ocean water to customers with absorptionchillers. In any case, this optimization has to be carefully designedand evaluated based on additional calculations, which are not partof this case study.
7. Conclusion
We analysed the technical and economic feasibility of alterna-tive sustainable heat and cold supply options for selected buildingsin the city of Matosinhos, Portugal. While heating and cooling in-vestments depend to a very large extent on local circumstances,many cities in southern European countries share similar charac-teristics. These include the high importance of space cooling, noDHC infrastructure and relatively good solar irradiation. In thissense, some of the results and lessons learned here are informativefor other southern municipalities as well.
The levelized costs of heating and cooling (LCOH&C) wereanalysed for the current system (natural gas boilers and compres-sion chillers) including and excluding capital costs (becausemost ofthe systems were built in the last 10 years), and for alternative RES-based systems. These systems include heat pumps, heat pumpsplus photovoltaics and the construction of a DHC network fed byexcess heat from the local refinery. All systems were calculatedfrom two perspectives: a simple socio-economic perspective (3%discount rate, excluding taxes, no external costs) and a privateeconomic perspective (7% discount rate, including taxes).
The results show that, from a simple socio-economic perspec-tive, the heat pump and compression chiller system has the highestLCOH&C. Including a PV system makes it competitive with thestatus quo, but only if capital costs are included. When consideringheating only, the heat pump system has higher LCOH compared to

E. Popovski et al. / Energy 153 (2018) 311e323322
natural gas boilers including capital costs. The use of excess heatfrom the refinery via a DHC grid shows LCOH&C at a similar level tothe current system without considering capital costs (socio-eco-nomic perspective). From the private economic perspective, thecost-effectiveness of RES-based systems is lower. The low naturalgas prices are one main reason for this, but the discount rate incombination with high capital costs for heat pumps, PV and theDHC system are other important factors.
The results for the socio-economic perspective justify policyinstruments like grants or soft loans to make the RES-based sys-tems cost-effective from a private economic perspective as well.This is probably similar for many other southern European mu-nicipalities, particularly when comparing heat pumps plus PV withnatural gas boilers.
The availability of huge excess heat resources close to the city ismore particular to Matosinhos, but also observed in many othercities throughout Europe. Using the excess heat can represent awindow of opportunity to construct a DHC grid, which can beextended at a later time and also fed by renewables like solarthermal, biomass, or even other excess heat sources.
Thus, transforming the H&C supply of large buildings to RES-based or CO2-neutral systems can be cost-competitive evenwithout accounting for external costs. Possible opportunities areprovided by the replacement cycles of existing equipment, newdevelopments or the availability of industrial excess heat. Addi-tional policies are required to make the RES-based systemscompetitive from a private economic perspective, too. All the ac-tivities require the active involvement of the city and a strategicapproach to energy planning.
Acknowledgements
We would like to thank Lukas Kranzl, Marcus Hummel andRichard Büchele of TU Wien, Jan Steinbach and Ali Aydemir ofFraunhofer ISI, and Marie Münster, Stefan Petrovi�c, and Sara BenAmer-Allam from the Technical University of Denmark (DTU).Furthermore, we thank the anonymous reviewers for the helpfulcomments that improved the quality of this paper. This work hasreceived funding from the European Union's Horizon 2020 researchand innovation programme within the progRESsHEAT project(grant agreement No. 646573).
References
[1] Fraunhofer ISI, Fraunhofer ISE, TU Wien, TEP Energy, IREES, Observer. Map-ping and analyses for the current and future (2020-2030) heating/cooling fueldevelopment (fossil/renewables). Karlsruhe. 2017.
[2] European Commission, An EU strategy on heating and cooling, 1_EN_ACT_part1_v14, (16.02.2016).
[3] Ben Amer-Allam Sara, Münster Marie, Petrovi�c Stefan. Scenarios for sustain-able heat supply and heat savings in municipalities - the case of Helsingør,Denmark. Energy 2017;137:1252e63. https://doi.org/10.1016/j.en-ergy.2017.06.091. S.
[4] Abdurafikov Rinat, Grahn Elina, Kannari Lotta, Ypy€a Joel, Kaukonen Sampo,Heimonen Ismo, Paiho Satu. An analysis of heating energy scenarios of aFinnish case district. Sustain. Cities Soc. 2017;32:56e66. https://doi.org/10.1016/j.scs.2017.03.015.
[5] Bach Bjarne, Werling Jesper, Ommen Torben, Münster Marie, Morales Juan M,Elmegaard Brian. Integration of large-scale heat pumps in the district heatingsystems of Greater Copenhagen. Energy 2016;107:321e34. https://doi.org/10.1016/j.energy.2016.04.029.
[6] Lund H, Østergaard PA, Connolly D, Mathiesen BV. Smart energy and smartenergy systems. Energy 2017;137:556e65. https://doi.org/10.1016/j.energy.2017.05.123.
[7] Lund H, Werner S, Wiltshire R, Svendsen S, Thorsen JE, Hvelplund F, et al. 4th
Generation District Heating (4GDH). Integrating smart thermal grids intofuture sustainable energy systems. Energy 2014;68:1e11. https://doi.org/10.1016/j.energy.2014.02.089.
[8] Østergaard PA, Lund H, Mathiesen BV. Smart energy systems and 4th gener-ation district heating. Int J Sustain Energy Plan Manag 2016;10:1e2. https://doi.org/10.5278/ijsepm.2016.10.1.
[9] Lund H, M€oller B, Mathiesen BV, Dyrelund A. The role of district heating infuture renewable energy systems. Energy 2010;35:1381e90. https://doi.org/10.1016/j.energy.2009.11.023.
[10] Münster Marie, Morthorst Erik Poul, Larsen V Helge, Bregnbaek Lars,Werling Jesper, Lindboe Hans Henrik, Ravn Hans. The role of district heatingin the future Danish energy system. Energy 2012;48:47e55. https://doi.org/10.1016/j.energy.2012.06.011.
[11] Bühler Fabian, Petrovic Stefan, Karlsson Kenneth, Elmegaard Brian. Industrialexcess heat for district heating in Denmark. 2017.
[12] Persson U, M€oller B, Werner S. Heat Roadmap Europe: identifying strategicheat synergy regions. Energy Pol 2014;74:663e81. https://doi.org/10.1016/j.enpol.2014.07.015.
[13] Cornelis E, Van Bael J. How well can the potential of industrial excess heat beestimated?. In: Eceee industrial summer study proceedings; 2016. p. 199e206.
[14] Capital cooling energy service AB, district cooling showcases in Europe, reportelaborated in the framework of the RESCUE project co-funded by the IEEprogram of the EU. 2016.
[15] Galindo Fern�andez, M., Roger-Lacan, C., G€ahrs, U., Aumaitre, V., Efficient dis-trict heating and cooling systems in the EU - case studies analysis, replicablekey success factors and potential policy implications, EUR 28418 EN, doi:10.2760/371045.
[16] Inpal Energy, web accesses: http://www.inpal.com/en/Pre-insulated-pipes-references-District-heating-expo98-lisbon-Inpal-Energy.html (last accessedon: 08.08.2017).
[17] Rink M. Nutzung industrieller Abw€arme durch die Stadtwerke Karlsruhe zurW€armeversorgung der Stadt Karlsruhe, Study on behalf of Umweltbunde-samtes. 2013.
[18] Holmgren K. Role of a district-heating network as a user of waste-heat supplyfrom various sources-The case of G€oteborg. Appl Energy 2006;83:1351e67.https://doi.org/10.1016/j.apenergy.2006.02.001.
[19] Kordina H, Lagger A, Schalk V, Sommer F, Spreitzer A, Timmerer C. Ener-gieversorgung-region schwechat. 2011.
[20] Bjørn H. German district heating delagation 19.11.2014 at AffakdVarme Aar-hus,TVIS - a multicity district heating wholesaler. 2014.
[21] Matriz de Energia do Município de Matosinhos (Matosinhos Energy Matrix) eAdEPorto. 2009.
[22] Relat�orio de Sustentabilidade e Responsabilidade Social (Sustainability andSocial Responsibility Report) e Matosinhos Municipality. 2014.
[23] Pordata e Base de Dados Portugal Contemporaneo (Portuguese StatisticalData Portal) e www.pordata.pt (accessed on 07.10.2016).
[24] Inqu�erito ao Consumo de Energia no Sector Dom�estico (Survey of Energy Usein the Domestic Sector). INE & DGEG; 2011.
[25] Alves D, Leal V. Caracterizaç~ao das necessidades de calor e frio numa per-spectiva de Trigeraç~ao Urbana nas zonas priorit�arias da RUTE, Fundaç~aoGomes Teixeira and AdEPorto. 2010.
[26] IPMA: Climate Normals for Porto, http://www.ipma.pt/en/oclima/normais.clima/1981-2010/014/(accessed on 24.09.2016).
[27] Element Energy Ltd, Ecofys BV. Imperial college (center for process engi-neering), the potential for recovering and using surplus heat from industry,final report for DECC. 2014.
[28] Energia Galp. Matosinhos refinery, 2013 data book on health, safety andenvironment. 2013.
[29] Element Energy Ltd, Ecofys BV. Imperial college (center for process engi-neering), the potential for recovering and using surplus heat from industry,appendix for final report for the heat strategy and policy team department ofenergy and climate change. 2014.
[30] www.seatemperature.org/europe/portugal/matosinhos-september.htm(accessed on 24.09.2016).
[31] Laitila J, Otepka P. Guidebook on local bioenergy supply based on woodybiomass. 2014. March.
[32] Andreas Pfnür A, Bernadetta Winiewska B, Bettina Mailach B, Bert Oschatz B.Dezentrale vs. zentrale W€armeversorgung im deutschen W€armemarkt. 2016.
[33] Skagestad B, Mildenstein P. District heating and cooling connection handbook,IEA programme of reaserch, development and demonstration on districtheating and cooling. 1999.
[34] Persson U, Werner S. Heat distribution and the future competitiveness ofdistrict heating. Appl Energy 2011;88.3:568e76.
[35] Swedblom M, Mattsson P, Tv€arne A, Frohm H, Rubenhag A. District coolingand the customers alternative costs, report elaborated in the RESCUE project.2014.
[36] Nussbaumer M, Thalmann S. Sensitivity of system design on heat distributioncosts in district heating. IEA Bioenergy Task 2014;32.
[37] Fraunhofer ISE. Current and future cost of photovoltaics. Long-term scenariosfor market development, system prices and LCOE of utility-scale PV systems,study on behalf of agora energiewende. 2015.
[38] Capros P, et al. EU reference scenario 2016, energy, transport and GHGemissions trends to 2050. 2016.
[39] The Danish Energy Agency: Technology data catalogue. http://www.ens.dk/node/2252. (accessed on 15.03.2016).
[40] RESCUE project - district cooling and the Customer's alternative costs. 2014.[41] Model YCAV Air cooled screw liquid chillers style a, YORK by johnson controls.[42] Technology Roadmap IEA. Energy-efficient buildings: heating and cooling
equipment. 2011.[43] IEA Heat Pump Centre. Annex 32 economical heating and cooling systems for
low energy houses, final report. 2011.

E. Popovski et al. / Energy 153 (2018) 311e323 323
[44] Energiesysteme IDM. Heat pump manual. 2014.[45] Fraunhofer ISE. Levelized cost of electricity renewable energy technologies. 2013.[46] NREL. Best practices inPV systemoperations andmaintenance, version1.0. 2015.[47] IEA PVPS. Analytical monitoring of grid-connected photovoltaic systems, good
practices for monitoring and performance analysis. 2014.[48] Eid C, Guillen J, Marin P, Hakvoort R. The economic effect of electricity net-
metering with solar PV: consequences for network cost recovery, cross sub-sidies and policy objectives. Energy Pol 2014;75:244e54.
[49] Schill WP, Zerrahn A, Kunz F. Prosumage of solar electricity: pros, cons, andthe system perspective. 2017. https://doi.org/10.5547/2160-5890.6.1.wsch.
[50] Kranzl Lukas, Hummel Marcus, Müller Andreas, Steinbach Jan. Renewableheating: perspectives and the impact of policy instruments. Energy Pol2013;59:44e58. https://doi.org/10.1016/j.enpol.2013.03.050. S.
[51] Steinbach Jan, Seefeldt Friedrich, Brandt Edmund, Bürger Veit, Jacobshagen Ulf,Kachel Markus, et al. State budget independent, market-based instruments tofinance renewable heat strategies. Energy Environ 2013;24(1e2):195e218.https://doi.org/10.1260/0958-305X.24.1-2.195. S.
[52] International Energy Agency. Light's Labour's lost. IEA Publications; 2006.[53] Chittum Anna, Østergaard A Poul. How Danish communal heat planning
empowers municipalities and benefits individual consumers. Energy Pol2014;74:465e74. https://doi.org/10.1016/j.enpol.2014.08.001.
[54] International Energy Agency. World energy outlook 2016. IEA Publications;2016.
[55] FEE. Fundo de Eficiencia Energ�etica, AVISO 12 e requalificaç~ao de SistemasSolares T�ermicos. 2015.