teach epidemiology professional development workshop day 3 sierra nevada college tahoe environmental...
TRANSCRIPT

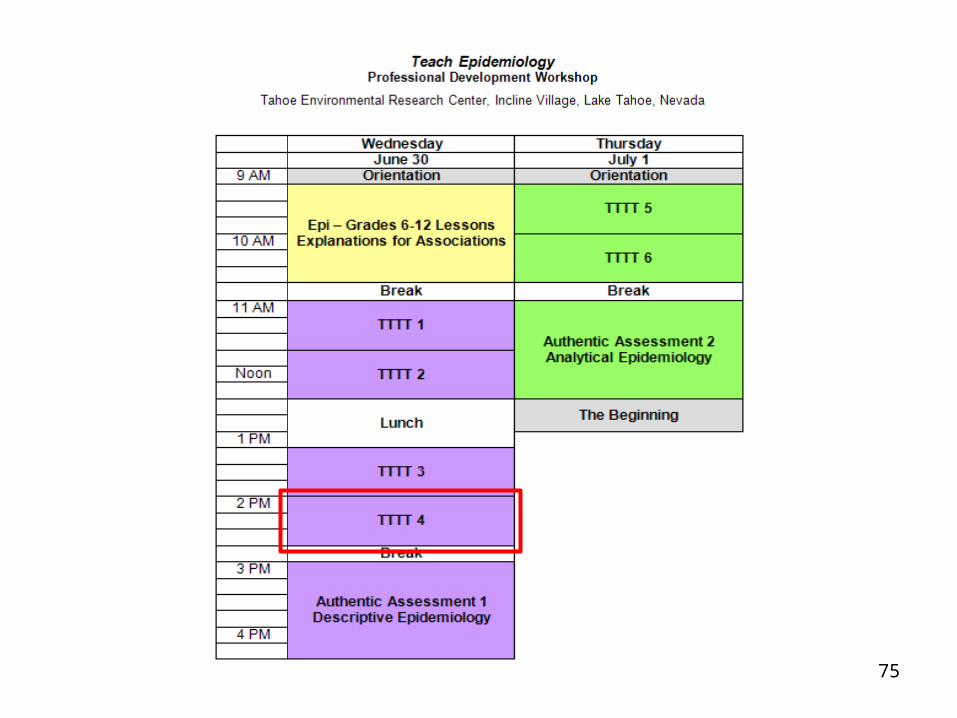
Teach EpidemiologyProfessional Development Workshop
Day3
Sierra Nevada College Tahoe Environmental Research CenterIncline Village, Lake Tahoe, Nevada
June 28 – July 1, 2010

2

3

4
5
I am confused on how I will teach epi. The more I learn the more confused I get.
Where do I start?

6
Create and Teach a New Epidemiology Lesson
Teach Epidemiology
What do you mean - Teach Epidemiology?

7Teach Epidemiology
What do you mean - Teach Epidemiology?
Teaching Existing Epidemiology Lessons

8
Teaching Existing Epidemiology Lessons
http://www.buffetbusters.ca/
Teach Epidemiology
What do you mean - Teach Epidemiology?

9
Teaching Existing Epidemiology Lessons
http://www.montclair.edu/Detectives/
Teach Epidemiology
What do you mean - Teach Epidemiology?

10
Teaching Existing Epidemiology Lessons
http://www.montclair.edu/drugepi/
Teach Epidemiology
What do you mean - Teach Epidemiology?

11
Handout
Teaching Existing Epidemiology Lessons
Teach Epidemiology
What do you mean - Teach Epidemiology?
http://www.collegeboard.com/yes/ft/iu/units.html

12
Teaching Existing Epidemiology Lessons
http://ccnmtl.columbia.edu/projects/epiville/
Teach Epidemiology
What do you mean - Teach Epidemiology?

13
Teaching Existing Epidemiology Lessons
http://www2a.cdc.gov/epicasestudies/
Teach Epidemiology
What do you mean - Teach Epidemiology?

14
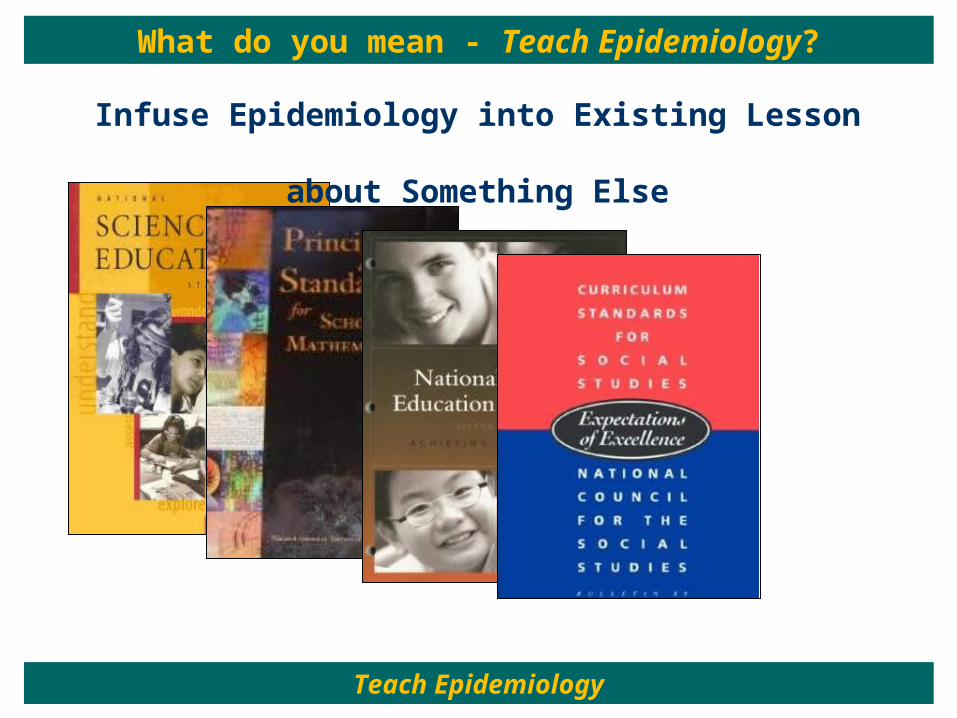
Infuse Epidemiology into Existing Lesson about Something Else
Teach Epidemiology
What do you mean - Teach Epidemiology?

15
Infuse Epidemiology into Existing Lesson about Something Else
Teach Epidemiology
What do you mean - Teach Epidemiology?

16
Infuse Epidemiology into Existing Lesson about Something Else
Teach Epidemiology
What do you mean - Teach Epidemiology?

17
Infuse Epidemiology into Existing Lesson about Something Else
Teach Epidemiology
What do you mean - Teach Epidemiology?
18
Infuse Epidemiology into Existing Lesson about Something Else
Teach Epidemiology
What do you mean - Teach Epidemiology?

19
Infuse Epidemiology into Existing Lesson about Something Else
Teach Epidemiology
What do you mean - Teach Epidemiology?

20
Explore Public Health Career Paths
http://www.asph.org/document.cfm?page=1038
Teach Epidemiology
What do you mean - Teach Epidemiology?

21
Explore Public Health Career Paths
http://pathwaystopublichealth.org/
Teach Epidemiology
What do you mean - Teach Epidemiology?

22
Leverage the Young Epidemiology Scholars Competition
http://www.collegeboard.com/yes/
Teach Epidemiology
What do you mean - Teach Epidemiology?

23
Leverage the Science Olympiad Competition
http://soinc.org/
Teach Epidemiology
What do you mean - Teach Epidemiology?
24
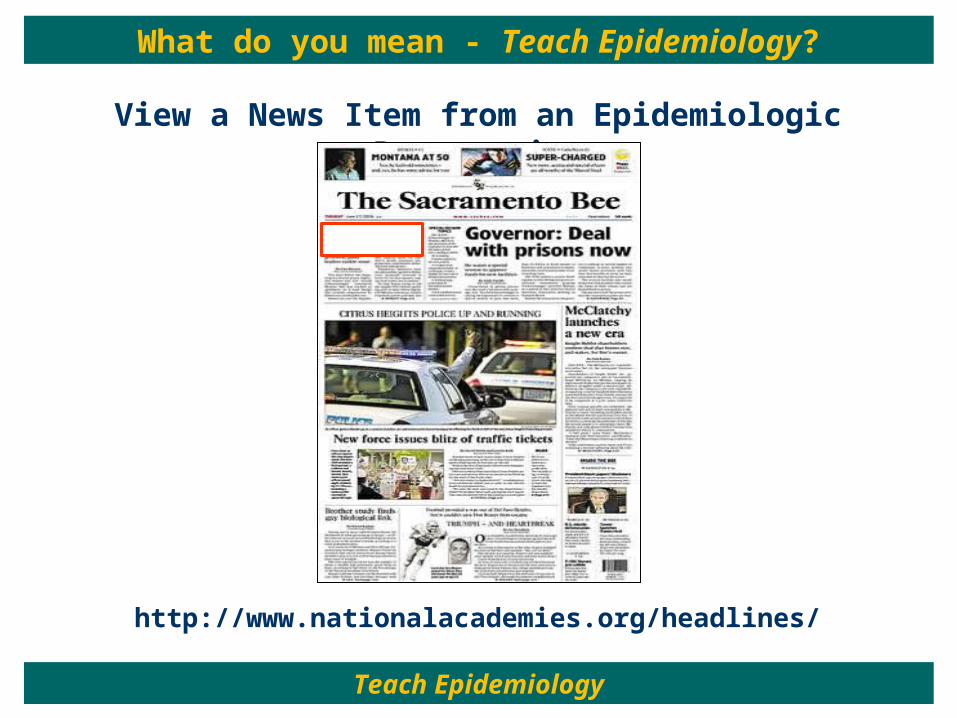
View a News Item from an Epidemiologic Perspective
http://www.nationalacademies.org/headlines/
Teach Epidemiology
What do you mean - Teach Epidemiology?

25

26

27

28
Epidemiology
... the study of the distribution and determinants of health-related states or events in specified populations and the application of this study to the control of health problems.
Leon Gordis, Epidemiology, 3rd Edition, Elsevier Saunders, 2004.
Teach Epidemiology
Explaining Associations and Judging Causation

29
Outcome
If an association was causal, ….
Hypothesized Exposure XX
… and you avoided or eliminated the hypothesized cause, what would happen to the outcome?
causal, ….
?
Teach Epidemiology
Explaining Associations and Judging Causation

30
Outcome
If the association was found due to confounding, ….
Hypothesized Exposure
Unobserved Exposure
X… and you avoided or eliminated the hypothesized cause, what would
happen to the outcome?
?
found due to confounding, ….
Teach Epidemiology
Explaining Associations and Judging Causation

31
Hypothesized Exposure
Outcome
If an association was found due to reversed time-order, ….found due to reversed time order, ….
X… and you avoided or eliminated the hypothesized cause, what would
happen to the outcome?
?
Teach Epidemiology
Explaining Associations and Judging Causation

32
Outcome
If an association was found due to chance, ….
Hypothesized Exposure
found due to chance, ….
X… and you avoided or eliminated the hypothesized cause, what would
happen to the outcome?
?
Teach Epidemiology
Explaining Associations and Judging Causation

33
Outcome
If an association was found due to bias, ….
Hypothesized Exposure
?
found due to bias, ….
X… and you avoided or eliminated the hypothesized cause, what would
happen to the outcome?
Teach Epidemiology
Explaining Associations and Judging Causation

34
Outcome
If an association was causal, ….
Hypothesized Exposure XX
… and you avoided or eliminated the hypothesized cause, what would happen to the outcome?
causal, ….
... the study of the distribution and determinants of health-related states or events in specified populations and the application of this study to the control of health problems.
Teach Epidemiology
Explaining Associations and Judging Causation

35
1. Cause
2. Confounding
3. Reverse Time Order
4. Chance
5. Bias
... the study of the distribution and determinants of health-related states or events in specified populations and the application of this study to the control of health problems.
Teach Epidemiology
Explaining Associations and Judging Causation

36
Suicide Higher in Areas with Guns
Family Meals Are Good for Mental Health
Lack of High School Diploma Tied to US Death
Rate
Study Links
Spanking to
Aggression
Study Concludes: Movies Influence
Youth Smoking
Study Links Iron
Deficiency to Math
Scores
Kids Who Watch R-Rated Movies More Likely to Drink, Smoke
Pollution Linked with Birth Defects in US Study
1. Cause
2. Confounding
3. Reverse Time Order
4. Chance
5. Bias
Snacks Key to Kids’ TV- Linked Obesity: China
Study
Depressed Teens More
Likely to Smoke
Teach Epidemiology
Explaining Associations and Judging Causation

37Teach Epidemiology
Explaining Associations and Judging Causation

38

39Teach Epidemiology
Explaining Associations and Judging Causation
Teach Epidemiology
Explaining Associations and Judging Causation

Handout
Teach Epidemiology
Explaining Associations and Judging Causation

1.
2.
3.
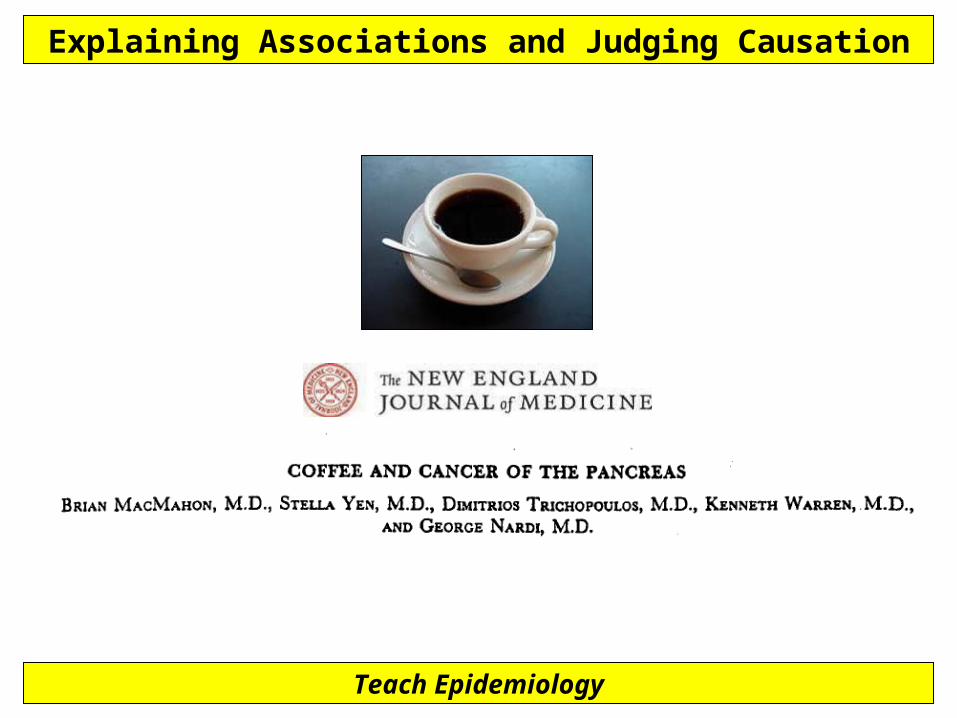
Coffee and Cancer of the Pancreas
Teach Epidemiology
Explaining Associations and Judging Causation
What is the study design?
Do you think coffee and cancer of the pancreas turned up together because coffee causes cancer of the pancreas?
Cause Confounding Reverse Time Order Chance Bias
Why or why not?

43

44
Guilt or Innocence?Causal or Not Causal?
Does evidence from an aggregate of studies support a cause-effect relationship?
Teach Epidemiology
Explaining Associations and Judging Causation

45
Sir Austin Bradford Hill “The Environment and Disease:
Association or Causation?” Proceedings of the Royal Society of Medicine
January 14, 1965
Handout
Teach Epidemiology
Explaining Associations and Judging Causation

46
“In what circumstances can we pass from this observed association
to a verdict of causation?”
Teach Epidemiology
Explaining Associations and Judging Causation

47
“Here then are nine different viewpoints from all of which we should study association
before we cry causation.”
Teach Epidemiology
Explaining Associations and Judging Causation

Does evidence from an aggregate of studies support a cause-effect relationship?
1. What is the strength of the association between the risk factor and the disease?
2. Can a biological gradient be demonstrated?
3. Is the finding consistent? Has it been replicated by others in other places?
4. Have studies established that the risk factor precedes the disease?
5. Is the risk factor associated with one disease or many different diseases?
6. Is the new finding coherent with earlier knowledge about the risk factor and the m disease?
7. Are the implications of the observed findings biologically sensible?
8. Is there experimental evidence, in humans or animals, in which the disease has m been produced by controlled administration of the risk factor?
Teach Epidemiology
Explaining Associations and Judging Causation

Timeline
Cohort Study
Randomized Controlled Trial
Timeline
Case-Control Study
Timeline
Cross-Sectional Study
Timeline
E
E
O
O
O
O
E
E
E
E
Healthy PeopleHealthy People
E
Random Assignment
E
O
O
O
O
Healthy PeopleHealthy People
E
E
O
O
O
O
Teach Epidemiology
Explaining Associations and Judging Causation

Handout
Teach Epidemiology
Explaining Associations and Judging Causation

51
Stress causes ulcers.
Helicobacter pylori causes ulcers.
Teach Epidemiology
Explaining Associations and Judging Causation

52
*
*
*
**
*
*
*
*
Teach Epidemiology
Explaining Associations and Judging Causation

53Teach Epidemiology
Explaining Associations and Judging Causation

54

55

56

57

58Teach Epidemiology
Teachers Team-Teaching Teachers (TTTT)
TTTT1

59
They can then use that ability to think about their own thinking … to grasp how other people might learn. They know what has to come first,
and they can distinguish between foundational concepts and
elaborations or illustrations of those ideas.
They realize where people are likely to face difficulties developing their own comprehension,
and they can use that understanding to simplify
and clarify complex topics for others, tell the right story, or raise a powerfully provocative question.
Ken Bain, What the Best College Teachers Do
Metacognition
Teach Epidemiology
Epi – Grades 6-12

60Teach Epidemiology
Enduring Epidemiological Understandings

61

62

63Teach Epidemiology
Teachers Team-Teaching Teachers (TTTT)
TTTT2

64
They can then use that ability to think about their own thinking … to grasp how other people might learn. They know what has to come first,
and they can distinguish between foundational concepts and
elaborations or illustrations of those ideas.
They realize where people are likely to face difficulties developing their own comprehension,
and they can use that understanding to simplify
and clarify complex topics for others, tell the right story, or raise a powerfully provocative question.
Ken Bain, What the Best College Teachers Do
Metacognition
Teach Epidemiology
Epi – Grades 6-12

65Teach Epidemiology
Enduring Epidemiological Understandings

66

67

68

69

70Teach Epidemiology
Enduring Epidemiological Understandings

71
TTTT3
Teach Epidemiology
Teachers Team-Teaching Teachers (TTTT)

72
They can then use that ability to think about their own thinking … to grasp how other people might learn. They know what has to come first,
and they can distinguish between foundational concepts and
elaborations or illustrations of those ideas.
They realize where people are likely to face difficulties developing their own comprehension,
and they can use that understanding to simplify
and clarify complex topics for others, tell the right story, or raise a powerfully provocative question.
Ken Bain, What the Best College Teachers Do
Metacognition
Teach Epidemiology
Epi – Grades 6-12

73Teach Epidemiology
Enduring Epidemiological Understandings

74
75

76Teach Epidemiology
Teachers Team-Teaching Teachers (TTTT)
TTTT4

77
They can then use that ability to think about their own thinking … to grasp how other people might learn. They know what has to come first,
and they can distinguish between foundational concepts and
elaborations or illustrations of those ideas.
They realize where people are likely to face difficulties developing their own comprehension,
and they can use that understanding to simplify
and clarify complex topics for others, tell the right story, or raise a powerfully provocative question.
Ken Bain, What the Best College Teachers Do
Metacognition
Teach Epidemiology
Epi – Grades 6-12

78Teach Epidemiology
Enduring Epidemiological Understandings

79

80

81

82

83

Enduring Understandings The big ideas that reside at the heart of a discipline
and have lasting value outside the classroom
Authentic Assessments Real-world experiences designed to assess
students’ grasp of the Enduring Understanding(s)
Pedagogical Principles

Authentic epidemiology assessments are designed to capture students’ attention and
challenge their scientific reasoning
The goal is to have students learn, do, and get excited about epidemiology
* From: Understanding by Design by Wiggins and McTighe
Application of Authentic Assessment Model
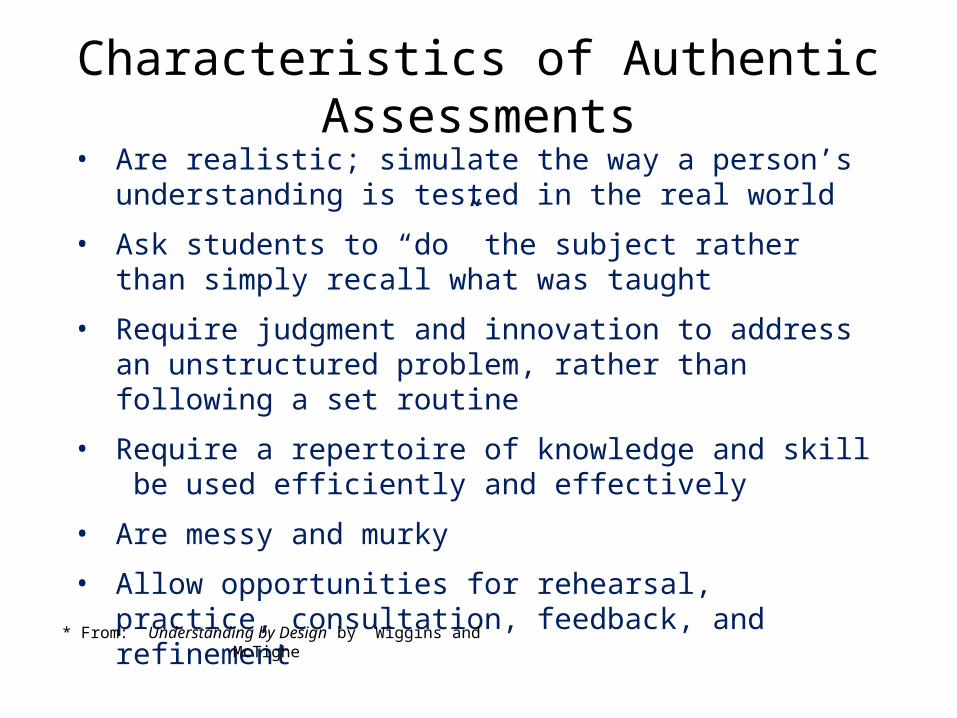
• Are realistic; simulate the way a person’s understanding is tested in the real world
• Ask students to “do” the subject rather than simply recall what was taught
• Require judgment and innovation to address an unstructured problem, rather than following a set routine
• Require a repertoire of knowledge and skill be used efficiently and effectively
• Are messy and murky
• Allow opportunities for rehearsal, practice, consultation, feedback, and refinement
* From: Understanding by Design by Wiggins and McTighe
Characteristics of Authentic Assessments

Perform
ance ta
sks
Informal c
hecks f
or underst
anding
Observa
tions a
nd dialogues
Tests and quizz
es
Academic
prompts
* From: Understanding by Design by Wiggins and McTighe
A Continuum of Assessments

“Inquiry is a multifaceted activity that involves making observations; posing questions; examining books and other sources of information to see what is already known; planning investigations; reviewing what is already known in light of experimental evidence; using tools to gather, analyze, and interpret data; proposing answers, explanations, and predictions; and communicating the results. Inquiry requires identification of assumptions, use of critical and logical thinking, and consideration of alternative explanations. Students will engage in selected aspects of inquiry as they learn the scientific way of knowing the natural world, but they should also develop the capacity to conduct complete inquiries.”
National Committee on Science Education Standards and Assessment, National Research CouncilCopyright National Academy of Sciences, 1996, http://www.nap.edu/catalog/4962.html.
National Science Education StandardsExcerpted from: Perspectives and Terms in the National Science Standards
Value

Today - Authentic Assessment IAdministering a Surveillance Questionnaire
Learners create and administer survey questions about a health-related behavior and its distribution in terms of person, place, and time. After doing so, they count the frequency of the health-risk behavior, calculate the overall prevalence of the behavior, identify patterns of the behavior in terms of person, place, and time, and formulate hypotheses that might explain those patterns.
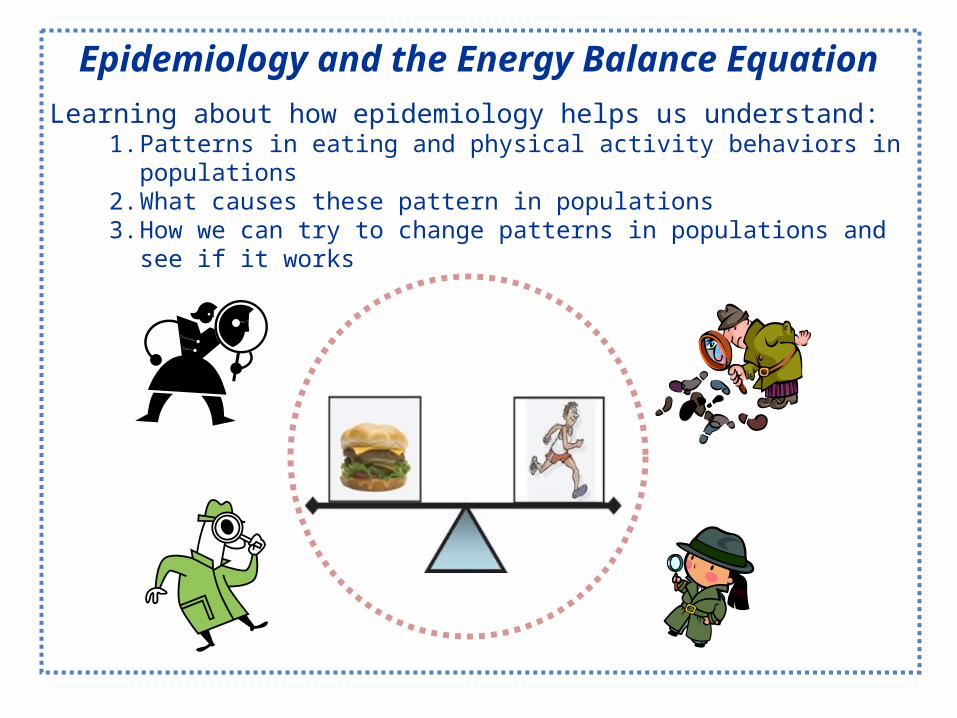
Epidemiology and the Energy Balance Equation
Learning about how epidemiology helps us understand: 1. Patterns in eating and physical activity behaviors in populations2. What causes these pattern in populations3. How we can try to change patterns in populations and see if it works
91
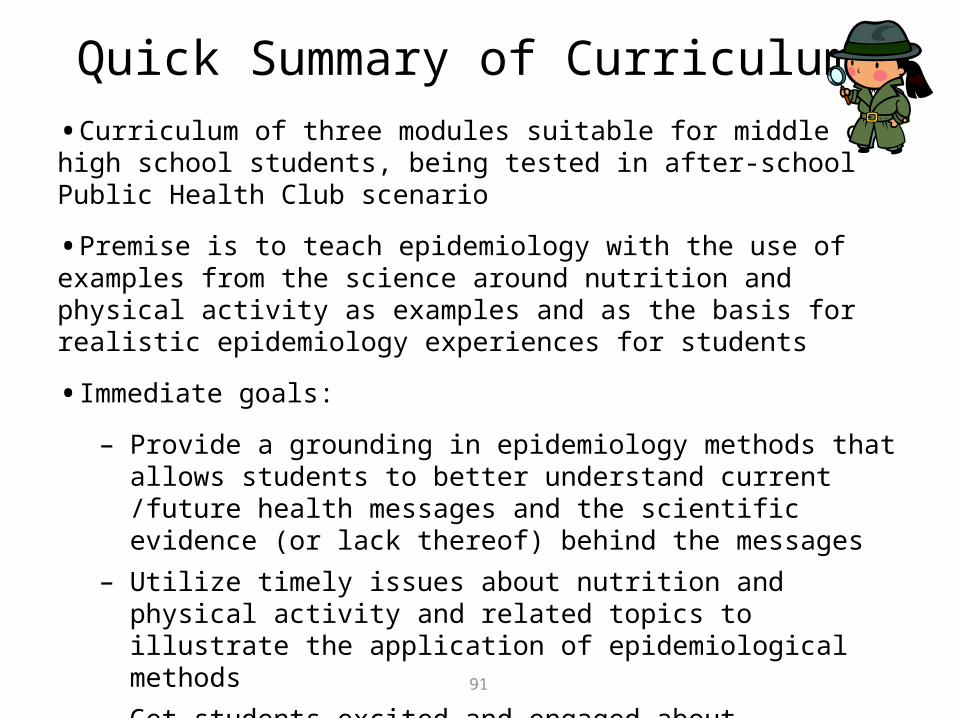
•Curriculum of three modules suitable for middle or high school students, being tested in after-school Public Health Club scenario
•Premise is to teach epidemiology with the use of examples from the science around nutrition and physical activity as examples and as the basis for realistic epidemiology experiences for students
•Immediate goals:
– Provide a grounding in epidemiology methods that allows students to better understand current /future health messages and the scientific evidence (or lack thereof) behind the messages
– Utilize timely issues about nutrition and physical activity and related topics to illustrate the application of epidemiological methods
– Get students excited and engaged about epidemiology through real-world experience in designing, conducting and interpreting investigations, helping them to grasp the understandings needed to think like an epidemiologist
Quick Summary of Curriculum

The Subject Matters
• Increasing incidence of overweight and obesity among children and adolescents, as well as the American population as a whole
• Increasing health consequences such as Type 2 diabetes, even among young people
• Minority populations are especially at risk
92

93
Energy Balance - Descriptive Epidemiology
What are the patterns in populations?
• Module 1 in curriculum is “Descriptive Epidemiology, Surveillance, and Hypothesis Generation”
What are the patterns of eating and physical activity behaviors among our classmates (including person,
place, and time)?

• Module 1 concludes with authentic assessment to see if students have grasped the enduring understandings for that Module
• Students conduct surveillance studies of their classmates. This is simulated research (not actual research because it will not produce generalizable knowledge)
• The assessment is designed to see if students have acquired sufficient knowledge and skills to be able to demonstrate their grasp of the enduring understandings
• In order to be able to perform authentic tasks, students first need to learn about various elements of conducting a surveillance study, including criteria for doing it well. This is teaching to the test (i.e., the authentic assessment)
94
Authentic Assessment of EU’s 2 & 3

Module 1 Lessons1-1 Introduction to Curriculum1-2 Describing Health-Related Behaviors in Youth1-3 Surveillance1-4 Respect - Part I1-5 Creating a Question1-6 Ask, Count, and Calculate 1-7 Patterns and Hypotheses 1-8 Looking for Patterns1-9 Surveillance Questions – In Class 1-10 Surveillance Questions – In School (test)
Teaching to the Test

Today’s Plan
• Get into teams / team name• Write a “What” question (group)• Develop PPT questions (teams) • Administer surveys• Organize data• Calculate prevalence rates for the “What”
and for PPT variables• Examine patterns and formulate hypotheses• Present results• Discuss how to utilize in classroom/metacognition

Develop a “What” Question for Survey
• In a class discussion, propose “What” questions about . . . the prevalence of regular exercise
• The question should be answerable with a “yes” or “no”
• Determine the best “What” question to use in today’s survey

Criteria for a Good Question
Handout

Criteria for a Good Question
It should be clear and unambiguous, written so that its intended audience understands it.
Do you usually get a good night’s sleep?
It should mean the same thing to everyone who reads it. In other words, if 100 students all behave the same way they must all select the same answer.
Typically, do you watch television five or more days a week?

Criteria for a Good Question
The answer options categorize and cover the entire range of possible behavior (from complete absence of the behavior to a maximum amount of the behavior).
How often do you usually bring your lunch to school?a.Neverb.1-2 times per weekc.2-4 times per weekd.Every day
In the past two years, have you typically eaten five or more servings of fruits and vegetables per day?
The time period to consider when answering a particular question must be appropriate (long or short enough) to capture the frequency of behavior desired.

Develop PPT Questions (Teams)
•Each team will write two PPT questions
They will be “yes/no” questions or other questions with two-answer choices (such as male/female, or urban versus non-urban residence, or weekdays versus weekend)
•AA administrator will assign whether teams address two P, P, or T factors

DrugEpi 2-1 Overview of PPT and In the News
Who?
Where?
When?
Person:
Place:
Time:
Person, Place, and Time

DrugEpi 2-1 Overview of PPT and In the News
Who? Where? When?
AgeSex
RaceEthnicity
OccupationEconomic Group
ParityMarital Status
Residence TypeNeighborhood
Occupation LocationBeing at Specific Events
Geographic SitesUrban/Rural
ClimateProximity to . . .
(Small to large increments of time)
HoursDays
WeeksMonthsSeasons
YearsEras
Behaviors by Person, Place, and Time

104
• PPT questions dig deeper, to further describe how the health-related behavior looks in your study population in terms of person, place, and time factors in their lives.
• Now you can examine patterns (how the behavior is distributed by different factors)
A question about “person” can tell you about prevalence in boys versus girls or by ethnicity
A question about “place: can tell you about the behavior in people living in houses vs. apartments or in various types of climates
A question about “time” can examine seasonal variation or distributions of the behavior by time of day or day of week
• PPT patterns (also called distributions) will enhance your understanding of the health-related behavior and may give rise to some hypotheses to explain these patterns
Lesson 1-8 : Looking for Patterns
Why are we adding PPT questions?

Administer Surveys1.Each study team will submit two PPT questions to the AA administrator for typing and putting on screen OR each team will write their two questions clearly on white poster paper.
2.A learner will read the informed consent script
3.Participants for each study will consist of volunteers from all study teams except the team conducting the study.
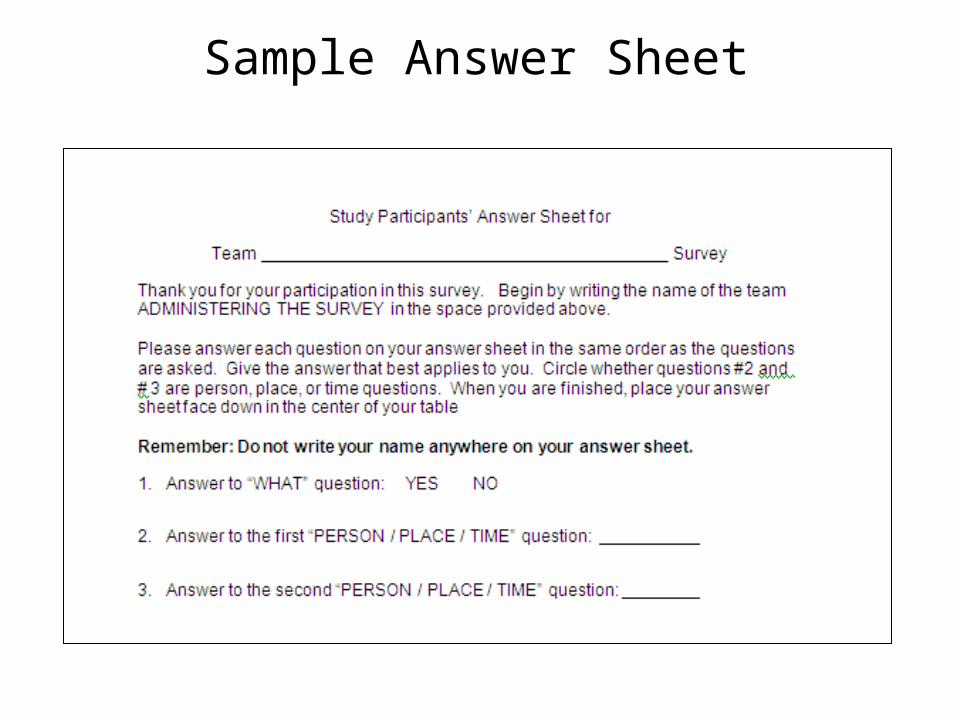
4.Pass out answer sheets to study team tables, in sufficient numbers for each of the surveys. The answer sheets contain space to answer three questions per survey (the “What” question and two PPT questions.
5.Put the name of the team conducting the study in the space provided.
6.One at a time and in succession, display on screen or read aloud from poster the “What” question (#1) and the two PPT questions (#2 and #3). Put sheets face down on the table for collection (answer sheets will be collected for the first survey before starting the next one – and so on).
CDC

Informed Consent
My name is _________ and I am participating in the conduct of a cross-sectional study among students in our school. We would like to ask you some question regarding _________ (insert exposure and outcome).This is simulation of an epidemiological investigation that is being carried out for educational purposes only. It is not an actual study from which generalizations will be made. To conduct this study, I would like you to consider completing a brief survey. It has _____ questions and will take approximately _____ minutes to complete. If there are any risks assumed by participating, they are no greater than those you encounter in daily life. There are no benefits to you for participating and there is no compensation.Your answers will be handled in strictly confidential ways to protect your privacy. You will not write your name on the survey. All surveys and any grouped data that are generated will be destroyed at the end of the SO event. The study team wants you to know that your participation is voluntary and that you can stop participating at any time without consequence. You can refuse to participate now; you can change your mind after starting to participate; or, after completing the survey, you can decide not to submit it. Do you have any questions? Would you like to participate?

Administer Surveys1.Each study team will submit two PPT questions to the AA administrator for typing and putting on screen OR each team will write their two questions clearly on white poster paper.
2.A learner will read the informed consent script
3.Participants for each study will consist of volunteers from all study teams except the team conducting the study .
4.Pass out answer sheets to study team tables, in sufficient numbers for each of the surveys. The answer sheets contain space to answer three questions per survey (the “What” question and two PPT questions.
5.Put the name of the team conducting the study in the space provided.
6.One at a time and in succession, display on screen or read aloud from poster the “What” question (#1) and the two PPT questions (#2 and #3). Put sheets face down on the table for collection (answer sheets will be collected for the first survey before starting the next one – and so on).
CDC
Sample Answer Sheet

Data Analysis
• Surveillance studies measure a behavior or disease of interest (the “What”) in a population or sample of a population
• First, the number of people with that behavior or disease is counted
• Then the prevalence rate is calculated as the number of people with the behavior or disease, divided by the total number of people surveyed
• Other factors of person, place, and/or time are also examined to see if there are patterns in the prevalence rates among people according to PPT features
• Careful scrutiny of person, place, and/or time information may give rise to reasonable hypotheses to explain observed patterns
109
-

All Survey Participants
Yes – Eat 5+ fruits/vegetables
per dayTotal
10040 60
110
-
Example of Prevalence Calculation of the “What”
No – Do Not Eat 5+ fruits/vegetables
per day Prevalence Rate in Survey
40%

Male Participants
Yes – Eat 5+ fruits/vegetables
per day
Total Males
in Survey
5010 40
111
Example of Analysis Stratified by a “Person” Characteristic (gender)
No – Do Not Eat 5+ fruits/vegetables
per day
Female Participants
Yes – Eat 5+ fruits/vegetables
per day
Total Females
in Survey
5030 20
No – Do Not Eat 5+ fruits/vegetables
per day
-
Prevalence Rate in Males
Prevalence Rate in Females
20%
60%
Statement: Prevalence of eating 5+ fruits/vegetables per day is higher among females (60%) than it is among males (20%)
Hypotheses: Women are more health conscious, women shop for the food . . . . ???

Complete Worksheet
Present Results

1. Overall Prevalence
2. Results by “Person” / Hypotheses?
3. Results by “Place” / Hypotheses?
4. Results by “Time” / Hypotheses?
113Lesson 1-9: Surveillance Questions - In Class
Presentation/Discussion of Results

Rubric for Evaluating Presentation
114
Criteria Got It Getting It Will Get It SoonParticipation All study team
members participateMost study team
members participateSome study team
members participate
Use of Epidemiology Terminology such as
Prevalence and Surveillance
All are appropriate and accurate
Most are appropriate and accurate
Some are appropriate and accurate
Accurate calculation of prevalence (either
fraction or percentage)
All 4 prevalence measures correctly
calculated
2-3 prevalence measures correctly
calculated
0-1 prevalence measures correctly
calculated
Understanding of person, place and
time questions
All 3 questions pertained to person,
place, and time, respectively
2 questions pertained to person, place, or
time
0-1 questions pertained to person,
place, or time
Generation of reasonable and/or
interesting hypotheses
1 or more hypotheses make sense in light of
survey results
1 or more hypotheses make limited sense in light of survey results
1 or more hypotheses make little or no sense in light of survey results
Understanding of limitations of their survey questions
Identified at least 2 reasonable and
logical limitations
Identified 1 reasonable and logical limitation
Did not identify any reasonable or logical
limitations
Lesson 1-10: Surveillance Questions - In School

DrugEpi 1-5 NSDUH
Food for Thought: What are the limitations of your survey?
SamplingAdequacy of
questions
Biased
answersTelling the truth