tea industry in kenya - unilever east & west africa · •tea production in kenya •company...
TRANSCRIPT


• Tea Production in Kenya
• Company Performance 2016
• 2017 and longer term prospects

WORLD TEA PRODUCTIO:2015&2016
China India Kenya Sri Lanka Turkey Vietnam Indonesia Japan Argentina
2015 2230 1191 399 328 230 165 129 82 83
2016 2350 1239 473 292 253 165 126 77 84
0
500
1000
1500
2000
2500
Major Tea Producing Countries-Million Kgs
2015 2016
Pakistan
Egypt
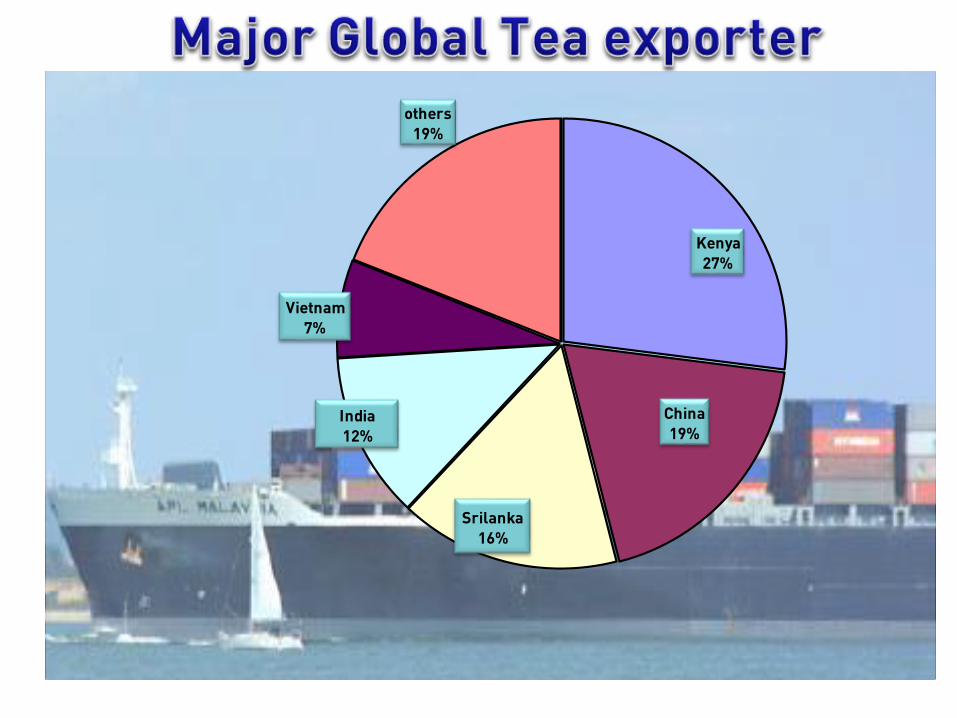
Kenya
27%
China
19%
Srilanka
16%
India
12%
Vietnam
7%
others
19%

Pakistan 29%
Egypt 19%
UK 10%
UAE 7%
Afghanistan 7%
Sudan 5%
Russia 4%
Yemen 3%
Kazakhstan 2%
Others 14%
PAKISTAN
EGYPT
UK
UAE
AFGHANISTAN
SUDAN
RUSSIA
YEMEN
KAZAKHSTAN
0thers

378 370
432445
399
473
200
250
300
350
400
450
500
2011 2012 2013 2014 2015 2016
'000 tonnes
Year
19% increase vs. 2015

2011 2012 2013 2014 2015 2016
2.99 3.18 2.53 2.16 2.98 2.36
2.993.18
2.53
2.16
2.98
2.36
1.00
1.50
2.00
2.50
3.00
3.50
21% lower vs. 2015

88.87
84.5286.13
88.08
98.59 102.29
55
60
65
70
75
80
85
90
95
100
105
11 12 13 14 15 16
Ksh/US$
4% increase
Vs 2015

11 12 13 14 15 16
266 270 218 190 294 241
70
120
170
220
270
320
18% decrease Vs 2015.

• Kenyan production 19% above 2015.
• US$ tea prices decreased by 21% from 2015
• Kenyan shilling depreciated by 4%
• Price in ksh decreased by 18%.

– Market challenges- instability in key export markets.
– Volatility in tea auction prices.
– Variability of climatic conditions
– Currency fluctuations
– Wage inflation and pressure to provide employment


2011 2012 2013 2014 2015 2016
628 651 689 770 692 711
0
100
200
300
400
500
600
700
800
900
+3% Vs 2015
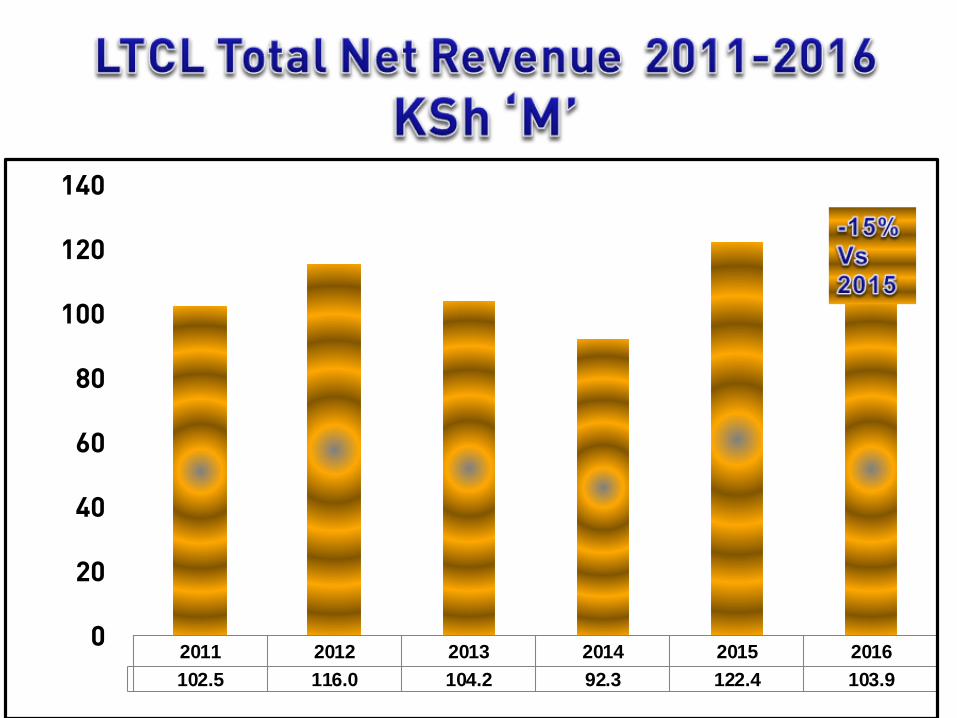
2011 2012 2013 2014 2015 2016
102.5 116.0 104.2 92.3 122.4 103.9
0
20
40
60
80
100
120
140

2011 2012 2013 2014 2015 2016
163 178 151 120 174 146
-
20
40
60
80
100
120
140
160
180
200
16%Vs 2015

2011 2012 2013 2014 2015 2016
Shs / Kg 23.9 26.9 27.6 26.8 28.9 36.5
5
10
15
20
25
30
35
40 26%Vs
2015

-55
152535455565758595
105115125135145155
2011 2012 2013 2014 2015 2016
60
147
42
2 8-27
•Higher crop
•Lower Price
•Bio Assets
Value Loss of 5M
Low crop, High Price
Bio Assets Value +22 m
Higher crop, Low Price
Bio Assets Value gain of
13.5M down from 98.5m
in 2013.(decrease by
85M) 1. Price decline by
16%2. Cost increase due
to general
inflation and
higher Electricity costs.
Low crop, High Price,
Bio Assets Value +99 m
•Low crop
•Higher Price
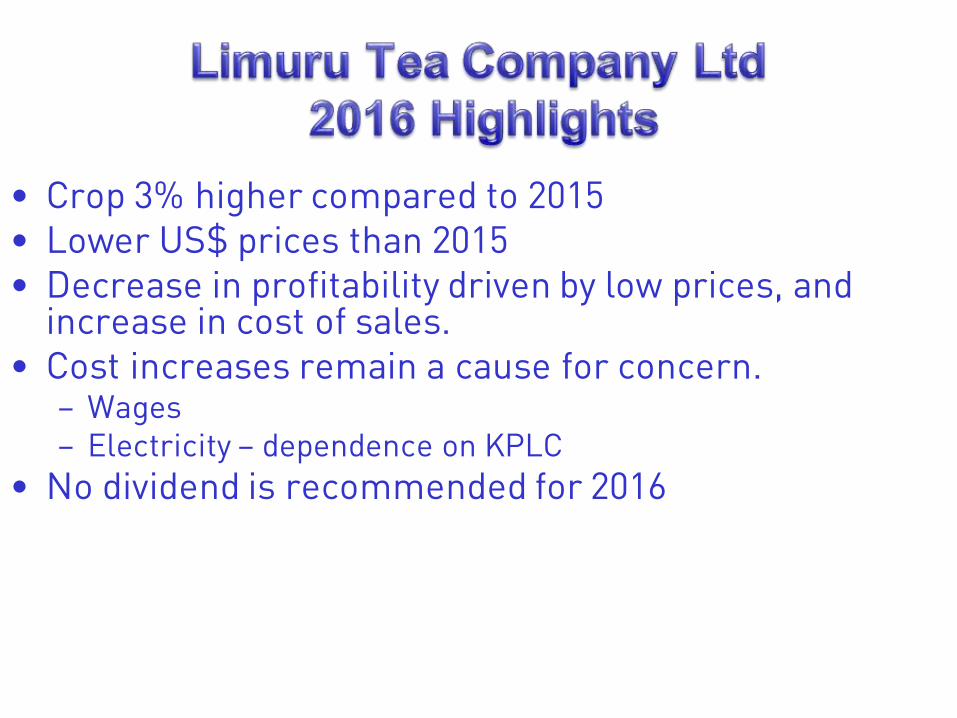
• Crop 3% higher compared to 2015• Lower US$ prices than 2015• Decrease in profitability driven by low prices, and
increase in cost of sales.• Cost increases remain a cause for concern.
– Wages– Electricity – dependence on KPLC
• No dividend is recommended for 2016

• 2017 Q1 experienced prolonged drought that adversely impacted on production.
• 2017 crop expected to be lower than 2016
• Currency volatility expected
• We expect 2017 tea market prices to be in line with long term averages.

• Continued focus on costs management
• Continually improve tea quality
• Growth
– 9.64 ha replanted in 2016
– 12 ha to be replanted in 2017
• Maintenance of Rainforest Alliance certification
• Continued focus on employee social welfare.

Continued focus on employees’Safety, Health & SecurityImprovement in social infrastructure
▪ Maintenance of houses
& facilities
▪ Engagement with
pupils of Rongai
Primary school in LTC
on safety & security
for boys and
girls


2015 May view
NTD 12.6Ha (field 65) was planted in 2015 and will fully mature in 2018
2016 May view
2017 May view


THANK YOU TWAWEZA AWARD