te connectivity q3 2016 earnings presentation
TRANSCRIPT

Q3 2016 Earnings
July 20, 2016
Forward-Looking Statementsand Non-GAAP Measures
2
Forward-Looking StatementsThis presentation contains certain “forward-looking statements” within the meaning of the U.S. Private Securities Litigation Reform Act of
1995. These statements are based on management’s current expectations and are subject to risks, uncertainty and changes in
circumstances, which may cause actual results, performance, financial condition or achievements to differ materially from anticipated results,
performance, financial condition or achievements. All statements contained herein that are not clearly historical in nature are forward-looking
and the words “anticipate,” “believe,” “expect,” “estimate,” “plan,” and similar expressions are generally intended to identify forward-looking
statements. We have no intention and are under no obligation to update or alter (and expressly disclaim any such intention or obligation to do
so) our forward-looking statements whether as a result of new information, future events or otherwise, except to the extent required by law.
The forward-looking statements in this presentation include statements addressing our future financial condition and operating results.
Examples of factors that could cause actual results to differ materially from those described in the forward-looking statements include,
among others, business, economic, competitive and regulatory risks, such as conditions affecting demand for products, particularly in the
automotive and data and devices industries; competition and pricing pressure; fluctuations in foreign currency exchange rates and
commodity prices; natural disasters and political, economic and military instability in countries in which we operate; developments in the
credit markets; future goodwill impairment; compliance with current and future environmental and other laws and regulations; the possible
effects on us of changes in tax laws, tax treaties and other legislation; the risk that Creganna Medical's operations will not be successfully
integrated into ours; and the risk that revenue opportunities, cost savings and other anticipated synergies from the Creganna Medical
acquisition may not be fully realized or may take longer to realize than expected. More detailed information about these and other factors is
set forth in TE Connectivity Ltd.’s Annual Report on Form 10-K for the fiscal year ended Sept. 25, 2015 as well as in our Quarterly Reports
on Form 10-Q, Current Reports on Form 8-K and other reports filed by us with the U.S. Securities and Exchange Commission.
Non-GAAP MeasuresWhere we have used non-GAAP financial measures, reconciliations to the most comparable GAAP measure are provided, along with a
disclosure on the usefulness of the non-GAAP measure, in this presentation.
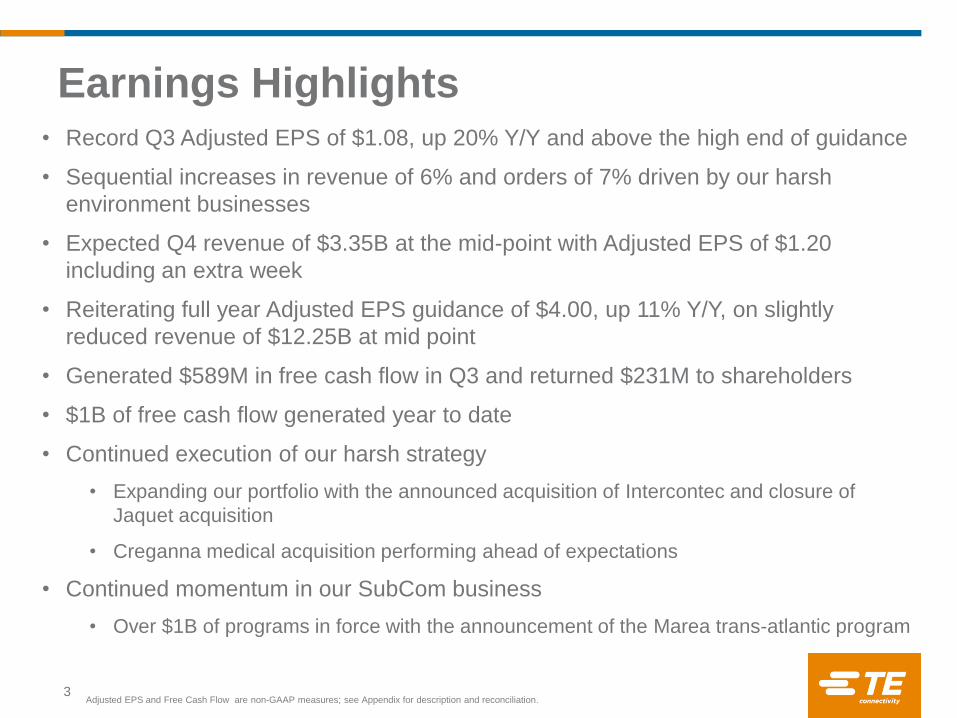
• Record Q3 Adjusted EPS of $1.08, up 20% Y/Y and above the high end of guidance
• Sequential increases in revenue of 6% and orders of 7% driven by our harsh
environment businesses
• Expected Q4 revenue of $3.35B at the mid-point with Adjusted EPS of $1.20
including an extra week
• Reiterating full year Adjusted EPS guidance of $4.00, up 11% Y/Y, on slightly
reduced revenue of $12.25B at mid point
• Generated $589M in free cash flow in Q3 and returned $231M to shareholders
• $1B of free cash flow generated year to date
• Continued execution of our harsh strategy
• Expanding our portfolio with the announced acquisition of Intercontec and closure of
Jaquet acquisition
• Creganna medical acquisition performing ahead of expectations
• Continued momentum in our SubCom business
• Over $1B of programs in force with the announcement of the Marea trans-atlantic program
Adjusted EPS and Free Cash Flow are non-GAAP measures; see Appendix for description and reconciliation.
Earnings Highlights
3
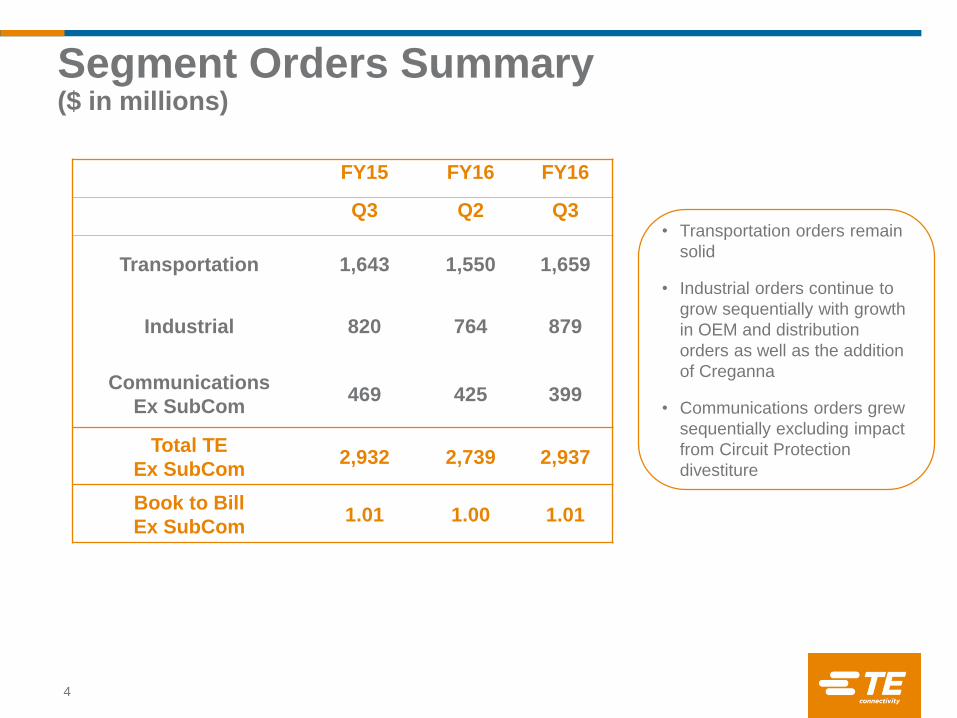
FY15 FY16 FY16
Q3 Q2 Q3
Transportation 1,643 1,550 1,659
Industrial 820 764 879
Communications
Ex SubCom469 425 399
Total TE
Ex SubCom2,932 2,739 2,937
Book to Bill
Ex SubCom1.01 1.00 1.01
Segment Orders Summary($ in millions)
4
• Transportation orders remain
solid
• Industrial orders continue to
grow sequentially with growth
in OEM and distribution
orders as well as the addition
of Creganna
• Communications orders grew
sequentially excluding impact
from Circuit Protection
divestiture
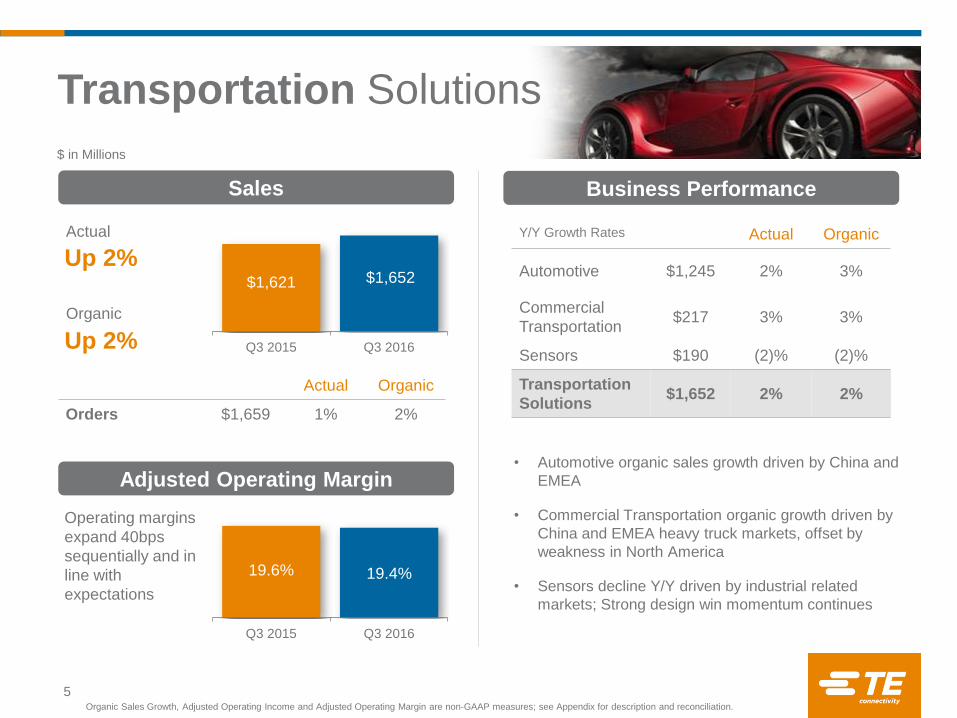
Y/Y Growth Rates Actual Organic
Automotive $1,245 2% 3%
Commercial
Transportation$217 3% 3%
Sensors $190 (2)% (2)%
Transportation
Solutions$1,652 2% 2%
$ in Millions
Sales
• Automotive organic sales growth driven by China and
EMEA
• Commercial Transportation organic growth driven by
China and EMEA heavy truck markets, offset by
weakness in North America
• Sensors decline Y/Y driven by industrial related
markets; Strong design win momentum continues
Business Performance
19.6% 19.4%
Q3 2015 Q3 2016
Actual
Up 2%
Organic
Up 2%
Actual Organic
Orders $1,659 1% 2%
Adjusted Operating Margin
Operating margins
expand 40bps
sequentially and in
line with
expectations
$1,621 $1,652
Q3 2015 Q3 2016
Organic Sales Growth, Adjusted Operating Income and Adjusted Operating Margin are non-GAAP measures; see Appendix for description and reconciliation.
Transportation Solutions
5
Y/Y Growth Rates Actual Organic
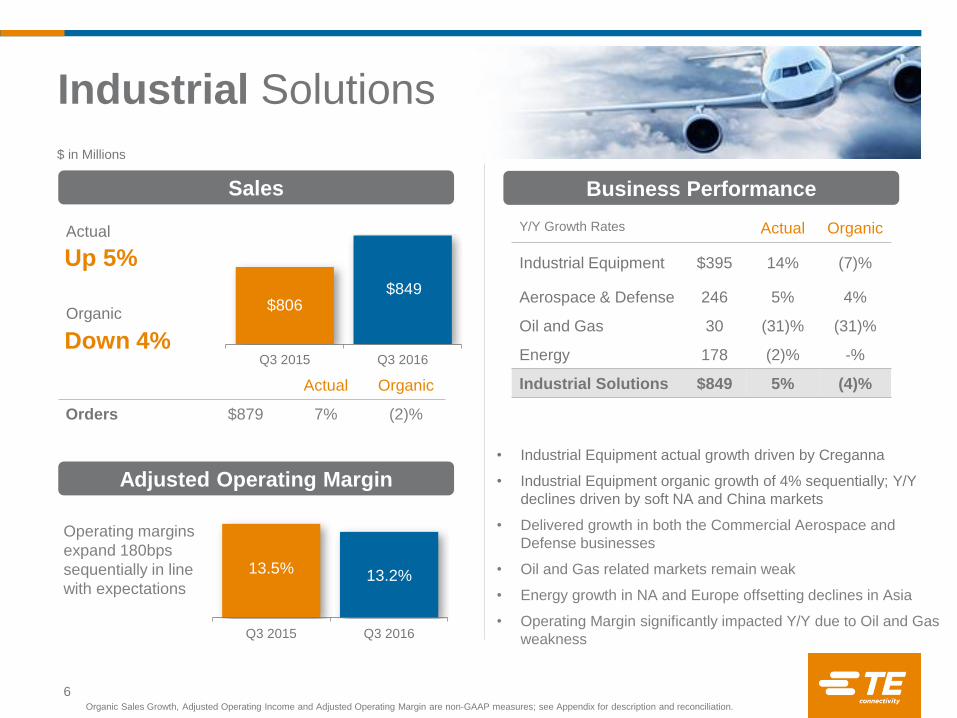
Industrial Equipment $395 14% (7)%
Aerospace & Defense 246 5% 4%
Oil and Gas 30 (31)% (31)%
Energy 178 (2)% -%
Industrial Solutions $849 5% (4)%
$ in Millions
Sales
• Industrial Equipment actual growth driven by Creganna
• Industrial Equipment organic growth of 4% sequentially; Y/Y
declines driven by soft NA and China markets
• Delivered growth in both the Commercial Aerospace and
Defense businesses
• Oil and Gas related markets remain weak
• Energy growth in NA and Europe offsetting declines in Asia
• Operating Margin significantly impacted Y/Y due to Oil and Gas
weakness
Business Performance
Actual
Up 5%
Organic
Down 4%
Adjusted Operating Margin
Industrial Solutions
6Organic Sales Growth, Adjusted Operating Income and Adjusted Operating Margin are non-GAAP measures; see Appendix for description and reconciliation.
Actual Organic
Orders $879 7% (2)%
$806 $849
Q3 2015 Q3 2016
13.5% 13.2%
Q3 2015 Q3 2016
Operating margins
expand 180bps
sequentially in line
with expectations
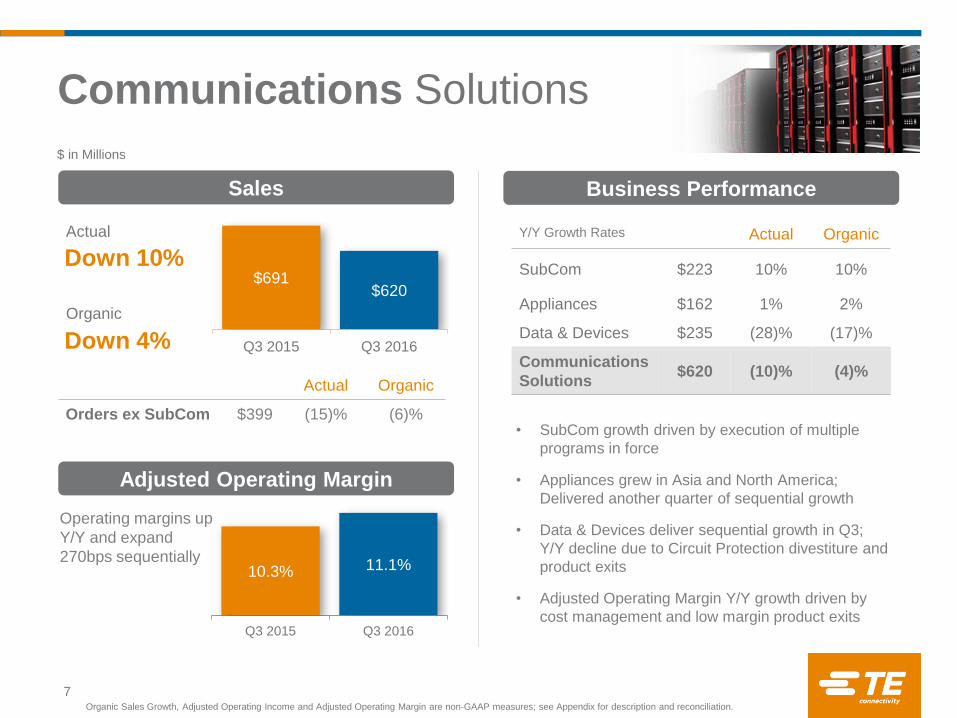
10.3% 11.1%
Q3 2015 Q3 2016
$691 $620
Q3 2015 Q3 2016
Y/Y Growth Rates Actual Organic
SubCom $223 10% 10%
Appliances $162 1% 2%
Data & Devices $235 (28)% (17)%
Communications
Solutions$620 (10)% (4)%
$ in Millions
Sales
• SubCom growth driven by execution of multiple
programs in force
• Appliances grew in Asia and North America;
Delivered another quarter of sequential growth
• Data & Devices deliver sequential growth in Q3;
Y/Y decline due to Circuit Protection divestiture and
product exits
• Adjusted Operating Margin Y/Y growth driven by
cost management and low margin product exits
Business Performance
Actual
Down 10%
Organic
Down 4%
Actual Organic
Orders ex SubCom $399 (15)% (6)%
Adjusted Operating Margin
Operating margins up
Y/Y and expand
270bps sequentially
7
Communications Solutions
Organic Sales Growth, Adjusted Operating Income and Adjusted Operating Margin are non-GAAP measures; see Appendix for description and reconciliation.
Adjusted Operating Income, Adjusted Operating Margin and Adjusted EPS are non-GAAP measures; see Appendix for description and reconciliation.
*Represents Diluted Earnings Per Share from Continuing Operations
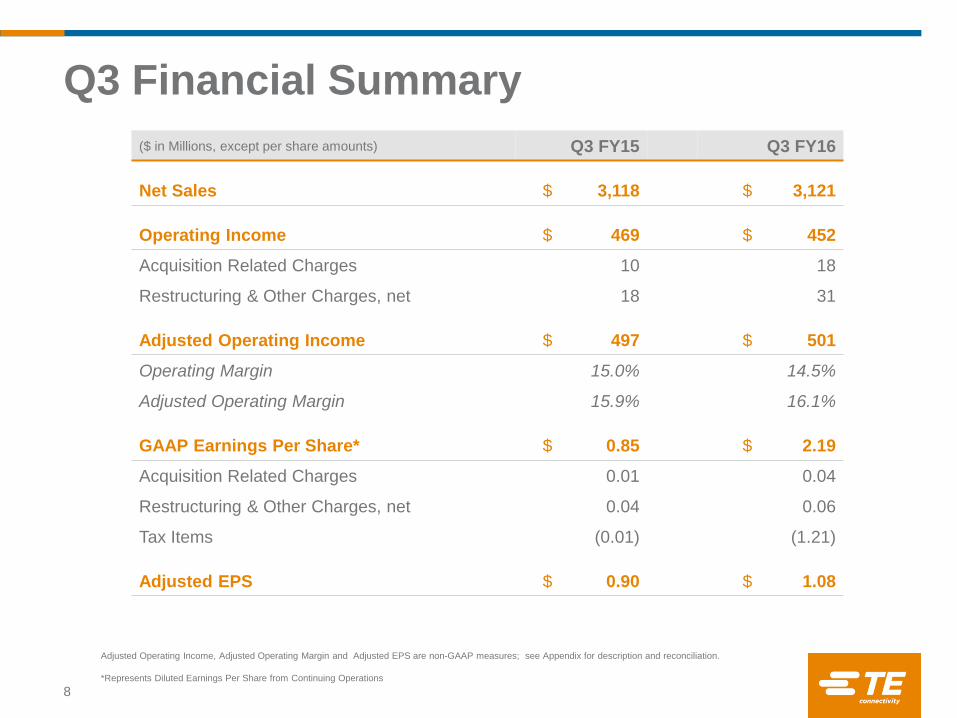
($ in Millions, except per share amounts) Q3 FY15 Q3 FY16
Net Sales $ 3,118 $ 3,121
Operating Income $ 469 $ 452
Acquisition Related Charges 10 18
Restructuring & Other Charges, net 18 31
Adjusted Operating Income $ 497 $ 501
Operating Margin 15.0% 14.5%
Adjusted Operating Margin 15.9% 16.1%
GAAP Earnings Per Share* $ 0.85 $ 2.19
Acquisition Related Charges 0.01 0.04
Restructuring & Other Charges, net 0.04 0.06
Tax Items (0.01) (1.21)
Adjusted EPS $ 0.90 $ 1.08
Q3 Financial Summary
8
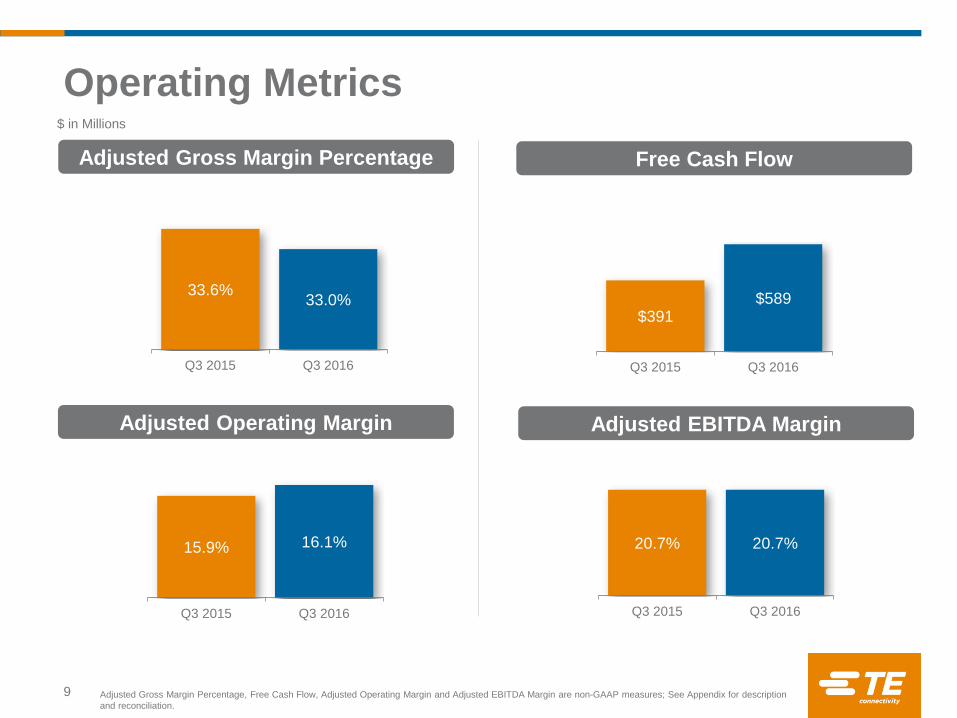
$ in Millions
Adjusted Gross Margin Percentage
Adjusted Operating Margin
Free Cash Flow
Adjusted Gross Margin Percentage, Free Cash Flow, Adjusted Operating Margin and Adjusted EBITDA Margin are non-GAAP measures; See Appendix for description
and reconciliation.
$391 $589
Q3 2015 Q3 2016
Operating Metrics
9
Adjusted EBITDA Margin
33.6%33.0%
Q3 2015 Q3 2016
15.9% 16.1%
Q3 2015 Q3 2016
20.7% 20.7%
Q3 2015 Q3 2016
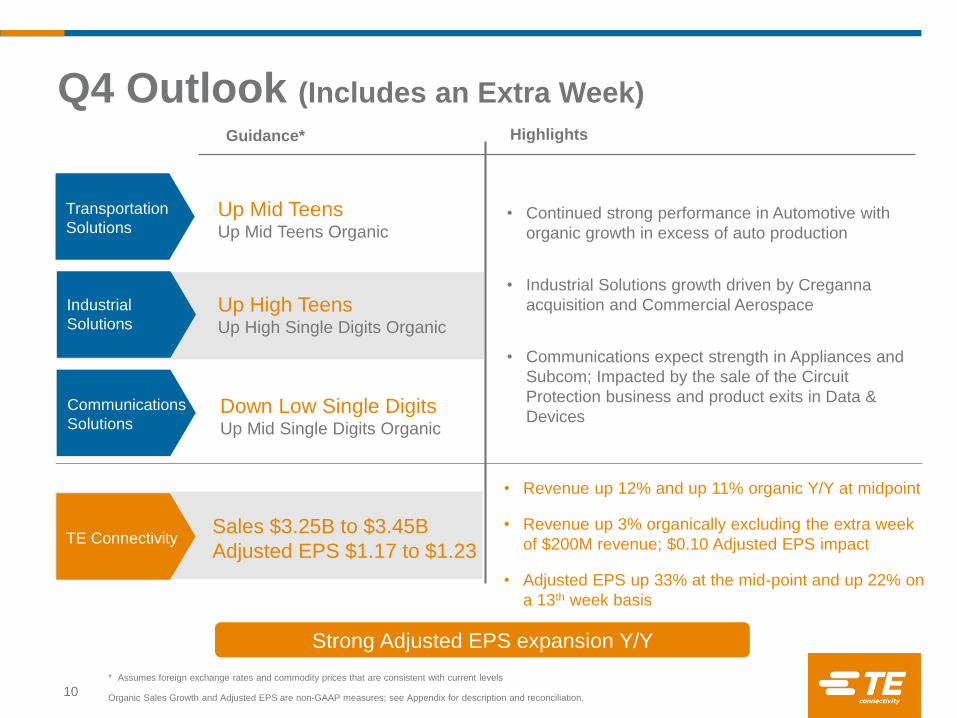
Guidance*
Strong Adjusted EPS expansion Y/Y
Transportation
Solutions
Industrial
Solutions
Communications
Solutions
TE Connectivity
Highlights
Sales $3.25B to $3.45B
Adjusted EPS $1.17 to $1.23
• Revenue up 12% and up 11% organic Y/Y at midpoint
• Revenue up 3% organically excluding the extra week
of $200M revenue; $0.10 Adjusted EPS impact
• Adjusted EPS up 33% at the mid-point and up 22% on
a 13th week basis
Up Mid TeensUp Mid Teens Organic
Down Low Single DigitsUp Mid Single Digits Organic
Up High TeensUp High Single Digits Organic
* Assumes foreign exchange rates and commodity prices that are consistent with current levels
Organic Sales Growth and Adjusted EPS are non-GAAP measures; see Appendix for description and reconciliation.
Q4 Outlook (Includes an Extra Week)
10
• Continued strong performance in Automotive with
organic growth in excess of auto production
• Industrial Solutions growth driven by Creganna
acquisition and Commercial Aerospace
• Communications expect strength in Appliances and
Subcom; Impacted by the sale of the Circuit
Protection business and product exits in Data &
Devices
Sales Up 2% Organically, with 11% Adjusted EPS Growth Y/Y
Sales of $12.15B - $12.35B
Adjusted EPS of $3.97 - $4.03
• Sales flat Y/Y and up 2% organically at midpoint
• FX headwind impacting sales by ~$250M Y/Y
• Adjusted EPS up 11% at midpoint, with ~$0.07 FX
headwind
• Includes a 53rd week of $200M revenue and $0.10
Adjusted EPS
Up Low Single DigitsUp Mid Single Digits Organic
Down High Single DigitsDown Low Single Digits Organic
Up Low Single DigitsDown Low Single Digits Organic
FY16 Outlook (Includes an Extra Week)
Guidance*
Transportation
Solutions
Industrial
Solutions
TE Connectivity
Highlights
11
Communications
Solutions
* Assumes foreign exchange rates and commodity prices that are consistent with current levels
Organic Sales Growth and Adjusted EPS are non-GAAP measures; see Appendix for description and reconciliation.
• Transportation remains strong with mid single digit
Automotive organic growth expected on 2 to 2.5%
global auto production growth
• Industrial growth driven by Creganna acquisition and
Commercial Aerospace; first half supply chain
corrections and overall weakness in markets drives Y/Y
organic decline
• Expect sequential growth in Data and Devices and
Appliances in the second half of FY16; full year
impacted by sale of Circuit Protection and product exits
• SubCom sales expected to be up ~20% Y/Y

Additional Information
12
Sales(in millions)
Adjusted
EPS
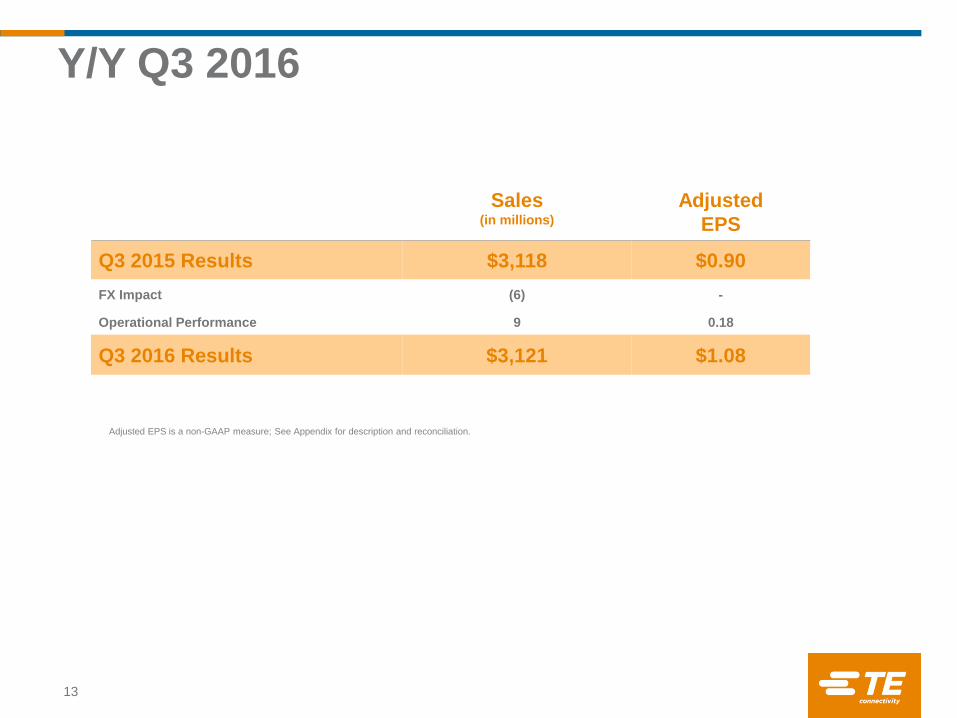
Q3 2015 Results $3,118 $0.90
FX Impact (6) -
Operational Performance 9 0.18
Q3 2016 Results $3,121 $1.08
Y/Y Q3 2016
13
Adjusted EPS is a non-GAAP measure; See Appendix for description and reconciliation.
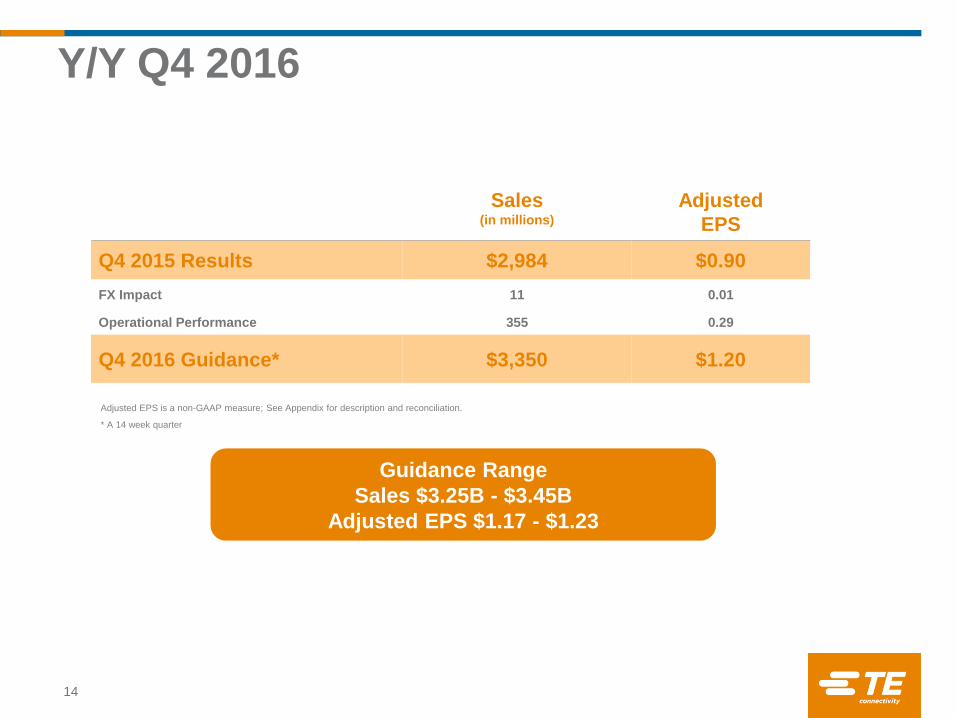
Y/Y Q4 2016
14
Sales(in millions)
Adjusted
EPS
Q4 2015 Results $2,984 $0.90
FX Impact 11 0.01
Operational Performance 355 0.29
Q4 2016 Guidance* $3,350 $1.20
Adjusted EPS is a non-GAAP measure; See Appendix for description and reconciliation.
* A 14 week quarter
Guidance Range
Sales $3.25B - $3.45B
Adjusted EPS $1.17 - $1.23
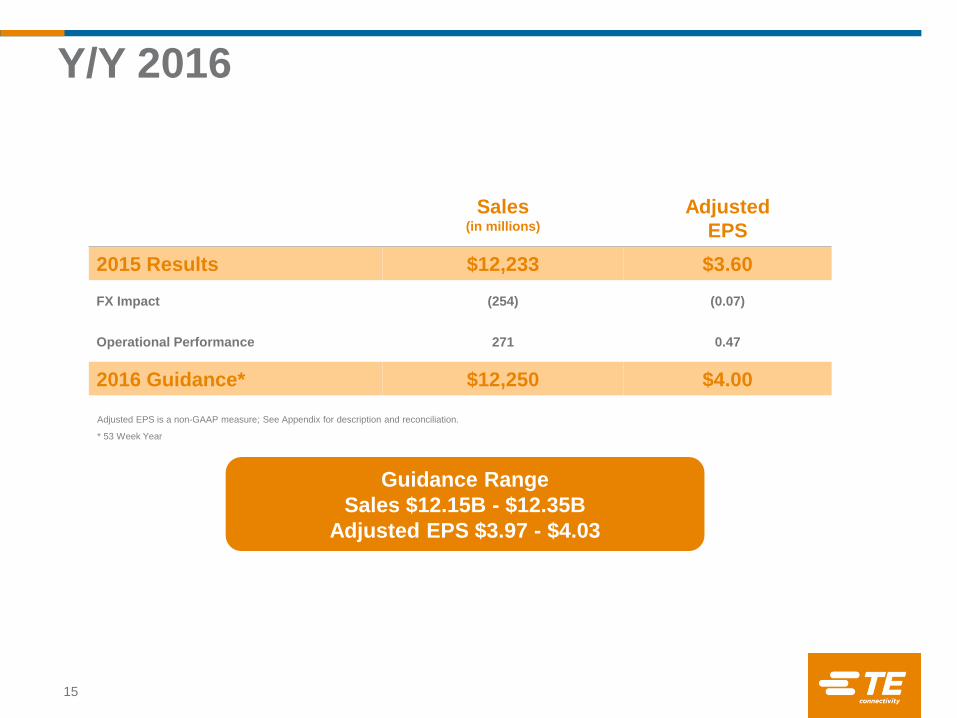
Y/Y 2016
15
Sales(in millions)
Adjusted
EPS
2015 Results $12,233 $3.60
FX Impact (254) (0.07)
Operational Performance 271 0.47
2016 Guidance* $12,250 $4.00
Adjusted EPS is a non-GAAP measure; See Appendix for description and reconciliation.
* 53 Week Year
Guidance Range
Sales $12.15B - $12.35B
Adjusted EPS $3.97 - $4.03
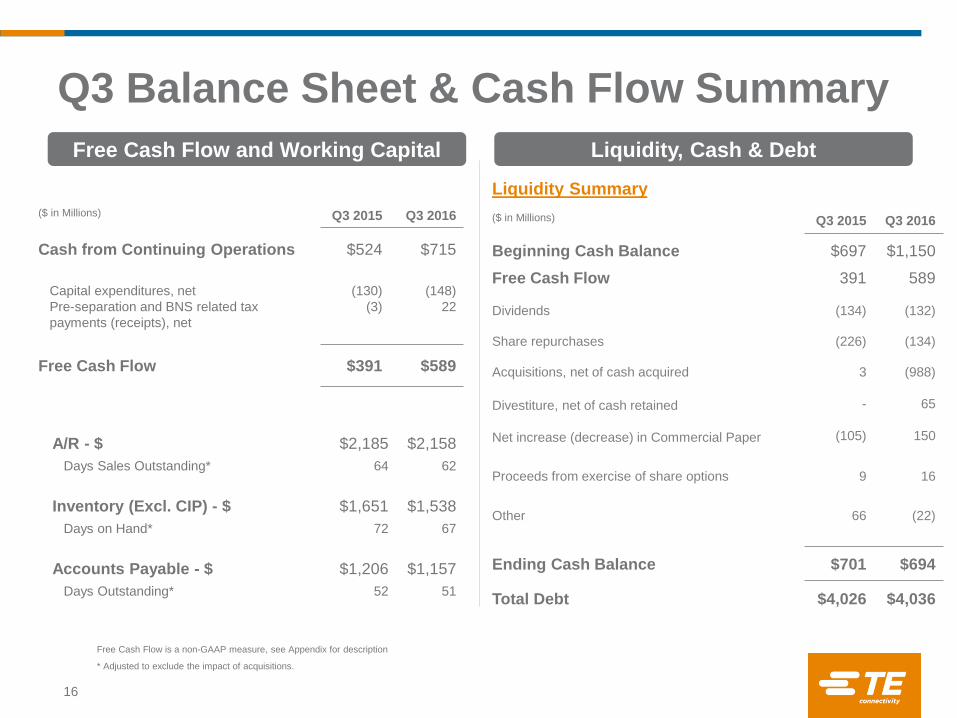
Liquidity Summary
($ in Millions) Q3 2015 Q3 2016
Beginning Cash Balance $697 $1,150
Free Cash Flow 391 589
Dividends (134) (132)
Share repurchases (226) (134)
Acquisitions, net of cash acquired 3 (988)
Divestiture, net of cash retained
Net increase (decrease) in Commercial Paper
-
(105)
65
150
Proceeds from exercise of share options 9 16
Other 66 (22)
Ending Cash Balance $701 $694
Total Debt $4,026 $4,036
($ in Millions) Q3 2015 Q3 2016
Cash from Continuing Operations $524 $715
Capital expenditures, net
Pre-separation and BNS related tax
payments (receipts), net
(130)
(3)
(148)
22
Free Cash Flow $391 $589
A/R - $ $2,185 $2,158
Days Sales Outstanding* 64 62
Inventory (Excl. CIP) - $ $1,651 $1,538
Days on Hand* 72 67
Accounts Payable - $ $1,206 $1,157
Days Outstanding* 52 51
Free Cash Flow is a non-GAAP measure, see Appendix for description
* Adjusted to exclude the impact of acquisitions.
Free Cash Flow and Working Capital Liquidity, Cash & Debt
Q3 Balance Sheet & Cash Flow Summary
16
Appendix
17
Non-GAAP Measures
“Organic Net Sales Growth,” “Net Sales Excluding the Impact of the Additional Week,” “Net Sales in Constant Currency,” “Adjusted Gross Margin,” “Adjusted Gross Margin Percentage,”
“Adjusted Operating Income,” “Adjusted Operating Income in Constant Currency,” “Adjusted Operating Margin,” “Adjusted Other Income, Net,” “Adjusted Income Tax Expense,” “Adjusted
Effective Tax Rate,” ”Adjusted Income from Continuing Operations,” “Adjusted Earnings Per Share,” “Adjusted Earnings Per Share Excluding the Impact of the Additional Week,” “Adjusted
Earnings Per Share in Constant Currency,” “Adjusted EBITDA,” “Adjusted EBITDA Margin,” and “Free Cash Flow” are non-GAAP measures and should not be considered replacements for
results in accordance with accounting principles generally accepted in the U.S. (“GAAP”). These non-GAAP measures may not be comparable to similarly-titled measures reported by other
companies. The primary limitation of these measures is that they exclude the financial impact of items that would otherwise either increase or decrease our reported results. This limitation is
best addressed by using these non-GAAP measures in combination with the most directly comparable GAAP measures in order to better understand the amounts, character and impact of any
increase or decrease in reported amounts. The following provides additional information regarding these non-GAAP measures:
Organic Net Sales Growth – is a useful measure of our underlying results and trends in the business. It is also a significant component in our incentive compensation plans. The difference
between reported net sales growth (the most comparable GAAP measure) and Organic Net Sales Growth consists of the impact from foreign currency exchange rates and acquisitions and
divestitures, if any. Organic Net Sales Growth is a useful measure of our performance because it excludes items that: i) are not completely under management’s control, such as the impact of
changes in foreign currency exchange rates; or ii) do not reflect the underlying growth of the company, such as acquisition and divestiture activity.
Net Sales Excluding the Impact of the Additional Week – represents net sales (the most comparable GAAP measure) excluding the impact of the additional week in fiscal 2016. We believe
Net Sales Excluding the Impact of the Additional Week is a useful measure for investors because it provides insight into our underlying operating results, trends, and the comparability of these
results between periods.
Net Sales in Constant Currency – represents net sales (the most comparable GAAP measure) excluding the impact of fluctuations in foreign currency exchange rates between periods. We
believe constant currency information provides valuable supplemental information regarding our sales.
Adjusted Gross Margin and Adjusted Gross Margin Percentage – represent gross margin and gross margin percentage (the most comparable GAAP measures) before special items including
acquisition related charges, if any. We present Adjusted Gross Margin and Adjusted Gross Margin Percentage before special items to give investors a perspective on the underlying business
results. These measures should be considered in conjunction with gross margin calculated using our GAAP results in order to understand the amounts, character and impact of adjustments to
gross margin.
Adjusted Operating Income – represents operating income (the most comparable GAAP measure) before special items including charges or income related to restructuring and other charges,
acquisition related charges, impairment charges, and other income or charges, if any. We utilize Adjusted Operating Income to assess segment level core operating performance and to
provide insight to management in evaluating segment operating plan execution and underlying market conditions. It also is a significant component in our incentive compensation plans.
Adjusted Operating Income is a useful measure for investors because it provides insight into our underlying operating results, trends, and the comparability of these results between periods.
Adjusted Operating Income in Constant Currency – represents Adjusted Operating Income excluding the impact of fluctuations in foreign currency exchange rates between periods. We
believe constant currency information provides valuable supplemental information regarding our operating income.
Adjusted Operating Margin – represents operating margin (the most comparable GAAP measure) before special items including charges or income related to restructuring and other charges,
acquisition related charges, impairment charges, and other income or charges, if any. We present Adjusted Operating Margin before special items to give investors a perspective on the
underlying business results. This measure should be considered in conjunction with operating margin calculated using our GAAP results in order to understand the amounts, character and
impact of adjustments to operating margin.
Adjusted Other Income, Net – represents other income, net (the most comparable GAAP measure) before special items including tax sharing income related to certain proposed adjustments
to prior period tax returns and other tax items, if any. We present Adjusted Other Income, Net as we believe that it is appropriate for investors to consider results excluding these items in
addition to results in accordance with GAAP.
18
Non-GAAP Measures (cont.)
19
Adjusted Income Tax Expense – represents income tax expense (the most comparable GAAP measure) after adjusting for the tax effect of special items including charges related to restructuring and
other charges, acquisition related charges, impairment charges, other income or charges, and certain significant special tax items, if any. We present Adjusted Income Tax Expense to provide
investors further information regarding the tax effects of adjustments used in determining the non-GAAP financial measure Adjusted Income from Continuing Operations (as defined below).
Adjusted Effective Tax Rate – represents effective income tax rate (the most comparable GAAP measure) after adjusting for the tax effect of special items including charges related to restructuring
and other charges, acquisition related charges, impairment charges, other income or charges, and certain significant special tax items, if any. We present Adjusted Effective Tax Rate to provide
investors further information regarding the tax rate effects of adjustments used in determining the non-GAAP financial measure Adjusted Income from Continuing Operations (as defined below).
Adjusted Income from Continuing Operations – represents income from continuing operations (the most comparable GAAP measure) before special items including charges or income related to
restructuring and other charges, acquisition related charges, impairment charges, tax sharing income related to certain proposed adjustments to prior period tax returns and other tax items, certain
significant special tax items, other income or charges, if any, and, if applicable, the related tax effects. We present Adjusted Income from Continuing Operations as we believe that it is appropriate for
investors to consider results excluding these items in addition to results in accordance with GAAP. Adjusted Income from Continuing Operations provides additional information regarding our
underlying operating results, trends and the comparability of these results between periods.
Adjusted Earnings Per Share – represents diluted earnings per share from continuing operations (the most comparable GAAP measure) before special items, including charges or income related to
restructuring and other charges, acquisition related charges, impairment charges, tax sharing income related to certain proposed adjustments to prior period tax returns and other tax items, certain
significant special tax items, other income or charges, if any, and, if applicable, the related tax effects. We present Adjusted Earnings Per Share because we believe that it is appropriate for investors
to consider results excluding these items in addition to results in accordance with GAAP. We believe such a measure provides insight into our underlying operating results, trends, and the
comparability of these results between periods, since it excludes the impact of special items, which may recur, but tend to be irregular as to timing. It also is a significant component in our incentive
compensation plans.
Adjusted Earnings Per Share Excluding the Impact of the Additional Week – represents Adjusted Earnings Per Share excluding the impact of the additional week in fiscal 2016. We believe Adjusted
Earnings Per Share Excluding the Impact of the Additional Week is a useful measure for investors because it provides insight into our underlying operating results, trends, and the comparability of
these results between periods.
Adjusted Earnings Per Share in Constant Currency – represents Adjusted Earnings Per Share excluding the impact of fluctuations in foreign currency exchange rates between periods. We believe
constant currency information provides valuable supplemental information regarding our earnings per share.
Adjusted EBITDA and Adjusted EBITDA Margin -represent net income and net income as a percentage of net sales (the most comparable GAAP measures) before interest expense, interest income,
income taxes, depreciation, and amortization, as adjusted for net other income, income from discontinued operations, and special items including charges or income related to restructuring and other
charges, acquisition related charges, impairment charges, and other income or charges, if any. We present Adjusted EBITDA and Adjusted EBITDA Margin to give investors a perspective in
assessing our operating performance, trends, and the comparability of our results between periods.
Free Cash Flow (FCF) –is a useful measure of our ability to generate cash. The difference between net cash provided by continuing operating activities (the most comparable GAAP measure) and
Free Cash Flow consists mainly of significant cash outflows and inflows that we believe are useful to identify. We believe Free Cash Flow provides useful information to investors as it provides insight
into the primary cash flow metric used by management to monitor and evaluate cash flows generated from our operations.
Free Cash Flow is defined as net cash provided by continuing operating activities excluding voluntary pension contributions and the cash impact of special items, if any, minus net capital
expenditures. Voluntary pension contributions are excluded from the GAAP measure because this activity is driven by economic financing decisions rather than operating activity. Certain special
items, including net payments related to pre-separation tax matters, are also excluded by management in evaluating Free Cash Flow. Net capital expenditures consist of capital expenditures less
proceeds from the sale of property, plant, and equipment. These items are subtracted because they represent long-term commitments.
In the calculation of Free Cash Flow, we subtract certain cash items that are ultimately within management’s and the Board of Directors’ discretion to direct and may imply that there is less or more
cash available for our programs than the most comparable GAAP measure indicates. It should not be inferred that the entire Free Cash Flow amount is available for future discretionary expenditures,
as our definition of Free Cash Flow does not consider certain non-discretionary expenditures, such as debt payments. In addition, we may have other discretionary expenditures, such as
discretionary dividends, share repurchases, and business acquisitions, that are not considered in the calculation of Free Cash Flow.
20
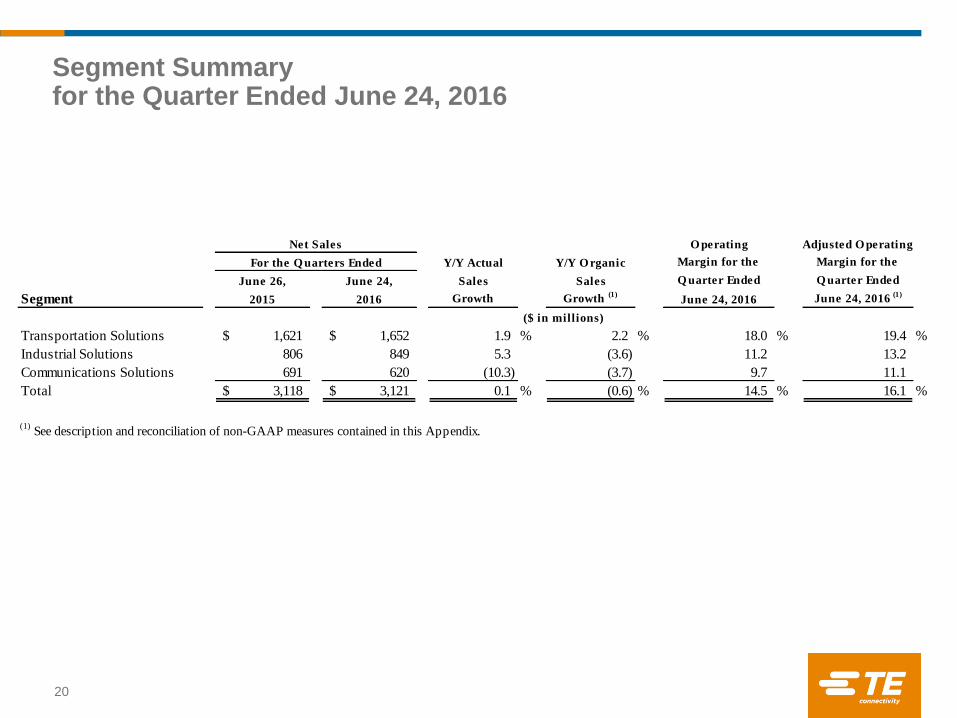
Segment Summary for the Quarter Ended June 24, 2016
Operating Adjusted Operating
Y/Y Actual Y/Y Organic Margin for the Margin for the
June 26, June 24, Sales Sales Quarter Ended Quarter Ended
Segment 2015 2016 Growth Growth (1)
June 24, 2016 June 24, 2016 (1)
Transportation Solutions 1,621$ 1,652$ 1.9 % 2.2 % 18.0 % 19.4 %
Industrial Solutions 806 849 5.3 (3.6) 11.2 13.2
Communications Solutions 691 620 (10.3) (3.7) 9.7 11.1
Total 3,118$ 3,121$ 0.1 % (0.6) % 14.5 % 16.1 %
(1) See description and reconciliation of non-GAAP measures contained in this Appendix.
For the Q uarters Ended
Net Sales
($ in millions)
21
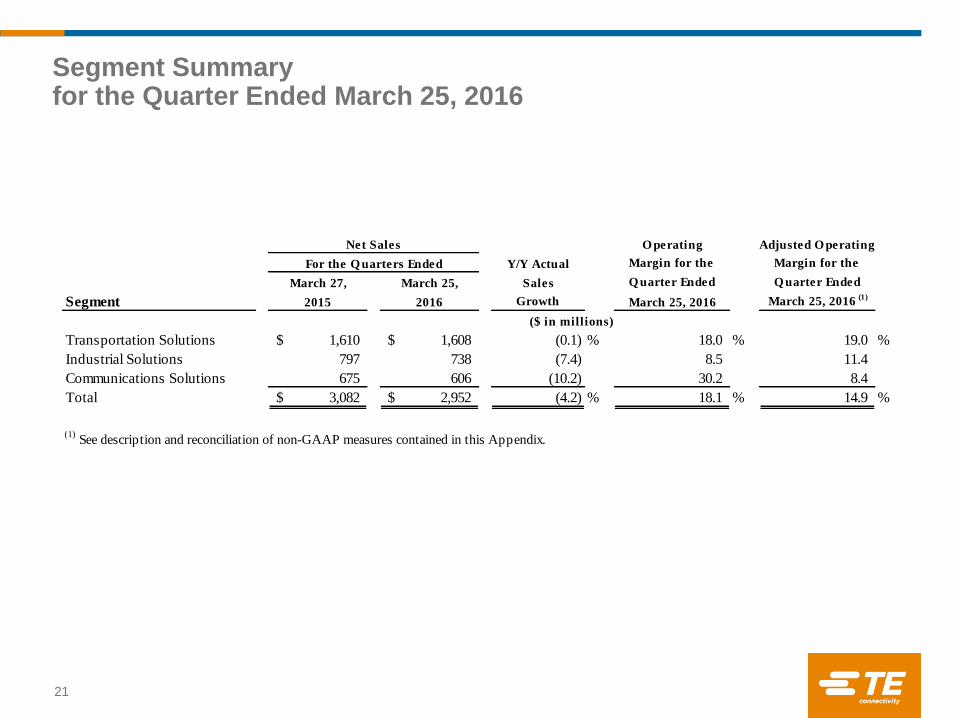
Segment Summary for the Quarter Ended March 25, 2016
Operating Adjusted Operating
Y/Y Actual Margin for the Margin for the
March 27, March 25, Sales Q uarter Ended Quarter Ended
Segment 2015 2016 Growth March 25, 2016 March 25, 2016 (1)
Transportation Solutions 1,610$ 1,608$ (0.1) % 18.0 % 19.0 %
Industrial Solutions 797 738 (7.4) 8.5 11.4
Communications Solutions 675 606 (10.2) 30.2 8.4
Total 3,082$ 2,952$ (4.2) % 18.1 % 14.9 %
(1) See description and reconciliation of non-GAAP measures contained in this Appendix.
For the Quarters Ended
Net Sales
($ in millions)
Reconciliation of Net Sales Growth– Q3 16 vs. Q3 15
22
Acquisitions
Translation (2)
(Divestiture)
Transportation Solutions (3)
:
Automotive 33$ 2.7 % (5)$ -$ 28$ 2.3 % 75 %
Commercial Transportation 7 3.3 - - 7 3.3 13
Sensors (4) (2.1) (2) 2 (4) (2.1) 12
Total 36 2.2 (7) 2 31 1.9 100 %
Industrial Solutions (3)
:
Aerospace, Defense, Oil, and Gas:
Aerospace and Defense 9 3.6 1 1 11 4.5 29
Oil and Gas (14) (31.1) - - (14) (31.1) 3
Aerospace, Defense, Oil, and Gas total (5) (1.9) 1 1 (3) (1.1) 32
Industrial Equipment (24) (6.8) 4 70 50 14.5 47
Energy - (0.2) (4) - (4) (2.2) 21
Total (29) (3.6) 1 71 43 5.3 100 %
Communications Solutions (3)
:
Data and Devices (50) (16.7) 2 (45) (93) (28.4) 38
Subsea Communications 21 10.4 - - 21 10.4 36
Appliances 3 1.6 (2) - 1 0.6 26
Total (26) (3.7) - (45) (71) (10.3) 100 %
Total (19)$ (0.6) % (6)$ 28$ 3$ 0.1 %
(1) Represents the change in net sales resulting from volume and price changes, before consideration of acquisitions, divestitures, and the impact of changes in foreign currency
exchange rates. Organic net sales growth is a non-GAAP measure. See description of non-GAAP measures contained in this Appendix.
(2) Represents the change in net sales resulting from changes in foreign currency exchange rates.
(3) Industry end market information about net sales is presented consistently with our internal management reporting and may be periodically revised as management deems
necessary.
Percentage of
Segment's Total
Q uarter Ended
versus Net Sales for the Q uarter Ended June 26, 2015 Net Sales for the
O rganic (1)
Total June 24, 2016
($ in millions)
Change in Net Sales for the Q uarter Ended June 24, 2016
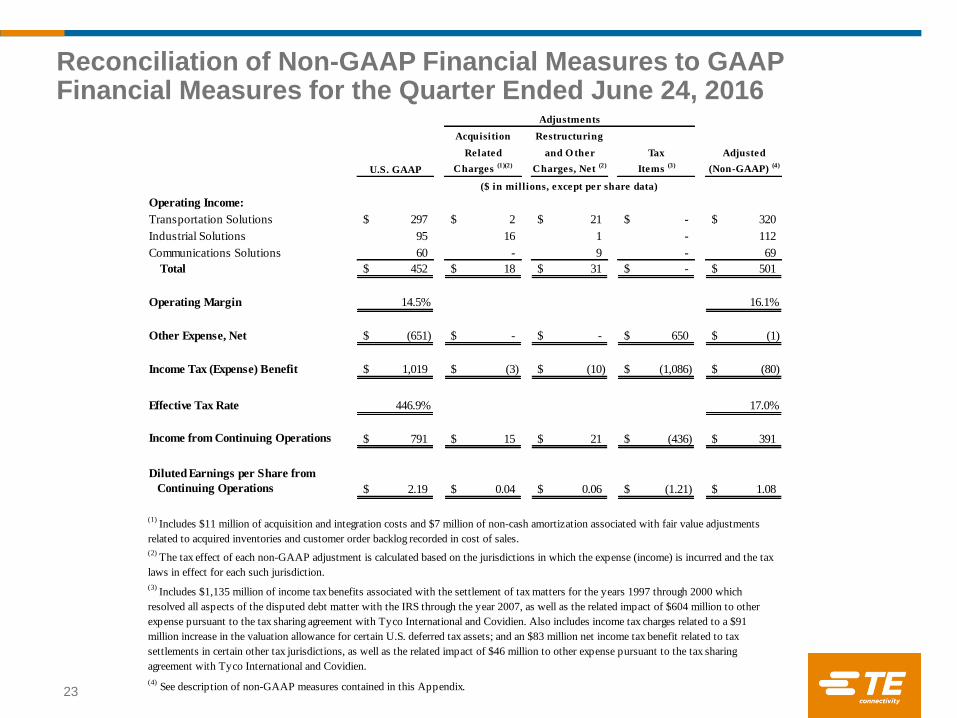
Reconciliation of Non-GAAP Financial Measures to GAAP Financial Measures for the Quarter Ended June 24, 2016
23
Acquisition Restructuring
Related and O ther Tax Adjusted
U.S. GAAP Charges (1)(2)
Charges, Net (2)
Items (3)
(Non-GAAP) (4)
Operating Income:
Transportation Solutions 297$ 2$ 21$ -$ 320$
Industrial Solutions 95 16 1 - 112
Communications Solutions 60 - 9 - 69
Total 452$ 18$ 31$ -$ 501$
Operating Margin 14.5% 16.1%
Other Expense, Net (651)$ -$ -$ 650$ (1)$
Income Tax (Expense) Benefit 1,019$ (3)$ (10)$ (1,086)$ (80)$
Effective Tax Rate 446.9% 17.0%
Income from Continuing Operations 791$ 15$ 21$ (436)$ 391$
Diluted Earnings per Share from
Continuing Operations 2.19$ 0.04$ 0.06$ (1.21)$ 1.08$
($ in millions, except per share data)
Adjustments
(4) See description of non-GAAP measures contained in this Appendix.
(3) Includes $1,135 million of income tax benefits associated with the settlement of tax matters for the years 1997 through 2000 which
resolved all aspects of the disputed debt matter with the IRS through the year 2007, as well as the related impact of $604 million to other
expense pursuant to the tax sharing agreement with Tyco International and Covidien. Also includes income tax charges related to a $91
million increase in the valuation allowance for certain U.S. deferred tax assets; and an $83 million net income tax benefit related to tax
settlements in certain other tax jurisdictions, as well as the related impact of $46 million to other expense pursuant to the tax sharing
agreement with Tyco International and Covidien.
(1) Includes $11 million of acquisition and integration costs and $7 million of non-cash amortization associated with fair value adjustments
related to acquired inventories and customer order backlog recorded in cost of sales.
(2) The tax effect of each non-GAAP adjustment is calculated based on the jurisdictions in which the expense (income) is incurred and the tax
laws in effect for each such jurisdiction.
Reconciliation of Non-GAAP Financial Measures to GAAP Financial Measures for the Quarter Ended March 25, 2016
24
Restructuring
Acquisition and O ther
Related Charges Tax Adjusted
U.S. GAAP Charges (1)
(Credits), Net (1)(2)
Items (Non-GAAP) (3)
Operating Income:
Transportation Solutions 289$ 1$ 15$ -$ 305$
Industrial Solutions 63 3 18 - 84
Communications Solutions 183 - (132) - 51
Total 535$ 4$ (99)$ -$ 440$
Operating Margin 18.1% 14.9%
Other Income, Net 12$ -$ -$ -$ 12$
Income Tax Expense (130)$ (1)$ 35$ 3$ (93)$
Effective Tax Rate 25.0% 21.9%
Income from Continuing Operations 389$ 3$ (64)$ 3$ 331$
Diluted Earnings per Share from
Continuing Operations 1.06$ 0.01$ (0.17)$ 0.01$ 0.90$
(3) See description of non-GAAP measures contained in this Appendix.
(1) The tax effect of each non-GAAP adjustment is calculated based on the jurisdictions in which the expense (income) is incurred and the tax
laws in effect for each such jurisdiction.
(2) Includes the gain on the divestiture of our Circuit Protection Devices business.
($ in millions, except per share data)
Adjustments
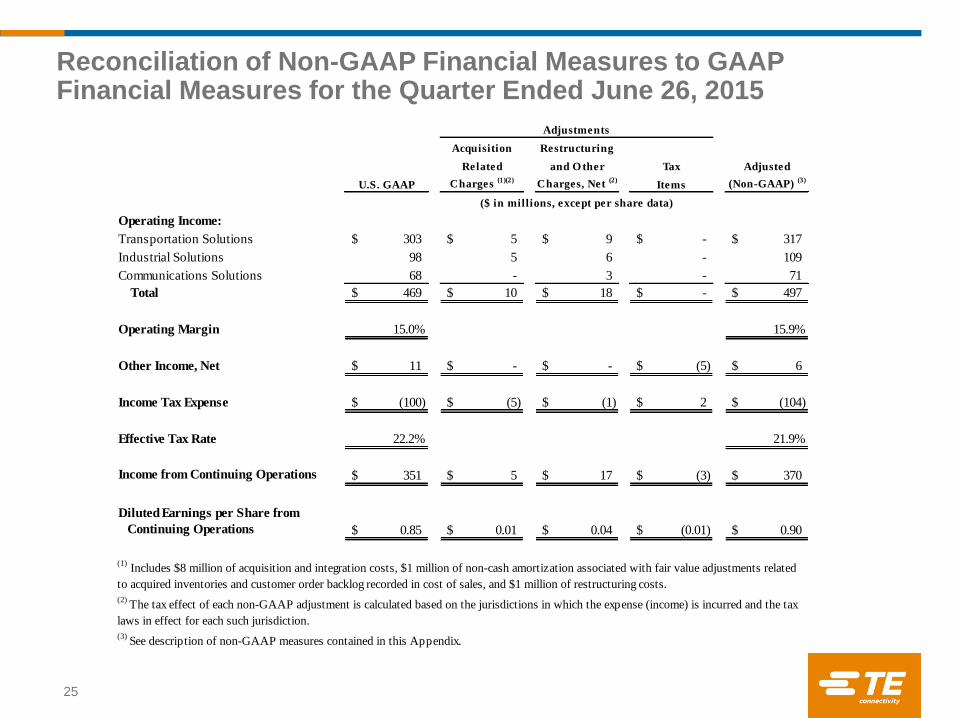
Reconciliation of Non-GAAP Financial Measures to GAAP Financial Measures for the Quarter Ended June 26, 2015
25
Acquisition Restructuring
Related and O ther Tax Adjusted
U.S. GAAP Charges (1)(2)
Charges, Net (2)
Items (Non-GAAP) (3)
Operating Income:
Transportation Solutions 303$ 5$ 9$ -$ 317$
Industrial Solutions 98 5 6 - 109
Communications Solutions 68 - 3 - 71
Total 469$ 10$ 18$ -$ 497$
Operating Margin 15.0% 15.9%
Other Income, Net 11$ -$ -$ (5)$ 6$
Income Tax Expense (100)$ (5)$ (1)$ 2$ (104)$
Effective Tax Rate 22.2% 21.9%
Income from Continuing Operations 351$ 5$ 17$ (3)$ 370$
Diluted Earnings per Share from
Continuing Operations 0.85$ 0.01$ 0.04$ (0.01)$ 0.90$
(1) Includes $8 million of acquisition and integration costs, $1 million of non-cash amortization associated with fair value adjustments related
to acquired inventories and customer order backlog recorded in cost of sales, and $1 million of restructuring costs.
(2) The tax effect of each non-GAAP adjustment is calculated based on the jurisdictions in which the expense (income) is incurred and the tax
laws in effect for each such jurisdiction.
(3) See description of non-GAAP measures contained in this Appendix.
Adjustments
($ in millions, except per share data)
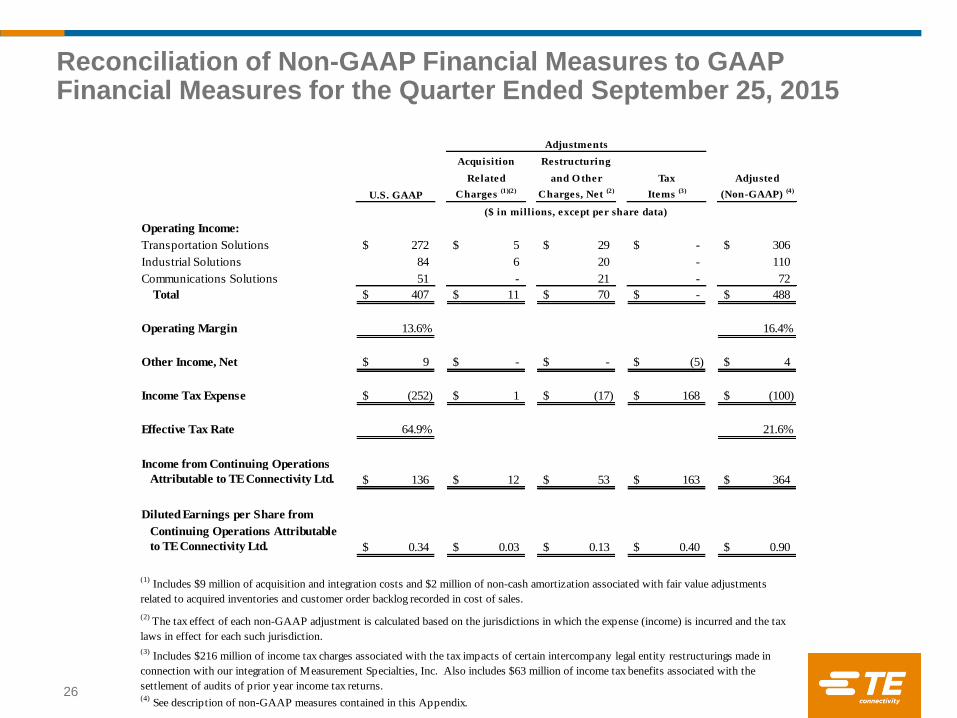
Reconciliation of Non-GAAP Financial Measures to GAAP Financial Measures for the Quarter Ended September 25, 2015
26
Acquisition Restructuring
Related and O ther Tax Adjusted
U.S. GAAP Charges (1)(2)
Charges, Net (2)
Items (3)
(Non-GAAP) (4)
Operating Income:
Transportation Solutions 272$ 5$ 29$ -$ 306$
Industrial Solutions 84 6 20 - 110
Communications Solutions 51 - 21 - 72
Total 407$ 11$ 70$ -$ 488$
Operating Margin 13.6% 16.4%
Other Income, Net 9$ -$ -$ (5)$ 4$
Income Tax Expense (252)$ 1$ (17)$ 168$ (100)$
Effective Tax Rate 64.9% 21.6%
Income from Continuing Operations
Attributable to TE Connectivity Ltd. 136$ 12$ 53$ 163$ 364$
Diluted Earnings per Share from
Continuing Operations Attributable
to TE Connectivity Ltd. 0.34$ 0.03$ 0.13$ 0.40$ 0.90$
(1) Includes $9 million of acquisition and integration costs and $2 million of non-cash amortization associated with fair value adjustments
related to acquired inventories and customer order backlog recorded in cost of sales.
(2) The tax effect of each non-GAAP adjustment is calculated based on the jurisdictions in which the expense (income) is incurred and the tax
laws in effect for each such jurisdiction.
(3) Includes $216 million of income tax charges associated with the tax impacts of certain intercompany legal entity restructurings made in
connection with our integration of Measurement Specialties, Inc. Also includes $63 million of income tax benefits associated with the
settlement of audits of prior year income tax returns.(4)
See description of non-GAAP measures contained in this Appendix.
Adjustments
($ in millions, except per share data)
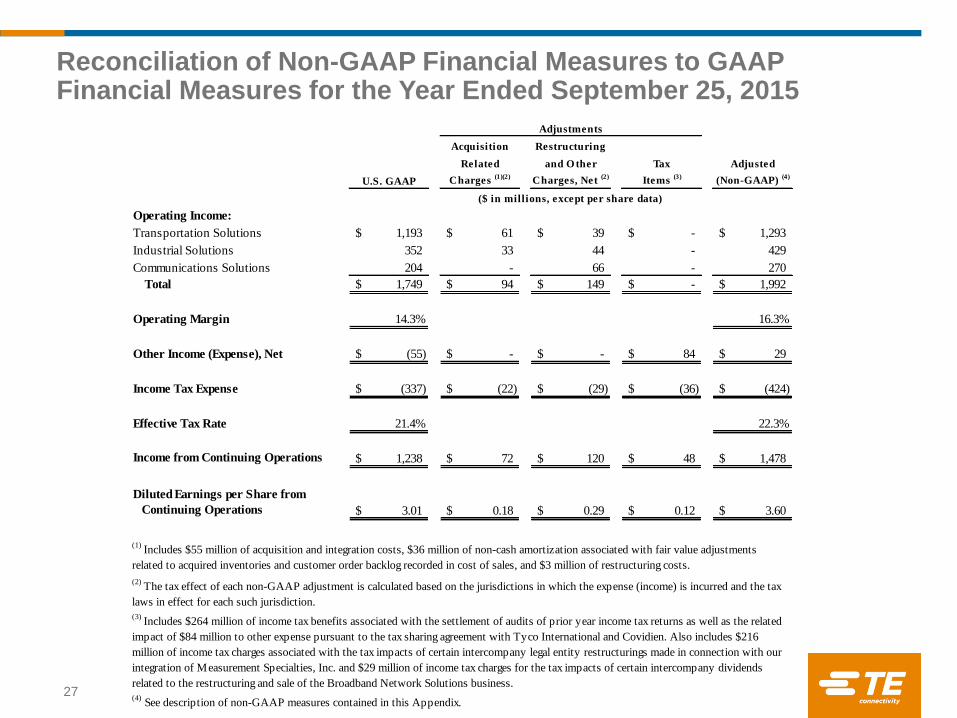
Reconciliation of Non-GAAP Financial Measures to GAAP Financial Measures for the Year Ended September 25, 2015
27
Acquisition Restructuring
Related and O ther Tax Adjusted
U.S. GAAP Charges (1)(2)
Charges, Net (2)
Items (3)
(Non-GAAP) (4)
Operating Income:
Transportation Solutions 1,193$ 61$ 39$ -$ 1,293$
Industrial Solutions 352 33 44 - 429
Communications Solutions 204 - 66 - 270
Total 1,749$ 94$ 149$ -$ 1,992$
Operating Margin 14.3% 16.3%
Other Income (Expense), Net (55)$ -$ -$ 84$ 29$
Income Tax Expense (337)$ (22)$ (29)$ (36)$ (424)$
Effective Tax Rate 21.4% 22.3%
Income from Continuing Operations 1,238$ 72$ 120$ 48$ 1,478$
Diluted Earnings per Share from
Continuing Operations 3.01$ 0.18$ 0.29$ 0.12$ 3.60$
(4) See description of non-GAAP measures contained in this Appendix.
(3) Includes $264 million of income tax benefits associated with the settlement of audits of prior year income tax returns as well as the related
impact of $84 million to other expense pursuant to the tax sharing agreement with Tyco International and Covidien. Also includes $216
million of income tax charges associated with the tax impacts of certain intercompany legal entity restructurings made in connection with our
integration of Measurement Specialties, Inc. and $29 million of income tax charges for the tax impacts of certain intercompany dividends
related to the restructuring and sale of the Broadband Network Solutions business.
($ in millions, except per share data)
(1) Includes $55 million of acquisition and integration costs, $36 million of non-cash amortization associated with fair value adjustments
related to acquired inventories and customer order backlog recorded in cost of sales, and $3 million of restructuring costs.
Adjustments
(2) The tax effect of each non-GAAP adjustment is calculated based on the jurisdictions in which the expense (income) is incurred and the tax
laws in effect for each such jurisdiction.
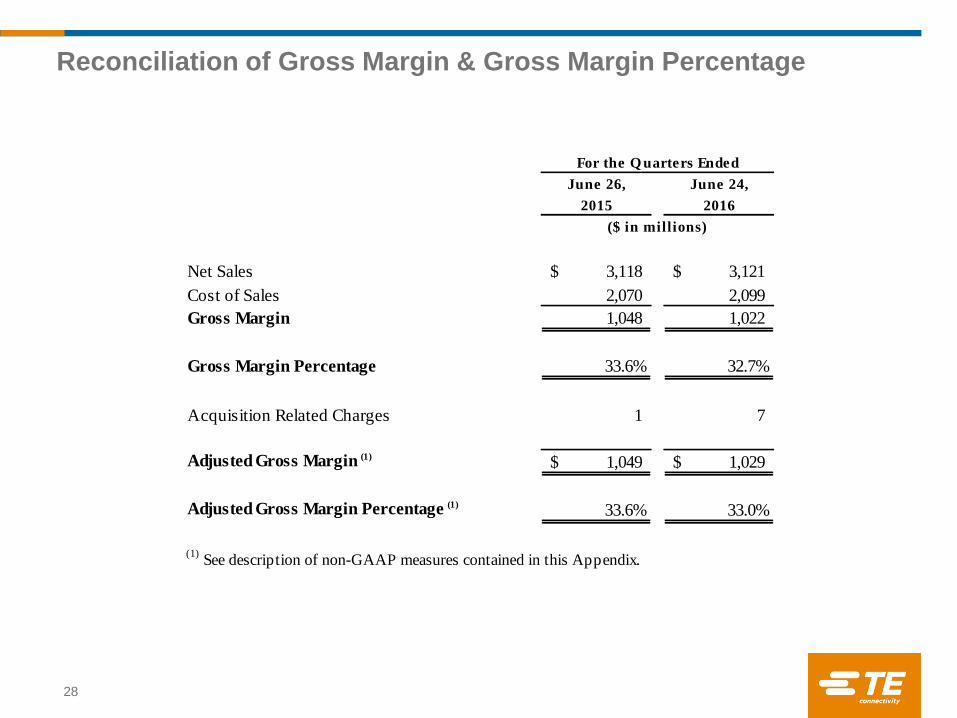
Reconciliation of Gross Margin & Gross Margin Percentage
28
June 26, June 24,
2015 2016
Net Sales 3,118$ 3,121$
Cost of Sales 2,070 2,099
Gross Margin 1,048 1,022
Gross Margin Percentage 33.6% 32.7%
Acquisition Related Charges 1 7
Adjusted Gross Margin (1)
1,049$ 1,029$
Adjusted Gross Margin Percentage (1)
33.6% 33.0%
(1) See description of non-GAAP measures contained in this Appendix.
For the Q uarters Ended
($ in millions)
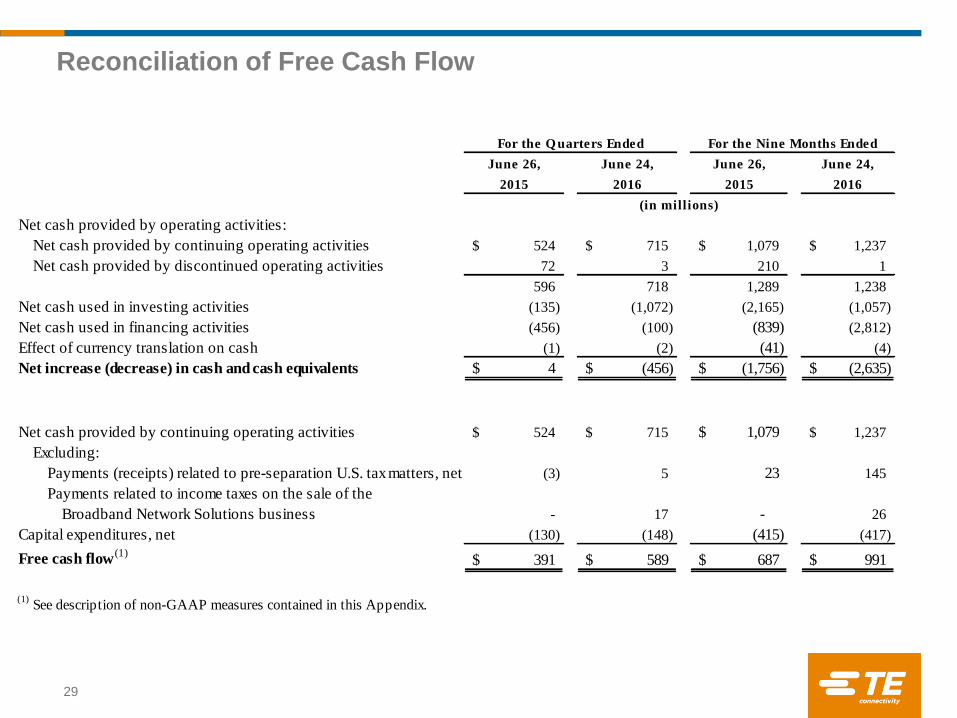
Reconciliation of Free Cash Flow
29
June 26, June 24, June 26, June 24,
2015 2016 2015 2016
Net cash provided by operating activities:
Net cash provided by continuing operating activities 524$ 715$ 1,079$ 1,237$
Net cash provided by discontinued operating activities 72 3 210 1
596 718 1,289 1,238
Net cash used in investing activities (135) (1,072) (2,165) (1,057)
Net cash used in financing activities (456) (100) (839) (2,812)
Effect of currency translation on cash (1) (2) (41) (4)
Net increase (decrease) in cash and cash equivalents 4$ (456)$ (1,756)$ (2,635)$
Net cash provided by continuing operating activities 524$ 715$ 1,079$ 1,237$
Excluding:
Payments (receipts) related to pre-separation U.S. tax matters, net (3) 5 23 145
Payments related to income taxes on the sale of the
Broadband Network Solutions business - 17 - 26
Capital expenditures, net (130) (148) (415) (417)
Free cash flow (1)
391$ 589$ 687$ 991$
(1) See description of non-GAAP measures contained in this Appendix.
For the Q uarters Ended For the Nine Months Ended
(in millions)
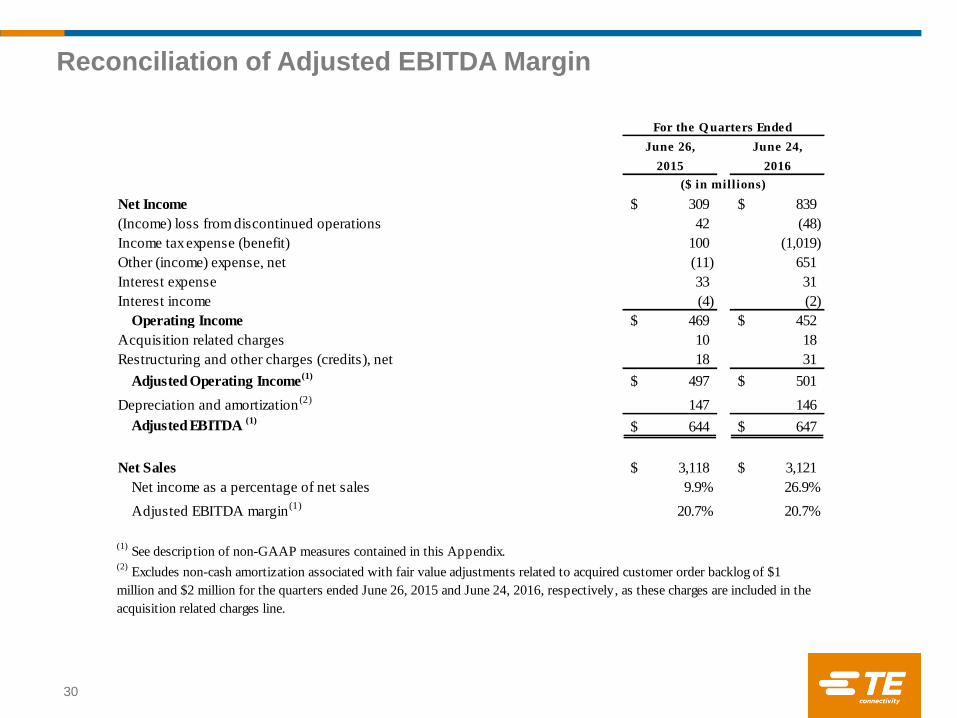
Reconciliation of Adjusted EBITDA Margin
30
June 26, June 24,
2015 2016
Net Income 309$ 839$
(Income) loss from discontinued operations 42 (48)
Income tax expense (benefit) 100 (1,019)
Other (income) expense, net (11) 651
Interest expense 33 31
Interest income (4) (2)
Operating Income 469$ 452$
Acquisition related charges 10 18
Restructuring and other charges (credits), net 18 31
Adjusted Operating Income(1)
497$ 501$
Depreciation and amortization(2)
147 146
Adjusted EBITDA (1)
644$ 647$
Net Sales 3,118$ 3,121$
Net income as a percentage of net sales 9.9% 26.9%
Adjusted EBITDA margin(1)
20.7% 20.7%
(2) Excludes non-cash amortization associated with fair value adjustments related to acquired customer order backlog of $1
million and $2 million for the quarters ended June 26, 2015 and June 24, 2016, respectively, as these charges are included in the
acquisition related charges line.
(1) See description of non-GAAP measures contained in this Appendix.
For the Q uarters Ended
($ in millions)
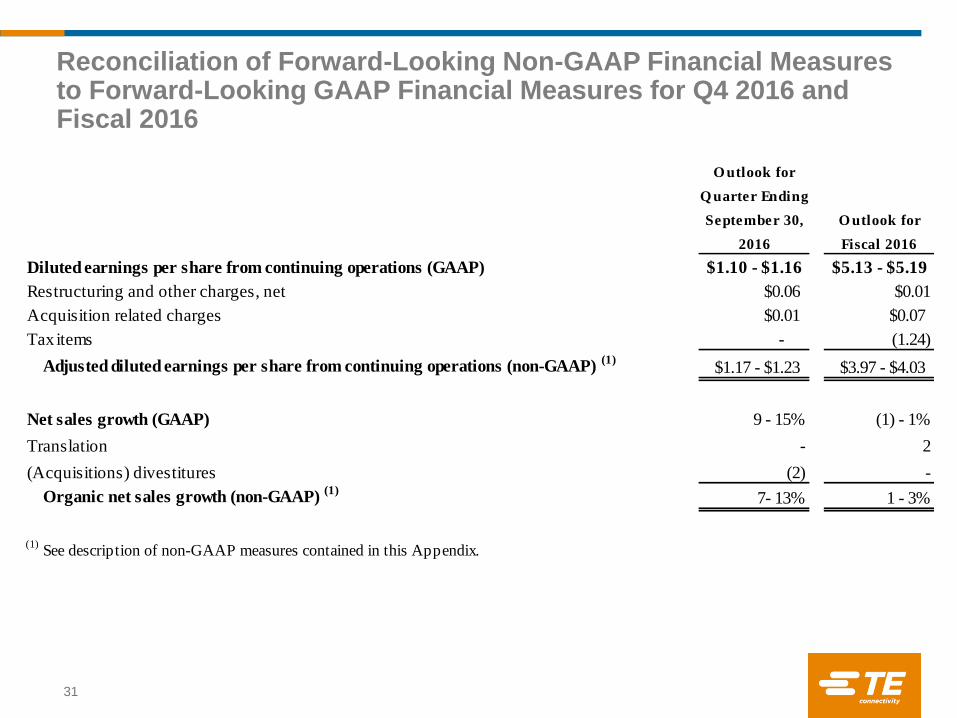
Reconciliation of Forward-Looking Non-GAAP Financial Measures to Forward-Looking GAAP Financial Measures for Q4 2016 and Fiscal 2016
31
O utlook for
Q uarter Ending
September 30, O utlook for
2016 Fiscal 2016
Diluted earnings per share from continuing operations (GAAP) $1.10 - $1.16 $5.13 - $5.19
Restructuring and other charges, net $0.06 $0.01
Acquisition related charges $0.01 $0.07
Tax items - (1.24)
Adjusted diluted earnings per share from continuing operations (non-GAAP) (1)
$1.17 - $1.23 $3.97 - $4.03
Net sales growth (GAAP) 9 - 15% (1) - 1%
Translation - 2
(Acquisitions) divestitures (2) -
Organic net sales growth (non-GAAP) (1)
7- 13% 1 - 3%
(1) See description of non-GAAP measures contained in this Appendix.
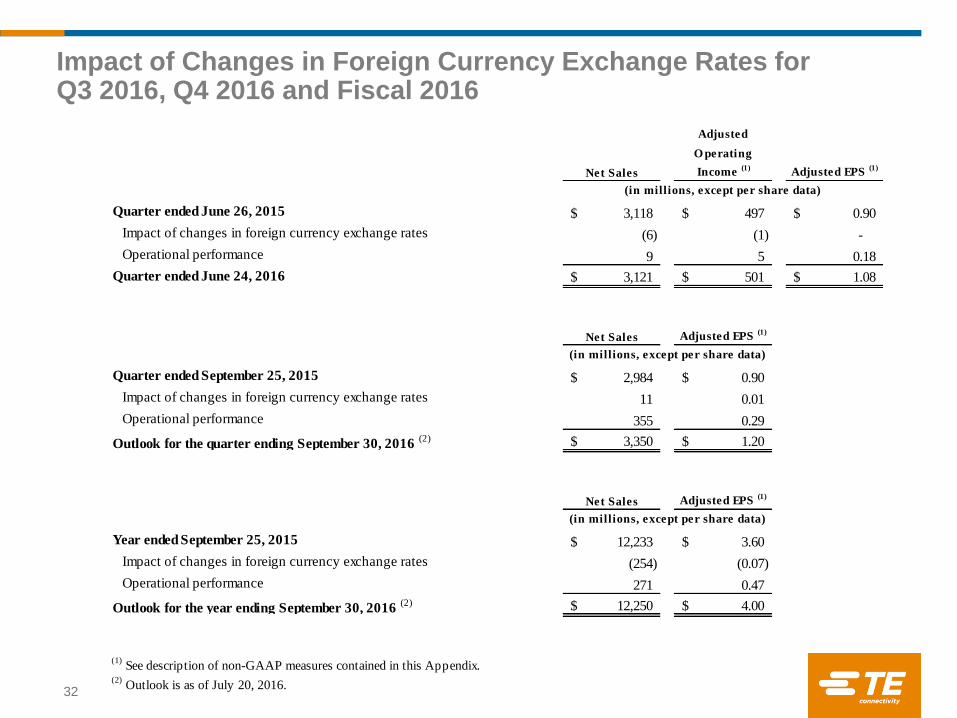
Impact of Changes in Foreign Currency Exchange Rates for Q3 2016, Q4 2016 and Fiscal 2016
32
Adjusted
O perating
Net Sales Income (1)
Adjusted EPS (1)
Quarter ended June 26, 2015 3,118$ 497$ 0.90$
Impact of changes in foreign currency exchange rates (6) (1) -
Operational performance 9 5 0.18
Quarter ended June 24, 2016 3,121$ 501$ 1.08$
Net Sales Adjusted EPS (1)
Quarter ended September 25, 2015 2,984$ 0.90$
Impact of changes in foreign currency exchange rates 11 0.01
Operational performance 355 0.29
Outlook for the quarter ending September 30, 2016 (2) 3,350$ 1.20$
Net Sales Adjusted EPS (1)
Year ended September 25, 2015 12,233$ 3.60$
Impact of changes in foreign currency exchange rates (254) (0.07)
Operational performance 271 0.47
Outlook for the year ending September 30, 2016 (2) 12,250$ 4.00$
(2) Outlook is as of July 20, 2016.
(in millions, except per share data)
(in millions, except per share data)
(in millions, except per share data)
(1) See description of non-GAAP measures contained in this Appendix.
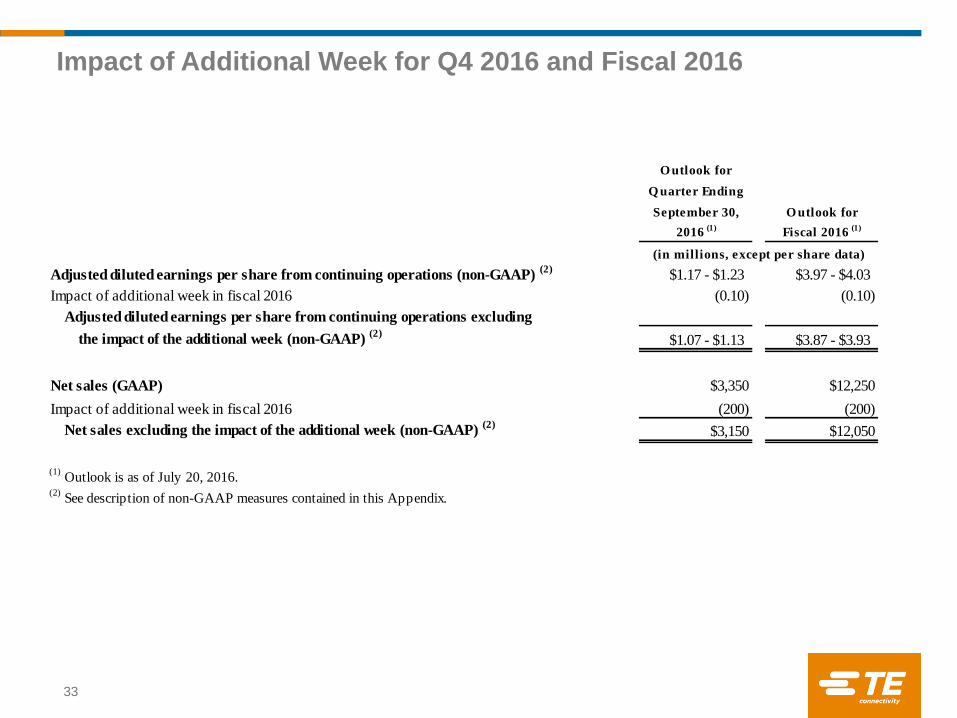
Impact of Additional Week for Q4 2016 and Fiscal 2016
33
O utlook for
Q uarter Ending
September 30, O utlook for
2016 (1)
Fiscal 2016 (1)
Adjusted diluted earnings per share from continuing operations (non-GAAP) (2)
$1.17 - $1.23 $3.97 - $4.03
Impact of additional week in fiscal 2016 (0.10) (0.10)
Adjusted diluted earnings per share from continuing operations excluding
the impact of the additional week (non-GAAP) (2)
$1.07 - $1.13 $3.87 - $3.93
Net sales (GAAP) $3,350 $12,250
Impact of additional week in fiscal 2016 (200) (200)
Net sales excluding the impact of the additional week (non-GAAP) (2)
$3,150 $12,050
(1) Outlook is as of July 20, 2016.
(2) See description of non-GAAP measures contained in this Appendix.
(in millions, except per share data)