target structural reliability analysis for tsunami...
TRANSCRIPT

Target Structural Reliability Analysis for TsunamiHydrodynamic Loads of the ASCE 7 Standard
Gary Chock, Dist.M.ASCE1; Guangren Yu, M.ASCE2; Hong Kie Thio3; Patrick J. Lynett, M.ASCE4
Abstract: Many coastal areas in the United States are subject to tsunami hazard. The public safety risk has been partially mitigated throughwarning and preparedness of evacuation, but community disaster resilience requires that critical and essential facilities provide structuralresistance to collapse. Furthermore, there are coastal communities in the states of Alaska, Washington, Oregon, California, and Hawaii wherethere is insufficient time for evacuation. The Tsunami Loads and Effects Subcommittee of the ASCE/Structural Engineering Institute (ASCE/SEI) 7 Standards Committee has developed a new Chapter 6, titled “Tsunami Loads and Effects,” for the 2016 edition of the ASCE 7 standardMinimum Design Loads for Buildings and Other Structures (Minimum design loads for buildings and other structures). The new ASCE 7provisions for tsunami loads and effects implements a unified set of analysis and design methodologies that are consistent with probabilistichazard analysis, tsunami physics, and reliability analysis. The purpose of this paper is to provide analysis of the structural reliability basis fortsunami-resilient design of critical and essential facilities, taller building structures, and tsunami vertical evacuation refuge structures.Probabilistic limit-state reliabilities are computed for representative structural components carrying gravity and tsunami loads, utilizingstatistical information on the key hydrodynamic loading parameters and resistance models with specified tsunami load combination factors.Through a parametric analysis performed using Monte Carlo simulation, it is shown that anticipated reliabilities for tsunami hydrodynamicloads meet the general intent of the ASCE 7 standard as stated in its Chapter 1 commentary. Importance factors consistent with the targetreliabilities for extraordinary loads (such as seismic events) are determined for tsunami loads. DOI: 10.1061/(ASCE)ST.1943-541X.0001499. © 2016 American Society of Civil Engineers.
Author keywords: Tsunami; Safety; Reliability; ASCE 7 standard; Safety and reliability.
Introduction
Tsunamis are infrequent events but can be extremely destructive.A tsunami is a series of great waves primarily caused by a majorsubduction zone earthquake with large-scale displacement of thesea floor or by initiation of submarine landslides. Many coastalareas in the United States are subject to tsunami hazard. The publicsafety risk has been partially mitigated through warning and pre-paredness of evacuation, but community disaster resilience requiresthat critical and essential facilities provide structural resistance tocollapse. Furthermore, there are coastal communities in the states ofAlaska, Washington, Oregon, California, and Hawaii where there isinsufficient time for evacuation. With these circumstances, theavailability of taller buildings that are tsunami resistant is a directbenefit to public safety. The recent catastrophic tsunamis in theIndian Ocean (2004), Samoa (2009), Chile (2010), and Japan(2011) indicate that an explicit structural design procedure for risk
mitigation of tsunami damage to major structures is much needed.Multistory buildings, which are necessary for tsunami safety whereevacuation cannot be completely assured, can be economicallydesigned for life safety or better performance for large tsunamiswith local strengthening of relatively few components.
The 2016 edition of the ASCE 7 standard,Minimum design loadsfor buildings and other structures will introduce a new Chapter 6,titled “Tsunami Loads and Effects” (ASCE 2016). Tsunami risk cat-egories are based on the risk categories defined in Section 1.5 ofASCE 7, with some modifications for specific types of structuresallowed per ASCE 7-16 Section 6.4 for tsunami conditions in thelocal community (the local government would need to identify theircritical facilities versus those facilities that are not uniquely requiredfor posttsunami functionality). Tsunami Risk Category III andTsunami Risk Category IV buildings and other structures located inthe tsunami-prone states of Alaska, Washington, Oregon, California,and Hawaii shall be designed to resist the tsunami loads and effectsdetermined for a maximum considered tsunami. Recent UnitedStates and international research and validation by documented casestudies of tsunami flows and their effects on structures were utilizedin developing this chapter and commentary, along with the develop-ment of new probabilistic tsunami design zone maps (Chock 2016).
Tsunami Vertical Evacuation Refuge Structures
In ASCE 7-16, a tsunami vertical evacuation refuge structure is aspecial type of Risk Category IV structure with additional designrequirements. This structure serves as a designated point of refugeto which a portion of a community’s population can evacuate whenhigher ground is not reachable in time before tsunami arrival. Aparticularly important consideration is the elevation and heightof the refuge, since it must provide very high reliability of structurallife safety for the occupants within a portion of the refuge that is not
1Structural Engineering Institute Fellow, Chair, ASCE 7 Tsunami Loadsand Effects Subcommittee; President, Martin & Chock, Inc., 1132 BishopSt., Suite 1550, Honolulu, HI 96813 (corresponding author). E-mail:[email protected]
2Structural Engineer, Martin & Chock, Inc., 1132 Bishop St., Suite1550, Honolulu, HI 96813. E-mail: [email protected]
3Vice President, Principal Seismologist, AECOM, 915 Wilshire Blvd.,7th Floor, Los Angeles, CA 90017. E-mail: [email protected]
4Professor, Dept. of Civil and Environmental Engineering, Univ. ofSouthern California, KAP 224D, Los Angeles, CA 90089. E-mail: [email protected]
Note. This manuscript was submitted on May 12, 2015; approved onDecember 17, 2015; published online on May 24, 2016. Discussion periodopen until October 24, 2016; separate discussions must be submitted forindividual papers. This paper is part of the Journal of Structural Engineering,© ASCE, ISSN 0733-9445.
© ASCE 04016092-1 J. Struct. Eng.
J. Struct. Eng., 04016092
Dow
nloa
ded
from
asc
elib
rary
.org
by
SOU
TH
ER
N C
AL
IFO
RN
IA U
NIV
ER
SIT
Y o
n 05
/31/
16. C
opyr
ight
ASC
E. F
or p
erso
nal u
se o
nly;
all
righ
ts r
eser
ved.

inundated. Therefore, additional conservatism is necessary in theestimation of inundation height for the design of these specialoccupancy structures. The minimum elevation for a tsunami verti-cal evacuation refuge structure is the maximum considered tsunamirunup elevation anticipated at the site, increased by 30%. A site-specific tsunami inundation time history analysis is required fora tsunami vertical evacuation refuge, as well as an importancefactor of 1.25.
Tsunami Hazard Analysis
The enduring lesson of recent catastrophic tsunamis is that histori-cal records alone do not provide a sufficient measure of the poten-tial heights of future tsunamis. Engineering design must considerthe occurrence of events greater than scenarios in the historicalrecord, based on the underlying seismicity of subduction zones.To achieve a consistent structural performance for community resil-ience, a probabilistic tsunami inundation geodatabase for designis digitally available with the ASCE tsunami design provisions.The tsunami design zone is the area vulnerable to being inundatedby the maximum considered tsunami (MCT), which is taken ashaving a 2% probability of being exceeded in a 50-year period ora 2,475-year mean recurrence interval. A probabilistic tsunamihazard analysis (PTHA), which is similar to probabilistic seismichazard analysis (PSHA), was performed to produce hazard-consistent offshore tsunami amplitude waveform data and tsunamidesign zone inundation and runup map data. An early example ofthe PTHA procedure was initially performed for California(Thio et al. 2010), which was subsequently refined in accordancewith a peer review study sponsored by the National TsunamiHazard Mitigation Program (California Geological Survey 2015).
Tsunami loads and effects are based on the MCT that is char-acterized by the inundation depth and flow velocities during thestages of inflow and outflow at the site. There are two proceduresfor determining the MCT inundation depth and velocities at a site:(1) the energy grade line analysis (EGLA); and (2) a site-specificinundation analysis (Chock 2015). The EGLA is fundamentally ahydraulic analysis along a topographic transect from the shore lineto the runup point which takes the runup elevation and inundationlimit indicated on the tsunami design zone map as the given sol-ution point. It generally produces values of design flow parametersthat are conservatively greater than numerical modeling of the sametransect, and so it is always performed as the minimum baselineanalysis of the site. (Carden et al. 2015). Site-specific inundationanalysis utilizes the offshore tsunami amplitude, the effective waveperiod that is considered a conserved property, and other specified
waveform shape parameters as the input; it is a two-dimensional(2D) numerical simulation based on a higher-resolution digitalelevation model of nearshore bathymetry and onshore topography.The site-specific inundation analysis is required to be performed forTsunami Risk Category IV structures unless the energy grade lineanalysis shows the inundation depth to be less than 3.66 m (12 ft)at the structure. The design of tsunami vertical refuge structuresalways utilizes a site-specific inundation analysis.
For this reliability analysis study, representative vertical-load-carrying components of prototypical buildings have been evaluatedfor tsunami load effects at three prototypically located sites at each oftwo regions (Huntington Beach and Crescent City, California). Thethree sites at each region are located at the shoreline, and one-quarterand one-half of the inundation distance inland (where x ¼ 0.0XR,x ¼ 0.25XR, and x ¼ 0.5XR; Fig. 1 for x ¼ 0.0XR, 0.25XR, and0.5XR). Probabilistic tsunami hazard analysis was performed toobtain prototypical offshore tsunami amplitude hazard curves andthe associated inland tsunami inundation depth hazard curves for thesix sites. As an example, Fig. 2 shows the offshore and the two inlandinundation depth hazard curves at Crescent City, California.
Basic Limit-State Equation and Tsunami DesignParameters
The following load combinations with tsunami forces as the pri-mary load effect are specified in ASCE 7-16 by Eqs. (1) and (2):
ϕRn ¼ 1.2Dn þ 1.0FTSUn þ 0.5Ln ð1Þ
ϕRn ¼ 0.9Dn þ 1.0FTSUn ð2Þin which ϕ = resistance factor; Rn = nominal strength; Dn =nominal dead load; Ln = nominal live load; and FTSUn = nominaltsunami effect. The nominal subscript notation refers to the speci-fied loads and resistances, per the convention of engineering reli-ability analysis.
Lateral hydrodynamic tsunami forces are generally muchgreater than hydrostatic lateral and buoyant vertical tsunami forces.When considering the out-of-plane strength capacity of a reinforcedconcrete wall or a steel or concrete column element subject to tsu-nami hydrodynamic forces, the vertical dead and live loads areperpendicular to the lateral tsunami hydrodynamic force, so the ver-tical loads do not contribute to the direct action but are also notcounteracting loads to the tsunami hydrodynamic forces. That is,the primary hydrodynamic load is lateral pressure on verticalelements, so the dead load and live load do not directly counteract
Fig. 1. Locations of three prototypically located sites along the transect
© ASCE 04016092-2 J. Struct. Eng.
J. Struct. Eng., 04016092
Dow
nloa
ded
from
asc
elib
rary
.org
by
SOU
TH
ER
N C
AL
IFO
RN
IA U
NIV
ER
SIT
Y o
n 05
/31/
16. C
opyr
ight
ASC
E. F
or p
erso
nal u
se o
nly;
all
righ
ts r
eser
ved.

the tsunami load for those elements [in contrast to the reliabilityanalysis of wind uplift pressure on roof structural components,for example, in Ellingwood et al. (1980)]. However, the designfor vertical dead and live loads results in resistive capacity, Rn, inthe vertical (beam–column) member that has biaxial axial load–moment (P–M) capacity to resist the lateral pressures, rather thanacting as a purely flexural beam member.
Tsunami-resistant structures will predominately be in the heightregime of four or more stories, and the beam–column resistanceshould also reflect the column design capacity that includes deadand live load, 1.2Dþ 1.6L (ASCE 2016). There is a beneficial ef-fect in flexural capacity of the vertical beam–column under tsunamilateral load component due to the 0.5L axial loading in the loadcombination given in Eq. (1). Based on prototypical tsunami de-signs compared to a purely flexural beam (Robertson 2016), thecapacity bias for the beam–column designed for vertical load isestimated to be lognormal with about a mean of 1.15 and a sigmaof 0.2, i.e., a coefficient of variation (COV) of 0.17. Assuming λn isthe capacity factor of a flexural member, Eqs. (1) and (2) would berevised to account for beam–column behavior as follows in Eq. (3):
λnϕRn ¼ 1.0FTSUn ð3Þ
For beam–column bending, the general limit-state functionGðXÞ ¼ R − S, i.e., the expression for Resistance–Load can be for-mulated in Eq. (4) as
GðXÞ ¼ GðR;λ;FTSUÞ ¼ λR − FTSU ð4Þin which λ = capacity bias of the beam-column considering effectsof axial loading of dead and live loads. Using Eq. (3) to normalizethe expression, the limit-state function becomes Eq. (5):
1
λnϕRnGðXÞ ¼ 1
λnϕRnGðR; λ;FTSUÞ ¼
λλn
RϕRn
− FTSU
FTSUnð5Þ
Assuming λ=λn and R=Rn are statistically independent relation-ships with their COVs being 0.17 and 0.11 or 0.13, respectively, the
net COV for the capacity of a beam–column would have values of0.20 or 0.22 for reinforced concrete and structural steel. This valueis slightly higher than the 0.17 suggested by Ellingwood (1977),meaning that a greater amount of uncertainty is considered in thisanalysis. Considering tension-governing failure is typically in-duced by tsunami lateral loading, the COVof 0.21 was the net un-certainty that results from the random variables λ=λn and R=Rn forthe capacity of the beam–columns subject to tsunami loading as theprincipal action.
The lateral hydrodynamic load given by Eq. (6) is assumed togovern when a vertical beam–column is subject to tsunami loading
FTSU ¼ 1
2ρsCdbðheu2ÞItsu ð6Þ
in which ρs = minimum fluid mass density; Cd = drag coefficientfor the building component; b = width perpendicular to the flow;he = inundation depth; u = flow velocity; and Itsu = tsunami im-portance factor.
The second term on the right side of the limit-state function[Eq. (5)] is then expanded to Eqs. (7) and (8):
FTSU
FTSUn¼
12ρsCdbðheu2Þ
12ρsnCdnbnðheu2ÞnItsu
ð7Þ
FTSU
FTSUn¼ ρs
ρsn
Cd
Cdn
bbn
ðheu2Þðheu2Þn
1.0Itsu
ð8Þ
in which ρsn, Cdn, bn, and ðheu2Þn = nominal design values. Theterm ðheu2Þn refers to the momentum flux calculated in accordancewith the EGLA. Introducing ðheuÞo as the momentum flux ob-tained by a detailed numerical model for site-specific inundationanalysis, Eq. (8) then can be expressed in the form of Eq. (9):
FTSU
FTSUn¼ ρs
ρsn
Cd
Cdn
bbn
ðheu2Þoðheu2Þn
ðheu2Þðheu2Þo
1.0Itsu
ð9Þ
Fig. 2. Normalized Crescent City inland site inundation hazard curve and offshore hazard curve (inundation depth hazard curve is normalized to thedepth for the MCT)
© ASCE 04016092-3 J. Struct. Eng.
J. Struct. Eng., 04016092
Dow
nloa
ded
from
asc
elib
rary
.org
by
SOU
TH
ER
N C
AL
IFO
RN
IA U
NIV
ER
SIT
Y o
n 05
/31/
16. C
opyr
ight
ASC
E. F
or p
erso
nal u
se o
nly;
all
righ
ts r
eser
ved.

The depth-averaged flow velocity is considered to be a functionof inundation depth, as expressed by the Froude number fortsunami flow [the nondimensionalized flow velocity u=
pðghÞ] thatis prescribed to decay gradually based on distance from the shore-line along the transect in accordance with the EGLA (Chock 2015).Eq. (9) is then parametrically simplified to an expression relating tothe inundation depth as Eq. (10):
FTSU
FTSUn¼ ρs
ρsn
Cd
Cdn
bbn
ψ
�heheo
�2 1.0Itsu
ð10Þ
In Eq. (10), ψ ¼ ðheu2Þ0=ðheu2Þn; and heo = inundation depthwith a 2,475-year return period. Including the effect of aleatoryuncertainties, he is εh where h is the inundation depth withoutconsidering the effect of aleatory uncertainties and ε accounts forthe net aleatory uncertainties in estimated inundation depth asso-ciated with the modeling of seismic sources and inundation numeri-cal modeling.
Since the terms λnϕRn at the left side of Eq. (5) are not randomand always greater than 0, the fundamental limit-state equation canthus be further developed to Eq. (11):
GðXÞ ¼ λλn
RϕRn
− ρsρsn
Cd
Cdn
bbn
ψε2�
hheo
�2 1.0Itsu
ð11Þ
in which GðXÞ ¼GðR;λ;FTSUÞ ¼GðR=Rn;λ=λn;ρs=ρsn;Cd=Cdn;b=bn;ψ;ε;he=henÞ
Reliability Analysis Parameters for Tsunamis
For drag coefficients, Cd=Cdn is assumed to be a constant value of1.0. The drag coefficients are form-dependent values from the rec-ognized literature; as an example of lack of significant bias, the truevalue of Cd drag coefficient for a cylinder is 1.17 and the specifiedvalue is 1.2.
For fluid density, ρs=ρsn is assumed to vary with a normal dis-tribution with mean of 1.0 and a COV of 0.03. The mean of thespecified fluid density factor, ks is considered to be 1.1 accountingfor suspended material and embedded smaller debris carried in theflow so that ρs is defined by ksρsw (in which ρsw is the seawatermass density) with the expectation that this variable could vary be-tween 1.05 and 1.15 (yielding a COV for ks of 0.030) with 1.10 asthe mean effective fluid mass density representing a debris floodrather than pure seawater (a debris flood is laden with sedimentand suspended debris, but still behaves essentially as a fluid ratherthan a flow with plastic viscosity).
Regarding width, b=bn is assumed to be uniformly distributedwith the range of 0.4=0.7 and 0.6=0.7 (i.e., [0.571, 0.857] with amean of 0.71). To account for assorted debris accumulation, ASCE7 does not allow the forces to be computed on the bare structurewithout cladding, interior walls and fixtures, or contents. For build-ings initially cladded, the designer can conservatively assume only30% of this becomes open to allow unimpeded flow. Actual accu-mulation is estimated from field case studies (Carden et al. 2015) tobe in the range of creating a 40 to 60% closure ratio, rather than theprescribed 70% as used for design, so there is some conservativebias in the design provisions to prevent underestimation of loading.The prescriptive minimum closure ratio of 70% of overall buildingwidth is biased upward by about 0.7=0.5, assuming a uniform dis-tribution with the COV of 0.115. This prescribed minimum ratiois applied to the vertical projected tributary area of the exteriorcomponent or structure being designed. For interior column andwall components, ASCE 7 does not have this restriction, and hy-drodynamic forces are computed on the bare structural form of the
interior components. The likelihood of debris accumulation oninterior columns is much less than on exterior columns along thebuilding perimeter. Therefore, the reliabilities are calculated withthis biased closure ratio design parameter for exterior columns, andwithout this closure ratio parameter for the case of interior columns.
For inundation depth, he=hen is sampled from the cumulativedistribution function (CDF) of 50-year service life maximum inun-dation depth as illustrated in Fig. 3, which shows the details of theupper tail of the CDF derived from the hazard curve obtainedthrough probabilistic tsunami hazard analysis (PTHA). At inlandsites such as this example case of x ¼ 0.025xR at Crescent City, thehigher frequency, lower-runup tsunami events do not reach the site,leading to a statistical clustering of data until more significantand rarer events overwash the site. In addition, he is the inundationdepth without considering aleatory uncertainties, and hen is thespecified value (i.e., inundation depth with a 2,475-year returnperiod including the effect of aleatory uncertainties). Above a5,000-year MRI, tsunami inundation depth is considered to havereached a plateau value. The reliability analysis given here is basedon inland hazard curves since the subject application is primarilybuildings.
For aleatory uncertainty, ε accounts for the net aleatory uncer-tainties in estimated inundation depth associated with the modelingof seismic sources and numerical modeling of inundation basedon field case studies, and this is modeled with a lognormal distri-bution (λ ¼ 0 and ζ ¼ 0.30 or mean ¼ 1.06 and COV ¼ 0.283)when high-resolution digital elevation models are used. Aleatoryvariability is taken into account at several stages in the probabilisticanalysis: in the source by considering magnitude distribution func-tions and multiple distributed slip models, and in the tsunamipropagation term by applying a distribution function to the offshoretsunami amplitudes. It is the latter term that is of concern in thisanalysis since it is dominated by limits in present modeling accu-racy. The main components of aleatory uncertainty are approxima-tions in tsunami inundation modeling algorithms and details in theseismic rupture process that cannot be resolved.
Aleatory variability and epistemic uncertainty are generallyused in discussions of probabilistic seismic hazard analysis(PSHA). In PSHA, this term is considered as the inherent partof the empirically obtained ground motion prediction equations.In PTHA, the aleatory uncertainty is measured explicitly throughground-truthing statistics. Estimates of the aleatory uncertaintywere obtained by comparing tsunami data (tide-gauge data, maxi-mum water heights at the shore, and runup elevations) and modelresults for well-constrained (in terms of slip model) tsunamigenicsources, such as the 2011 Tohoku earthquake. Since the analysis isdivided into offshore tsunami amplitude and onshore inundationresults, and since the propagation characteristics are very differentbetween the two regimes, sigma terms for each component wereestimated in the determination of the net uncertainty given in theearlier discussion. The aleatory uncertainty for the seismic sourcemodeling is lognormal with a sigma of 0.25, and the aleatory un-certainty for the inundation modeling is lognormal with a sigmaof 0.15, for a total sigma of 0.29, or about 0.30 as used here witha mean of 1.067, yielding a COV of 0.283. Also, these aleatoryvariability estimates are strictly applicable only to model grid res-olutions that are similar to the resolutions used in the lognormaldistribution sigma analysis for the ASCE 7 tsunami provisions; thatis, the statistical estimate of aleatory variability in this application iswithin the context of the PTHA and inundation model used andwhat is observed in actual event data.
Epistemic uncertainty in prescriptive analysis of flow: ψ is avariable to account for the epistemic uncertainty in the nominalsolution (i.e., imprecisions in the code-specified energy grade line
© ASCE 04016092-4 J. Struct. Eng.
J. Struct. Eng., 04016092
Dow
nloa
ded
from
asc
elib
rary
.org
by
SOU
TH
ER
N C
AL
IFO
RN
IA U
NIV
ER
SIT
Y o
n 05
/31/
16. C
opyr
ight
ASC
E. F
or p
erso
nal u
se o
nly;
all
righ
ts r
eser
ved.

analysis) versus numerical model. It is sampled from the normal-ized momentum flux hazard curve (Fig. 4) in accordance with thebias and COV statistics of the EGLA versus numerical simulationmodel (Lynett and Liu 2011). The next section describes how thisvariable is derived for the normalized momentum flux hazardcurve. The EGLA is deemed sufficient for Tsunami Risk CategoryII and III structures; for Tsunami Risk Category IV structures andtsunami vertical evacuation refuge structures, a site-specific inun-dation analysis is necessary.
For structural resistance, R=Rn is assumed to be normally dis-tributed. For a concrete flexural member, the mean is 1.05 and theCOV is 0.11. For compact steel beams or columns, the mean is 1.07and the COV is 0.13 (Ellingwood et al. 1980).
Statistical Assessment of the Energy Grade LineAnalysis to Derive ψ
A robust comparison of the EGLA with a detailed inundationmodel was performed to assess the ability of the EGLA to pro-vide a conservative result for a wide range of possible onshoretopographic profiles and wave conditions. The general approachemployed was to run a number of simulations using a Boussinesq-type model (Lynett and Liu 2011) and compare the inundationproperties of the Boussinesq output with the EGLA. NonlinearBoussinesq equation-based algorithms have been used for long-wave modeling, wave diffraction and nonlinear dispersive waves,wave breaking, and other unsteady shallow-water flow. Specifi-cally, the procedure for a single comparison case was performedas follows:1. Generate a beach profile; the profile starts at an offshore depth
of 100 m and extends onshore to an elevation of 50 m.2. Generate an incident wave condition; the condition consists of
an initial trough or crest elevation, a following crest or troughelevation, and a characteristic period of the waveform.
3. Run a Boussinesq simulation with these profile and wave inputs;the resolution used here is 10 m across the length of the entireprofile with the simulations using a typical Manning’s n frictionfactor of 0.025 at all grid points (both offshore and onshore);this value is per ASCE 7 Chapter 6 specifications.
4. Record the runup point and maximum flow depth, and the timehistories of flow speed and momentum flux across the entireprofile as predicted by the Boussinesq simulation.
5. Using the Boussinesq predicted runup point and the onshoretopographical profile, run the Energy Grade Line Analysis fora specific initial Froude number at the coastline and record max-imum flow depth, flow speed, and momentum flux across theentire profile.
6. Compare the maximum flow depth, flow speed, and momentumflux predictions from the two methods.This was implemented with a Monte Carlo simulation for
randomly generated tsunami waveforms and transects, which ledto the establishment of EGLA parameters that produce statisticalconservatism with respect to state-of-the-art numerical solutions.The offshore profile, connecting depths of 100 to 0 m, is con-structed with a single linear segment with a slope chosen randomlybetween 1=10 and 1=500, with a mean of the offshore portfolio of∼1=60. Onshore, the initial dry beach profile is composed of 20individual linear segments with randomly chosen slope and length,where both positive and negative slope segments were allowed.A mean slope of 1=100 for the onshore portfolio of transect caseswas considered a reasonable average for all beach profiles.
The incident wave condition, as needed in Step 2, is constructedas a waveform pulse made of a single crest and trough waveformthat passes through the offshore boundary of the Boussinesq-typesimulation at the 100 m offshore depth. A total of 45 unique inci-dent wave combinations were simulated for each of 800 randomtransect profiles, for a total of 36,000 Boussinesq-type simulationsperformed. On average, each transect contains roughly 20 flooded
Fig. 3. Cumulative distribution function of normalized inundation depth for Crescent City Site 2 at x ¼ 0.25xR
© ASCE 04016092-5 J. Struct. Eng.
J. Struct. Eng., 04016092
Dow
nloa
ded
from
asc
elib
rary
.org
by
SOU
TH
ER
N C
AL
IFO
RN
IA U
NIV
ER
SIT
Y o
n 05
/31/
16. C
opyr
ight
ASC
E. F
or p
erso
nal u
se o
nly;
all
righ
ts r
eser
ved.
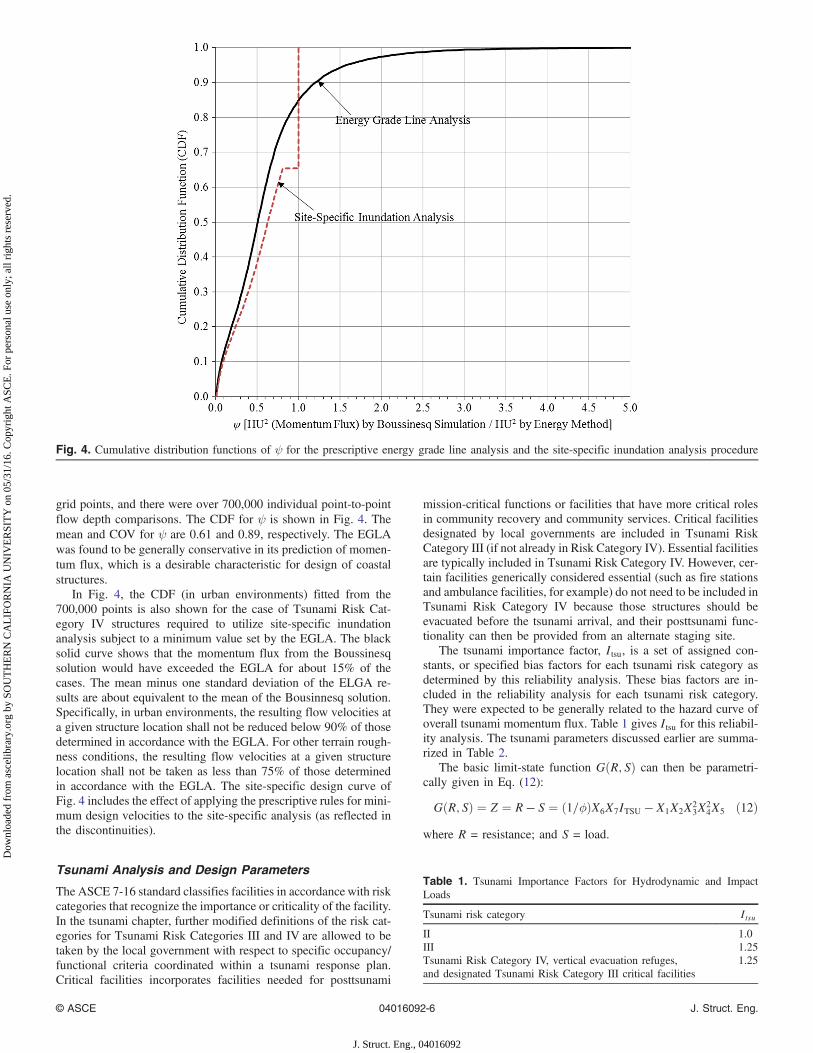
grid points, and there were over 700,000 individual point-to-pointflow depth comparisons. The CDF for ψ is shown in Fig. 4. Themean and COV for ψ are 0.61 and 0.89, respectively. The EGLAwas found to be generally conservative in its prediction of momen-tum flux, which is a desirable characteristic for design of coastalstructures.
In Fig. 4, the CDF (in urban environments) fitted from the700,000 points is also shown for the case of Tsunami Risk Cat-egory IV structures required to utilize site-specific inundationanalysis subject to a minimum value set by the EGLA. The blacksolid curve shows that the momentum flux from the Boussinesqsolution would have exceeded the EGLA for about 15% of thecases. The mean minus one standard deviation of the ELGA re-sults are about equivalent to the mean of the Bousinnesq solution.Specifically, in urban environments, the resulting flow velocities ata given structure location shall not be reduced below 90% of thosedetermined in accordance with the EGLA. For other terrain rough-ness conditions, the resulting flow velocities at a given structurelocation shall not be taken as less than 75% of those determinedin accordance with the EGLA. The site-specific design curve ofFig. 4 includes the effect of applying the prescriptive rules for mini-mum design velocities to the site-specific analysis (as reflected inthe discontinuities).
Tsunami Analysis and Design Parameters
The ASCE 7-16 standard classifies facilities in accordance with riskcategories that recognize the importance or criticality of the facility.In the tsunami chapter, further modified definitions of the risk cat-egories for Tsunami Risk Categories III and IV are allowed to betaken by the local government with respect to specific occupancy/functional criteria coordinated within a tsunami response plan.Critical facilities incorporates facilities needed for posttsunami
mission-critical functions or facilities that have more critical rolesin community recovery and community services. Critical facilitiesdesignated by local governments are included in Tsunami RiskCategory III (if not already in Risk Category IV). Essential facilitiesare typically included in Tsunami Risk Category IV. However, cer-tain facilities generically considered essential (such as fire stationsand ambulance facilities, for example) do not need to be included inTsunami Risk Category IV because those structures should beevacuated before the tsunami arrival, and their posttsunami func-tionality can then be provided from an alternate staging site.
The tsunami importance factor, Itsu, is a set of assigned con-stants, or specified bias factors for each tsunami risk category asdetermined by this reliability analysis. These bias factors are in-cluded in the reliability analysis for each tsunami risk category.They were expected to be generally related to the hazard curve ofoverall tsunami momentum flux. Table 1 gives Itsu for this reliabil-ity analysis. The tsunami parameters discussed earlier are summa-rized in Table 2.
The basic limit-state function GðR; SÞ can then be parametri-cally given in Eq. (12):
GðR; SÞ ¼ Z ¼ R − S ¼ ð1=ϕÞX6X7ITSU − X1X2X23X
24X5 ð12Þ
where R = resistance; and S = load.
Fig. 4. Cumulative distribution functions of ψ for the prescriptive energy grade line analysis and the site-specific inundation analysis procedure
Table 1. Tsunami Importance Factors for Hydrodynamic and ImpactLoads
Tsunami risk category Itsu
II 1.0III 1.25Tsunami Risk Category IV, vertical evacuation refuges,and designated Tsunami Risk Category III critical facilities
1.25
© ASCE 04016092-6 J. Struct. Eng.
J. Struct. Eng., 04016092
Dow
nloa
ded
from
asc
elib
rary
.org
by
SOU
TH
ER
N C
AL
IFO
RN
IA U
NIV
ER
SIT
Y o
n 05
/31/
16. C
opyr
ight
ASC
E. F
or p
erso
nal u
se o
nly;
all
righ
ts r
eser
ved.

Reliability Analysis Using Monte Carlo Simulation
The reliabilities were calculated using Monte Carlo simulationinvolving a large number of trial combinations of random variables.The uncertainties of the primary variable, momentum flux is ac-counted for by several random variables, e.g., inundation depth, ε,and ψ. Random variable ε is modeled with a lognormal distributionand ψ is described with a summation of eight different Gaussianfunctions. Although an analytical Type II extreme value distribu-tion could be well fitted to the 50-year service life maximuminundation depth of Crescent City offshore, no probability distri-bution could be fitted for the inland sites at Huntington Beachand Crescent City. Obviously, the distribution of load S in thelimit-state equation is not normal even though a normal distributionis assumed for resistance R. So there is no closed-form solution forreliability calculation. Accordingly, Monte Carlo simulation wasthe most appropriate technique to employ. The procedure for theMonte Carlo simulation is as follows for the seven parametersof ρ, b, h, ε, ψ, λ, and R:1. Randomly generate a value for each random variable in the
limit-state equation. No dependence is assumed between any ofthe variables. The inundation depth is sampled from its 50-yearservice life maximum CDF curve, which is derived from theprobabilistic tsunami hazard curve for the representative sites.
2. Calculate Z ¼ R − S per Eq. (12). If GðXÞ ¼ Z < 0, then thesimulated member fails.
3. Repeat Steps 1 and 2 until a predetermined number of simula-tions are performed.
4. Calculate the probability of failure as Pf = number of times thatZ < 0 divided by total number of simulations.
5. The reliability index β ¼ Φ−1ð1 − PfÞ.The simulation was software-coded and generally, 1 million
simulations were performed for each reliability calculation. Thesimulation starts at a sample size of 1 million and increased byan order of magnitude in size until convergence resulted in accept-able precision, which depended on the reliability target. ForTsunami Risk Category IV tsunami vertical evacuation refugestructures, the sample size was increased up to 250 million, sincethe probabilities of failure were much less than the other categories.
Results of Reliability Analysis
Tables 3 and 4 present the reliabilities and failure probabilities forrepresentative concrete beam–column members when subject totsunami loading (results for structural steel components wouldbe very similar, by examining the Table 2 resistance variables).
The reliabilities were calculated with the b=bn closure ratio de-sign parameter for exterior columns along the building perimeter(Table 3), and without this closure ratio parameter for the caseof interior columns (Table 4) that are less likely to have additionaldebris accumulation. The analysis of interior columns essentiallyignores any incidental protective obstructions to flow within thebuilding itself; that is, the exterior is considered as being obstructed,but the interior flow is assumed to be the same as the free-field flow. Although not evaluated in this analysis, under actualscenarios, interior columns within the building may experiencelower flow speed than the exterior columns. Moreover, if debris ac-cumulation on the exterior creates higher forces on the exterior col-umns, the greater solidity of the building form may also divert theflow around the structure and abate the volumetric flow rate throughit. Failures of exterior columns are more commonly observed inposttsunami investigations, and so in general this is consideredthe more practical case of application of the reliability analysis.
The reliability indices are calculated for a 50-year serviceperiod, while the probabilities of failure have been annualized,except for the failure probabilities conditional on the occurrenceof the MCT. The conditional probability of structural limit-stateexceedance of a primary beam–column structural component wascomputed assuming the MCT has occurred, similar to the determi-nation of the conditional reliability of the seismic provisions shownin ASCE 7’s Table C.1.3.1b assuming the MCE has occurred. Theconditional probabilities are thought to be a better measure of seis-mic design intent. For seismic and tsunami events, there is largealeatory uncertainty associated with the seismic source characteri-zation within the probabilistic hazard analysis.
Effect of Threshold Height for Risk Category IIBuildings
These tsunami reliability estimates are predicated on theassumption that the load combinations with tsunami as the primaryload effect would govern the design of the members. In actual struc-tures, the reliabilities of various members may be governed by avariety of load effects. The ASCE 7 Chapter 6, “Tsunami Loadsand Effects,” is recommended to apply to Risk Category II build-ings greater than 19.8 m (65 ft) tall above grade plane in the mostsevere tsunami design zones. Such taller buildings are expected tohave a robust baseline of lateral-force resistance due to seismic de-sign requirements, and they would be seen by the public as placesof refuge to get to safety above the inundation. In addition, thelower-story gravity-load-carrying columns will have a significantamount of resistance to the flexural moment of hydrodynamic
Table 2. Reliability Analysis Parameters
Parameter Random variable Distribution Mean COV
ρs=ρsn (density) X1 Normal 1.0 0.03Cd=Cdn Constant — 1.0 0b=bn (closure)—exterior column case X2 Uniform 0.71 0.115he=hen (inundation depth) X3 Sampled from probabilistic hazard curveε (aleatory uncertainty of hazard analysis) X4 Lognormal 1.067 0.283Ψ (epistemic uncertainty of flow analysis) X5 Sampled from the simulation curve expressing the difference between
the EGLA and numerical site-specific analysisλ=λn (beam–column effect) X6 Lognormal 1.15 0.174R=Rn (concrete resistance) X7 Normal 1.05 0.11R=Rn (steel resistance) X7 Normal 1.07 0.13Itsu (tsunami importance factor) Assigned scalar factor In accordance with tsunami risk category (Table 1)ϕ (strength reduction factor) Assigned constant 0.90 (under tsunami lateral forces and a 0.5 live-load factor, column
designs become more flexurally governed)
© ASCE 04016092-7 J. Struct. Eng.
J. Struct. Eng., 04016092
Dow
nloa
ded
from
asc
elib
rary
.org
by
SOU
TH
ER
N C
AL
IFO
RN
IA U
NIV
ER
SIT
Y o
n 05
/31/
16. C
opyr
ight
ASC
E. F
or p
erso
nal u
se o
nly;
all
righ
ts r
eser
ved.

pressure within each story height, just from having been designedfor the 1.2Dn þ 1.6Ln load combination for five or more floor lev-els. For interior columns, large debris impacts are not deemed to bea likely risk. In actual trial designs of 19.8 m (65-ft)-tall buildings(Robertson 2016), the load combination of 1.2Dn þ 1.0FTSUn þ0.5Ln for interior columns typically falls well within the axial
load–moment capacity curve resulting from the element designfor the 1.2Dn þ 1.6Ln load combination. Therefore, it is concludedthat the tsunami reliabilities for the interior columns are actuallygreater than those given just by the tsunami analysis, becausethe tsunami load combination is not typically the load combinationgoverning the size of the column in multistory buildings. For
Table 3. Reliabilities for Representative Exterior Concrete Beam–Column Members
Site Measure of reliability
Tsunami RiskCategory II,I ¼ 1.0
Tsunami RiskCategory III,I ¼ 1.25
Tsunami RiskCategory IV,I ¼ 1.25
Evacuation refuge,I ¼ 1.25and 1.3hn
Crescent City, x ¼ 0 Reliability index, β 2.95 3.06 3.64 >5.75a,No failure found in250 million trials
Pfannual 3.2 × 10⁻⁵ 2.2 × 10⁻⁵ 2.7 × 10⁻⁶Pf50-year (%) 0.16 0.11 0.014
Crescent City, x ¼ 0.25xR Reliability index, β 2.75 2.84 3.20 4.63Pfannual 6.0 × 10⁻⁵ 4.5 × 10⁻⁵ 1.4 × 10⁻⁵ 3.6 × 10⁻⁸
Pf50-year (%) 0.30 0.22 0.07 0.00018Crescent City, x ¼ 0.50xR Reliability index, β 2.73 2.91 2.90 3.11
Pfannual 6.3 × 10⁻⁵ 3.7 × 10⁻⁵ 3.7 × 10⁻⁵ 1.9 × 10⁻⁵Pf50-year (%) 0.31 0.18 0.19 0.09
Huntington Beach, x ¼ 0 Reliability index, β 2.90 3.01 3.10 3.40Pfannual 3.7 × 10⁻⁵ 2.6 × 10⁻⁵ 1.9 × 10⁻⁵ 6.8 × 10⁻⁶
Pf50-year (%) 0.19 0.13 0.097 0.034Huntington Beach, x ¼ 0.25xR Reliability index, β 2.78 2.87 3.11 3.79
Pfannual 5.5 × 10⁻⁵ 4.1 × 10⁻⁵ 1.9 × 10⁻⁵ 1.5 × 10⁻⁶Pf50-year (%) 0.27 0.20 0.093 0.0074
Huntington Beach, x ¼ 0.5xR Reliability index, β 2.73 2.91 2.92 3.14Pfannual 6.5 × 10⁻⁵ 3.7 × 10⁻⁵ 3.5 × 10⁻⁵ 1.7 × 10⁻⁵
Pf50-year (%) 0.32 0.18 0.17 0.08Average of the sites Reliability index, β 2.81 2.93 3.15 3.61
Pfannual 5.2 × 10⁻⁵ 3.4 × 10⁻⁵ 2.1 × 10⁻⁵ 8.7 × 10⁻⁶Pf50-year (%) 0.26 0.17 0.11 0.044
Component failure conditionedon the occurrence of the MCT
Reliability index, β 1.51 1.75 1.93 2.40Maximum probability of failure (%) 6.6 4.0 2.7 0.82
Note: The mean values are in boldface.aThis value was not included in determining the average reliability of the sites.
Table 4. Reliabilities for Representative Interior Concrete Beam–Column Members
Site Measure of reliability
Tsunami RiskCategory II,I ¼ 1.0
Tsunami RiskCategory III,I ¼ 1.25
Tsunami RiskCategory IV,I ¼ 1.25
Evacuation refuge,I ¼ 1.25and 1.3hn
Crescent City, x ¼ 0 Reliability index, β 2.80 2.91 3.08 3.33Pfannual 5.2 × 10⁻⁵ 3.7 × 10⁻⁵ 2.1 × 10⁻⁵ 8.7 × 10⁻⁶
Pf50-year (%) 0.26 0.18 0.10 0.044Crescent City, x ¼ 0.25xR Reliability index, β 2.58 2.75 2.81 3.09
Pfannual 9.9 × 10⁻⁵ 6.0 × 10⁻⁵ 4.9 × 10⁻⁵ 2.0 × 10⁻⁵Pf50-year (%) 0.4953 0.3003 0.2468 0.1011
Crescent City, x ¼ 0.50xR Reliability index, β 2.65 2.70 2.74 2.86Pfannual 8.2 × 10⁻⁵ 7.0 × 10⁻⁵ 6.1 × 10⁻⁵ 4.3 × 10⁻⁵
Pf50-year (%) 0.4093 0.3516 0.3068 0.2138Huntington Beach, x ¼ 0 Reliability index, β 2.64 2.75 2.87 3.05
Pfannual 8.3 × 10⁻⁵ 6.0 × 10⁻⁵ 4.1 × 10⁻⁵ 2.3 × 10⁻⁵Pf50-year (%) 0.42 0.30 0.20 0.11
Huntington Beach, x ¼ 0.25xR Reliability index, β 2.57 2.77 2.79 3.07Pfannual 1.0 × 10⁻⁴ 5.6 × 10⁻⁵ 5.2 × 10⁻⁵ 2.1 × 10⁻⁵
Pf50-year (%) 0.5082 0.2815 0.2605 0.107Huntington Beach, x ¼ 0.5xR Reliability index, β 2.63 2.69 2.76 2.88
Pfannual 8.6 × 10⁻⁵ 7.2 × 10⁻⁵ 5.9 × 10⁻⁵ 4.0 × 10⁻⁵Pf50-year (%) 0.431 0.361 0.2925 0.1991
Average of the sites Reliability index, β 2.65 2.76 2.84 3.05Pfannual 8.4x10⁻⁵ 5.9x10⁻⁵ 4.7x10⁻⁵ 2.6x10⁻⁵
Pf50-year (%) 0.42 0.30 0.24 0.13Component failure conditionedon the occurrence of the MCT
Reliability index, β 1.14 1.38 1.45 1.84Maximum probability of failure (%) 12.6 8.3 7.3 3.3
Note: The mean values are in boldface.
© ASCE 04016092-8 J. Struct. Eng.
J. Struct. Eng., 04016092
Dow
nloa
ded
from
asc
elib
rary
.org
by
SOU
TH
ER
N C
AL
IFO
RN
IA U
NIV
ER
SIT
Y o
n 05
/31/
16. C
opyr
ight
ASC
E. F
or p
erso
nal u
se o
nly;
all
righ
ts r
eser
ved.

Tsunami Risk Category III and IV buildings that will have theiroperational functions located above the inundation depth, it is ex-pected that minimum practical heights will be structures at leastthree stories tall or higher, depending on the inundation hazardat the site. For optimally designed structures, the gravity-load-carrying columns of shorter structures would tend to have some-what less of the tsunami-resistant beneficial effect of the 1.2Dn þ1.6Ln load combination.
Increased Reliability with More Precise Site-SpecificInundation Analysis
The reliability analysis results in the previous section did not in-clude the additional uncertainty in the implicit versus explicittwo-dimensional evaluation of topographic amplification of flow.In the EGLA, these effects are then only implicitly consideredby analysis of the given inundation limits and runup elevationswithin a �22.5-degree swath about the primary design transectperpendicular to the coastline. For Tsunami Risk Category IIand III structures, the prescriptive EGLA is allowed to be performedon one-dimensional topographic transects. For Tsunami RiskCategory III critical facilities, Tsunami Risk Category IV structures,and tsunami vertical evacuation refuge structures, a detailed site-specific analysis is always required to be performed with detailedanalysis of the two-dimensional tsunami flow depth and velocityover a high resolution (10 m or finer) digital elevation model oftopography. Consequently, effects of topographic amplification offlow velocity would be explicitly determined in a site-specific in-undation analysis. The tsunami design map inundation limits areproduced by an inundation analysis of the two-dimensional tsunamiflow depth and velocity over a medium resolution (∼60 m) digitalelevation model of topography. The inundation limits will accord-ingly express any diverting effects of the topography resulting inlocalized higher runups.
To evaluate the differential reliability for the Tsunami Risk Cat-egory II and III structures, the analysis is repeated with an increaseof aleatory uncertainty sigma of 0.36 (COV of 0.34) based on theinitial work by Thio et al. (2010). Tables 5 and 6 indicate the lowerreliabilities (increased risk) that result for exterior (perimeter) andinterior columns, when compared with Tables 3 and 4, respectively.
Fig. 5 summarizes the differential reliabilities as a function ofthe tsunami importance factors assigned to each tsunami risk cat-egory of structure, using the preceding results. For Tsunami RiskCategory III critical facilities, Tsunami Risk Category IV structures,and tsunami vertical evacuation refuge structures, site-specificanalysis is always required, so values of reliability for prescriptiveanalysis are not shown in Fig. 5. For other tsunami risk categories,site-specific analysis is permitted but not required, and thereforethe minimum reliabilities (increased probabilities of exceedance)would be considered to be associated with the requirements of theASCE 7 tsunami provisions for those categories.
Comparison with Seismic Reliabilities
The component reliabilities for the MCT rounded-off from thevalues of Table 3 for exterior beam–columns are compared tothe systemic reliabilities given for seismic Maximum ConsideredEarthquake (MCE) effects (Table 7). The 50-year service lifeanticipated reliabilities listed in Table 7 are based on average resultsof the integration of the conditional (onMCE) reliabilities with seis-mic hazard curves from the USGS (e.g., Luco et al. 2007). The con-ditional probabilities (probability of failure given the occurrence oftheMCE) are thought to be a better measure of seismic design intent
Table 5. Reliabilities for Representative Exterior Concrete Beam–ColumnMembers When Site Inundation Analysis Is Performed with CoarserTopographic Modeling With Greater Uncertainty
Site Measure of reliability
TsunamiRisk
Category II,I ¼ 1.0
TsunamiRisk
Category III,I ¼ 1.25
Crescent City,x ¼ 0.
Reliability index, β 2.94 3.04Pfannual 3.3 × 10⁻⁵ 2.3 × 10⁻⁵
Pf50-year (%) 0.17 0.12Crescent City,x ¼ 0.25xR.
Reliability index, β 2.75 2.83Pfannual 5.9 × 10⁻⁵ 4.6 × 10⁻⁵
Pf50-year (%) 0.30 0.23Crescent Cityx ¼ 0.50xR
Reliability index, β 2.72 2.87Pfannual 6.5 × 10⁻⁵ 4.1 × 10⁻⁵
Pf50-year (%) 0.32 0.20Huntington Beach,x ¼ 0
Reliability index, β 2.85 3.01Pfannual 4.4 × 10⁻⁵ 2.6 × 10⁻⁵
Pf50-year (%) 0.22 0.13Huntington Beach,x ¼ 0.25xR
Reliability index, β 2.78 2.86Pfannual 5.5 × 10⁻⁵ 4.2 × 10⁻⁵
Pf50-year (%) 0.27 0.21Huntington Beach,x ¼ 0.5xR
Reliability index, β 2.72 2.91Pfannual 6.6 × 10⁻⁵ 3.7 × 10⁻⁵
Pf50-year (%) 0.33 0.18Average ofthe sites
Reliability index, β 2.79 2.92Pfannual 5.4 × 10⁻⁵ 3.6 × 10⁻⁵
Pf50-year (%) 0.27 0.18Component failureconditioned onthe occurrenceof the MCT
Reliability index, β 1.44 1.66Probability offailure (%)
7.5 4.9
Note: The mean values are in boldface.
Table 6. Reliabilities for Representative Interior Concrete Beam–ColumnMembers When Site Inundation Analysis Is Performed with CoarserTopographic Modeling With Greater Uncertainty
Site Measure of reliability
TsunamiRisk
Category II,I ¼ 1.0
TsunamiRisk
Category III,I ¼ 1.25
Crescent City,x ¼ 0
Reliability index, β 2.75 2.89Pfannual 6.0 × 10⁻⁵ 3.8 × 10⁻⁵
Pf50-year (%) 0.30 0.19Crescent City,x ¼ 0.25xR
Reliability index, β 2.57 2.74Pfannual 1.0 × 10⁻⁴ 6.2 × 10⁻⁵
Pf50-year (%) 0.50 0.31Crescent City,x ¼ 0.50xR
Reliability index, β 2.63 2.68Pfannual 8.5 × 10⁻⁵ 7.3 × 10⁻⁵
Pf50-year (%) 0.43 0.37Huntington Beach,x ¼ 0
Reliability index, β 2.61 2.74Pfannual 9.1 × 10⁻⁵ 6.2 × 10⁻⁵
Pf50-year (%) 0.46 0.31Huntington Beach,x ¼ 0.25xR
Reliability index, β 2.57 2.74Pfannual 1.0 × 10⁻⁴ 6.2 × 10⁻⁵
Pf50-year (%) 0.51 0.31Huntington Beach,x ¼ 0.5xR
Reliability index, β 2.61 2.67Pfannual 9.0 × 10⁻⁵ 7.6 × 10⁻⁵
Pf50-year (%) 0.45 0.38Average ofthe sites
Reliability index, β 2.62 2.74Pfannual 8.8 × 10⁻⁵ 6.2 × 10⁻⁵
Pf50-year (%) 0.44 0.31Component failureconditioned onthe occurrenceof the MCT
Reliability index, β 1.10 1.32Maximum probability
of failure (%)13.6 9.3
Note: The mean values are in boldface.
© ASCE 04016092-9 J. Struct. Eng.
J. Struct. Eng., 04016092
Dow
nloa
ded
from
asc
elib
rary
.org
by
SOU
TH
ER
N C
AL
IFO
RN
IA U
NIV
ER
SIT
Y o
n 05
/31/
16. C
opyr
ight
ASC
E. F
or p
erso
nal u
se o
nly;
all
righ
ts r
eser
ved.

within economic feasibilities; otherwise, very large additional loadfactors would become necessary for earthquake design to achievethe same reliabilities as the nonextraordinary cases of dead andlive load design. There is no comparable structural seismic occu-pancy classification analogous to the tsunami vertical evacuationrefuge structure, so its seismic design follows Risk Category IV.
The MCT reliabilities for Tsunami Risk Categories II and III arefor the primary vertical load-carrying beam columns subjected tolateral tsunami loading, and not for the systemic (seismic) collapsemechanisms. Since in Alaska, Washington, and Oregon, the MCTis highly correlated to the occurrence of the offshore MCE in thesubduction zone, it is prudent for the MCT reliabilities for theperimeter frame to be somewhat greater than for the MCE alone,especially for taller structures. Coastal structures experiencing aMCE are likely to be damaged, but most modern seismic designsare expected to retain structural integrity and then receive the MCT.Risk-targeted ground motions are defined as those which, whenused to design buildings according to the ASCE standard areexpected to result in buildings having a systemic collapse proba-bility of 1% in 50 years. The 50-year service life probabilities oftsunami component failure of the exterior elements along the build-ing perimeter are less than the 1, 0.5, and 0.3% systemic collapseprobability in 50 years for Risk Category II, III, and IV structures,
respectively, that are the basis of the present-day risk-targetedmaximum considered earthquake ground motion maps and seismicimportance factors (Luco et al. 2007). The tsunami probabilities areconsistent with the occurrence of potentially life-endangering struc-tural component response, but the seismic probabilities are for themore severe occurrence of partial or total systemic collapse.
The risk-targeted maximum considered earthquake response(MCER) probabilistic analysis includes the accounting of epistemicuncertainties of the seismic source characterization through logictrees and structural system performance through fragility functions,and some aleatory uncertainty in characteristic moment magnitude(assumed to be distributed within �0.15; the seismic maps do nothave explicit accounting for aleatory uncertainty at the seismicsource other than the magnitude) and in the ground motion predic-tion (i.e., use of a standard deviation bias in the empirical attenu-ation equations). Therefore, there could be greater uncertainty inthe seismic systemic reliabilities given in Table 7.
Component Reliability versus System Reliability
There is an inherently strong bias in the design strength of thelateral-load-resisting system due to seismic requirements and theminimum height of the structure. Studies of steel and concretestructures have identified the beneficial effect of the seismic designrequirements for the lateral-force-resisting system capacity to resisttsunami loads (Chock et al. 2013). For example, the structuralheight of 19.8 m (65 ft) recommended for general applicabilityof the tsunami provisions for Tsunami Risk Category II buildingsin the Pacific Northwest provides this margin [Figs. 6(a and b)]against inundation depths of about 12.2 m (40 ft). In this figureof a prototypical example, the solid line represents the system in-elastic capacities for each height of building. The dashed curvesrepresent the hydrodynamic loading as inundation increases duringthe tsunami. Hydrodynamic drag assumes the buildings are 30%open (Chock et al. 2013). For these cases, it was assumed that theoverall shear on the lateral-load-resisting system governed ratherthan building overturning. Seismically designed masonry structuresshould be similar to the RC structures in this consideration. Thestructural steel moment frame is assumed to have member sizesjust sufficient to meet drift limitations. Due to flexibility that affectsthe natural period and prescribed loads, the total base shear capacitydoes not increase sharply with midrise height increases. This wouldimply that a material weight-optimized steel moment frame system
Fig. 5. Improvement in reliability due to reduction of uncertainty in analysis
Table 7. Anticipated Reliabilities (Maximum Probability of Failure) forEarthquake and Tsunami
Risk category
Probability of failurea
in 50 years (%)
Failurea probabilityconditioned on
maximum consideredevent (%)
Earthquake TsunamiEarthquake(MCE)
Tsunami(MCT)
II 1 0.3 10 7III 0.5 0.2 5–6 4–5IV 0.3 0.1 2.5–3 2.5–3Vertical evacuationrefuge structures
0.3 <0.1 2.5–3 0.5–1
aTsunami probabilities are based on exceeding an exterior structuralcomponent’s capacity that does not necessarily lead to widespreadprogression of damage, but the seismic probabilities are for the moresevere occurrence of partial or total systemic collapse; probabilities forlife-threatening seismic response are greater than shown in this figure;see ASCE 7-16.
© ASCE 04016092-10 J. Struct. Eng.
J. Struct. Eng., 04016092
Dow
nloa
ded
from
asc
elib
rary
.org
by
SOU
TH
ER
N C
AL
IFO
RN
IA U
NIV
ER
SIT
Y o
n 05
/31/
16. C
opyr
ight
ASC
E. F
or p
erso
nal u
se o
nly;
all
righ
ts r
eser
ved.

may need some increased capacity beyond the prescriptive mini-mum seismic demand, if located in a site with severe inundationdepths greater than about 40 ft.
Midrise to high-rise buildings, which are necessary for tsunamisafety where evacuation cannot be completely assured, can be eco-nomically designed for life safety or better performance for largetsunamis with local strengthening of relatively few components.To do similar comparisons for Tsunami Risk Category III andIV structures, the comparison would also include accounting forthe seismic importance factor increase of seismic capacity, whichwould shift the capacity curves to the right by factors of 1.25 and1.50, respectively, and provide more of a margin against tsunamiforces. Accordingly, Risk Category III and IV structures will have alower threshold height of structural parity between the systemicstrength for lateral forces acquired through the seismic provisionsand the resistance necessary for sustained tsunami lateral forces.
Conclusions
The values of tsunami importance factors have been analyticallydetermined from the target structural reliabilities, which were cal-culated using Monte Carlo simulation involving a large number oftrial combinations of random variables independently occurring inproportion to their statistical distributions for the demand param-eters of fluid density, closure ratio, energy grade line momentum
flux, inundation depth hazard, and the aleatory uncertainty ofinundation depth. Reliability analysis was performed for bothexterior and interior gravity-load-carrying vertical beam–columnssubject to lateral tsunami loading. Failures of exterior columns aremore commonly observed in posttsunami investigations, and this isconsidered the more practical case of application of the reliabilityanalysis for the reasons discussed in this paper. Target structuralcomponent reliabilities given in case the maximum consideredtsunami (MCT) has occurred are similar to seismic systemic per-formance reliabilities given in case the maximum consideredearthquake (MCE) has occurred. These reliability estimates arepredicated on the assumption that the load combinations withtsunami as the primary load effect would govern the design ofthe members. In actual structures, the reliabilities of various mem-bers may be governed by a variety of load effects. In ASCE 7-16, itis stated that structural components designed with performance-based procedures shall be demonstrated using an analysis to pro-vide a reliability not less than the target reliabilities. Therefore, therecommended tsunami target structural reliability values are givenin the last row of Table 8, for use in performance-based engineeringof structural components designed to meet the intent of ASCE7-16, Chapter 6 (“Tsunami Loads and Effects”).
For Tsunami Risk Category II, a tsunami importance factorof 1.0 results in a structural component limit-state capacity condi-tional exceedance probability of approximately 7.5% (MCT).
(a) (b)
Fig. 6. (a) Comparisons of seismic base shear capacity and overall tsunami shear force for concrete structural walls, with increasing building heightand tsunami depth on the vertical axis; (b) comparisons of seismic base shear capacity and overall tsunami shear force for steel moment-resistingframes designed for maximum permissible seismic drift, with increasing building height and tsunami depth on the vertical axis
Table 8. Summary of Target Reliabilities of the ASCE 7 Tsunami Design Provisions
Basis Measure of reliability
TsunamiRisk
Category II,I ¼ 1.0
TsunamiRisk
Category III,I ¼ 1.25
TsunamiRisk
Category IV,I ¼ 1.25
Tsunamivertical evacuationrefuge RC IV,
I ¼ 1.25 and 1.3hn
Average reliabilities Reliability index, β 2.74 2.87 3.03 3.68Pf50-year (%) 0.31 0.21 0.13 0.05
Component failure conditionedon the occurrence of the MCT
Reliability index, β 1.44 1.65 1.92 2.43Probability of component failure (%) 7.5 5 3 < 1
Note: The mean values are in boldface.
© ASCE 04016092-11 J. Struct. Eng.
J. Struct. Eng., 04016092
Dow
nloa
ded
from
asc
elib
rary
.org
by
SOU
TH
ER
N C
AL
IFO
RN
IA U
NIV
ER
SIT
Y o
n 05
/31/
16. C
opyr
ight
ASC
E. F
or p
erso
nal u
se o
nly;
all
righ
ts r
eser
ved.

ASCE 7 gives a conditional failure probability of 10% (MCE) forcollapse of the lateral-force-resisting system during an earthquake.
For Tsunami Risk Category III, a tsunami importance factorof 1.25 results in a structural component limit-state capacityconditional exceedance probability of approximately 5% (MCT).ASCE 7 gives a conditional failure probability of 5–6% (MCE)for collapse of the lateral-force-resisting system during anearthquake.
For Tsunami Risk Category IV, a tsunami importance factor of1.25 and site-specific inundation analysis results in a structuralcomponent limit-state capacity conditional exceedance probabilityof approximately 3% (MCT). ASCE 7 gives a conditional failureprobability of 2.5–3% (MCE) for collapse of the lateral-force-resisting system during an earthquake.
For tsunami vertical evacuation refuge structures, the tsunamiimportance factor of 1.25 and site-specific inundation analysis,combined with the prescriptive requirement to use a 1.3 factor onthe site-specific inundation depth, results in a structural componentlimit-state capacity conditional exceedance probability of less than1% (MCT). ASCE 7 gives a conditional failure probability of2.5–3% (MCE) for collapse of the lateral-force-resisting system ofRisk Category IV structures during an earthquake.
This analysis indicates that the new ASCE 7 tsunami design pro-visions will result in a design with a level of reliability for structuralcomponents generally equivalent to or exceeding the targeted reli-abilities for other types of extraordinary loadings such as maximumconsidered earthquake events.
Acknowledgments
The support of the American Society of Civil Engineers, StructuralEngineering Institute, and the Coasts, Oceans, Ports, and RiversInstitute, towards the development of the tsunami design provisionsin ASCE 7-16 by the Tsunami Loads and Effects Subcommittee isgratefully acknowledged.
References
ASCE/SEI (Structural Engineering Institute). (2016). “Minimum designloads for buildings and other structures.” ASCE/SEI 7-16, Reston, VA.
California Geological Survey. (2015). “Evaluation and application of prob-abilistic tsunami hazard analysis in California.” Special Rep. 237,Sacramento, CA.
Carden, L., Chock, G., Yu, G., and Robertson, I. N. (2015). “The newASCE tsunami design standard applied to mitigate Tohoku tsunamibuilding structural failure mechanisms.” Handbook of coastal disastermitigation for engineers and planners, M. Esteban, H. Takagi, andT. Shibayama, eds., Butterworth-Heinemann (Elsevier), Waltham, MA.
Chock, G. (2015). “The ASCE 7 tsunami loads and effects design standardfor the U.S.” Handbook of coastal disaster mitigation for engineers andplanners, M. Esteban, H. Takagi, and T. Shibayama, eds., Butterworth-Heinemann (Elsevier), Waltham, MA.
Chock, G. (2016). “Design for tsunami loads and effects in the ASCE 7-16standard.” J. Struct. Eng., in press.
Chock, G., Carden, L., Robertson, I., Olsen, M., and Yu, G. (2013).“Tohoku tsunami-induced building failure analysis with implicationsfor U.S. tsunami and seismic design codes.” Earthquake Spectra,29(S1), S99–S126.
Ellingwood, B. (1977). “Statistical analysis of RC beam-column interaction.”J. Struct. Div., 103(ST7), 1377–1388.
Ellingwood, B., Galambos, T. V., MacGregor, J. G., and Cornell, C. A.(1980). “Development of a probability based load criterion forAmerican national standard A58.” National Bureau of Standards,Washington, DC.
Luco, N., Ellingwood, B. R., Hamburger, R. O., Hooper, J. D., Kimball,J. K., and Kircher, C. A. (2007). “Risk-targeted versus current seismicdesign maps for the conterminous United States.” Structural EngineersAssociation of California Annual Conf. Proc., Structural EngineersAssociation of California, Sacramento, CA, 163–175.
Lynett, P., and Liu, P. (2011). “Numerical simulation of complex tsunamibehavior.” Comput. Sci. Eng., 13(4), 50–57.
Robertson, I. N. (2016). “Tsunami loads and effects: Guide to the tsunamidesign provisions of ASCE 7-16.” ASCE, Reston, VA.
Thio, H. K., Somerville, P., and Polet, J. (2010). “Probabilistic tsunamihazard in California, Pacific earthquake engineering research center.”PEER Rep. 2010/108, Univ. of California, Berkeley, CA.
© ASCE 04016092-12 J. Struct. Eng.
J. Struct. Eng., 04016092
Dow
nloa
ded
from
asc
elib
rary
.org
by
SOU
TH
ER
N C
AL
IFO
RN
IA U
NIV
ER
SIT
Y o
n 05
/31/
16. C
opyr
ight
ASC
E. F
or p
erso
nal u
se o
nly;
all
righ
ts r
eser
ved.