tar analysis methods for small scale gasification...
TRANSCRIPT
Tar analysis methods for small scale gasification systems
Klas Engvall KTH Royal Institute of Technology
Dept. of Chemical Engineering and Technology
Stockholm, Sweden
…from a KTH perspective…

2
Outline
• Background • Tar analysis in a small scale gasification system - Offline methods
o “Conventional” tar analysis o Solid Phase Absorption (SPA) o SPME
- Online methods o FID o PID
- What is the conclusion?
• Summary

3
Background

4
Small scale gasification systems
Gasifica'on700-1000°C
GascleaningRemoval:• Par2cles• Tars
Air
Biomass
Pretreatment• Drying• Grinding• Sizing
CHP
Hightar(5-50g/Nm3)
LowtarInternalcombus2onengine:<50mg/Nm3Gasturbines(directlyfired):<5mg/Nm3

5
Challenge biomass gasification tars
§ Production of condensable polyaromatic “tars” is inherent in most biomass gasification processes
§ Tars foul and can plug equipment downstream of the gasifier
§ Challenging to remove from the produced gas
§ Reduce energy efficiency of gasification process
§ Reports of as much as 10 % of biomass carbon ending up in the form of tars
5
6
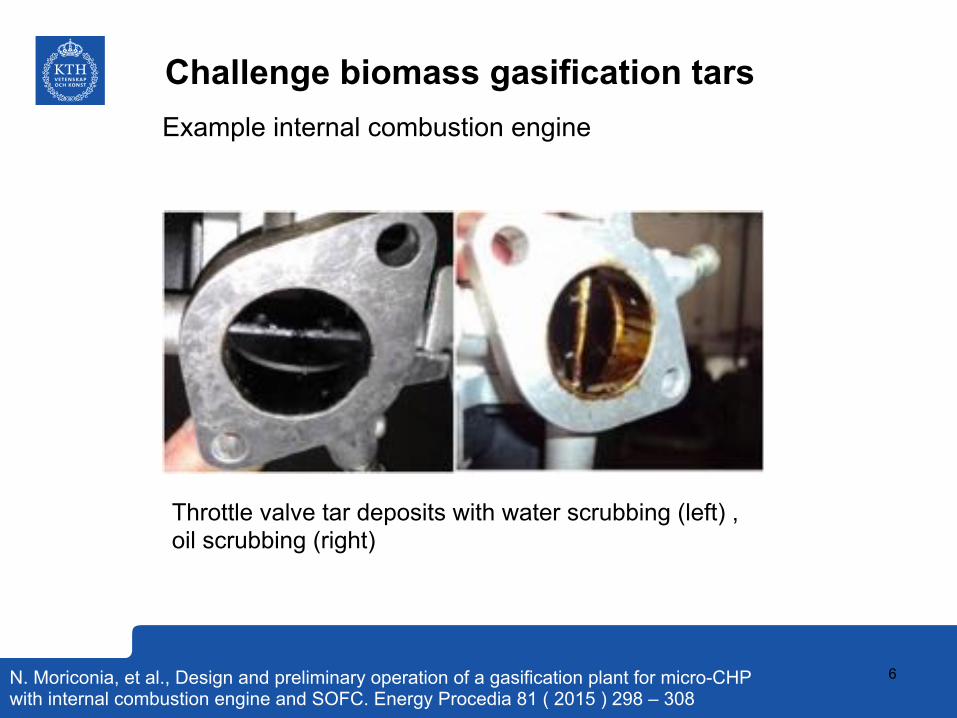
Challenge biomass gasification tars Example internal combustion engine
Throttle valve tar deposits with water scrubbing (left) , oil scrubbing (right)
N. Moriconia, et al., Design and preliminary operation of a gasification plant for micro-CHP with internal combustion engine and SOFC. Energy Procedia 81 ( 2015 ) 298 – 308

7
What is tar?
The term "tar" is vague and the definition vary. One definition is "organic molecules with a molecular weight higher than that of benzene� (Mw = 78 g/mol).

8
What is tar?
Light tars Organic compounds that can be analysed with GC as well as HPLC. (Mw 79-300 g/mol). They are volatile and semi-volatile aromatics and phenolics. Heavy tar Organic compounds with so high boiling points that they can be analysed only by HPLC, not with GC. They are mixtures of high molecular weight �non-volatile� polar compounds (Mw ≈>300 g/mol) Total tar = sum of light and heavy tar

9
What is tar?
Oxygenated compounds
Phenoliccompounds and olefins
Polycyclic aromatic compounds

10
General scheme tar analysis
A few common steps: 1. Sampling of the tar: Generally collected from a side stream,
including more or less complicated sampling equipment to attain a representative sample.
2. Storage of sample: Only valid for offline methods. 3. Pre-preparation/conditioning of the sample:
Offline methods: The collected tars are extracted to or dissolved in an appropriate solvent for further chemical analysis. Online measurements: Conditioning such as drying of gas removal of particulates etc. may be required depending on the analytical technique.
4. Analysis of sample: Chemical analysis of pre-prepared/conditioned tar sample. Most common analytical techniques are based on gas chromatography (GC) or high pressure liquid chromatography (HPLC).
11
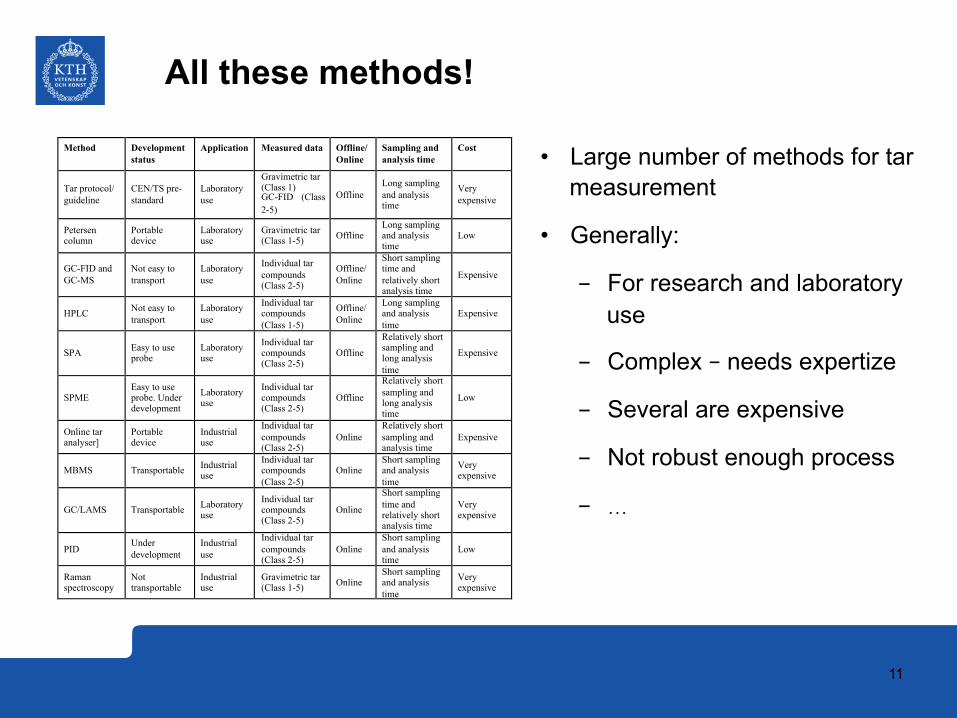
All these methods!
Method Development status
Application Measured data Offline/ Online
Sampling and analysis time
Cost
Tar protocol/ guideline
CEN/TS pre-standard
Laboratory use
Gravimetric tar (Class 1) GC-FID (Class 2-5)
Offline Long sampling and analysis time
Very expensive
Petersen column
Portable device
Laboratory use
Gravimetric tar (Class 1-5) Offline
Long sampling and analysis time
Low
GC-FID and GC-MS
Not easy to transport
Laboratory use
Individual tar compounds (Class 2-5)
Offline/ Online
Short sampling time and relatively short analysis time
Expensive
HPLC Not easy to transport
Laboratory use
Individual tar compounds (Class 1-5)
Offline/ Online
Long sampling and analysis time
Expensive
SPA Easy to use probe
Laboratory use
Individual tar compounds (Class 2-5)
Offline
Relatively short sampling and long analysis time
Expensive
SPME Easy to use probe. Under development
Laboratory use
Individual tar compounds (Class 2-5)
Offline
Relatively short sampling and long analysis time
Low
Online tar analyser]
Portable device
Industrial use
Individual tar compounds (Class 2-5)
Online Relatively short sampling and analysis time
Expensive
MBMS Transportable Industrial use
Individual tar compounds (Class 2-5)
Online Short sampling and analysis time
Very expensive
GC/LAMS Transportable Laboratory use
Individual tar compounds (Class 2-5)
Online
Short sampling time and relatively short analysis time
Very expensive
PID Under development
Industrial use
Individual tar compounds (Class 2-5)
Online Short sampling and analysis time
Low
Raman spectroscopy
Not transportable
Industrial use
Gravimetric tar (Class 1-5) Online
Short sampling and analysis time
Very expensive
• Large number of methods for tar measurement
• Generally:
- For research and laboratory use
- Complex – needs expertize
- Several are expensive
- Not robust enough process
- …

12
What method to use?
• Depends on information desired! - Qualitative or quantitative information? - Information about chemical composition? - R&D or industrial monitoring?
• Reliability? • Costs? • …
Gasifica'on700-1000°C
GascleaningRemoval:• Par2cles• Tars
Air
Biomass
Pretreatment• Drying• Grinding• Sizing
CHP
Hightar(5-50g/Nm3)
LowtarInternalcombus2onengine:<50mg/Nm3Gasturbines(directlyfired):<5mg/Nm3
13
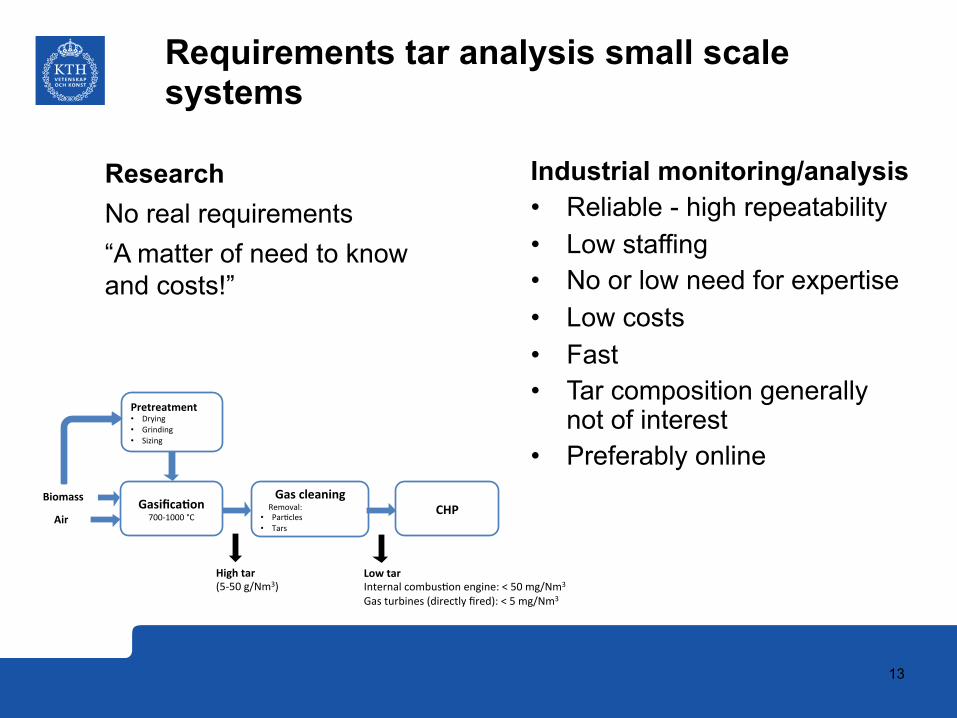
Requirements tar analysis small scale systems
Research No real requirements “A matter of need to know and costs!”
Gasifica'on700-1000°C
GascleaningRemoval:• Par2cles• Tars
Air
Biomass
Pretreatment• Drying• Grinding• Sizing
CHP
Hightar(5-50g/Nm3)
LowtarInternalcombus2onengine:<50mg/Nm3Gasturbines(directlyfired):<5mg/Nm3
Industrial monitoring/analysis • Reliable - high repeatability • Low staffing • No or low need for expertise • Low costs • Fast • Tar composition generally
not of interest • Preferably online

14
Tar analysis in a small scale gasification system

15
Offline methods “Conventional” tar analysis
Tar protocol developed over several projects supported by IEA Bioenergy Task 33, US DOE and European Commission 1998-2005
• Significant contributions by ECN, VTT, KTH, DTI, BTG, NREL
Adopted as CEN standard for tar sampling
CSN P CEN/TS 15439 - Biomass gasification - Tar and particles in product gases - Sampling and analysis (2006).

16
Offline methods “Conventional” tar analysis
Procedure
• Draw specific volume of process gas through a filter and then a series of cold impingers to collect the tars
• Evaporate solvent to measure gravimetric (total) tars
• Analyze tars by GC-MS to evaluate composition
Quantitative, but very laborious
17
Offline methods
• SPA sampling and analysis method was developed by KTH in the 1990’s.
• SPA used for measurement of the concentration (mass) of individual light aromatic hydrocarbons and phenols.
• The SPA-method is restricted to GC-available (GA) compounds only.
• These compounds are, however, significant process markers that provide good measures of reactor performance and gas quality.
• At T = 900°C and above the GA-compounds roughly correspond to the total tar amount.
ClaesBrage,QizhuangYu,GuanxingChen,KristerSjöström,“UseofaminophaseadsorbentforbiomasstarsamplingandseparaAon”,FuelVol.76,No.2,pp.137-142,1997.
Solid Phase Adsorption (SPA)

18
Offline methods Solid Phase Adsorption (SPA)
1
2
3
4 5
6
78
910
11
Solid Phase Extraction (SPE) NH2 tube
1 = to syringe or electrical pump; 2 = adapter (polypropylene); 3 = sample reservoir; 4 = sorbent tube (PP, 1.3 OD x 7.5 cm); 5 = fritted disc (20 mm polyethylene); 6 = amino-phase sorbent (40 mm, 60 Å); 7 = rubber/silicone septum; 8 = septum retainer (polypropene); 9 = �Tee�-adapter (glass); 10 = syringe needle (stainless steel); 11 = producer gas.

19
Offline methods Solid Phase Adsorption (SPA)
a temperature of 300 8C.The SPA sampleswere analysed by aSHIMADZUQP5000GCMSwith aWCOT fused silica column.A typical chromatogramof the inlet tar is shown in Fig. 4.Several samples were taken at the same operating condition and the average value ispresented here. Concentrations of individual tar compoundswere calculated inmg m0
K3 andthen added to get the concentration of a particular tar class. The tar compounds that wereconsidered for a particular class are tabulated in Table 1. Concentrations of compoundswitha higher boiling point than pyrenewere determined using the calibration data of pyrene. Theheaviest compound identified was benzofluoranthene. Benzene is not considered as tar.Light tar, e.g. toluene, was identified, but could not be measured quantitatively accurately,especially at lower temperature. So toluene was not taken into account during total tarcalculation, but presented separately. Very highmolecular weight (class 1) tars and final gascomposition could not be measured due to experimental limitations.
3.3. Catalyst characterisation
Two types of additives, olivine and dolomite were tested during these experiments.Calcined dolomite is a porous catalyst; its large (internal) surface area and the presence ofoxides in its matrix (CaO, MgO) make it an active catalyst with respect to tar reduction.Olivine isanaturallyoccurringsilicatemineral inwhichmagnesiumandironareembeddedinthe silicate tetrahedral [10]. The properties of both the additives are tabulated in Table 3. TheBET surface area has been measured by chemisorption with ASAP. Olivine is a nonporousmaterial as it has an extremely low surface area. Results ofmercury porosimetry for calcineddolomite are included in Table 3 as well, for olivine mercury porosimetry could not be done
Fig. 4. Typical chromatogram found with GC/MS analysis (inlet tar concentration).
L. Devi et al. / Renewable Energy 30 (2005) 565–587572
Sampling Sample preparation
Chemical analysis Results
�T�, needle, SPE-NH2 tube and 100 ml syringe.
Custom made reversible SPE tube.
Sampling of 100 ml in 1 min.
The SPE tube is capped in both ends after sampling.
Samples stored in a fridge/freezer
Sample storage
Elution for aromatic and phenolic compounds
GC-FID - Gas chromatograph with flame ionisation detection
Detection limit: 2.5 mg/Nm3 (for detectable tars)
20
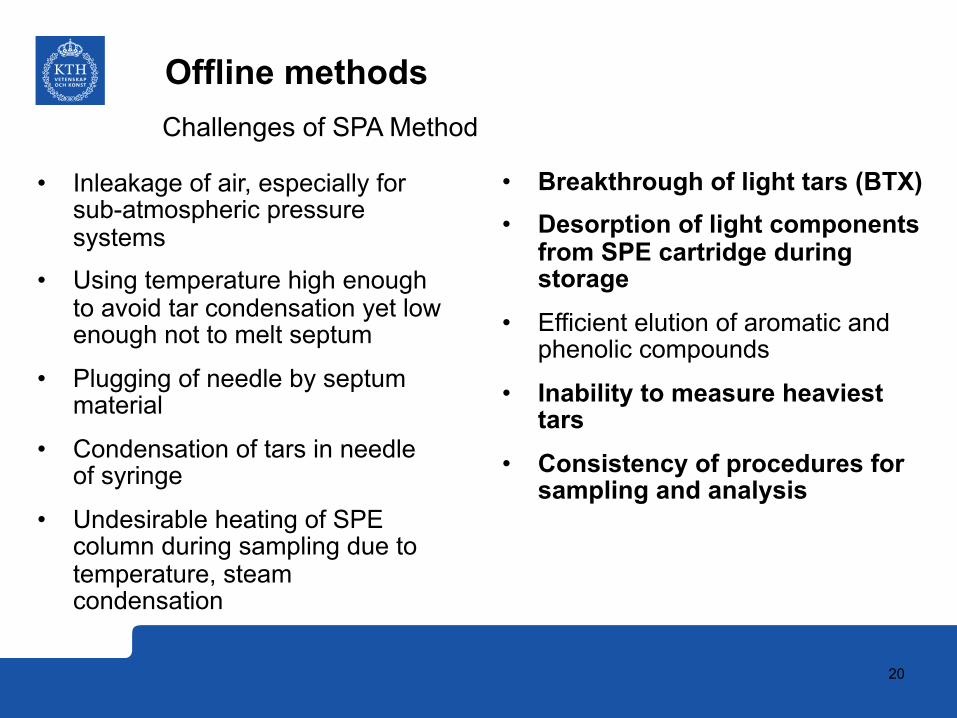
Offline methods Challenges of SPA Method
• Inleakage of air, especially for sub-atmospheric pressure systems
• Using temperature high enough to avoid tar condensation yet low enough not to melt septum
• Plugging of needle by septum material
• Condensation of tars in needle of syringe
• Undesirable heating of SPE column during sampling due to temperature, steam condensation
• Breakthrough of light tars (BTX) • Desorption of light components
from SPE cartridge during storage
• Efficient elution of aromatic and phenolic compounds
• Inability to measure heaviest tars
• Consistency of procedures for sampling and analysis

21
Offline methods
A (biased?) comparison between SPA and “Tar guideline”
Coldsolventtrapping(CST)(�Targuideline�)
Advantages:- Givestotaltar,heavyandlighttar
Drawbacks:- Timeconsuming,samplingaswellasanalysis
- Largesolventvolumes
- Notsuitablefor(very)lowtarconcentraAons
- Lowprecision
Tradi;onalSPA(“KTH”)
Advantages:- Uncomplicatedandfastsampling
- Lowcost
- Highaccuracyandreproducibility
- Samplingandanalysiscanbedoneseparately
Drawbacks:- Notsuitableforheavytars
- B(TX)mustbeanalysedwithinafewhours

22
Offline methods SPA analysis at low tar concentrations and separate BTX analysis (KTH)
Determination of light tar in low concentrations
AdsorbentforBenzene,TolueneandXylene(BTX)
Pump Flowmeter
Adsorbentforothercompounds
Needle
Sampleinlet
“A few other variants exists, e.g. Chalmers and ECN”
Claes Brage*, Qizhuang Yu and Krister Sjöström, A New Method for the Analysis of Heavy Tar in Raw Producer Gases from biomass Gasifiers, 15th European Biomass Conference & Exhibition, 7-11 May 2007, Berlin, Germany
23
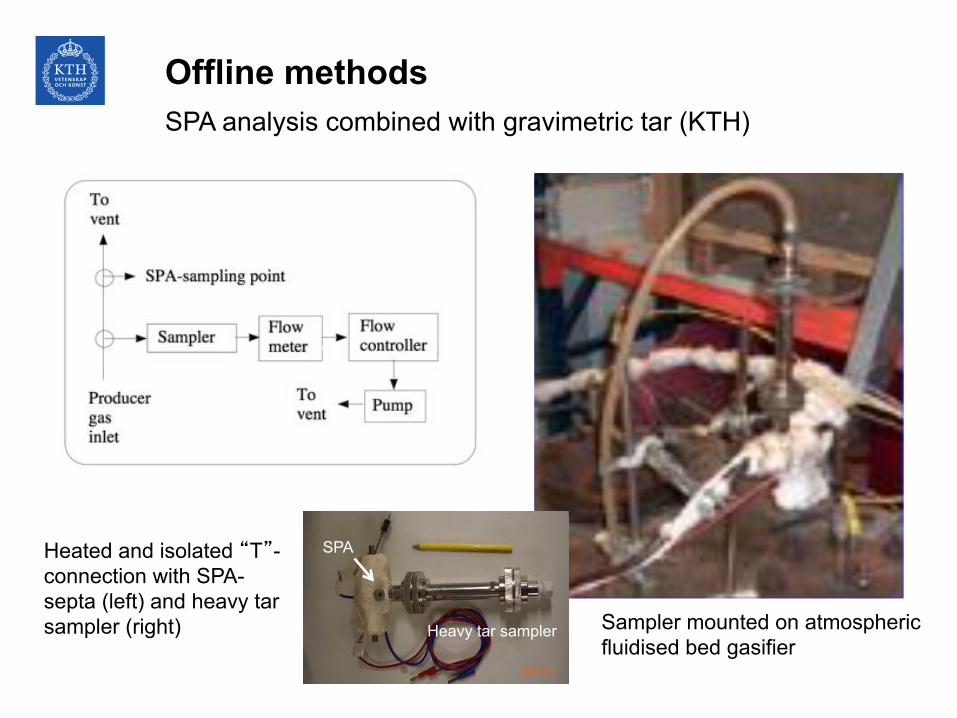
Offline methods SPA analysis combined with gravimetric tar (KTH)
Sampler mounted on atmospheric fluidised bed gasifier
Heated and isolated �T�-connection with SPA-septa (left) and heavy tar sampler (right)
SPA
Heavy tar sampler

24
Offline methods Solid Phase Micro Extraction (SPME)
Experimental set-up KTH
Gasifier Hot$gas$filter
Catalyst
!!°C !!°C
Exhaust Exhaust
Insulation
Heating(tape
SPME device
• Method under development • Extraction of analytes from a sample matrix onto a stationary phase
(non polar) - silica fibre with 50 µm polydimethylsiloxane (PDMS) • Desorption of the analytes in an analytical instrument (GC). • Developed for low tar content analysis in e.g. syngas applications

25
Offline methods
• Tests on real gas with sampling time 10 min. • The results showed that SPME method is a fast and accurate for low tar
concentrations • Analysis at trace levels below 0.1 mg/Nm3 (e.g., syngas production) will be
possible at 60 °C for all compounds heavier than naphthalene
Solid Phase Micro Extraction (SPME)
Brisk report, Advanced measurement methods and operational procedures in thermochemical biomass conversion, D 7.6 Protocols/standards for tar measurement.
26
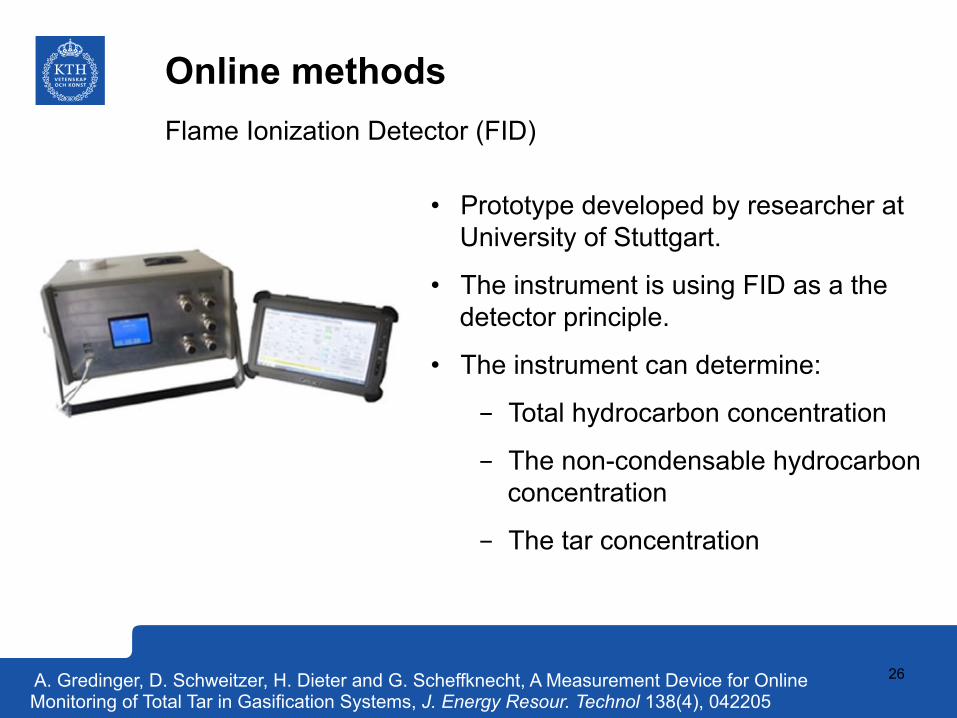
Online methods Flame Ionization Detector (FID)
• Prototype developed by researcher at University of Stuttgart.
• The instrument is using FID as a the detector principle.
• The instrument can determine:
- Total hydrocarbon concentration
- The non-condensable hydrocarbon concentration
- The tar concentration
A. Gredinger, D. Schweitzer, H. Dieter and G. Scheffknecht, A Measurement Device for Online Monitoring of Total Tar in Gasification Systems, J. Energy Resour. Technol 138(4), 042205

27
Online methods Flame Ionization Detector (FID)
Measurement principle: Difference measurement of the organically bound carbon in the sample gas of two sample loops with equal volume.
Sampling phase Analyzing phase

28
Online methods Flame Ionization Detector (FID)
General impression: • Easy to use • Provide accurate results in comparison with ”Tar protocol” • The choice of a suitable tar filter material for the difference measurement was
identified as one of the major challenges to gain realistic results.
Total hydrocarbon
Tar concentration
Non-condensable hydrocarbons

29
Online methods Photo Ionization Detector (PID)
A molecule with an ionization potential (IP) lower than the actual energy (E = hν) of a photon is ionized.
Energy required to remove an electron is different for each compound.
Typical tar compounds require relatively little energy
Possibly a selectivity can be achieved.
”Method under development at KTH”

30
Online methods Photo Ionization Detector (PID)
32
Figure 17. Compounds detectable by xenon lamp (8.4 eV)
The sensor consists of a sealed ultraviolet light source. Emitted photons have a high energy level, which is enough to ionize many trace organics, but not enough for ionizing air (e.g. nitrogen, oxygen, carbon dioxide). Molecules of compounds arrive into the ionization chamber of the detector after passing through the sampling line. The ionization chamber contains a pair of electrodes, the bias electrode and the collector electrode. When a positive potential is applied to the bias electrode, an electromagnetic field is created in the chamber. Vaporized ions formed by the adsorption of photons are driven to the collector electrode. The ion current is then measured and displayed on a meter 29. Many different molecules will be simultaneously detected and the PID signal will therefore represent the total signal from all simultaneously excited compounds.
Not detectable Detectable Energy of the light depends on the gas inside the lamp Xenon = 8.4 eV Aromatic compounds with IP < 8.4 eV can be detected, e.g.: • Naphthalene • Acenaphthene • Flourene • Anthracene • Pyrene
(eV)

31
Online methods
Schematics of the tar measurement system for real gas tests at BTG
response time of the PID signal depends only on the gas volumefrom the sample point to the outlet of the ionization chamber. By
introducing more narrow tubing and a smaller ionization chamberthe response time will decrease even further. This will however
COMBUSTOR
GASIFIERAIR
FEED
SANDCHARASH
HOTSAND
FLUIDISATION AIR
RISER AIR
CATALYTICBED
TO PID DETECTOR
FLUE GAS
ASHVESSEL
FIRST STAGE
SECOND STAGE
Fig. 5. The experimental set-up used for testing of the PID analyzer at real conditions. The PID sampling point is indicated in the figure.
Fig. 6. Result from an exploratory test with naphthalene. The temperature of the saturation chamber was 52 !C, corresponding to a concentration of naphthalene of 2.35 lg/ml in the gas.
116 M. Ahmadi et al. / Fuel 113 (2013) 113–121
Photo Ionization Detector (PID)
PID in a real gas stream
Ahmadi M, Knoef H, Van de Beld B, Liliedahl T, Engvall K (2013) Development of a PID based on-line tar measurement method - Proof of Concept. Fuel 113: 113-121.

32
Online methods
• The PID signal follows the SPA signal at almost all different tar levels
• Both real gas and naphthalene PID signal shows a linear correlation comparing with SPA tar content
which always exist for real gasifiers, especially, in the small scale.Fig. 12 shows the continuous PID response and the average totaltar concentration measured with SPA. The oxygen availability,lambda (k), in the gasification stage is also included in the graph.Lambda is defined as the ratio between the available oxygen andthe oxygen needed for complete combustion of combustible com-pounds. The two graphs agree well apart from the third step whenthe SPA measurements record a decrease in tar from the previousstep. This is counterintuitive and the PID is not confirming this de-crease. Furthermore, there were indications of faulty SPA measure-ments as the high molecular compound pyrene was not detected inthis step. The concentration of pyrene was steadily increasing inthe two preceding steps. As mentioned previously, the PID re-sponse is not necessarily following the total tar concentration,since the response factor is not the same for all tar components.In this case, naphthalene is the most important tar componentboth due to the strong response and the relatively high concentra-tion. In Fig. 13, a direct comparison can be made between the PIDsignal and the concentration of naphthalene and total tar. The PIDsignal is following the naphthalene concentration thoroughly
down to a k = 0.13. At k < 0.13, an exponential increase of the PIDsignal was observed whereas the same type of increase was not ob-served for naphthalene and total tar until k < 0.07. The discrepancybetween the tar concentration and the PID signal can be explainedby a dramatic increase of the benzene concentration observed atk < 0.13. Since benzene is not defined as a tar it was not includedin the total tar concentration. The PID used in this experiment de-tects benzene since it is equipped with a 9.5 eV light source. It canhowever be concluded that the same general behavior displayed bythe tar concentration was also observed in the PID data, which is avery positive result for a successful validation of the PID method.
A comparison of the PID response from the test with naphtha-lene and the real producer gas, shown in Fig. 14, reveals that thePID response is much stronger for naphthalene compared to thereal producer gas. This was expected as naphthalene has the stron-gest response factor, as observed in Fig. 7, in the present work andalso in the previous work [12]. Since real producer gas consists ofseveral other tar components besides naphthalene, the PID re-sponse will be lower for a producer gas. This is not a problem forthe PID method under the condition that the composition of the
Fig. 12. The PID signal and total tar versus time in gasification tests using different k values.
Fig. 13. The obtained total tar and naphthalene concentration and PID signal at different equivalence ratios. Naphthalene ðHÞ, PID signal (N), and total tar (d).
M. Ahmadi et al. / Fuel 113 (2013) 113–121 119
Photo Ionization Detector (PID)
PID in a real gas stream
”Faulty SPA”
tar compounds remains similar with varying total tar concentra-tion. The correlation between the PID response and the total tarconcentration observed in this case is not perfectly linear and isnot going through zero in the graph, as is displayed in Fig. 15. Ingeneral, the naphthalene concentration is coming much closer todescribe the behavior of the PID response. The reason for this ismost likely that the different tar compounds have different PID re-sponse. Since naphthalene has the strongest response measured inthis work and previous work [12], it is logical that the PID responseis mainly governed by the naphthalene concentration. The naph-thalene concentration is thus serving as an indicator of the totaltar content, which for this gasifier gives satisfying results. It cantherefore be concluded that the new on-line tar analysis methodbased on PID is validated for this particular gasifier. Further workis needed to validate the method in a wider sense but this mustbe considered as a very promising first step for a general accep-tance of the tar analysis method studied in this work. Some calibra-tion and modification have to be done to validate the on-line taranalysis method for other types of gasifiers with differentfeedstock.
The SPA method used for validation of the new on-line tar anal-ysis method enables only analysis of the light tars. Gravimetric tar(heavy tar) compounds, which are not detectable with GC, cannot
be analyzed with SPA. This may not be an issue since the experi-ment part of this work has been carried out at a temperature of800–900 !C under isothermal conditions. Data from our laboratorysuggests that the amount of gravimetric tar is not detectable underthese process conditions [16].
5. Conclusions
Proof of concept has been made for an on-line tar measurementmethod based on photo ionization detection (PID). The main appli-cation area of this method will be process control in gasificationprocesses in order to minimize problems normally associated withtar. Important factors for the analysis method related to this appli-cation have been identified and examined. The factors identified inthis study were response time, quantitative and qualitative infor-mation from the analysis and the robustness of the method. The re-sponse time, when changing tar concentration, was found to be afew seconds, which would make the method suitable for givingfeed-back to a process control system. The quality of the quantita-tive data obtained from the method is very high for individual tarmodel compounds. The method is very sensitive to low concentra-tions of tar and linear response, when increasing the concentrationis kept to very high tar concentrations, which make quantificationstraight-forward. A drawback of the analysis method is the limita-tions in quantifying individual compounds in a mixture of tar com-pounds. However, in the present work it has been demonstratedthat this is not necessarily a major issue when analyzing real pro-ducer gas, since the concentrations of most tar compounds are re-lated to the total tar concentration. A reasonably good correlationbetween the total tar concentration and the PID response wastherefore found for the gasifier studied in the present work. Qual-itative information from the analysis will not allow for identifica-tion of individual tar compounds. The response of PID is,however, selective in that only tar compounds are detected, pro-vided that a suitable UV-light source is chosen. Tests of the robust-ness showed that the window of the excitation chamber needsperiodic cleaning due to fouling, which causes the PID responseto decrease. The duration between cleaning cycles will dependon the composition of the analyzed gas, but a few hours up to aday appears to be reasonable at this point.
Sensitivity analysis, investigated parameters, such as intensityof the UV-light source, temperature of the excitation chamberand flow rate of the gas passing the excitation chamber. It wasshown that the intensity of the UV-light is directly influencingthe PID response, where higher intensity gives higher response.Increasing the temperature of the excitation chamber leads to alower PID response, which is proportional to the decrease of thegas density. The PID response is independent of the gas flowthrough the excitation chamber.
In conclusion, the on-line tar analysis method is very promisingfor use in process control of gasification processes. The analysismethod was successfully validated against a well-accepted off-lineanalysis method. There are, however, still some issues left to exam-ine before this method could be commercially feasible. The mostimportant issue in our opinion is how to handle the fouling ofthe excitation chamber window.
References
[1] Han J, Kim H. The reduction and control technology of tar during biomassgasification/pyrolysis: an overview. Renew Sustain Energy Rev2008;12:397–416.
[2] Hasler P, Salzmann R, Kaufmann HP, Nussbaumer T. Method for the samplingand analysis of particles and tars from biomass gasifiers. In: Kopetz H et al.,editors, Biomass for energy and industry. Proceedings of the 10th Europeanconference and technology exhibition, CARMEN, Rimpar, Germany; 1998. p.1600–3.
Fig. 14. Correlation of the real tar and naphthalene concentration with the PIDsignal. Real tar compounds (j) and naphthalene (N).
Fig. 15. Tar concentration measured with SPA as a function of PID signal from testswith real producer gas. Total tar (j) and naphthalene ðIÞ.
120 M. Ahmadi et al. / Fuel 113 (2013) 113–121Real gas stream vs pure naphthalene stream
Real gas
Naphthalene

33
Online methods Photo Ionization Detector (PID)
Some observations:
• Different response curves of the compounds will make quantification less accurate during analysis of real producer gas
• Fouling of UV lamp window with time is an issue.
• PID prototype test system developed to address the window fouling problem
• Prototype tests in progress
34
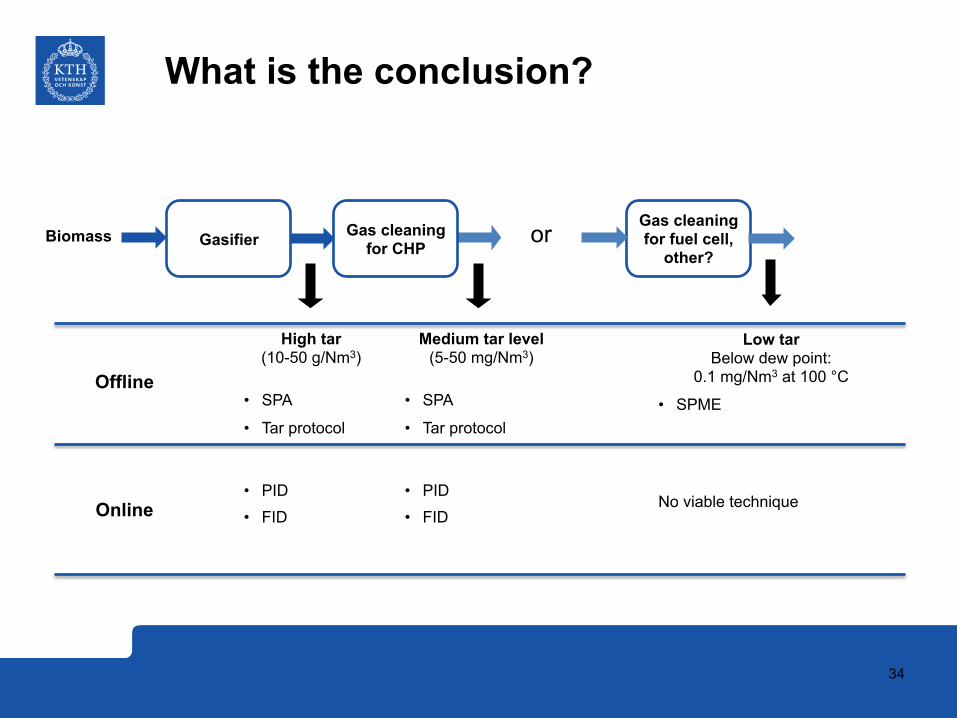
What is the conclusion?
Biomass Gas cleaning for fuel cell,
other? Gasifier Gas cleaning
for CHP
High tar (10-50 g/Nm3)
• SPA
• Tar protocol
• PID
• FID
Offline
Online
Medium tar level (5-50 mg/Nm3)
• SPA
• Tar protocol
• PID
• FID
Low tar Below dew point:
0.1 mg/Nm3 at 100 °C
• SPME
No viable technique
or

35
Summary
36
Summary
• Simple, low-cost, yet robust means of measuring and characterizing tars is desirable, especially for small scale systems
• Impinger-based method of standard tar protocol is relatively robust but time consuming and laborious
• SPA method much simpler and equally as good for many situations, but does have drawbacks
• Continued development of SPA procedure will improve robustness and utility of the method
• Developed FID and PID under development are both promising candidates for future industrial online tar monitoring
