tapping the untapped water related resourcestapping the untapped water‐related resources dancw...
TRANSCRIPT

Tapping the Untapped Water‐Related Resources
Dan CW Tsang Civil and Environmental Engineering,
Hong Kong Polytechnic University
http://www.cee.polyu.edu.hk/~dan_tsang

Stormwater Harvesting Blue‐Green Infrastructure in NDAs
Sustainable water management Flood retention lake
River park, etc Sustainable Urban Drainage Systems
at‐source, passive stormwater treatment facility
Bioswale (one of bioretention systems) attenuating runoff volume
improving coastal water quality
reclaiming water for non‐potable reuse
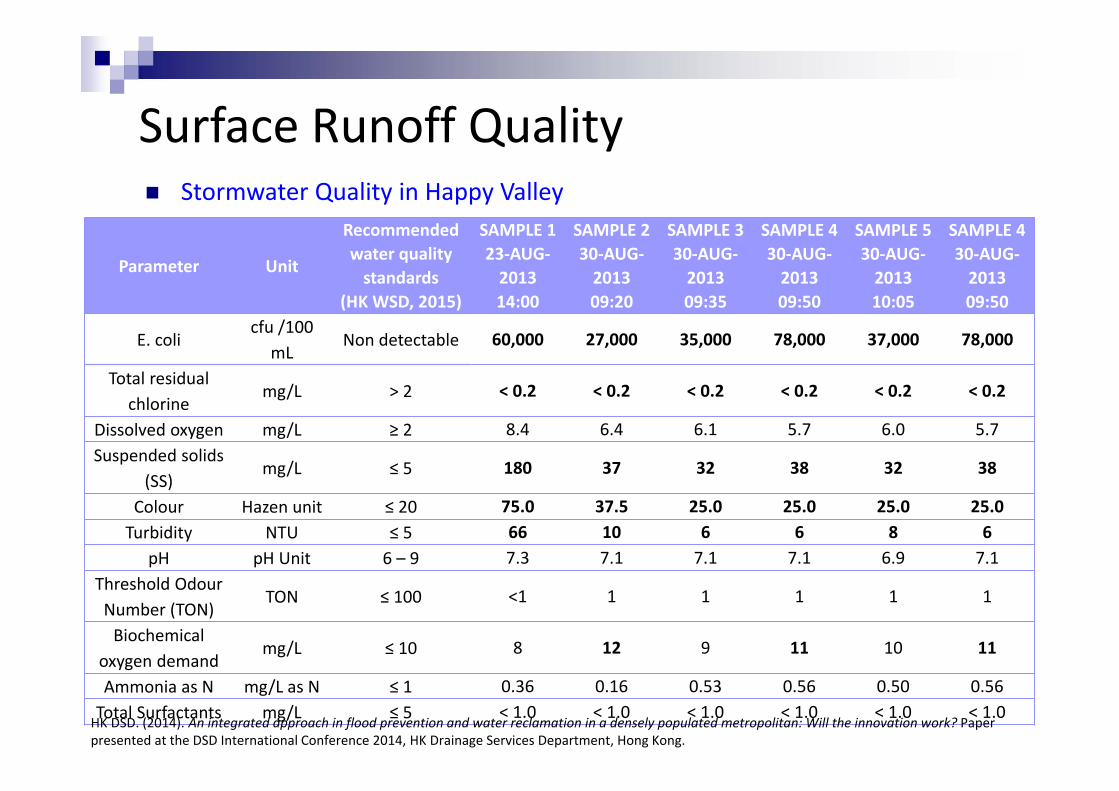
Parameter Unit
Recommended water quality standards
(HK WSD, 2015)
SAMPLE 1 23‐AUG‐2013 14:00
SAMPLE 2 30‐AUG‐2013 09:20
SAMPLE 3 30‐AUG‐2013 09:35
SAMPLE 4 30‐AUG‐2013 09:50
SAMPLE 5 30‐AUG‐2013 10:05
SAMPLE 4 30‐AUG‐2013 09:50
E. coli cfu /100
mL Non detectable 60,000 27,000 35,000 78,000 37,000 78,000
Total residual chlorine
mg/L > 2 < 0.2 < 0.2 < 0.2 < 0.2 < 0.2 < 0.2
Dissolved oxygen mg/L ≥ 2 8.4 6.4 6.1 5.7 6.0 5.7
Suspended solids (SS)
mg/L ≤ 5 180 37 32 38 32 38
Colour Hazen unit ≤ 20 75.0 37.5 25.0 25.0 25.0 25.0
Turbidity NTU ≤ 5 66 10 6 6 8 6
pH pH Unit 6 – 9 7.3 7.1 7.1 7.1 6.9 7.1
Threshold Odour Number (TON)
TON ≤ 100 <1 1 1 1 1 1
Biochemical oxygen demand
mg/L ≤ 10 8 12 9 11 10 11
Ammonia as N mg/L as N ≤ 1 0.36 0.16 0.53 0.56 0.50 0.56
Total Surfactants mg/L ≤ 5 < 1.0 < 1.0 < 1.0 < 1.0 < 1.0 < 1.0
Surface Runoff Quality Stormwater Quality in Happy Valley
HK DSD. (2014). An integrated approach in flood prevention and water reclamation in a densely populated metropolitan: Will the innovation work? Paper presented at the DSD International Conference 2014, HK Drainage Services Department, Hong Kong.

Surface Runoff Quality Other priority pollutants
Pollutants Concentrations WHO Guidelines for
Drinking‐water Quality (WHO, 2011)
Zn 0.1 – 4.4 Pb 0.1 – 2.4 0.01
Metals Cu 0.08 – 0.9 2 (mg/L) Cd 0.01 – 0.8 0.003
Ni 0.01 – 0.5 0.07 Cr 0.01 – 0.1 0.05
2,4‐D 11.5 – 67 30 Herbicides
Isoproturon 0.05 – 0.2 9(µg/L)
MCPA 0.065 – 2.2 2 Sources: Fletcher et al. (2004); Lau et al. (2009); Gan et al. (2010); Lundy et al. (2012); MDA (2011); Zgheib et al. (2012); LeFevre et al. (2015)

Non‐potable Use Criteria Water Quality Criteria for Reuse of Treated Standards for Uncontrolled Irrigation, Water
Effluent for Flushing at Ngong Ping Features and Cooling Towers Parameter Limiting Standards
Colour ≦ 20 Hazen Unit
Ammonia Nitrogen ≦ 1 mg/l
Odour ≦ 100 TON
Dissolved Oxygen ≧ 2 mg/l
BOD5 ≦ 10 mg/l
Total Suspended Solids ≦ 10 mg/l
Turbidity ≦ 10 NTU
E.Coli ≦ 100 cfu/100ml
Total Residual chlorine ≧ 0.5 mg/l
Synthetic detergents ≦ 5 mg/l
Parameter Criteria
Turbidity
If Media Filtration is used, it shall not exceed: Average 2 NTU within a 24‐hour
period 5 NTU for 5% of the time within a 24‐
hour period 10 NTU at anytime If Membrane Filtration is used, it shall not exceed: 0.2 NTU for 5% of the time within a
24‐hour period 0.5 NTU at any time
Total Coliform
7‐day median not to exceed 2.2 MPN per 100 mL
Not to exceed 23 MPN per 100 mL in more than one sample in any 30‐day period.
Not to exceed 240 MPN per 100 mL in any sample
HK WSD. (2014). ACQWS Paper No. 14 – Treated Effluent Reuse at Ngong Ping.
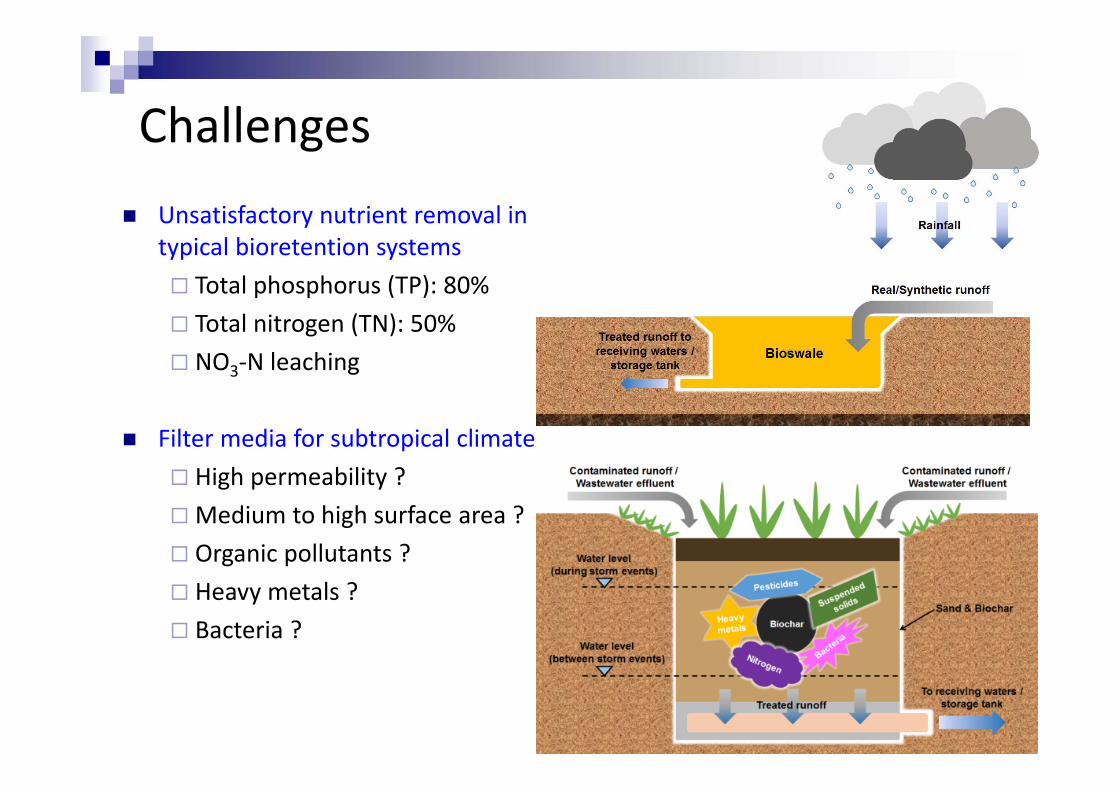
Challenges Unsatisfactory nutrient removal in
typical bioretention systems Total phosphorus (TP): 80%
Total nitrogen (TN): 50%
NO3 ‐N leaching
Filter media for subtropical climate
High permeability ?
Medium to high surface area ?
Organic pollutants ?
Heavy metals ?
Bacteria ?
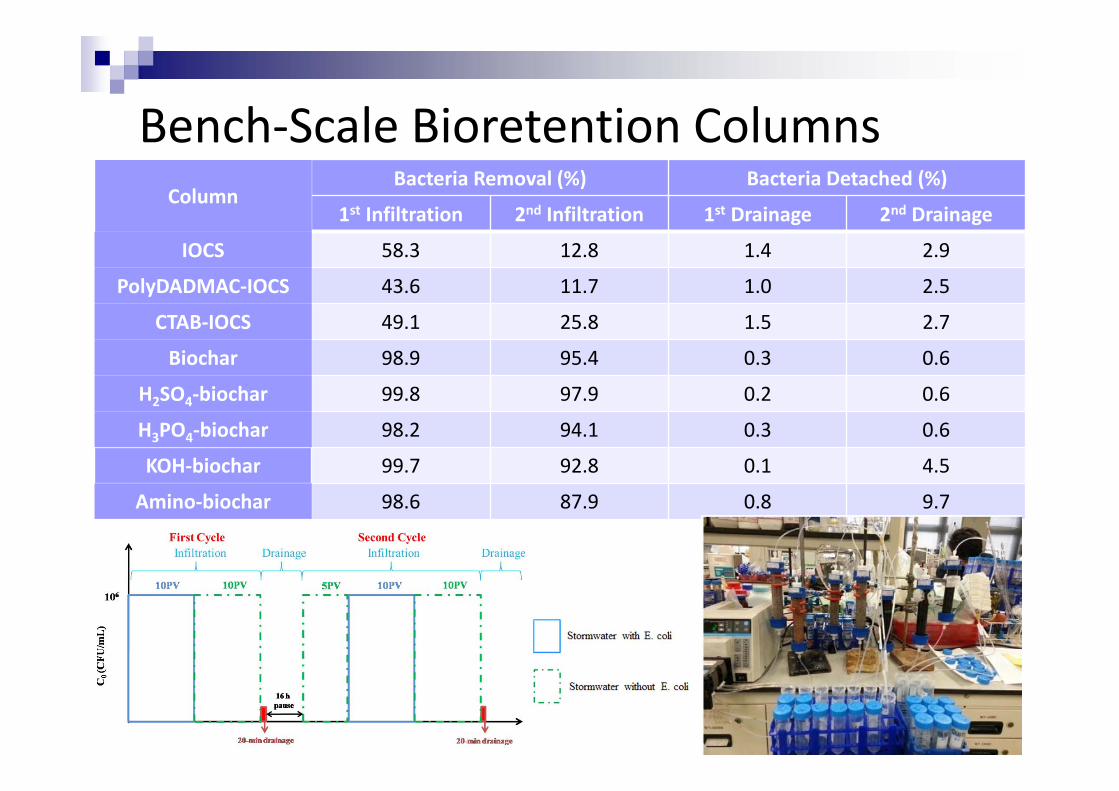
Bench‐Scale Bioretention Columns Column
Bacteria Removal (%) Bacteria Detached (%)
1st Infiltration 2nd Infiltration 1st Drainage 2nd Drainage
IOCS 58.3 12.8 1.4 2.9
PolyDADMAC‐IOCS 43.6 11.7 1.0 2.5
CTAB‐IOCS 49.1 25.8 1.5 2.7
Biochar 98.9 95.4 0.3 0.6
H2SO4 ‐biochar 99.8 97.9 0.2 0.6
H3PO4 ‐biochar 98.2 94.1 0.3 0.6
KOH‐biochar 99.7 92.8 0.1 4.5
Amino‐biochar 98.6 87.9 0.8 9.7

Rainfall in NDAs 3 Priority Areas: Anderson Road Quarry NDA, Hung Shui Kui NDA,
and Tung Chung New Town Extension
Acknowledgment: DSD colleagues, YK Ho (CE/LD), Richard Leung (SE/RD2), Tommy Ng (E/RD2)
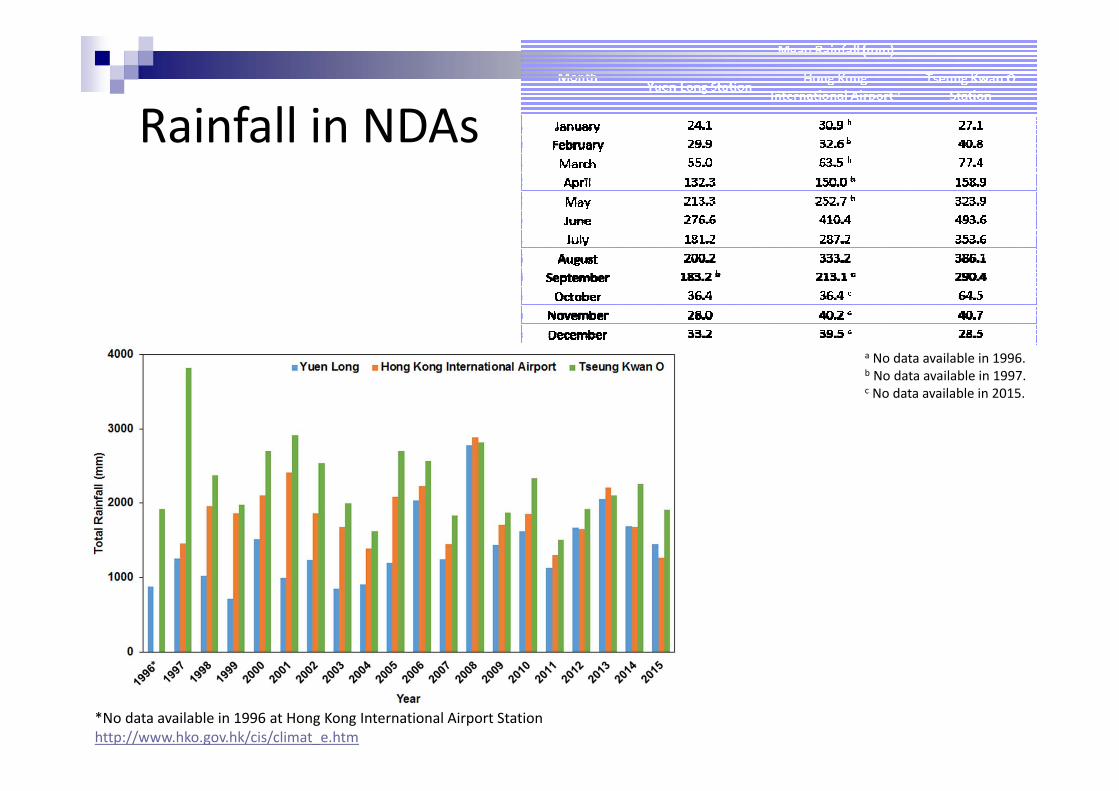
Rainfall in NDAs
a No data available in 1996. b No data available in 1997. c No data available in 2015.
*No data available in 1996 at Hong Kong International Airport Station http://www.hko.gov.hk/cis/climat_e.htm

Pilot‐Scale Bioswale Tests
Design Manuals UK: SuDS Manual (2015) Australia: Bioretention Technical Design Guidelines (Ver 1.1) Singapore: ABC Waters Design Guidelines (Second Edition)
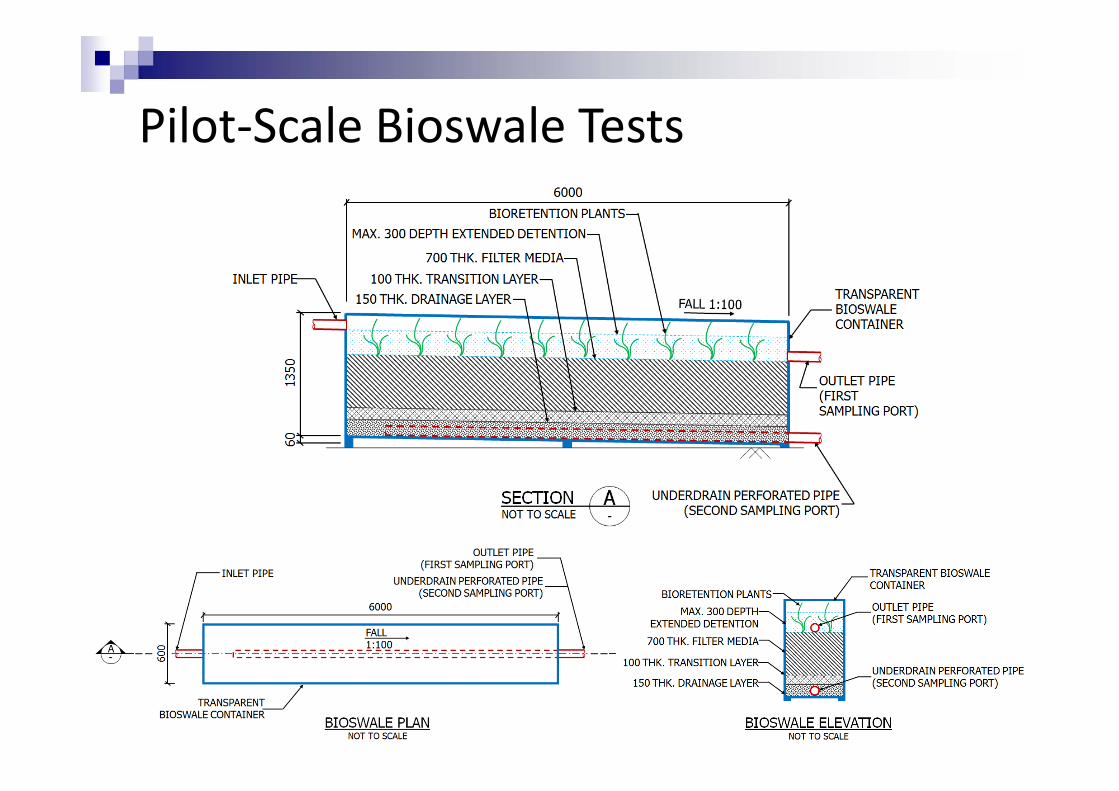
Pilot‐Scale Bioswale Tests
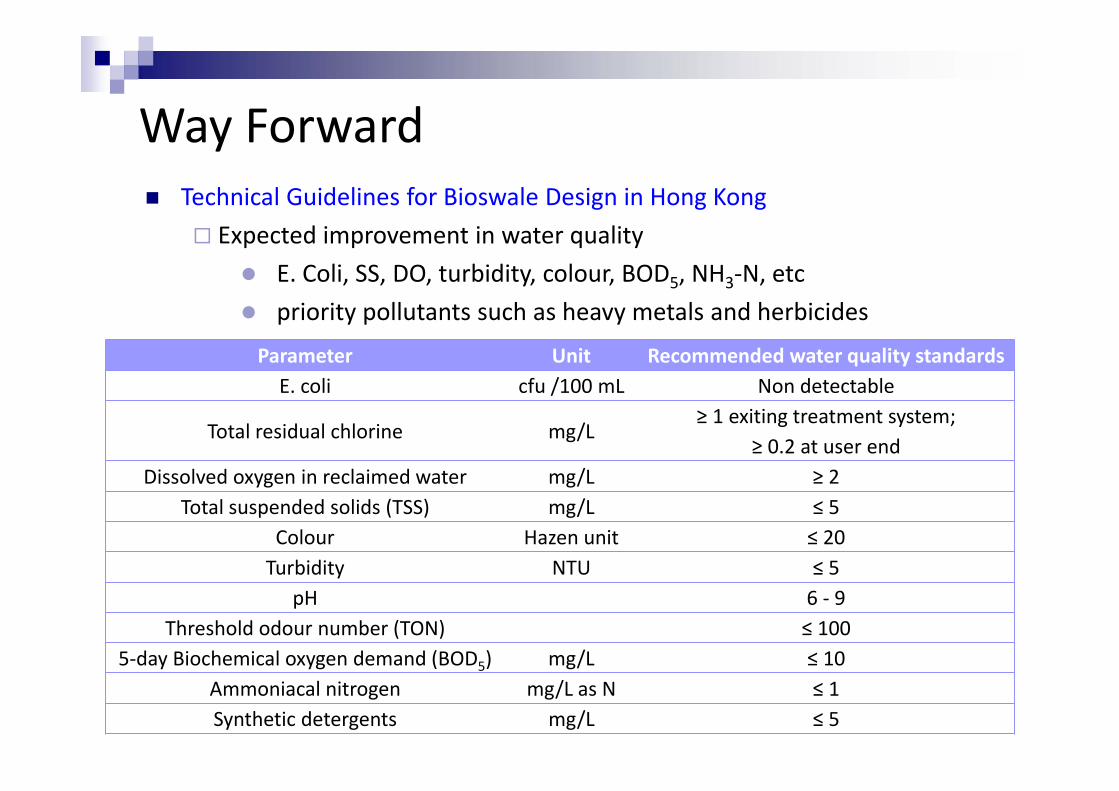
Way Forward Technical Guidelines for Bioswale Design in Hong Kong
Expected improvement in water quality
E. Coli, SS, DO, turbidity, colour, BOD5, NH3 ‐N, etc priority pollutants such as heavy metals and herbicides
Parameter Unit Recommended water quality standards E. coli cfu /100 mL Non detectable
Total residual chlorine mg/L ≥ 1 exiting treatment system;
≥ 0.2 at user end Dissolved oxygen in reclaimed water mg/L ≥ 2
Total suspended solids (TSS) mg/L ≤ 5 Colour Hazen unit ≤ 20 Turbidity NTU ≤ 5
pH 6 ‐ 9 Threshold odour number (TON) ≤ 100
5‐day Biochemical oxygen demand (BOD5) mg/L ≤ 10 Ammoniacal nitrogen mg/L as N ≤ 1 Synthetic detergents mg/L ≤ 5

Way Forward Technical Guidelines for Bioswale Design in Hong Kong
Design considerations
e.g., bioretention‐to‐catchment ratio, flow rate, water qualities
Engineered bioretention filter media
Maintenance requirement for bioswale
Service life of bioswale
Economic analysis and life cycle assessment
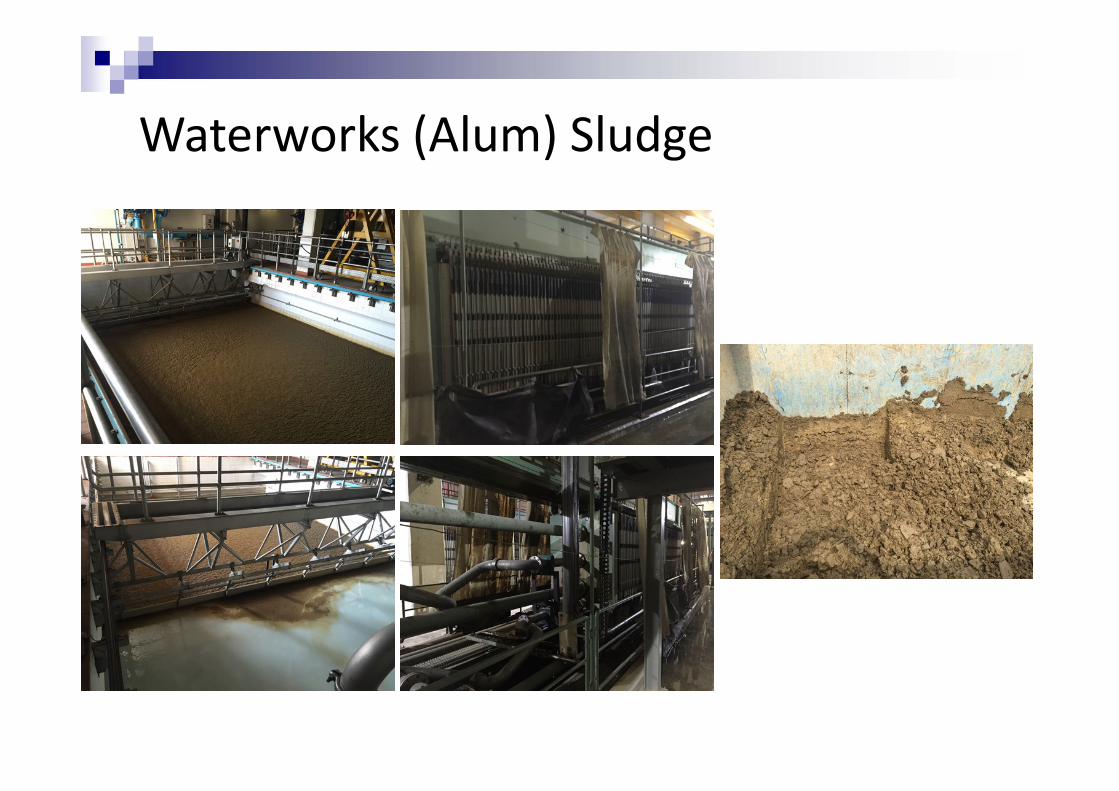
Waterworks (Alum) Sludge

Waterworks (Alum) Sludge
Disposal of Special Waste at Landfills as of 2014
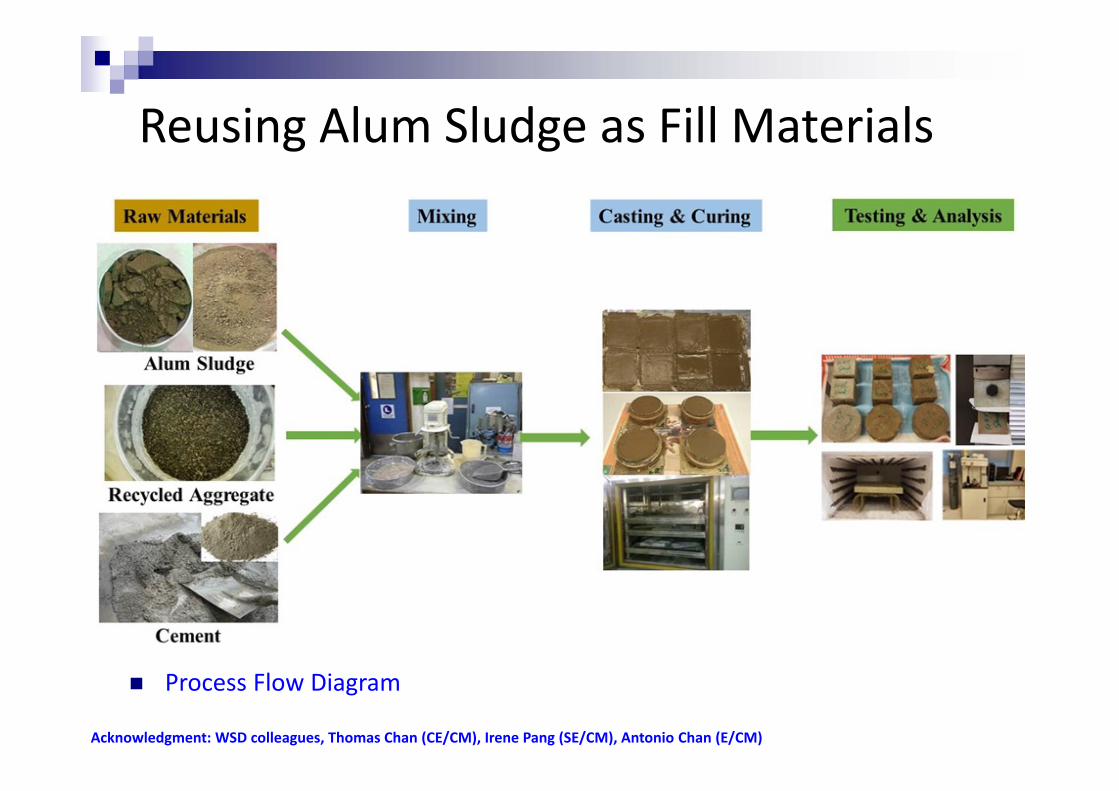
Reusing Alum Sludge as Fill Materials
Process Flow Diagram
Acknowledgment: WSD colleagues, Thomas Chan (CE/CM), Irene Pang (SE/CM), Antonio Chan (E/CM)
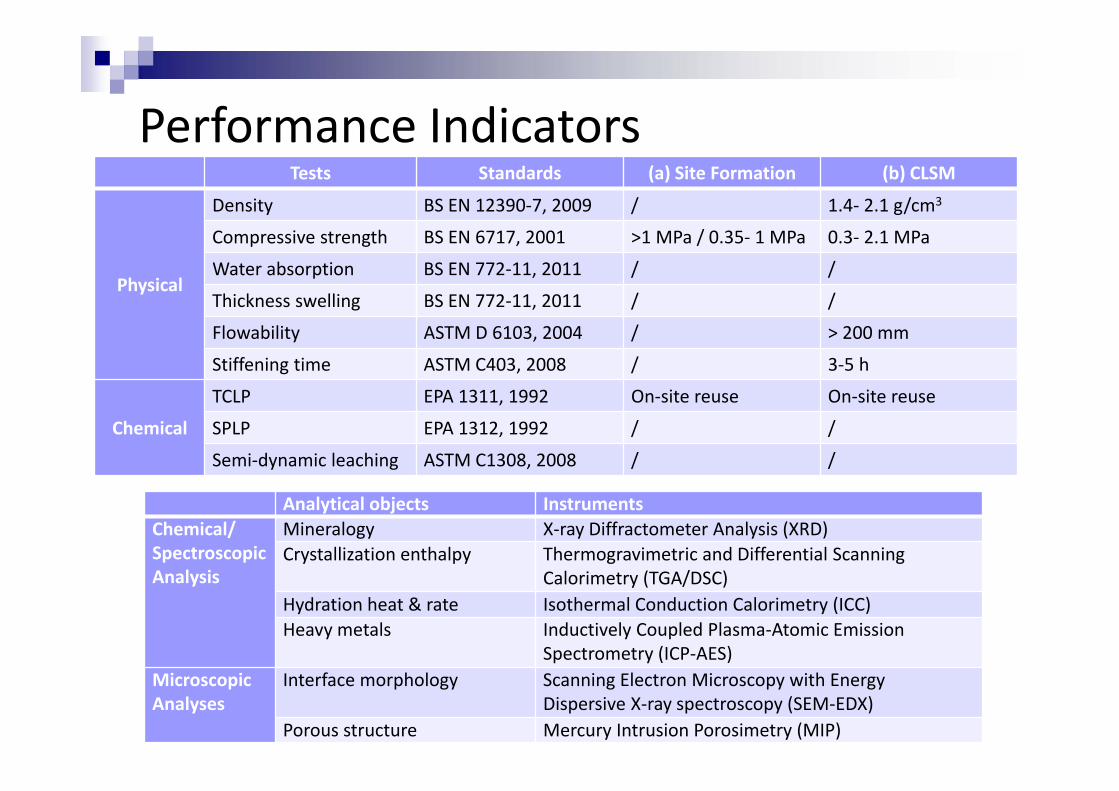
Performance Indicators Tests Standards (a) Site Formation (b) CLSM
Physical
Density BS EN 12390‐7, 2009 / 1.4‐ 2.1 g/cm3
Compressive strength BS EN 6717, 2001 >1 MPa / 0.35‐ 1 MPa 0.3‐ 2.1 MPa
Water absorption BS EN 772‐11, 2011 / /
Thickness swelling BS EN 772‐11, 2011 / /
Flowability ASTM D 6103, 2004 / > 200 mm
Stiffening time ASTM C403, 2008 / 3‐5 h
Chemical
TCLP EPA 1311, 1992 On‐site reuse On‐site reuse
SPLP EPA 1312, 1992 / /
Semi‐dynamic leaching ASTM C1308, 2008 / /
Analytical objects Instruments Chemical/ Spectroscopic Analysis
Mineralogy X‐ray Diffractometer Analysis (XRD) Crystallization enthalpy Thermogravimetric and Differential Scanning
Calorimetry (TGA/DSC) Hydration heat & rate Isothermal Conduction Calorimetry (ICC) Heavy metals Inductively Coupled Plasma‐Atomic Emission
Spectrometry (ICP‐AES) Microscopic Analyses
Interface morphology Scanning Electron Microscopy with Energy Dispersive X‐ray spectroscopy (SEM‐EDX)
Porous structure Mercury Intrusion Porosimetry (MIP)

Recycling as Fill Material Aggregate
(a) Optimizing Binder Formulation
OPC 90% AS
OPC+PFA(Class‐F) 90% AS
OPC+PFA(Class‐C) 90% AS
OPC+GGBS 90% AS
OPC+ISSA 90% AS
OPC+MOC 90% AS
MOC+PFA(Class‐F) 90% AS
MOC+GGBS 90% AS
MOC+SF 90% AS
MOC+ISSA 90% AS
(b) Optimizing Aggregate Formulation
OPClow 95‐97% AS
NAhigh 95‐97% AS (AS:NA=2:3) NAlow 95‐97% AS (AS:NA=3:2) RA 95‐97% AS (AS:RA=3:2) CBA 95‐97% AS (AS:CBA=3:2) CG 95‐97% AS (AS:CG=3:2)

Recycling as CLSM CLSM with Various Sludge Content, Additives and Supplementary Materials

Recycling as CLSM CLSM with Various Cementitious Materials

Recycling as CLSM Binder Aggregate
(a) Recycling Alum Sludge as Substitute of Aggregate 0% AS OPC + PFA 80% NA
12.5% AS OPC + PFA 70% NA +10% AS 25% AS OPC + PFA 60% NA +20% AS 50% AS OPC + PFA 40% NA +40% AS
(b) Promoting Cement Hydration by Additive Incorporation Super‐P OPC + PFA 60% NA +20% AS NaHMP OPC + PFA 60% NA +20% AS NaOH OPC + PFA 60% NA +20% AS NaAlO2 OPC + PFA 60% NA +20% AS Na2SiO3 OPC + PFA 60% NA +20% AS CaCl2 OPC + PFA 60% NA +20% AS
Ca(NO3)2 OPC + PFA 60% NA +20% AS (c) Modifying Binder and Aggregate Formulation
GGBS OPC + GGBS 60% NA +20% AS SF OPC + SF 60% NA +20% AS
Binder x 2 OPC + PFA 45% NA +15% AS MOC MOC + PFA 60% NA +20% AS MgOCl MgOCl + PFA 60% NA +20% AS CSA CSA + PFA 60% NA +20% AS RA MOC + PFA 60% RA +20% AS CBA MgOCl + PFA 60% CBA +20% AS CG CSA + PFA 60% CG +20% AS
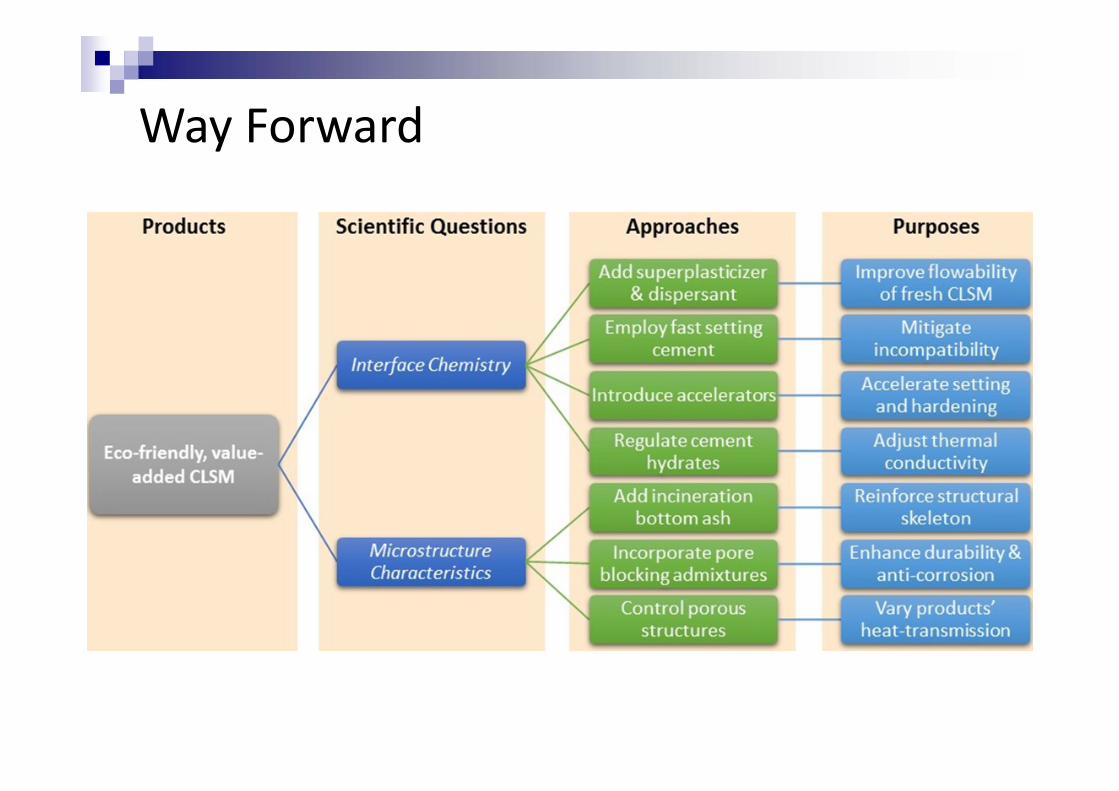
Way Forward

23
Many Thanks for Your Time!