tanker freight rates - charles r. weber company, inc. · pdf filecharles r. weber company...
TRANSCRIPT

CHARLES R. WEBER COMPANY TANKER
REPORT
SEPTEMBER 2005
tanker freight rates
aweigh we go again?

EXTRA:1-2 - HURRICANE UPDAEXTRA:1-2 - HURRICANE UPDATETE
BELIEF IN OILBELIEF IN OIL AS AS AA PRECIOUS COMMODITYPRECIOUS COMMODITY ENTERSENTERS
THE PSYCHETHE PSYCHE
01:3-4 - EXECUTIVE SUMMAR01:3-4 - EXECUTIVE SUMMARYY
TTANKER SHIPPING - FOLLOWING ANKER SHIPPING - FOLLOWING AA FFAMILIAR PAMILIAR PAATH?TH?
02:4-9 - WORLD OIL02:4-9 - WORLD OIL MARKETMARKET
CRUDE OILCRUDE OIL DEMAND - HIGH OILDEMAND - HIGH OIL PRICES STPRICES START TART TOO
BITE + FORCAST FOR 2005 SHADED DOWN + HIGHBITE + FORCAST FOR 2005 SHADED DOWN + HIGH
OILOIL PRICES COUNTERED BYPRICES COUNTERED BY THE CHINATHE CHINA EFFECT +EFFECT +
CURDE OILCURDE OIL SUPPLSUPPLYY - WHO WILL- WHO WILL PROVIDE THE EXTRAPROVIDE THE EXTRA
BARRELS? + FEAR DRIVING THE MARKET + BARRELS? + FEAR DRIVING THE MARKET + AA NEWNEW
PHASE NOT PHASE NOT AA NEW ERANEW ERA
03:10-103:10-11 - 1 - TTANKER MARKET PERFORMANCEANKER MARKET PERFORMANCE
TTANKER EARNINGS TUMBLE IN 2Q05 + FOLLOWINGANKER EARNINGS TUMBLE IN 2Q05 + FOLLOWING
THE USUALTHE USUAL SEASONALSEASONAL PPAATTERN + CONTINUEDTTERN + CONTINUED
STRONG FLEET EXPSTRONG FLEET EXPANSIONANSION
04:12-13 - 04:12-13 - TTANKER EARNINGSANKER EARNINGS
TTANKER SHARE PRICES STILLANKER SHARE PRICES STILL HOLDING UPHOLDING UP + FUR+ FUR--
THER STRONG FLEET GROWTH THREATHER STRONG FLEET GROWTH THREATENS EARNTENS EARN--
INGS IN 2H05INGS IN 2H05
05:14-16 - FREIGHT RA05:14-16 - FREIGHT RATESTES
CRUDE OILCRUDE OIL DEMAND GROWTH WILLDEMAND GROWTH WILL HELPHELP UNDERPINUNDERPIN
TTANKER EARNINGS + LONG HAULANKER EARNINGS + LONG HAUL TRADE GROWTH INTRADE GROWTH IN
2005 WILL2005 WILL HAHAVE LESS IMPVE LESS IMPACT ACT AS AS AN AN ACCELERAACCELERATTOROR
FOR TFOR TANKER DEMAND IN 2005ANKER DEMAND IN 2005
06:17-19 - VESSEL06:17-19 - VESSEL SECTSECTORSORS
TTANKER REVIEW + THE RANKINGS ANKER REVIEW + THE RANKINGS -- SECTSECTOROR
REPORTS FROM THE WEBER TRADING FLOORREPORTS FROM THE WEBER TRADING FLOOR
WWeebbeerr TTAANNKKEERR RReeppoorrttCharles R. Weber Company Inc. Tanker Report ispublished four times a year. It reviews important top-ics within the tanker shipping industry and tanker sec-tors that are of particular interest. It focuses onchanges in tanker trading patterns and changes infleet supply and demand.
SSOOUURRCCEESS::Charles R. Weber Research, International EnergyAgency, Energy Information Agency, Lloyds MaritimeInformation Unit, Baltic Exchange, Global TradeInformation Services.
EEDDIITTOORRIIAALL BBOOAARRDDBasil G. Mavroleon - Managing DirectorDan O’Donnell - Director
CCOONNTTAACCTT DDEETTAAIILLSSJohnny M. KulukundisCharles R. Weber Company Inc.Greenwich Office Park OneGreenwich, Conneccticut, 06831, USAvoice:+1 203 629 2300fax:+1 203 629 9103e-mail:[email protected]: www.crweber.com
DISCLAIMERWhilst every care has been taken in the produc-
tion of this study, no liability can be accepted for
any loss incurred in any way whatsoever by any
person who may seek to rely on the information
contained herin. The information in this report
may not be reproduced without he express writ-
ten permission of the Charles R. Weber Comapny,
Inc.
COPYRIGHT© 2005 Charles R. Weber Company, Inc.
ESSENTIAL READING FOR THE INTERNATIONAL OIL TRANSPORTATION INDUSTRY
Issue 03
www.crweber.com
SS EE PP TT EE MM BB EE RR ’’ 00 55IN THIS REPORT

Belief in Oil as a Precious Commodity Enters
the Psyche
Hurricanes Feed Long Term Market Fears and
Accelerate Crude Oil Price Rises
As the body of this report was completed prior to the tworecent catastrophic hurricanes in the United States we felt itwould be helpful to add these additional pages to take abrief snapshot of the impact of those terrible natural disas-ters on the oil and tanker markets. Our fundamental outlookin this report has not changed.
For most of the year, long term fears about crude oil pro-duction shortages - caused by (1) high Chinese demand in2004, (2) the recognition that the data on crude oil reserveswas unreliable, and (3) the recognition that investment in oilexploration had been neglected - acted to push up prices.The terrible destruction of September’s back to back hurri-canes left the US Gulf crude oil production and refineryindustries in disarray and gave further impetus to crude oilprices which have been rising relentlessly since 2Q03.
Product Shipping Benefits Most as
Tanker Rates Take Off
Shipping generally seems to benefit from a crisis. The mostimmediate problem resulting from the hurricanes proved tobe the loss of refinery capacity, and as a result the cleanproduct market jumped dramatically (figure 1).
figure 1
The bad weather dividend for the dirty market was muchless dramatic than in the clean market. However, rates forcrude oil tankers moved upward steadily in September(albeit from a low base) partly as a result of the dislocation
caused by the hurricanes and partly due to the normal sea-sonal increase in demand.
Near/Medium Term Outlook
Back to “Normal” by Year End
The latest damage assessment (27 Sept) indicates that 683platforms and 87 rigs remain evacuated in the Gulf ofMexico, while the cumulative production lost so far totals36.4 MnBbls of crude oil and 172.5 Bcf of gas. More posi-tively, it seems that there has been no significant damage toundersea pipelines, while eight of the sixteen refineries shutdown have restarted or are attempting to restart.
Despite the continuing serious problems in the US Gulf, thecrude oil price has come down from its peak, while upwardmomentum of clean product rates had stalled by the end ofSeptember. It seems that the impact of the weather wildcard has tailed off, and this is in part due to the actions ofthe US Government.
President Bush- heavily criticised for not doing enough toalleviate the human tragedy, and desperate not to beaccused of economic mismanagement as well - has doneeverything to allay fears of crude oil, product and gas short-ages e.g. asked the rest of the world for assistance, exhort-ed producers to pump more oil and dipped into the SPR.
The market has been reassured by the government’s will-ingness to release stocks from the SPR and to relax prod-uct specifications. Figure 2 shows that while crude oil stockswere down at the end of September, gasoline stocks wereactually up.
Although, the hurricane season is not yet over, the oil indus-try is targeting the end of the year as the time when theindustry can start to get back to normal. For example, this isthe point when the last of the closed refineries will be backon line.
1
CHARLES R. WEBER TANKER REPORT HURRICANE UPDATE
www.crweber.com
BDTI v BCTI v Crude Oil Price Jan-Sept 2005
800
1000
1200
1400
1600
1800
2000
4/1/2005 15/2/2005 31/3/2005 13/5/2005 27/6/2005 8/8/2005 20/9/2005
Index
40
45
50
55
60
65
70
$B
bl
BDTI
BCTI
WTI
US Crude Oil, Gasoline and Distillate Stocks (End of Month) 2005
200
220
240
260
280
300
320
340
1/20
05
2/20
05
3/20
05
4/20
05
5/20
05
6/20
05
7/20
05
8/20
05
23/09/20
05
Mill
ion
Ba
rre
ls
100
120
140
160
180
200
220
240
Mill
ion B
arr
els
US Crude Oil Stocks US Gasoline Stocks US Distillate Stocksfigure 2

Longer Term Outlook – Looking Beyond Oil
Despite the skill of both the US administration and the USoil industry in managing the physical strain on the energysupply chain and preventing energy prices from spiraling upfurther, economic slow down seems inevitable.
Rising energy prices have hit consumers hard and it isexpected that this will cause a reduction in energy demandas well as in consumer spending generally. It remains to beseen exactly how the US and global economy will be effect-ed.
However, it may well be that the most fundamental impactof the twin hurricanes is that they have served to burn intothe general global consciousness the realization that theworld’s supply of crude oil really is going to run out. A newera is upon us – for the first time, there will be concertedefforts to develop alternative energy sources and to maxi-mize the efficiency of energy consumption.
Today: nuclear moves up the agenda – wind power com-pletes its transition to the main stream
Tomorrow a new vision: the decentralization of energy gen-eration - the individual becomes an energy collector (solarpanels, mini wind turbines, exploiting latent geothermalresources etc.)
Methodology and Scope of the Charles R.
Weber Tanker Report
The aim of the Weber tanker report is to provide participantsin the tanker shipping industry with an overview into the lat-est developments in the tanker market and the oil industrythat it serves, and also to shine a spotlight on the futureprospects for these two markets.
Crude Oil Market
Subjects that are regularly covered are as follows:
- Crude oil supply/demand balances historical and forecast
- Crude oil prices – Brent and West Texas Intermediate
- OPEC announcements and quota changes- US and Chinese crude oil import/export trade
statistics - Crude oil and product stocks- Rig activity- Refinery throughputs
Tanker Shipping Market
Subjects that are regularly covered are as follows:
- Tanker earnings trends historical and forecast- Tanker spot fixtures- Tanker investor activity in terms of new orders,
secondhand sales and scrapping- Tanker fleet supply changes historical and forecast- Tanker fleet demand forecasts – taking into account
the impact of tonmiles- Listed tanker shipping company results and share
performance
The publication also tries to illuminate the differencesbetween developments in the different tanker sectors duringthe most recent quarter:
- VLCC (>=200,000Dwt)- Suezmax (>=120,000, <200,000Dwt)- Aframax (>=80,000Dwt, <120,000Dwt)- Panamax (>=50,000Dwt, <80,000Dwt)- Product (>=10,000, <50,000Dwt)
Each sector review is written by a Weber broker with directinvolvement in the relevant sector.
2
CHARLES R. WEBER TANKER REPORT HURRICANE UPDATE
www.crweber.com
Tanker Shipping – Following a Familiar Path?
Executive Summary:
Market unperturbed by low 2Q05 tanker earnings
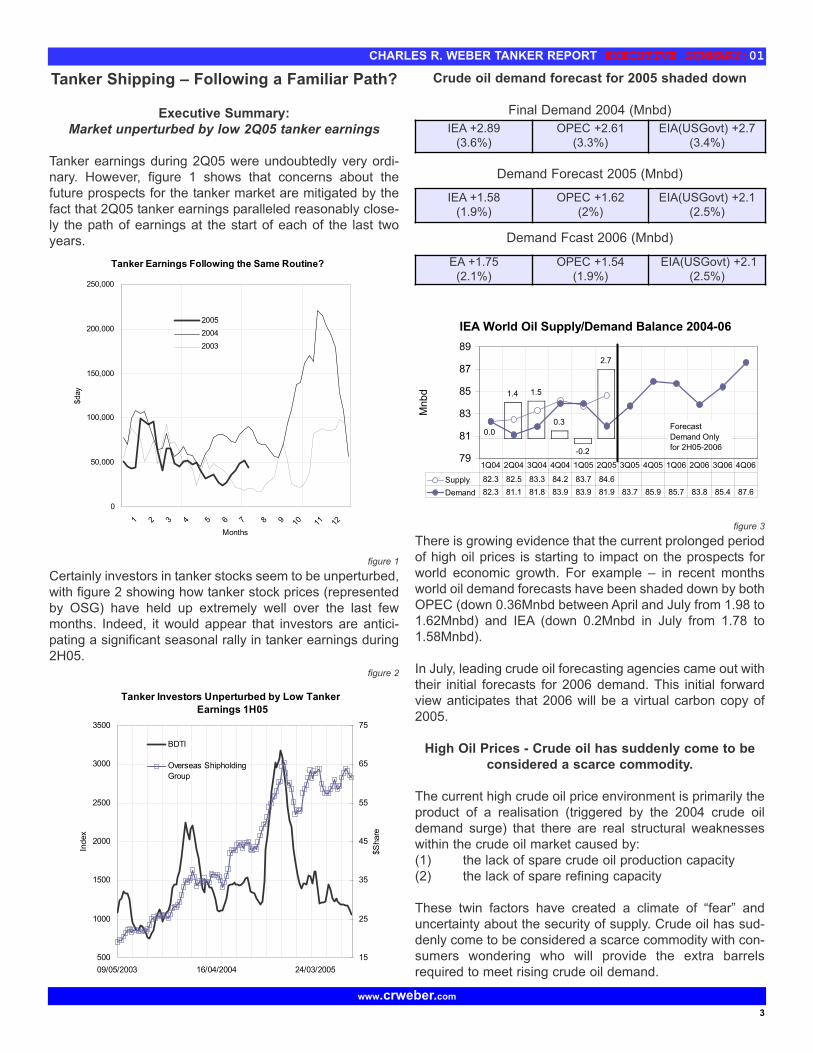
Tanker earnings during 2Q05 were undoubtedly very ordi-nary. However, figure 1 shows that concerns about thefuture prospects for the tanker market are mitigated by thefact that 2Q05 tanker earnings paralleled reasonably close-ly the path of earnings at the start of each of the last twoyears.
figure 1
Certainly investors in tanker stocks seem to be unperturbed,with figure 2 showing how tanker stock prices (representedby OSG) have held up extremely well over the last fewmonths. Indeed, it would appear that investors are antici-pating a significant seasonal rally in tanker earnings during2H05.
figure 2
Crude oil demand forecast for 2005 shaded down
Final Demand 2004 (Mnbd)
Demand Forecast 2005 (Mnbd)
Demand Fcast 2006 (Mnbd)
figure 3
There is growing evidence that the current prolonged periodof high oil prices is starting to impact on the prospects forworld economic growth. For example – in recent monthsworld oil demand forecasts have been shaded down by bothOPEC (down 0.36Mnbd between April and July from 1.98 to1.62Mnbd) and IEA (down 0.2Mnbd in July from 1.78 to1.58Mnbd).
In July, leading crude oil forecasting agencies came out withtheir initial forecasts for 2006 demand. This initial forwardview anticipates that 2006 will be a virtual carbon copy of2005.
High Oil Prices - Crude oil has suddenly come to be
considered a scarce commodity.
The current high crude oil price environment is primarily theproduct of a realisation (triggered by the 2004 crude oildemand surge) that there are real structural weaknesseswithin the crude oil market caused by:(1) the lack of spare crude oil production capacity(2) the lack of spare refining capacity
These twin factors have created a climate of “fear” anduncertainty about the security of supply. Crude oil has sud-denly come to be considered a scarce commodity with con-sumers wondering who will provide the extra barrelsrequired to meet rising crude oil demand.
3
CHARLES R. WEBER TANKER REPORT EXECUTIVE SUMMARY:01
IEA +2.89(3.6%)
OPEC +2.61(3.3%)
EIA(USGovt) +2.7(3.4%)
IEA +1.58(1.9%)
OPEC +1.62(2%)
EIA(USGovt) +2.1(2.5%)
EA +1.75(2.1%)
OPEC +1.54(1.9%)
EIA(USGovt) +2.1(2.5%)
1.4 1.5
0.3
-0.2
2.7
0.0
IEA World Oil Supply/Demand Balance 2004-06
79
81
83
85
87
89
Mnbd
Supply 82.3 82.5 83.3 84.2 83.7 84.6
Demand 82.3 81.1 81.8 83.9 83.9 81.9 83.7 85.9 85.7 83.8 85.4 87.6
1Q04 2Q04 3Q04 4Q04 1Q05 2Q05 3Q05 4Q05 1Q06 2Q06 3Q06 4Q06
Forecast
Demand Only
for 2H05-2006
www.crweber.com
Tanker Earnings Following the Same Routine?
0
50,000
100,000
150,000
200,000
250,000
1 2 3 4 5 6 7 8 9 10 11 12
Months
$day
2005
2004
2003
Tanker Investors Unperturbed by Low Tanker
Earnings 1H05
500
1000
1500
2000
2500
3000
3500
09/05/2003 16/04/2004 24/03/2005
Index
15
25
35
45
55
65
75
$S
hare
BDTI
Overseas Shipholding
Group

Consumers feel exposed to any disruption in crude oil sup-ply or to a demand surge. This has led to a twin track poli-cy of (1) building stocks to a higher base level in order tocreate a buffer against any supply disruption or demandsurge, and (2) making increased use of the futures marketsto secure forward positions and pricing.
Tanker Freight Rate Prospects for the remainder of
2H05
China has so far had a much less dramatic impact on thetanker market than in 2004 with crude oil imports up just 4%yoy – compared to full year growth of 35% in 2004.However, some commentators believe that Chinese crudeoil imports will strengthen during 2H05. This will give a boostto tanker demand. Increased Chinese imports in 2H05 willalso act as an accelerator by boosting tonmile demand,which reflects the fact that most trades serving China arelong haul.
The market will also be underpinned in 2H05 by solidgrowth in overall world crude oil demand – estimated byleading forecasters to be in the range +1.9% and +2.5%.Although this growth is well below that achieved in 2004(IEA, +3.6%), it is still well above the average for the period2000-2003 (IEA, +1.2%).
With China’s lower profile (so far this year) and lower worldcrude oil demand growth, it is expected that tanker earningswill not match the levels seen in 2004.
The prospect of further strong fleet growth will also act as adrag on tanker earnings prospects in 2H05. It is anticipatedthat full year fleet growth will reach 6.1% in 2005, which fol-lows on from growth of 6.2% in 2004.
However, the tightness in the crude oil market created
by limited spare production capacity and limited spare
refinery capacity mean that - during the period of rising
seasonal demand in 4Q05 - there is the opportunity for
tanker rate spikes towards the end of the year in the
event of any crude oil supply dislocations or even a late
crude oil demand surge from China.
Prospects for the World Oil Market in 2005-6
Crude Oil Demand – High Oil Prices Start to Bite
– Forecast for 2005 Shaded Down (as at July 2005)
Range of World Crude Oil Demand Forcasts (a):
Demand Fcast 2005 (Mnbd)
Final Demand 2004 (Mnbd)
There is growing evidence that the current prolonged periodof high oil prices is starting to impact on the prospects forworld economic growth. For example – in recent monthsworld oil demand forecasts have been shaded down by bothOPEC (down 0.36Mnbd between April and July from 1.98 to1.62Mnbd) and IEA (down 0.2Mnbd in July from 1.78 to1.58Mnbd).
Nevertheless, although not expected to match the bumpercrude oil demand growth seen in 2004 (IEA +2.89 Mnbd,+3.6%), 2005 demand (for all the forecasting agencies usedhere) is well ahead of the average annual demand growthfor the period 2000-2003 (+1.2%).
(a) This report uses three main demand forecasting organi-sations: IEA (International Energy Agency), OPEC(Organisation of the Petroleum Exporting Countries), andEIA (US Government’s Energy Information Agency)
– Initial Forecast for 2006 (as at July 2005)
Range of World Crude Oil Demand Forcasts:
Demand Fcast 2006 (Mnbd)
In July, leading crude oil forecasting agencies came out withtheir initial forecasts for 2006 demand. This initial forwardview anticipates that 2006 will be a virtual carbon copy of2005.
Again rising oil prices are expected to undermine demand.OPEC is at the low end of the spectrum at +1.9%. It com-ments that its forecast “captures to some extent the impactof high international oil prices on oil demand”
4
CHARLES R. WEBER TANKER REPORT EXECUTIVE SUMMARY:01
www.crweber.com
IEA +1.58(1.9%)
OPEC +1.62(2%)
EIA(USGovt) +2.1(2.5%)
IEA +2.89(3.6%)
OPEC +2.61(3.3%)
EIA(USGovt) +2.7(3.4%)
EA +1.75(2.1%)
OPEC +1.54(1.9%)
EIA(USGovt) +2.1(2.5%)

High Oil Prices Countered by the China Effect
In 2004, China was the most important factor driving crudeoil demand and the world economy – although not the onlyfactor (b). In 2005 and 2006, a strong Chinese economy isagain critical for world crude oil demand and the world econ-omy.
(b) Some of the other factors driving crude oil demand andthe world economy in 2004: ? Non-Chinese crude oildemand +1.9Mnbd ? US economy strong, high imports ?Hurricane Ivan ?
Figure 4 below provides a regional break down of the IEAcrude oil demand forecast for 2005 and 2006. This showsthat Chinese demand growth – although well down on 2004(+15.4%) – is expected to expand by 5.5% and 7.2% in2005 and 2006 respectively.
Figure 4: Global Crude Oil Demand by Region
(million barrels per day) Source: IEA
Trade data for 1H05 (see figure 5) provides further evidenceof the continued health of the Chinese economy. Althoughobviously not immune to the impact of high oil prices, Chinaappears to sit implacably at the other end of the seesaw tohigh crude oil prices helping to keep the world economy onan even keel.
figure 5
However, not all the evidence for China is positive. Figure 6shows crude oil imports for 1H05. This reveals a veryuneven pattern of imports with two bumper months in Marchand April sandwiched on either side by two mediocremonths.
5
CHARLES R. WEBER TANKER REPORT WORLD OIL MARKET:02
China Imports
0
10,000
20,000
30,000
40,000
50,000
60,000
70,000
1 3 5 7 9 11
Months
$ M
illio
n
05
04
03
02
China Exports
0
10,000
20,000
30,000
40,000
50,000
60,000
70,000
1 3 5 7 9 11
Months
$ M
illio
n
05
04
03
02
www.crweber.com
Demand
2005
Annual
Change
2004
Annual
Change
2005
Annual
Change
2006
Annual
Change
2004 %
Annual
Change
2005 %
Annual
Change
2006%
NorthAmerica 25.61 0.83 0.26 0.33 3.4 1.0 1.3
Europe 16.33 0.17 0.05 0.03 1.0 0.3 0.2
OECDEurope 8.64 -0.18 0.11 0.06 -2.0 1.3 0.7
China 6.79 0.86 0.36 0.49 15.4 5.5 7.2
Other Asia 8.80 0.47 0.28 0.27 5.9 3.3 3.1
SubtotalAsia 24.23 1.15 0.75 0.83 5.2 3.2 3.4
FSU 3.78 0.15 0.04 0.05 4.2 1.0 1.2
Middle East 6.07 0.33 0.30 0.31 6.1 5.2 5.1
Africa 2.89 0.07 0.09 0.09 2.7 3.2 3.1
LatinAmerica 4.95 0.19 0.10 0.11 4.1 2.0
2.3
World 83.88 2.89 1.58 1.75 3.6 1.9 2.1

Overall crude oil imports for 1H05 are 4.1% ahead of thecorresponding period in 2004. This rate of growth is belowthe IEA forecast of 5.5%. Therefore, a significant improve-ment is required in the second half of the year.
figure 6
figure 7
IEA argue that the relatively lacklustre performance of crudeoil imports has been in part due to government policies thathave inhibited demand. Most notably government pricerestrictions on transport fuels and power are making ituneconomic for domestic refiners and utilities (c) to max-imise output. Liberalisation of either market would have the
effect of increasing domestic oil demand. However, thereare no signs of a change in policy in the near term.
(c) In the case of the utilities, while substitution for lowerpriced fuels has proved a key motivation, the increasedavailability of hydroelectric power has also contributed to areduction in demand growth for fuel oil.
The impact of the government’s policy of limiting increasesin the retail price of key products has had an even more sig-nificant effect on product imports, which have fallen sharplyduring 1H05 (-21%) (see figure 7). Conversely productexports have started to rise.
Crude Oil Supply – Who Will Provide the Extra
Barrels?
At its latest meeting in June, OPEC increased its quota levelby 0.5Mnbd to 28Mnbd. It also made provision for a further0.5Mnbd of extra production should the market require itahead of its next scheduled meeting in September.
figure 8
OPEC invariably comments at its meetings that the marketis well supplied with oil. With both crude oil and productsstocks tending towards the upper end of their five yearrange (see figure 9), there appears to be merit in this claimon this occasion. However, why are crude oil prices atrecord levels?
6
CHARLES R. WEBER TANKER REPORT WORLD OIL MARKET:02
www.crweber.com
China Crude Oil Imports
3000
4000
5000
6000
7000
8000
9000
10000
11000
12000
13000
1 2 3 4 5 6 7 8 9 10 11 12
Months
'000bd
2004/5
2003/4
2002/3
China Products Imports/Exports
2000-6/2005
-2,000
-1,000
0
1,000
2,000
3,000
4,000
5,000
Jan-00 Jan-01 Jan-02 Jan-03 Jan-04 Jan-05
'000 T
onnes
OPEC Quota Changes 2004 - July 05
22
23
24
25
26
27
28
29
1/04 4/04 7/04 10/04 1/05 4/05 7/05
Mn
bd
30
35
40
45
50
55
60
65
We
st
Te
xa
s I
nte
rme
dia
te $
Bb
OPEC Production Quota ex Iraq Actual OPEC Production ex NGLs & Iraq
West Texas Intermediate
(right axis)
OPEC 129 10.2.04 Quota 23.5Mnbd (-1.0Mnbd)
OPEC 131 3.6.04 Quota 25.5Mnbd (+2.0Mnbd) rising to
26Mnbd in August
OPEC 132 15.9.04 Quota 27Mnbd
(+1.0Mnbd)
OPEC 135 16.3.05 Quota 27.5Mnbd (+0.5Mnbd)
OPEC 133 10.12.04 "Unofficial" Quota
26Mnbd (-1.0Mnbd)
OPEC 136 15.6.05 Quota 28Mnbd
(+0.5Mnbd)

figure 9
figure 10
“Fear” Driving the Crude Oil Market
The above charts appear to show that the usual relationshipbetween prices and stocks has been broken i.e. a period ofhigh stocks might more usually be accompanied by weak oilprices.
The root cause of this broken relationship goes back to thecrude oil demand surge witnessed in 2004. The market wasshocked by the strength of crude oil demand growth (IEA,+3.6%) because it meant that crude oil producers werepushed to there capacity limits. The lack of spare capacitymeant that security of crude oil supply – more usuallythreatened by wars (e.g. Gulf Wars) or bad weather (e.g.Hurricane Ivan) – became the primary concern or “fear” of
crude oil consumers. These concerns were heightened by(1) comments from some industry experts that the era of“peak oil” (a) was imminent, (2) continuing concerns aboutthe shortage of world refinery capacity following years ofunderinvestment.
(a) “Peak oil” – the idea that crude oil production haspeaked with new capacity can no longer outpace failingcapacity.
During 1H05, fears about the lack of spare capacity haveremained at the top of the agenda, as fearful consumersstudy conflicting reports about the amount, quality, and startup time of existing spare capacity, as well as the timetablefor new capacity coming on stream and the investmentplans of oil producers for future oil exploration.
“Fears” about the lack of spare capacity have been
exacerbated by the forecast of relatively strong crude
oil demand growth (2-2.5% per annum 2005-2006).
Consumers have been left wondering just who will sup-
ply the extra barrels to meet to world’s rising demand.
It can be considered that the oil market is driven by two sep-arate sets of considerations: (1) long term/deferred, (2)short term. PIRA argues that long term considerations aredominating (e.g. concerns about long term supply security).Positive short term fundamentals (e.g. increased OPECquota levels) are over powered, while negative short termfactors (listed below) are fuelling the prevailing mood of thedeferred market.
- Geoplitical Risks (The London Bombings, the deathof King Fahd of Saudi Arabia, political unrest in Iraq,Nigeria and Venezuela)
- China – could there be another demand surge likethat seen in 2004?
- Russia – the uncertain future of Yukos – will Russian crude oil production stagnate
- Refinery Capacity Shortages – Years of underinvestment have left the industry short of spare capacity and vulnerable to unexpected outages e.g.the separate BP and Murphy refinery fires in July
- Hurricane season – will there be another hurricaneto match the destructive Ivan in 2004
A New Phase, Not a New Era
The market’s “fears” about the lack of spare capacity haveled to a twin track policy aimed at securing future crude oilsupply: (1) building up stocks to act as a buffer in a poten-tial crisis when crude oil production cannot expand to meetdemand (e.g. High demand: another China demand surge,or Low Supply: another Hurricane Ivan), and (2) increasedactivity in the crude oil futures markets.Both aspects of this twin track policy have fuelled crude oilprice rises (b).
7
CHARLES R. WEBER TANKER REPORT WORLD OIL MARKET:02
www.crweber.com
Total OECD Industry Crude Oil Stocks
800
820
840
860
880
900
920
940
960
980
1000
1 2 3 4 5 6 7 8 9 10 11 12
Months
MnT
ons
2004/5
5 Year Range
West Texas Intermediate Crude Oil Price
15
20
25
30
35
40
45
50
55
60
1 2 3 4 5 6 7 8 9 10 11 12
Months
$B
bl
2004/5
2003/4
2002/3
(b) In the case of increased futures activity, OPEC arguesthat speculators (non-commercials) have also become veryactive and that they have contributed to the high price envi-ronment.
IEA, which appears unconvinced by those that argue that“peak oil” is just around the corner, interprets this new poli-cy as a new phase – a market readjustment to a realisationthat the period of tight production capacity is here for sometime to come. However, IEA points out that the market hasnot entered a new era because over the next few yearsadditional investment means that spare production capacitywill be built back up and oil prices will retreat.
The Long Term Effects of a High Oil Price Environment
However, what if the high oil price environment continuesfor a prolonged period?
It is clear that a period of high oil prices must have a nega-tive effect on the world economy. However, economists arenowhere near able to form a consensus about the degree ofthis negative impact.
The argument that oil spikes inevitably lead to a recessionhas been discredited. It is generally considered that theworld economy is less dependent on oil than in the 70s and80s, and that governments are more skilled at managing theeconomy.
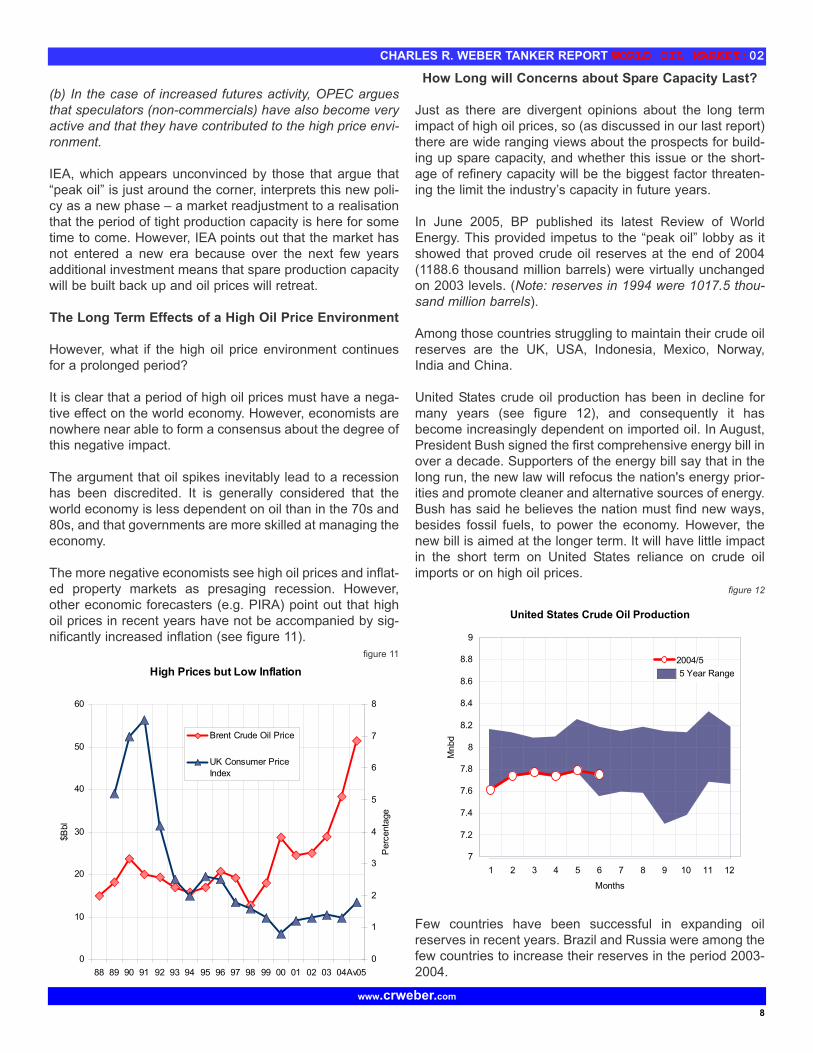
The more negative economists see high oil prices and inflat-ed property markets as presaging recession. However,other economic forecasters (e.g. PIRA) point out that highoil prices in recent years have not be accompanied by sig-nificantly increased inflation (see figure 11).
figure 11
How Long will Concerns about Spare Capacity Last?
Just as there are divergent opinions about the long termimpact of high oil prices, so (as discussed in our last report)there are wide ranging views about the prospects for build-ing up spare capacity, and whether this issue or the short-age of refinery capacity will be the biggest factor threaten-ing the limit the industry’s capacity in future years.
In June 2005, BP published its latest Review of WorldEnergy. This provided impetus to the “peak oil” lobby as itshowed that proved crude oil reserves at the end of 2004(1188.6 thousand million barrels) were virtually unchangedon 2003 levels. (Note: reserves in 1994 were 1017.5 thou-sand million barrels).
Among those countries struggling to maintain their crude oilreserves are the UK, USA, Indonesia, Mexico, Norway,India and China.
United States crude oil production has been in decline formany years (see figure 12), and consequently it hasbecome increasingly dependent on imported oil. In August,President Bush signed the first comprehensive energy bill inover a decade. Supporters of the energy bill say that in thelong run, the new law will refocus the nation's energy prior-ities and promote cleaner and alternative sources of energy.Bush has said he believes the nation must find new ways,besides fossil fuels, to power the economy. However, thenew bill is aimed at the longer term. It will have little impactin the short term on United States reliance on crude oilimports or on high oil prices.
figure 12
Few countries have been successful in expanding oilreserves in recent years. Brazil and Russia were among thefew countries to increase their reserves in the period 2003-2004.
8
CHARLES R. WEBER TANKER REPORT WORLD OIL MARKET:02
www.crweber.com
High Prices but Low Inflation
0
10
20
30
40
50
60
88 89 90 91 92 93 94 95 96 97 98 99 00 01 02 03 04Av05
$B
bl
0
1
2
3
4
5
6
7
8
Perc
enta
ge
Brent Crude Oil Price
UK Consumer Price
Index
United States Crude Oil Production
7
7.2
7.4
7.6
7.8
8
8.2
8.4
8.6
8.8
9
1 2 3 4 5 6 7 8 9 10 11 12
Months
Mnbd
2004/5
5 Year Range

In recent months, OPEC has been voluble in its claims forincreased investment in developing new production capaci-ty. It sees the lack of investment in refining capacity as themain capacity limiter for the oil industry in future years -pointing out that new production capacity is being addedmuch faster than refinery capacity. It welcomes a recentagreement by the G8 to develop measures to encouragethe development of new refinery capacity.
OPEC estimates that its production capacity will grow by3.5-4Mnbd between 2006-2010 (710Kbd to be added in2006), in addition to gains of 1.5Mnbd in OPEC NGLs andother liquids.
The IEA is similarly optimistic about the prospects for non-OPEC supply growth. It calculated that the upstream indus-try had been investing to meet 1-2% annual global demandgrowth, and that the market was thrown out of balance in2004 because world oil demand shot up by 3.6%. It esti-mates that new projects will generate 1-1.5Mnbd of incre-mental non-OPEC capacity through to 2009.
It also envisages that high oil prices may provide a boost toproduction capacity by pulling forward the start up date forsome fields and by encouraging operators to sustain maturefields in production beyond originally planned closure dates.High oil prices may also make projects previously thoughttoo costly viable.
IEA suggests that, in addition to investments that were inplace prior to the 2004 oil demand shock, producers areputting in extra funds to build production capacity. It pointsout that upstream spending surveys covering 2005 fromLehman Brothers and Citigroup show a sharp increase ver-sus equivalent studies undertaken at the end of 2004. Highrig utilisation also provides evidence of the increasedemphasis being placed on exploration. figure 13
The combined IEA and OPEC forecasts for incrementalcapacity gains total 1.7-2.2Mnbd per annum over the next 5years. This compares to crude oil demand forecast growthof 1.5-2.1Mnbd for the period 2005-2006. This suggests
that limited spare capacity will remain an issue for at
least the next five years. This finding is reflected in theEIA’s assessment that spare capacity, which fell from5.5Mnbd in 2002 to less than 2Mnbd in 2003, will remainclose to 1Mnbd in 2005 and 2006.
9
CHARLES R. WEBER TANKER REPORT WORLD OIL MARKET:02
www.crweber.com
World Rig Count
1500
1700
1900
2100
2300
2500
2700
1 2 3 4 5 6 7 8 9 10 11 12
Months
Num
ber
of
Rig
s
2004/5
2003/4
2002/3

Tanker Market Performance in 1Q05
Tanker Earnings tumble in 2Q05
Figure 14 shows that crude oil prices continued theirupward progress in 2Q05, while tanker earnings performedpoorly. Average VLCC spot earnings were around$30,000pd at the start of August compared to a peak of$220,000pd in November 2004, while crude oil prices founda new record level at the start of August breaking throughthe $65bbl barrier.
This disconnection between crude oil prices and tankerearnings during 1H05 over turns a long term positive corre-lation between the two time series. Dry bulk rates also per-formed poorly in 2Q05. However, in contrast to the tankermarket, figure 15 shows that the positive correlationbetween dry bulk rates and steel prices has remained intactwith both sliding considerably in the last quarter.
figure 14 figure 15
The divergence between tanker rates and crude oil priceslooks dramatic and unusual. As discussed in our last report,it is necessary to review the reasons why the relationshipbetween tanker earnings and crude oil prices has been bro-ken.
In section 1, it was shown that the current high crude oilprice environment is not primarily the product of artificialfactors, rather real structural weaknesses within the crudeoil market (exposed by the 2004 crude oil demand surge):
(1) the lack of spare crude oil production capacity
(2) the lack of spare refining capacity
However, psychological factors undoubtedly also have apart to play in underpinning prices with uncertainty over thereal impact of non-commercials in the futures market, andhyper anxiety over the smallest supply disruptions
The fact that crude oil prices are high primarily because offears about security of supply rather than high demandexplains why tanker earnings have not followed crude oilprices up. However, this does not explain why tanker earn-ings have fallen so sharply.
Following the Usual Seasonal Pattern
Figure 16 shows that tanker earnings in 2Q05 paralleledclosely that path of earnings at the start of each of the lasttwo years.
figure 16
10
CHARLES R. WEBER TANKER REPORT TANKER MARKET PERFORMANCE:03
www.crweber.com
Disconnected - Low Tanker Earnings
v High Crude Oil Prices Breaks
0
50,000
100,000
150,000
200,000
250,000
Jan-02 Jan-03 Jan-04 Jan-05
$day
20
25
30
35
40
45
50
55
60
65
$B
bl
VLCC Average Spot
Earnings
West Texas
Intermediate
Connected - Capesize Spot Rates
follow World Steel Prices Down
220
270
320
370
420
470
520
570
620
670
720
Jan-02 Jan-03 Jan-04 Jan-05
$T
onne
4
9
14
19
24
29
34
39
$T
onne
Hot Rolled Coil
Transaction Price (Av.
EU, Asia, USA)
Source: MEPS
Tubarao-
Beilun/Baoshan
150KDwct
Tanker Earnings Following a Seasonal Pattern?
0
50,000
100,000
150,000
200,000
250,000
1 2 3 4 5 6 7 8 9 10 11 12
Months
$day
2005
2004
2003

figure 17
This established earnings trend coincides with normal sea-sonal second quarter demand weakness as illustrated byOECD Europe crude oil demand (figure 17).
Other Factors that explain the weakness of tanker
earnings during 2Q05
(1) Continued Strong Fleet Expansion, +1.8% in 1Q05
Figure 18 shows that the pace of tanker fleet expansion (up+6.1% in 2004) was unabated at the start of the year with anet increase of 5.06MnDwt (+1.8%) during 1Q05. Thisincrease built on the net increase of 7.8MnDwt (+2.4%) dur-ing 1Q05.
Although tanker deliveries were lower in 2Q05 compared1Q05, scrapping was also down to just over 1MnDwt from1.5MnDwt. figure 18
(2) High Bunker Prices
As discussed in our last report, high bunker prices are con-tinuing to undermine tanker earnings. Figure 20 shows thepositive correlation between bunker prices and crude oilprices.
figure 19
figure 20
Independent Tanker Investors Keeping a Low Profile in
2Q05 as State Oil Companies Move In
While independent tanker owners have been keeping a lowprofile throughout 1H05, state oil companies have enteredthe market. National Iranian Tanker Co has been the biggestmover with orders for 7 VLCCs and 3 Suezmaxes atHyundai, 3 VLCCs at Daewoo, and most recently (August)3 VLCCs at Samsung. It is anticipated that Vela and KOTCmay also announce multiple orders soon.
11
CHARLES R. WEBER TANKER REPORT TANKER MARKET PERFORMANCE:03
www.crweber.com
Bunkers Dent Tanker Earnings at the Start of 2005
0
50,000
100,000
150,000
200,000
250,000
Jan-02 Jan-03 Jan-04 Jan-05$day
100
120
140
160
180
200
220
240
260
280
300
$T
on
VLCC Average Spot
Earnings
Bunkers Singapore
380 cst
Bunkers Catch up Oil Price Gains
100
120
140
160
180
200
220
240
260
280
300
Jan-02 Jan-03 Jan-04 Jan-05
$T
on
20
25
30
35
40
45
50
55
60
65
$B
bl
Bunkers Singapore
380 cst
West Texas
Intermediate
OECD Europe Crude Oil Demand
14
14.5
15
15.5
16
16.5
1 2 3 4 5 6 7 8 9 10 11 12
Months
Mnbd
2004/5
5 Year Range
Tanker Fleet Expands by 1.8% in 2Q05
-1
-1
0
1
1
2
2
3
3
4
4
7 8 9 10 11 12 1 2 3 4 5 6
MnD
wt
315
320
325
330
335
340
345
350
MnD
wt
Deliveries Deletions Fleet

In an era when tanker newbuilding prices are at record lev-els, independent tanker owners are in no position to com-pete for orders with Middle Eastern state oil companiesemboldened by the profits accrued from selling oil at recordprices, and not put off by weak tanker earnings or the longdelivery times for newbuildings. For example the earliestdelivery date for a VLCC is 3Q08.
Despite the increased ordering activity by oil companies, therate of tanker ordering is still much lower than in 2004 (seefigure 21). If current levels are sustained at current levels,total orders for 2005 will reach 25MnDwt which is 12MnDwtdown on 2004 ordering.
figure 21
Tanker secondhand sales were very buoyant up untilNovember 2004 when sales activity peaked at 6.3MnDwt.However, with 5 year vessels close to the price of newbuildsby the end of the 2004, investor secondhand activity hastailed off considerably – averaging 2MnDwt per month forthe period December 2004 to June 2005.
The next section looks at the prospects for tanker earningsfor the remainder of 2005.
Prospects for Tanker Earnings
This section provides a short term and a long term forecastfor tanker earnings
-Short term Tanker Freight Rate Forecast (2H05)
Summary: China has so far had a much less dramaticimpact on the tanker market than in 2004 with crude oilimports up just 4% yoy – compared to full year growth of35% in 2004. However, some commentators believe thatChinese crude oil imports will strengthen during 2H05. Thiswill give a boost to tanker demand. Increased Chineseimports in 2H05 will also act as an accelerator by boostingtonmile demand, which reflects the fact that most tradesserving China are long haul.
The market will also be underpinned in 2H05 by solidgrowth in overall world crude oil demand – estimated byleading forecasters to be in the range +1.9% and +2.5%.Although this growth is well below that achieved in 2004(IEA, +3.6%), it is still well above the average for the period2000-2003 (IEA, +1.2%).
With China’s lower profile (so far this year) and lower crudeoil demand growth, it is expected that tanker earnings willnot match the levels seen in 2004.
The prospect of further strong fleet growth will also act as adrag on tanker earnings prospects in 2H05. It is anticipatedthat full year fleet growth will reach 6.1% in 2005, which fol-lows on from growth of 6.2% in 2004.
However, the tightness in the crude oil market created
by limited spare production capacity and limited spare
refinery capacity mean that - during the period of rising
seasonal demand in 4Q05 - there is the opportunity for
tanker rate spikes towards the end of the year in the
event of any crude oil supply dislocations or even a late
crude oil demand surge from China.
The following section expands on the theories behind theshort term tanker forecast.
Tanker share prices still holding up
As with our last report, the review of the prospects of tankerearnings includes taking a look at the performance of tankershipping share prices during 2Q05, as it is considered thatshare price movements provide an alternative perspectiveon the future strength/weakness of tanker earnings toextrapolating earnings trends or looking at seasonal earn-ings cycles.
Figure 22 - which plots Baltic Dirty Tanker Index against theOverseas Shipholding Group share price – reveals that
12
CHARLES R. WEBER TANKER REPORT TANKER EARNINGS:04
www.crweber.com
Investor Activity Fitful 2Q05
0
1
2
3
4
5
6
7
8
9
10
7 8 9 10 11 12 1 2 3 4 5 6
Mn
Dw
t
Orders Sales
70
80
90
100
110
120
130
140
$M
illio
n
VLCC NB Price VLCC 5Yr Price

tanker stocks continue to be unaffected by the prolongedperiod of depressed freight rates or even reduced tankercompany earnings in 2Q05 as revealed in figure 23. In facttanker stocks have followed very closely the trajectory ofcrude oil prices (and are also in line with general stock mar-ket indices such as Dow Jones).
figure 22
figure 23
The continued positive correlation between tanker stocksand crude oil prices indicates that crude oil prices are beinginterpreted by the stock market as the fundamental driverfor this shipping sector i.e. the fortunes of tanker shippingare tied to the fortunes of the oil market.
The consensus amongst economists is that (notwithstand-ing the onset of recession) the high crude oil price environ-ment is here to stay for some time. Therefore, it can beassumed that those investing in tanker stocks believe thattanker earnings in 1H05 have followed normal seasonal pat-terns and expect earnings to correct upwards in the secondhalf of the year with the onset of increased seasonaldemand.
Further strong tanker fleet growth threatens tanker
earnings in 2H05
However, as discussed in sections 1 and 2, although tankerearnings have typically tracked crude oil prices (see figure24), tanker earnings and crude oil prices have become dis-connected during 1H05 as a result of specific factors.Therefore, although tanker earnings will receive a seasonalboost during 2H05, it cannot be necessarily assumed thattanker earnings will return to the high levels of last year.
The most significant factor likely to depress tanker earningsin 2H05 is continued strong fleet growth. It is estimated thatfleet growth in 2005 will total 6.1%, which follows on fromfleet growth of 4.2% and 6.2% in 2003 and 2004 respec-tively.
The expansion of the tanker fleet has been such that a lead-ing supplier of tanker fleet information reported in Augustthat “after 27 years the tanker fleet has at last passed theDecember 1977 peak and today we have, officially, thebiggest tanker fleet ever”.
Figure 24 shows that in most – but not all – years, tankerrates have followed crude oil prices.
figure 24
13
CHARLES R. WEBER TANKER REPORT TANKER EARNINGS:04
www.crweber.com
Tanker Earnings v Crude Oil Price
0
10,000
20,000
30,000
40,000
50,000
60,000
1976 1980 1984 1988 1992 1996 2000 2004
$D
ay
10
15
20
25
30
35
40
45
$B
bl
1 Yr TC 250KDw t
1 Yr TC 280KDw t
US Refinery Acquisition Costs
Tanker Investors Unperturbed by Low Tanker
Earnings 1H05
500
1000
1500
2000
2500
3000
3500
09/05/2003 16/04/2004 24/03/2005
Index
15
25
35
45
55
65
75
$S
hare
BDTI
Overseas Shipholding
Group
Tanker Company Earnings Slide 2Q05
0.0
50.0
100.0
150.0
200.0
250.0
300.0
$M
illio
n
Teekay 189.0 98.5 245.3 224.6 279.0 104.6
OMI 56.4 30.3 50.5 108.5 75.8 47.1
OSG 76.2 45.4 68.5 211.1 164.9
General 78.3 41.6 54.6 140.5 68.5 32.1
1Q04 2Q04 3Q04 4Q04 1Q05 2Q05

Crude oil demand growth will help underpin tanker
earnings in 2H05
The threat posed by fleet expansion will be offset in part bycrude oil demand growth. However, forecast crude oildemand growth in 2005 (range +1.9% to +2.5%) is lowerthan growth in 2004 (IEA, +3.6%). However, it is very impor-tant to remember that 2004 was an exceptional year andthat growth forecasts for 2005 are well above the averagefor the period 2000-2003 (IEA, +1.2%).
Nevertheless, crude oil demand growth can not be expect-ed to exert as positive an influence on tanker earnings aslast year, especially as there has been no Chinese wild cardplayed so far this year.
More than half way through the year and with Chinesecrude oil imports up just 4% yoy – compared to full yeargrowth of 35% and 31% in 2004 and 2003 respectively – theprospect of a third consecutive year of surgingChinese demand is receding.
Long haul trade growth in 2005 will have less
impact as an accelerator for tanker demand in
2005
It has been an accepted fact in tanker shipping formore than thirty years that the Middle East with its rel-atively large crude oil reserves will eventually domi-nate world tanker seaborne trade. Middle Eastseaborne trade routes are generally longer than forother export regions.
Tonmile demand is a truer reflection of tanker demandthan simply using crude oil demand. It takes intoaccount the distance traveled to deliver each tonne ofcrude oil. Obviously, long haul trades will generate ahigher tonmile demand than short trades for the sameamount of cargo delivered. Therefore, long haul tradesrequire more vessels than short haul trades for thesame amount of cargo delivered.
The importance of long haul crude oil trades has also beenboosted by the preference for sweet/light crudes such asthose from West Africa and the North Sea. (Heavy/sourcrudes include certain grades from Saudi Arabia, Venezuelaand Mexico). figure 25
In 2004, China and the United States were responsible foraround 50% of the total increase in world crude oil demand.The Middle East was the major source of this extra demand,benefiting from problems with Nigerian and Venezuelan pro-duction coupled with declining North Sea production. Thedependence on the Middle East for incremental crude oildemand acted as an accelerator for tanker demand in 2004.
In 2005, China and the United States have so far played amuch less significant part in growing tanker tonmiledemand. The United States has been particularly disap-pointing with almost no growth in crude oil imports yoy, whileChinese growth (4% yoy) has also been relatively modest –although some commentators expect a much stronger sec-ond half to the year for China.
The tables below (figures 26 and 27) break down the distri-bution of Chinese and United States crude oil imports byexporting country.
figure 26
China crude oil imports are dominated by long haul tradesfrom the Middle East (and also West Africa). Exports fromOman and Angola, the second and third largest exporters toChina, increased by 76% and 60% respectively in 2004(based on full year data).
Based on crude oil imports for 1H05, Chinese crude oilimports are forecast just 3% higher yoy, following two suc-cessive years of 30%+ growth. However, not all trades havesuffered. Trade with Saudi Arabia, the largest exporter toChina, is projected to grow by 25% in 2005, while Iran(another long haul trade) is projected to grow by 16%.
14
CHARLES R. WEBER TANKER REPORT FREIGHT RATES:05
www.crweber.com
Estimated Annual World Oil Demand Growth 2000-2005Source: IEA (July 2005)Figures Million barrels per dayRegions 00-99 01-00 02-01 03-02 04-03 05-04 06-05
Forecast Forecast
North America 0.26 -0.06 0.10 0.47 0.83 0.26 0.33Latin America 0.00 0.00 -0.04 -0.10 0.19 0.10 0.11FSU 0.08 0.00 -0.20 0.12 0.15 0.04 0.05Europe -0.12 0.21 0.00 0.20 0.15 0.04 0.01OECD Pacific -0.04 -0.07 -0.04 0.14 -0.18 0.11 0.06China 0.26 0.12 0.30 0.55 0.86 0.36 0.49Other Asia 0.09 0.18 0.27 0.22 0.47 0.28 0.27
Subtotal Asia 0.31 0.23 0.53 0.91 1.15 0.75 0.82Middle East 0.12 0.17 0.17 0.20 0.33 0.30 0.31Africa 0.00 0.13 0.08 0.04 0.07 0.09 0.09
0.00 0.00 0.00 0.00 0.00 0.00 0.00World 0.66 0.67 0.63 1.84 2.89 1.58 1.75
China Crude Oil Imports 1995 - June 2005Source: Global Trade Information Services
Figures in Million TonnesExporter Voyage
Duration
Units 1995 1996 1997 1998 1999 2000 2001 2002 2003 2004 e05
Saudi Arabia Long Haul MnTons 0.34 0.23 0.50 1.81 2.50 5.73 8.78 11.39 15.18 17.24 21.56
% Chg -32% 117% 262% 38% 129% 53% 30% 33% 14% 25%Oman Long Haul MnTons 3.65 5.65 9.03 5.67 5.02 15.60 8.14 8.05 9.28 16.35 11.80
% Chg 55% 60% -37% -11% 211% -48% -1% 15% 76% -28%Angola Long Haul MnTons 1.00 1.66 3.84 1.10 2.88 8.64 3.80 5.71 10.10 16.21 17.41
% Chg 66% 131% -71% 160% 200% -56% 50% 77% 60% 7%Iran Long Haul MnTons 0.93 2.31 2.76 3.62 3.95 7.00 10.85 10.63 12.39 13.24 15.34
% Chg 148% 19% 31% 9% 77% 55% -2% 17% 7% 16%Russia Short Haul/ MnTons 0.04 0.32 0.48 0.14 0.57 1.48 1.77 3.03 5.25 10.78 11.76
Overland % Chg 773% 49% -70% 296% 158% 20% 72% 73% 105% 9%Sudan Long Haul MnTons 0.00 0.00 0.27 3.31 4.97 6.43 6.26 5.77 6.88
% Chg 50% 29% -3% -8% 19%Vietnam Medium Haul MnTons 0.76 1.01 1.50 0.87 1.51 3.16 3.36 3.54 3.51 5.35 3.42
% Chg 32% 49% -42% 75% 109% 6% 5% -1% 53% -36%Yemen Long Haul MnTons 2.47 3.77 4.06 3.75 4.13 3.61 2.29 2.26 7.00 4.91 6.64
% Chg 52% 8% -8% 10% -13% -37% -1% 209% -30% 35%Congo Long Haul MnTons 0.03 0.13 0.98 0.38 0.38 1.45 0.64 1.05 3.39 4.77 5.16
% Chg 390% 681% -61% 1% 278% -56% 63% 224% 41% 8%Equatorial GuineaLong Haul MnTons 0.20 0.24 0.81 0.92 2.15 1.78 1.46 3.48 3.29
% Chg 19% 234% 13% 134% -17% -18% 139% -5%Indonesia Medium Haul MnTons 5.28 6.30 6.59 3.42 3.95 4.58 2.65 3.24 3.33 3.43 4.55
% Chg 19% 5% -48% 16% 16% -42% 22% 3% 3% 33%Norway Long Haul MnTons 0.99 0.49 2.01 1.48 0.92 2.11 0.93 2.01 0.44
% Chg -50% 310% -26% -38% 130% -56% 116% -78%Other MnTons 2.59 1.25 4.56 5.31 8.63 13.19 9.95 10.20 13.05 19.27 18.84
% Chg -52% 266% 17% 62% 53% -25% 2% 28% 48% -2%Total MnTons 17.09 22.62 35.47 26.80 36.61 70.13 60.26 69.41 91.13 122.82 127.10
% Chg 32% 57% -24% 37% 92% -14% 15% 31% 35% 3%

In contrast to China, US crude oil imports are not sodependent on long haul trades. Near neighbors - Canada,Venezuela and Mexico – were the top three exporters to theUS last year.
figure 27
Saudi Arabia was the largest exporter to the US in 2003, butwas only 4th largest in 2004. Its exports fell by 13% in 2004(based on full year data), and are projected to beunchanged in 2005 (based on 1Q05 data)
Other long haul trades to the US havealso suffered during 1Q05. Importsfrom Iraq and Kuwait, which were up50% and 13% respectively in 2004,are projected to fall by 23% and 25%respectively in 2005. .
Long term Tanker Supply/Demand
Balance Forecast 2005-2010
Figure 28 compares world crude oildemand and tanker supply (fleet>=10,000Dwt) for the period 2000-2004 and then projects forward forthe period 2005-2010.
There are two crude oil demand
forecasts: The “low” case is basedon annual average growth of 1.3%,which corresponds to the averagehistorical growth rate 1998-2003. The“high” case is based on the IEA forecast (July 2005) of 1.9%for 2005, and 2.1% for 2006. For the remaining period 2007-
2010, we assume an annual average growth rate of 2.3%,which is 0.5% higher than the average growth rate for thelast 10 years. (The growth rate has fallen below 1.3% onthree occasions in the last 10 years – in 1998 (0.5%), 2001
(0.9%), and 2002 (0.8%)).
There are also two tanker supply forecasts: The“high” case reflects deletions based on IMO’s phase-out schedule, and orders based on scheduled order-book deliveries for 2005-7 and for 2008-10 deliveriesbased on estimated annual average deliveries for theperiod 2002-7 (a boom period for tanker deliveries).The “average” case reflects a 20% increase on IMO’sphase-out schedule, and deliveries based on sched-uled orderbook deliveries for 2005-7 (as for “high”case) and for 2008-10 deliveries based on 2001 orders(the low point for deliveries in the period 2000-7).
Our forecast position is unchanged in that under boththe “high” and “average” supply cases there will beenough tonnage overall to match/exceed the“low”/”high” demand scenarios until 2009. However, in2010 the sharp acceleration in removals under IMOphase-out schedules will create a potential shortfall oftanker tonnage (1).
It should be noted that the forecast methodology is a rela-tively simplistic approach to supply/demand balancing. Forexample in the case of measuring tanker supply, there is noallowance for changing trade patterns which impacts on theaverage transportation distance of a barrel of crude oil
(measured in seaborne tonne-miles). This is an importantconsideration when calculating how far tonnage supply will
15
CHARLES R. WEBER TANKER REPORT FREIGHT RATES:05
www.crweber.com
World Crude Oil Demand v Tanker Supply
History 2000-4 & Forecast 2005-10
280
300
320
340
360
380
400
420
440
00 01 02 03 04 e05 e06 e07 e08 e09 e10
Mill
ion
De
ad
we
igh
t
75
77
79
81
83
85
87
89
91
93
95
Mn
bd
Tanker Supply - High Case
Tanker Supply - Average Case
World Oil Demand (Forecast
Growth av 2.2% p.a.)
World Oil Demand (Forecast
Growth av 1.3% p.a.)
United States Crude Oil Imports 1995 - March 2005Source: Global Trade Information Services
Figures in Million BarrelsExporter Voyage
Duration
Units 1995 1996 1997 1998 1999 2000 2001 2002 2003 2004 e05
Canada Short Haul/ MnBbls 379 396 425 461 424 501 na 521 551 581 554
Overland % Chg 4% 7% 8% -8% 18% 6% 5% -5%Venezuela Short Haul MnBbls 425 454 513 522 461 500 na 511 506 577 633
% Chg 7% 13% 2% -12% 8% -1% 14% 10%Mexico Short Haul/ MnBbls 346 337 484 469 448 473 na 537 568 567 553
Overland % Chg -3% 44% -3% -5% 6% 6% 0% -3%Saudi Arabia Long Haul MnBbls 474 407 482 507 490 507 na 544 633 552 554
% Chg -14% 18% 5% -4% 4% 16% -13% 0%Nigeria Medium Haul MnBbls 264 269 304 287 231 343 na 221 317 393 392
% Chg 2% 13% -6% -20% 49% 44% 24% 0%Iraq Long Haul MnBbls 17 108 263 232 na 174 165 247 189
% Chg 532% 143% -12% -5% 50% -23%Algeria Medium Haul MnBbls 9 6 12 7 7 0 na 54 98 123 100
% Chg -33% 106% -45% 8% -100% 80% 26% -19%Angola Medium Haul MnBbls 130 129 142 172 141 121 na 127 143 117 157
% Chg -1% 10% 21% -18% -15% 12% -18% 34%United Kingdom Medium Haul MnBbls 141 93 72 70 100 107 na 151 150 99 90
% Chg -34% -23% -3% 43% 8% -1% -34% -9%Norway Medium Haul MnBbls 91 105 99 84 111 117 na 146 89 92 69
% Chg 15% -6% -15% 33% 5% -39% 3% -25%Kuwait Long Haul MnBbls 81 87 109 113 84 101 na 82 77 87 65
% Chg 8% 25% 4% -26% 20% -7% 13% -25%Ecuador Short Haul MnBbls 45 37 37 33 31 40 na 41 51 85 111
% Chg -18% 0% -9% -8% 29% 24% 66% 31%Other MnBbls 319 345 382 424 434 358 na 399 414 409 443
% Chg 8% 11% 11% 2% -17% 4% -1% 8%Total MnBbls 2704 2665 3077 3258 3224 3399 na 3508 3761 3929 3911
% Chg -1% 15% 6% -1% 5% 7% 4% 0%
figure 28
stretch i.e. effective supply.
It is also remains the case that the tanker market is in apotentially perilous position. Today the tanker orderbook isequivalent to 24% of the tanker trading fleet. Under the“average” and “high” supply cases, the fleet is set to
expand at between 4.4% and 6.0% p.a. over the next 5
years (2005-9), which is revised up from 4.2% and 5.8%respectively in April 2005, and 3.9% and 5.5% respectivelyin January 2005. This compares to average demand
growth of 2.2% p.a. under the “high” demand case.
Notwithstanding, the growing importance of long haul
trades (2), the tanker market will be extremely vulnera-
ble to demand fluctuations during this period. For exam-ple, a continuing concern is that China will not sustain itsphenomenal growth rates of the last few years.
Therefore, strong crude oil demand growth of 2%+ p.a.
and a further significant shift towards long haul trades
are the key factors in ensuring consistently strong
tanker rates for 2005-10.
If “effective” demand (taking into account tanker tonmiles)falters, it is unlikely that the supply curve will follow eitherthat shown in the “high” or “average” supply cases. It is per-haps more likely that supply will follow a third way or “low”case. With little scope to halt fleet growth through a slowdown in orders (the orderbooks are virtually full up to theend of 2007), it is the rump of tanker single hull (as well asdouble side and double bottom) tonnage that will comeunder pressure to scrap even more rapidly than in the “aver-age” supply case (20% higher than the IMO scrapping rulesdemand) in order to slow down the rate of tanker supplyexpansion.
(1) The majority of tanker single hull tonnage will not befinally phased out until 2010, and even then the ContinuousAssessment Scheme (CAS) affords a further extension tothe trading life of these vessels. However, as discussed, iftanker rates come under significant downward pressure,this rump may exit the market earlier than the 2010 cut off –especially with the extremely high level of scrap values andopportunities for larger tankers to find alternative employ-ment as storage or FPSO vessels. It is not yet clear howmany tanker owners have so far embarked on putting theirvessels through CAS, although it is probably only a handful.
(2) As discussed the impact of a shift towards long haultrades was crucial to the strength of the tanker market in2004. World crude oil demand of 3.6% was effectivelyboosted by the growth of long haul trades, so that demandmore than offset the burden of 6.2% tanker fleet growth.The growing importance of long haul trades will continue inthe short and long term. For example, the rapid economicrise of China will continue to foster long haul trades fromregions like West Africa, the Black Sea and even the North
Sea, while the decline of North Sea production (down to6.1Mnbd in 2004 compared to 6.8Mnbd in 2000) willincrease the reliance on Middle East production. The pref-erence for sweet/light crudes also has a positive impact ontanker tonmile demand.
16
CHARLES R. WEBER TANKER REPORT FREIGHT RATES:05
www.crweber.com

A Review of the Tanker Market in 1H05 by
Vessel Sector
In order to help highlight the key developments in each ves-sel segment, a system of rankings has been put together(figure 29) to reflect the development of key performanceindicators in 2005. Amongst other things, these rankingsshow which segment has attracted the most investment sofar in 2005, and which has grown fastest.
The Rankings 1H05
(all figures as % of relevant sector trading fleet)
figure 29
The above table shows that the Panamax sector remainsthe most popular sector with investors. The equivalent of7.8% of the Panamax fleet was contracted during 1H05,which has maintained the orderbook at a level equivalent tomore than 50% of the trading fleet.
By contrast the Suezmax sector has received very littleinterest from investors at the start of the year with ordersequivalent to just 1.5% of the Suezmax fleet.
The Panamax sector has the highest delivery percentagefor 1H05 (9.5%) and – despite also recording the highestpercentage of deletions (2.6%) – is also the fastest growingsector (+7.1%).
The ranking table for 2004 is included here for to allow com-parisons to be made with 2005.
The Rankings 2004
(all figures as % of relevant sector trading fleet)
figure 30
Sector Reports From the Weber Trading Floor
VLCC Sector
Moving into the fourth quarter, the VLCC sector anticipatesits’ annual rate strengthening, as cold weather consumptionin the northern hemisphere plays out its' usual supply-demand effect.
Increased demand to meet the winter market requirementsputs additional pressure on already balanced tonnage posi-tions. Seasonal eastbound winter cover charters, while notas abundant as last year (note the diminished Chinesedemand), still puts increased ton miles into the market, andin turn greater demand on charterers to cover this need. Tocomplicate matters, the serious domestic supply disruptionsin the USG following hurricanes Katrina and Rita, while yetto be fully understood in terms of actual lost production andrepair schedules, will undoubtedly put further demand onlong haul transportation.
As of this writing, tonnage chartered prior to Rita’s arrival inthe Gulf was still being juggled and moved about in an effortto get offloaded, thinning the available tonnage pool further.This loss of domestic oil and gas production has jump start-ed the fourth quarter, where we have already seen rate lev-els in the West Africa/USG trade leap from a fairly steadyWS 90 market to a fairly hyped-up WS 145 market.
Last years rate levels at this time were averaging in the WS190's for the WAFR/USG market, soon to jump to WS 242.5for Q4. In the AG, Eastern trades averaged WS 170 with anincrease to WS 240 for the Q4 while the AG/West marketaveraged WS 127.5, soon to improve to WS 173 for Q4.Owners are aware that this year the jump off point in all mar-kets lags well behind last years set-up (currently WS 145 forWAFR/USG, WS 100 AG/East and WS 90 AG/West), but itcould be argued that last years "China" could this year be"Katrina-Rita". Certainly owner confidence is seasonallyoptimistic, and even if rates this Q4 don't quite reach Q42004, owners have an eye to making a good run at them.
Suezmax Sector
A forward view for the 4th quarter of 2005 shows promise forSuezmax owners. With the net lost USG production (bal-anced by needed refinery repairs) not returning anytimesoon we would expect rates to remain firm for the next fewmonths.
The usual seasonal effect of weather delays in the NorthAtlantic combined with limited daylight transits in and out ofthe Black Sea will help to gobble up ton miles from a mar-ket that is already thinly balanced.
17
CHARLES R. WEBER TANKER REPORT VESSEL SECTORS:06
www.crweber.com
Delivries% Scrap% Orders% Sales% Obook% Growth%
VLCC 3.7 0.0 5.1 3.0 19.6 3.5
Suezmax 5.4 0.6 1.5 4.4 20.2 4.0
Aframax 5.5 1.8 3.3 4.1 24.4 4.0
Panamax 9.5 2.6 7.8 3.4 52.5 7.1
Handy 4.0 0.8 7.1 3.4 26.4 3.2
Total 4.7 0.8 4.8 3.6 24.2 3.9
Delivries% Scrap% Orders% Sales% Obook% Growth%
VLCC 7.1 1.2 8.9 12.9 19.3 6.3
Suezmax 8.2 5.5 8.2 6.8 25.1 5.5
Aframax 8.7 4.0 12.6 8.3 27.0 4.9
Panamax 13.9 5.6 26.5 5.1 55.4 9.0
Handy 10.8 2.8 14.3 4.9 26.9 8.7
Total 8.7 2.6 11.7 9.1 25.5 6.5

We have seen the recent emergence of long haul Med bar-rels from Algeria/Libya and the Black Sea trying to satisfythe U.S. appetite for crude. This combined with an increasein the Atlantic to US West Coast trade and large exportsfrom Brazil and imports into Chile have added to the longhaul freight train.
Owners have fond memories of last year’s market, wherepositive sentiment ruled the day and rates moved dramati-cally higher in the last few months of the year. The questionis can we duplicate last year’s lofty levels? There certainlyis more upside potential than downside risk. The only cloudson the near horizon are the VLCC’s who have and will con-tinue to act as a brake on rising Suezmax rates, with tradersco-freighting in order to capture the large deltas betweenthe classes.
The new additions to the Suezmax fleet have all beenabsorbed as longer trades take center stage and ton milesget stretched.
Time charter interest for Suezmax’s has been tame as own-ers expectations have put their ideas well above the willing-ness of charterers to commit for term. Time will tell who wasthe wiser.
Aframax Sector
Making accurate fourth quarter projections after the marketachieved new highs as a direct result of the Katrina and Ritahurricanes could make you either a prophet or a gambler.That being said, let’s be prophetic.
Without exception the Aframax markets should trade withinnarrower World Scale floor and ceiling bands than theyhave in the first half of the year. While possibly not main-taining the present strong levels for the remainder of theyear, as we move into 2006 we will look back at a firm 2005for Afras.
While the Caribbean market may be stealing all the thunderwith its lofty World Scale rates, a quick glance at the gath-ering strength of the Med and the UKC markets points to afar less segmented global Aframax market and to the real-ization that all Afra markets are now inextricably linked.
Panamax Sector
As cold weather approaches, the 4th quarter looks hot. Weenter the 4th quarter on the heels of a rising market sparkedby the relentless pounding of the USG by Katrina and Rita.As a result of the reduction in production capacity, end userswill be forced to look overseas to meet expected demand.The increase in ton miles combined with the seasonal
delays usually associated with the onset of winter shouldadd fuel to the existing fire.
Owners have become increasingly bullish as they recall thesimilarities between the current market conditions and thoseof 4th quarter of 2004.Much of the same underlying factors which held the marketup in 04 are again present in 05. As a direct result of thesefactors owners are reluctant to pursue time-charters. Withcharterers offering as much as low 30's for 1 year withoutenticing any takers, one can easily imagine owners expec-tations of the next few months.
It takes more than expectations to make a market, howevera quick glance around at the fundamentals should beenough to convince even the most bearish that there maybe some reason to expect another strong 4th quarter.
Product Sector
As we move into the fourth quarter of 2005, we look back ona year of remarkable volatility in the product sectors. As endusers worked hard during most of the year to continue build-ing up domestic inventories in spite of strong oil pricing,there was some mid-year concern over fourth quarter freightrates. However, with Hurricanes Katrina and Rita nowbehind us, it seems safe to predict that the year will finish offwith quite a bit of strength.
Extensive delays quickly developed on the USAC and theUSG as significant volumes of clean product were fixedfrom Europe, or diverted from other load areas into the USGulf. The uncertainty of these positions added fuel to thefire by further reducing tonnage availability, as owners wereunwilling to work with uncertain itineraries, which at timesseemed to change on more than a daily basis. While delaysseem to be working themselves out at this point, currentconditions continue to be conducive to more long haul voy-ages.
With a number of US Gulf refineries expected to remainclosed for repairs for some time to come, it is clear that theonly alternative sources will be from overseas. We haveseen continued strong activity in the MR sector from Europeand the Far East into the States, including an increase inFar East/USG voyages. In fact, according to our fixturedatabase, during the period August 29 (the first post-Hurricane Katrina fixing day this year) through September 30, the number of Cont/States MR fixtures in 2005 is fullydouble that of the same period in 2004. As of October 5,2005, the American Petroleum Institute reported that some20% of U.S. refining capacity remained shut-down, or atleast still in the process of being restarted, and the EnergyInformation Administration reported on October 5th, that theprevious week, ending September 30th, had seen record
18
CHARLES R. WEBER TANKER REPORT VESSEL SECTORS:06
www.crweber.com

gasoline imports, averaging over 1.4m bbls/day. In thesame report, the EIA reported that gasoline inventories hadfallen by 4.3 million bbls from the prior week, and distillateinventories had fallen by 5.6 million bbls during that period.This weeks EIA report is expected to see a similar draw oninventories.
With such conditions hovering over the clean market, it isanticipated that demand for product vessels will continue tobe robust, certainly for the balance of the year. Even ifdomestic demand for refined product continues to declinedue to continued pressure from recent high pricing, theshortfall in output from domestic refineries will require addi-tional importing for quite a while, until all of the refineries areback up and running. The increased ton-miles resultingfrom sourcing product in Europe and the Far East willincrease pressure on tonnage availability during this period,and should therefore keep rates strong through the entirefourth quarter.
Charles R. Weber Company, Inc. is one of the oldest andlargest ship brokerage firms in the United States.Established in 1940, the company is an independent full-service shipbroker and marine consultant.
Based in Greenwich, Connecticut, Charles R. Weber offersa broad range of maritime brokerage and consulting servic-es to international marine, trading and financial clientsworldwide.
From tanker voyage charter, bare boat, and time charter tosale and purchase of all vessel types and marine projects inthe tanker, off shore and specialist sectors of the market.
Charles R. Weber with their broad and diverse global part-nerships are able to develop marine projects, whatever theirsize or complexity, from concept to completion, providingtheir clients with over fifty years of maritime experience andexpertise in all sectors of the marine industry.
After reading our tanker report, If you would like further informationor bespoke market analysis we would be happy to discuss yourneeds. Please feel free to contact us:
E-mail: [email protected]
Voice: (1) 203-629-2300 Facsimile: (1) 203-629-9101 Telex: 179100 WEBTANK CT
Or contact us by mail:
Marine Projects Charles R. Weber Company Inc. Greenwich Office Park One Greenwich, Connecticut 06831 United States of America
19
CHARLES R. WEBER TANKER REPORT VESSEL SECTORS:06
www.crweber.com